in this issue: breakout score strategy trend …feb+2016/files...in this issue welcome to the...
TRANSCRIPT
Breakout Score Strategy
Trend Capture Strategy
In this issue:
Issue 14, February 2016

Ready to expand your TradeStation horizons with EasyLanguage ®? Creating your own indicators and strategies will give you
new perspectives on markets and on your trading.TradeStation’s Client Training and Education Department has taught thousands of traders how to use EasyLanguage and would like to count you among them. We can guide you through all the steps in creating indicators, ShowMe™ and PaintBar™ studies and trading strategies. And if you’re thinking “but I’m not a programmer,” well, most of the thousands of people we’ve taught weren’t programmers either. But, like you, they were passionate about markets and willing to spend a few hours working with us to learn.
You’ll be surprised by how quickly you can get up to speed and begin writing your own indicators and trading strategies in EasyLanguage, and how this will open up a whole new world of market analysis.
Beginners CourseFor the EasyLanguage beginner, the same course work can be accessed LiveOnTheWeb and in a self-paced home study course.
EasyLanguage Boot CampA two-day LiveOnTheWeb class
$249 SCC Member Price: $124.50Register with promo code ELBC4SCC
Your instructor will guide you step by step through more than 30 practical exercises covering such topics as creating indicators, ShowMes™, PaintBars™, and trading strategies, including indicators designed specifically for use with TradeStation’s RadarScreen® feature. You will learn how to:
• Use inputs for flexibility and optimization• Design indicators specifically for RadarScreen• Create real-time alerts based on your custom market conditions• Write market, limit and stop orders into strategies• Incorporate money-management exits in your strategies
Exclusive webcast bonus:• Ask questions and interact with your instructor in real time• Review the recordings of the course at any time• Retake the LiveOnTheWeb class any time it is offered
Advanced Users CourseFor advanced users, step up to the latest in EasyLanguage by incorporating objects in your studies and strategies. Here, too, the same course work can be accessed LiveOnTheWeb and in a self-paced home study course.
Implementing Objects in EasyLanguageA two-day LiveOnTheWeb class
$249 SCC Member Price: $124.50Register with promo code IOEL4SCC
In this course, your instructor will guide you through exercises using the latest in EasyLanguage features, including price series providers, timers and accounts providers. These open up possibilities beyond the already formidable capabilities of conventional EasyLanguage. In this advanced course, you’ll learn how to:
• Create multi-data analysis in RadarScreen• Access real-time account and position updates• Place and track real-world orders• Read and write to Excel files• Build your own interactive windows
Exclusive webcast bonus:• Ask questions and interact with your instructor in real time• Review the recordings of the course at any time• Retake the LiveOnTheweb class any time it is offeredEasyLanguage Home Study Course
A self-paced home-study book
$99 SCC Member Price: $49.50Complete and return the order form
This book covers the same range of material as the EasyLanguage Boot Camp, in an easy-to-follow format that takes you through each exercise in the course, with instructions and explanations. The book is printed in vibrant color and is spiral bound, making it easy to work through each exercise right on your computer.
EasyLanguage Objects Home Study CourseA self-paced home-study book
$99 SCC Member Price: $49.50Complete and return the order form
This book covers the same range of material as the Implementing Objects in EasyLanguage web class, in an easy-to-follow format that takes you through each exercise in the course, with instructions and explanations. The book is printed in vibrant color and is spiral bound, making it easy to work through each exercise right on your computer.
DOWNLOAD FILES
STRATEGY CONCEPTS CLUB | 1
ContentsIssue 14
Trend Capture Strategy . . . . . . . . . . . . . . . . . . . . . . . . . . . .9This is a straightforward trend-following strategy using moving averages and price channels with a trade-size formula based on both equity risk and volatility. It also highlights the results when the strategy is applied to a portfolio of ETFs using TradeStation’s Portfolio Maestro.
Breakout Score Strategy . . . . . . . . . . . . . . . . . . . . . . . . . . .2This takes a different approach to using a simple price channel for trend following. Instead of chasing the channel breakouts, it keeps a running score of the number of bullish and bearish breakouts in the recent period.
IN THIS ISSUE
Welcome to the February 2016 issue of TradeStation Labs’ Strategy Concepts Club.
Featured this month is the Breakout Score strategy. It takes a different approach to using a simple price channel for trend following. Instead of chasing the channel breakouts, which often results in a very high percentage of time in the market, this strategy keeps a running score of the number of bullish and bearish breakouts in the recent period. The score is then used to generate both entry and exit signals and reduce the excessive time in the market that is common with trend-following systems.
The second feature is the Trend Capture strategy from Frederic Palmliden, CFA, CMT, and Senior Quantitative Analyst. This strategy and article take a step beyond what you’ve seen in these pages in the past. Fred has composed a straightforward trend-following strategy using moving averages and price channels. But to this he added a trade-size formula based on both equity risk and volatility. What’s more, Fred highlights the results when the strategy is applied to a portfolio of ETFs using TradeStation’s Portfolio Maestro. In fact, the file for Portfolio Maestro is included with the usual downloads and can be imported directly into Portfolio Maestro on your computer.
Also inside this issue you’ll find a reprint of Utility Kit 1, which is this quarter’s bonus feature. It contains several EasyLanguage® techniques that may help in developing and testing strategies.
Don’t forget that any back issues that pique your interest but predate your subscription can be purchased from our Back Issues page. (In case you didn’t notice or are a new subscriber, the pdf of this issue can be accessed from the download button at the lower left of the flipbook viewer.)
As always, read on and thanks for being a subscriber!
Stanley Dash, CMT
All support, education and training services and materials on the
TradeStation website are for informational purposes and to help cus-
tomers learn more about how to use the power of TradeStation soft-
ware and services. No type of trading or investment advice is being
made, given or in any manner provided by any TradeStation affiliate.
This material may also discuss in detail how TradeStation is
designed to help you develop, test and implement trading strate-
gies. However, TradeStation does not provide or suggest trading
strategies. We offer you unique tools to help you design your own
strategies and look at how they could have performed in the past.
While we believe this is very valuable information, we caution you that simulated past performance of a trading strategy is no guarantee of its future performance or success. We also do
not recommend or solicit the purchase or sale of any particular
securities or derivative products. Any symbols referenced are used
only for the purposes of the demonstration, as an example—not a
recommendation.
Finally, this material may discuss automated electronic order place-
ment and execution. Please note that even though TradeStation
has been designed to automate your trading strategies and deliver
timely order placement, routing and execution, these things, as well
as access to the system itself, may at times be delayed or even fail
due to market volatility, quote delays, system and software errors,
Internet traffic, outages and other factors.
TradeStation Group, Inc. Affiliates: All proprietary technology in
TradeStation is owned by TradeStation Technologies, Inc. Equities,
equities options, and commodity futures products and services are
offered by TradeStation Securities, Inc. (Member NYSE, FINRA, NFA
and SIPC). TradeStation Securities, Inc.’s SIPC coverage is available
only for equities and equities options accounts. Forex products and
services are offered by TradeStation Forex, a division of IBFX, Inc.
(Member NFA).
Copyright © 2001-2016 TradeStation Group, Inc.
TradeStation Labs8050 SW 10th Street, Suite 2000Plantation, FL [email protected]
STAFF
PUBLISHERMichael BurkeVP, Client Training and Education
EDITORStanley Dash, CMTVP, Applied Technical Analysis
SENIOR CONTRIBUTING EDITORFrederic Palmliden, CFA, CMTSenior Quantitative Analyst
PRODUCTIONKristina HuntMedia Content Coordinator
EDITOR’S MESSAGE
Breakout ScoreStrategyStanley Dash, CMTVP, Applied Technical Analysis
Featuresu Strategy Style: Trend-following
u Markets: Equities, futures, forex
u Trading Horizon: Position trading
Studies/Files Includedu Strategy
u Indicator
u Workspace
DOWNLOAD FILES
BACKGROUND
ONE OF THE FOUNDATIONAL methods that technicians use to identify trends and generate signals is a price channel. A price channel can be defined by the highest high and lowest low over the previous, say, 20 bars. Ordinarily, signals are generated whenever the channel is penetrated: long signals when the channel breakout is to the upside and the opposite for short signals. The TradeStation-supplied strategy components Price Channel LE and Price Channel SE may be used for a simple model along these lines.
The greatest strength of this approach is that it cannot miss a trend; the main weakness stems from the frequency of whipsaws in range-bound periods. In addition, a strategy built strictly on channel breakouts is liable to be an “always in” strategy, reversing positions at each new signal. This exacerbates the pain when the market is oscillating in a trading range.
The impact of these shortcomings can probably be mitigated with signal filters and exit rules, but there is little room for nuance in the simple price channel breakout method.
The TSL:Breakout Score strategy presented here uses a scoring system calculated from the number of times a channel is broken in each direction. The score is used to generate entry and exit signals. This affords an opportunity to minimize whipsaws. In addition, the Breakout Score is also used for exit signals at the extremes and on signs that the trend is flagging.
2 | STRATEGY CONCEPTS CLUB
STRATEGY CONCEPTS CLUB | 3
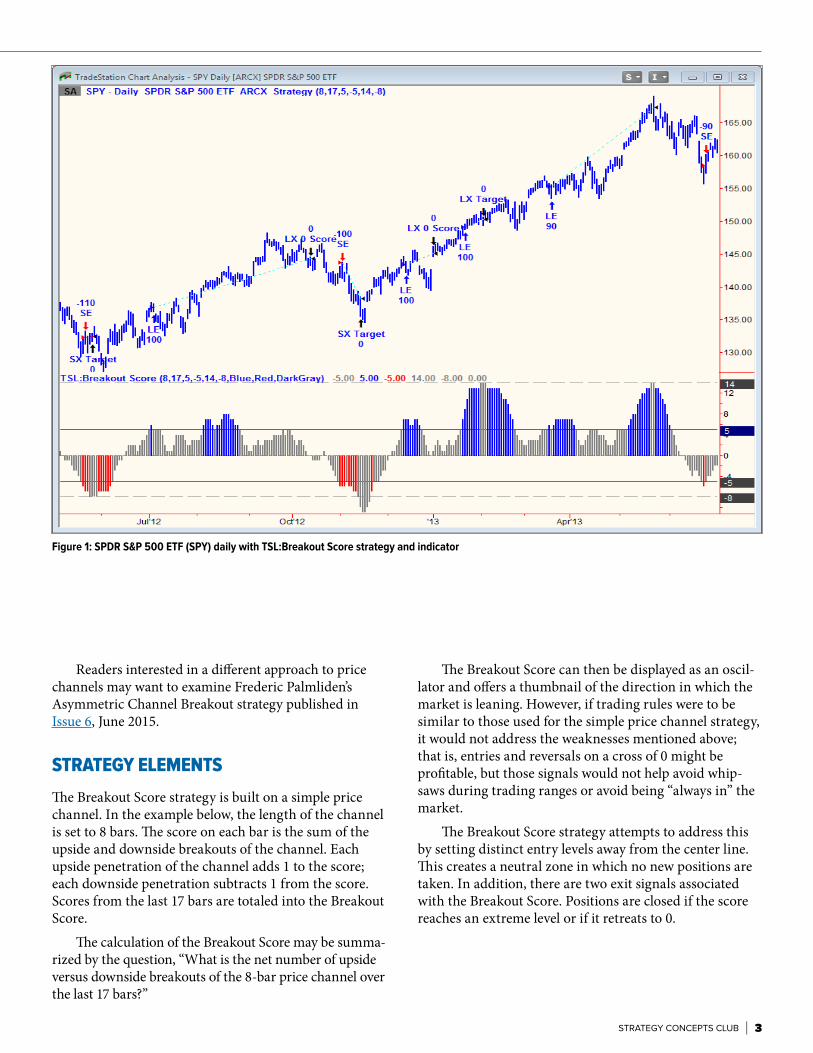
Figure 1: SPDR S&P 500 ETF (SPY) daily with TSL:Breakout Score strategy and indicator
Readers interested in a different approach to price channels may want to examine Frederic Palmliden’s Asymmetric Channel Breakout strategy published in Issue 6, June 2015.
STRATEGY ELEMENTS
The Breakout Score strategy is built on a simple price channel. In the example below, the length of the channel is set to 8 bars. The score on each bar is the sum of the upside and downside breakouts of the channel. Each upside penetration of the channel adds 1 to the score; each downside penetration subtracts 1 from the score. Scores from the last 17 bars are totaled into the Breakout Score.
The calculation of the Breakout Score may be summa-rized by the question, “What is the net number of upside versus downside breakouts of the 8-bar price channel over the last 17 bars?”
The Breakout Score can then be displayed as an oscil-lator and offers a thumbnail of the direction in which the market is leaning. However, if trading rules were to be similar to those used for the simple price channel strategy, it would not address the weaknesses mentioned above; that is, entries and reversals on a cross of 0 might be profitable, but those signals would not help avoid whip-saws during trading ranges or avoid being “always in” the market.
The Breakout Score strategy attempts to address this by setting distinct entry levels away from the center line. This creates a neutral zone in which no new positions are taken. In addition, there are two exit signals associated with the Breakout Score. Positions are closed if the score reaches an extreme level or if it retreats to 0.
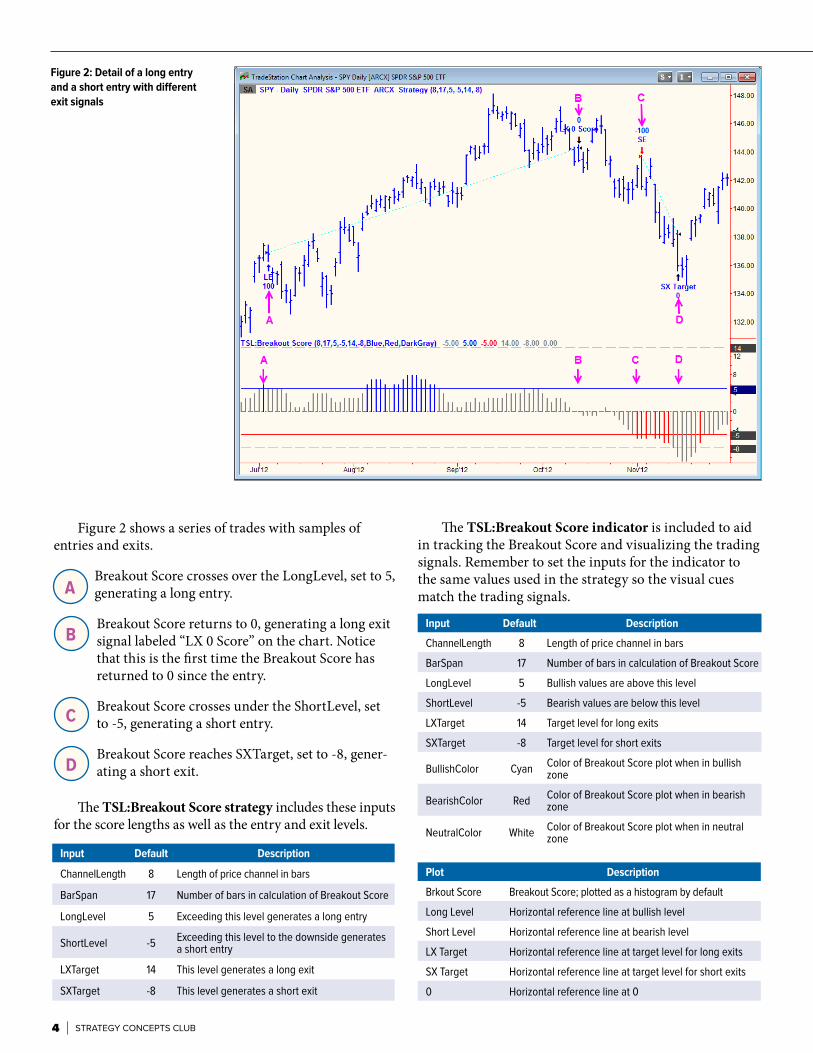
Figure 2 shows a series of trades with samples of entries and exits.
Breakout Score crosses over the LongLevel, set to 5, generating a long entry.
B Breakout Score returns to 0, generating a long exit
signal labeled “LX 0 Score” on the chart. Notice that this is the first time the Breakout Score has returned to 0 since the entry.
C Breakout Score crosses under the ShortLevel, set to -5, generating a short entry.
D Breakout Score reaches SXTarget, set to -8, gener-
ating a short exit.
The TSL:Breakout Score strategy includes these inputs for the score lengths as well as the entry and exit levels.
Input Default Description
ChannelLength 8 Length of price channel in bars
BarSpan 17 Number of bars in calculation of Breakout Score
LongLevel 5 Exceeding this level generates a long entry
ShortLevel -5 Exceeding this level to the downside generates a short entry
LXTarget 14 This level generates a long exit
SXTarget -8 This level generates a short exit
4 | STRATEGY CONCEPTS CLUB
Figure 2: Detail of a long entry and a short entry with different exit signals
The TSL:Breakout Score indicator is included to aid in tracking the Breakout Score and visualizing the trading signals. Remember to set the inputs for the indicator to the same values used in the strategy so the visual cues match the trading signals.
Input Default Description
ChannelLength 8 Length of price channel in bars
BarSpan 17 Number of bars in calculation of Breakout Score
LongLevel 5 Bullish values are above this level
ShortLevel -5 Bearish values are below this level
LXTarget 14 Target level for long exits
SXTarget -8 Target level for short exits
BullishColor Cyan Color of Breakout Score plot when in bullish zone
BearishColor Red Color of Breakout Score plot when in bearish zone
NeutralColor White Color of Breakout Score plot when in neutral zone
Plot Description
Brkout Score Breakout Score; plotted as a histogram by default
Long Level Horizontal reference line at bullish level
Short Level Horizontal reference line at bearish level
LX Target Horizontal reference line at target level for long exits
SX Target Horizontal reference line at target level for short exits
0 Horizontal reference line at 0
A
STRATEGY CONCEPTS CLUB | 5
STRATEGY RULES
The Breakout Score strategy has a single entry method and two exit methods. There are no money- or volatility-based stops built into the strategy or used in these tests. To be sure, prudence dictates including some type of emergency stop. Traders may want to add TradeStation-supplied strategies such as Stop Loss and Dollar Trailing to their charts.
Long Entries
u If the Breakout Score crosses over the LongLevel, then buy at the market on the open of the next bar.
Short Entries
u If the Breakout Score crosses under the ShortLevel, then sell short at the market on the open of the next bar.
Exits
u Close long positions if the Breakout Score reaches the LXTarget level or reverts back to 0.
u Close short positions if the Breakout Score reaches the SXTarget level or reverts back to 0.
STRATEGY PERFORMANCE REPORT HIGHLIGHTS
The Breakout Score strategy was applied to 10 years of daily data of the SPDR S&P 500 ETF (SPY). The inputs were set to the values as noted in the Strategy Elements section above. These were determined by a series of optimizations.
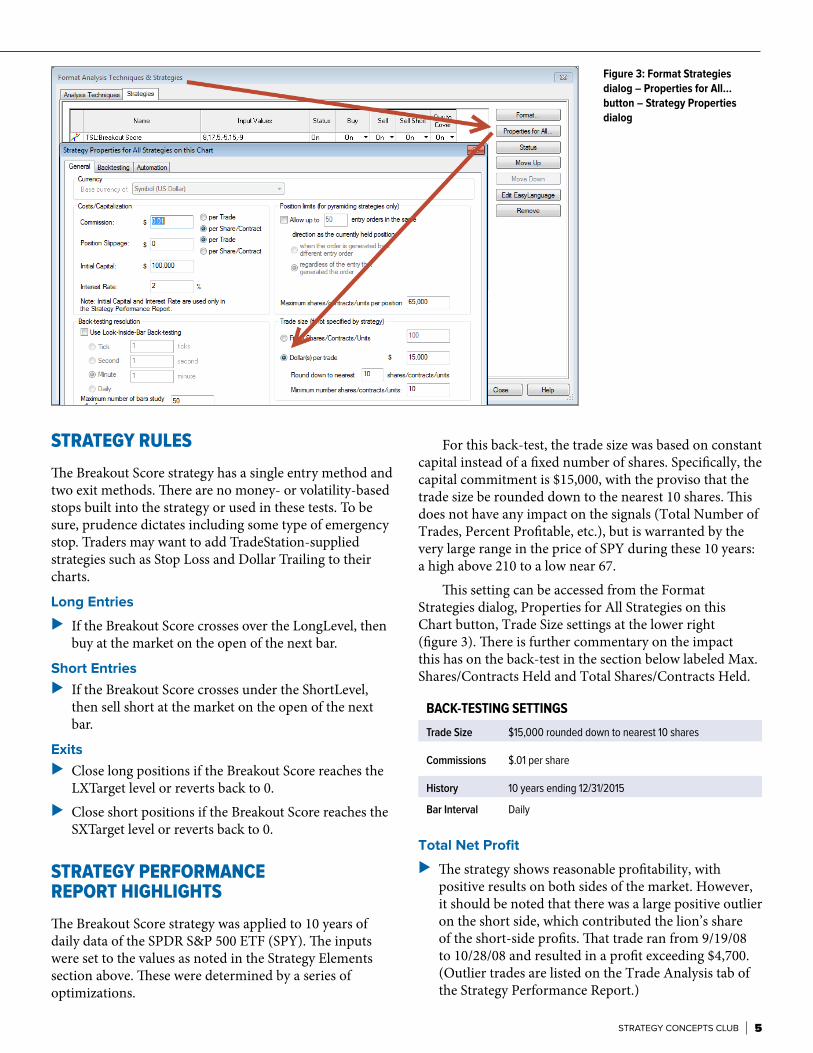
For this back-test, the trade size was based on constant capital instead of a fixed number of shares. Specifically, the capital commitment is $15,000, with the proviso that the trade size be rounded down to the nearest 10 shares. This does not have any impact on the signals (Total Number of Trades, Percent Profitable, etc.), but is warranted by the very large range in the price of SPY during these 10 years: a high above 210 to a low near 67.
This setting can be accessed from the Format Strategies dialog, Properties for All Strategies on this Chart button, Trade Size settings at the lower right (figure 3). There is further commentary on the impact this has on the back-test in the section below labeled Max. Shares/Contracts Held and Total Shares/Contracts Held.
Total Net Profit
u The strategy shows reasonable profitability, with positive results on both sides of the market. However, it should be noted that there was a large positive outlier on the short side, which contributed the lion’s share of the short-side profits. That trade ran from 9/19/08 to 10/28/08 and resulted in a profit exceeding $4,700. (Outlier trades are listed on the Trade Analysis tab of the Strategy Performance Report.)
Figure 3: Format Strategies dialog – Properties for All… button – Strategy Properties dialog
BACK-TESTING SETTINGS
Trade Size $15,000 rounded down to nearest 10 shares
Commissions $.01 per share
History 10 years ending 12/31/2015
Bar Interval Daily
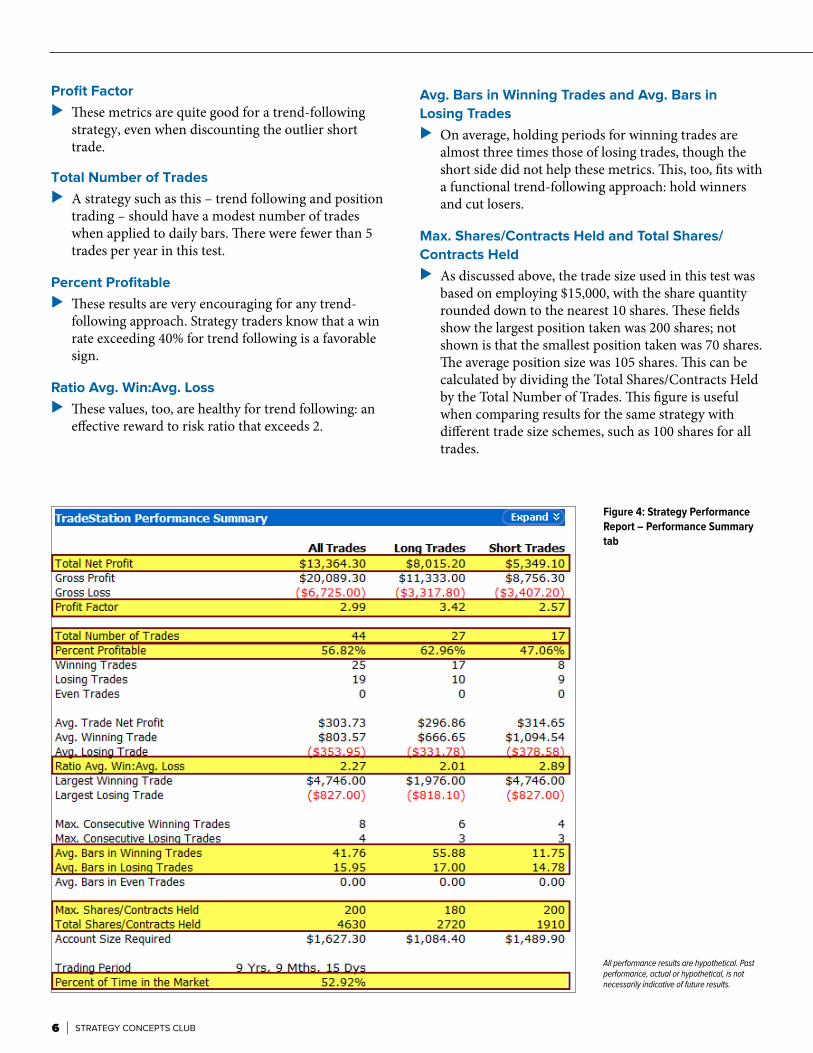
Profit Factor
u These metrics are quite good for a trend-following strategy, even when discounting the outlier short trade.
Total Number of Trades
u A strategy such as this – trend following and position trading – should have a modest number of trades when applied to daily bars. There were fewer than 5 trades per year in this test.
Percent Profitable
u These results are very encouraging for any trend-following approach. Strategy traders know that a win rate exceeding 40% for trend following is a favorable sign.
Ratio Avg. Win:Avg. Loss
u These values, too, are healthy for trend following: an effective reward to risk ratio that exceeds 2.
6 | STRATEGY CONCEPTS CLUB
All performance results are hypothetical. Past performance, actual or hypothetical, is not necessarily indicative of future results.
Figure 4: Strategy Performance Report – Performance Summary tab
Avg. Bars in Winning Trades and Avg. Bars in
Losing Trades
u On average, holding periods for winning trades are almost three times those of losing trades, though the short side did not help these metrics. This, too, fits with a functional trend-following approach: hold winners and cut losers.
Max. Shares/Contracts Held and Total Shares/
Contracts Held
u As discussed above, the trade size used in this test was based on employing $15,000, with the share quantity rounded down to the nearest 10 shares. These fields show the largest position taken was 200 shares; not shown is that the smallest position taken was 70 shares. The average position size was 105 shares. This can be calculated by dividing the Total Shares/Contracts Held by the Total Number of Trades. This figure is useful when comparing results for the same strategy with different trade size schemes, such as 100 shares for all trades.
STRATEGY CONCEPTS CLUB | 7
Percent of Time in the Market
u Trend-following strategies tend to be in the market a high percentage of the time. A very simple price channel strategy is likely to be in the market virtually 100% of the time. This is one of the weaknesses of such a strategy. Setting a neutral zone between long and short signals and having several exit methods is meant to mitigate this. At 53%, Percent of Time in the Market is very reasonable for a strategy like this.
SUGGESTIONS FOR IMPROVEMENT It is worth mentioning once again that there should be some type of emergency stop for this strategy. Nothing of the kind is included in this back-test or in the strategy as written. The TradeStation-supplied strategies Stop Loss and Dollar Trailing, or others, may be added to the chart with the Breakout Score strategy.
Stanley Dash, CMT is Vice-president, Applied Technical Analysis, at TradeStation. He and his group support active and institutional traders with analytical
tools and education designed to help them become more effective traders.
His Wall Street career began in 1975 and includes time as an active floor trader at one of the leading U.S. futures and options exchanges. Mr. Dash
has lectured for the New York Institute of Finance and the Institute for Financial Markets. He is also a Chartered Market Technician and a member of the
Market Technicians Association, where he serves on the Editorial Board of the Association’s Journal of Technical Analysis.
The strategy makes no provision for reentry in the same direction following an exit; that is, an LX Target or SX Target exit signal may occur mid-trend. If the Breakout Score does not retrace, then no new signal to reenter in the same direction would be generated.
On the other hand, while holding a position, the strategy can generate additional entry signals in the same direction. TradeStation’s default setting, applied here, is not to permit multiple entries. An aggressive trader may want to run back-tests allowing them, perhaps combined with changes to the trade size setting. (The setting for multiple entries can be seen in figure 3, just above the trade size setting.)
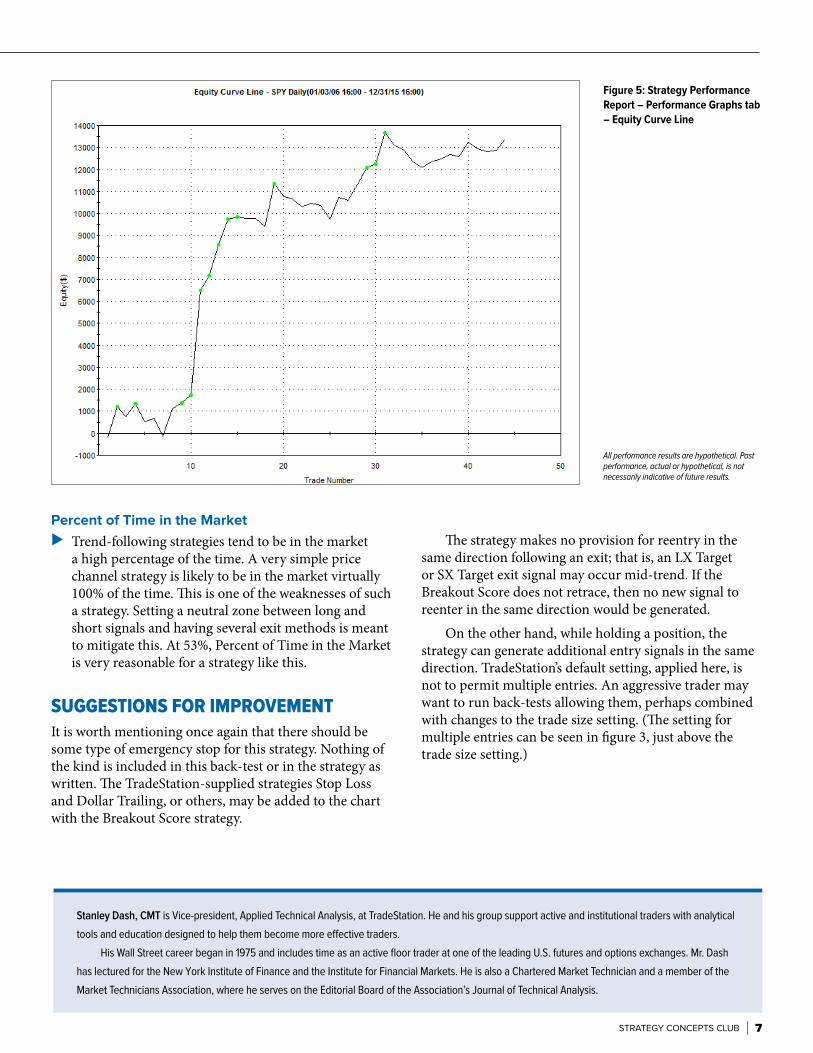
Figure 5: Strategy Performance Report – Performance Graphs tab – Equity Curve Line
All performance results are hypothetical. Past performance, actual or hypothetical, is not necessarily indicative of future results.
Visit TradeStation Labs in the TradingApp ® Store
Built by traders for traders, the TradingApp® Store gives TradeStation clients access to more ideas, strategies and custom trading solutions than ever before. TradeStation Labs is an active contributor to the TradingApp Store, with dozens of custom products available for download.
u Select and download any product instantly Products from TradeStation Labs in the TradingApp Store download directly to your TradeStation desktop platform in seconds – offering full compatibility and seamless integration.
u In-house support TradeStation Labs is a team of technical analysts who work side by side with the platform developers, bridging the possibilities of what can be done with TradeStation and what you need to realize those possibilities. All TradeStation Labs’ products are geared to helping you make the most of your TradeStation experience.
Forex Strength Score
With dozens of Forex pairs available to analyze and trade, the performance relationships among these pairs give us an opportunity to measure which currencies are performing relatively stronger or weaker compared to other currencies, and to find the pairings that best exploit these relative strengths and weaknesses.
The Forex Pair Performance Strength Score is a set of tools to measure and monitor these performance relationships, and to assign a strength score to each individual currency as well as each currency pair. This is done by examining the performance of each currency across all its pairs and then combining the scores of the two currencies in each pair.
TRADESTATION LABS’ FEATURED PRODUCT
LEARN MORE
Trend Capture StrategyFrederic Palmliden, CFA, CMTSenior Quantitative Analyst
BACKGROUND A COMMON TYPE OF TREND-FOLLOWING strategy within the Commodity Trading Advisor (CTA) space can be depicted by combining a two-moving-average cross system with a price channel. The two-moving-average cross system acts as a filter in order to take trades only in the direction of the prevailing trend, while the price channel is used to generate trading signals. An important aspect of this type of strategy (which is usually applied to a portfolio) has to do with money management, since position sizing across a portfolio will have a large impact on strategy performance. In this case, positions are based on total equity and are adjusted for volatility using the Average True Range (ATR).
The Trend Capture strategy utilizes these strategy elements and presents them first on a single security with a daily bar interval, along with a custom indicator to more easily track the strategy’s behavior. The strategy is then applied to a portfolio of 18 securities, using TradeStation’s Portfolio Maestro in order to diversify risk across major markets. While CTA strategies usually involve futures, the strategy in this article is applied to exchange traded funds (ETFs). The strategy performance on a portfolio level is outlined in detail below.
STRATEGY ELEMENTSThe Trend Capture has three main strategy elements:
u A two-moving-average cross system to determine the prevailing trend.
u A price channel to generate trading signals.
u A money management technique to determine the trade size.
Featuresu Strategy Style: Trend-following
u Markets: Equities, futures, forex
u Trading Horizon: Swing trading
Studies/Files Includedu Strategy
u Indicator
u Workspace
u Portfolio
DOWNLOAD FILES
The two-moving-average cross system consists of two exponential moving aver-ages. If the fast moving average is above the slow moving average, the prevailing trend is said to be bullish (bull mode). In a similar fashion, if the fast moving average is below the slow moving average, the prevailing trend is said to be bearish (bear mode). Long trades are taken only while in a bull mode, and short trades are taken only while in a bear mode.
The price channel is constructed by using the highest high for a specified look-back period to form a top band, and the lowest low for the same look-back period to form a low band. If the close crosses
STRATEGY CONCEPTS CLUB | 9
For long trades, positions are held until the low breaks the lowest low for a certain number of bars. Similarly, for short trades, positions are held until the high breaks the highest high for the same look-back period.
The money-management technique to determine the trade size is based on total equity and volatility. More spe-cifically, it is based on the average true range (ATR) of the security and is called Fixed Fractional with ATR Risk. The trade size is the rounded result of a ratio. The numerator is the percent risked multiplied by the sum of the initial equity, the closed profit/loss, and the open profit/loss. The denominator is the ATR multiplied by the ATR multiplier, multiplied by the big point value (e.g., $1 for SPY, and $50 for the ES Futures contract).
Fixed Fractional with ATR Risk = (Risk per Trade * Total Equity) / (ATR * ATR Multiplier * Big Point Value)
Additional information on money management can be found in the Analysis Concepts papers entitled Strategy Impact: Trade-Size Formulas. and Strategy Impact: Trade-Size Formulas, Part 2.
Input Default Description
Fast_EMA_Length 50 Look-back length for the fast exponential moving average.
Slow_EMA_Length 120 Look-back length for the slow exponential moving average.
Price_Ch_Length 80 Look-back length for the price channel.
Plot Description
FastEMA Fast exponential moving average.
SlowEMA Slow exponential moving average.
TopBand Price channel boundary for long entries.
LowBand Price channel boundary for short entries.
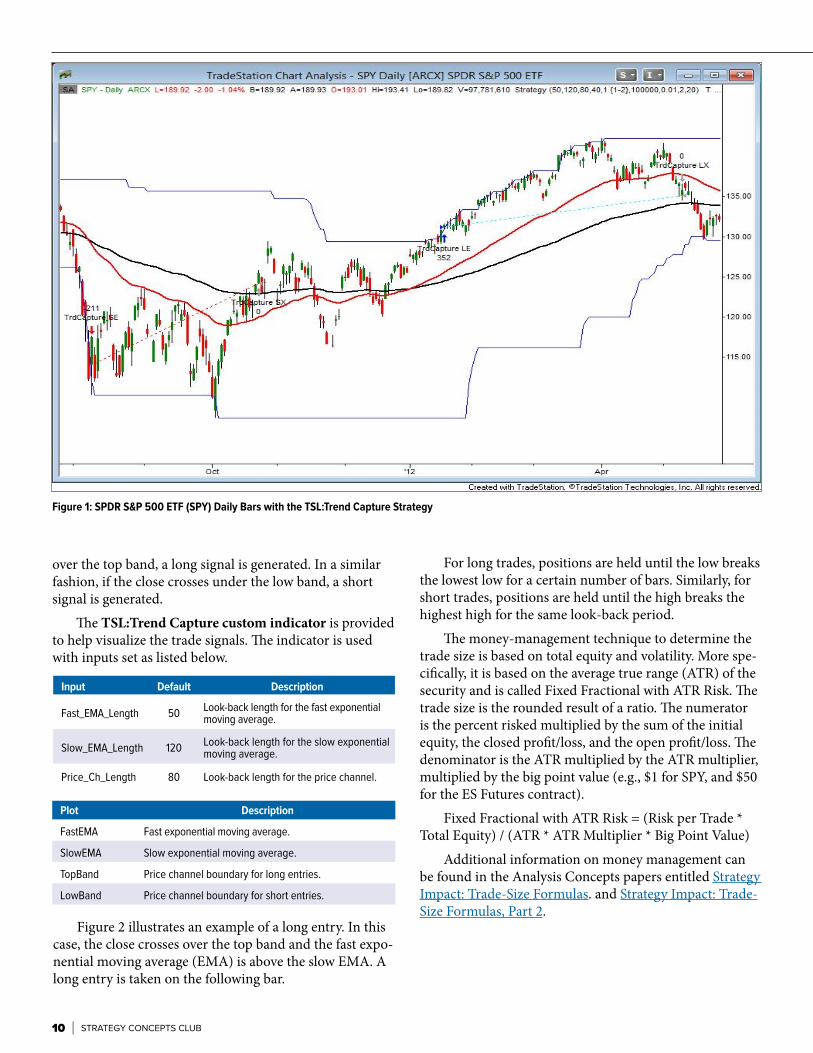
Figure 1: SPDR S&P 500 ETF (SPY) Daily Bars with the TSL:Trend Capture Strategy
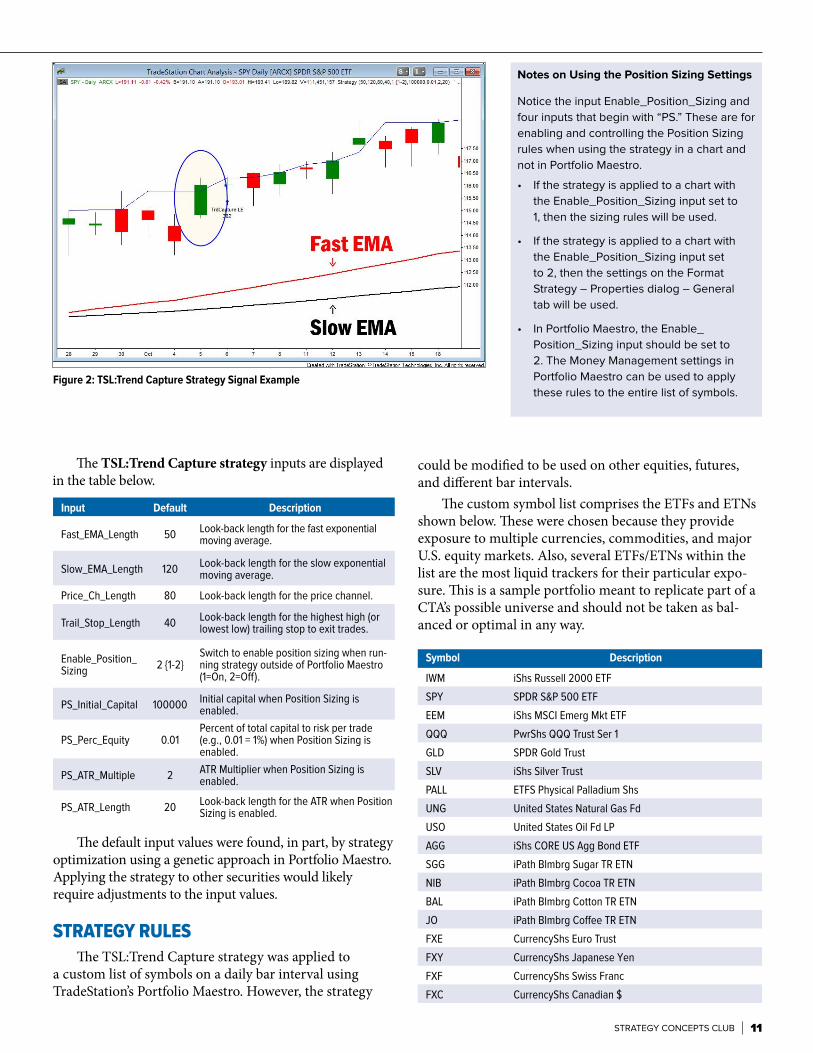
Figure 2 illustrates an example of a long entry. In this case, the close crosses over the top band and the fast expo-nential moving average (EMA) is above the slow EMA. A long entry is taken on the following bar.
over the top band, a long signal is generated. In a similar fashion, if the close crosses under the low band, a short signal is generated.
The TSL:Trend Capture custom indicator is provided to help visualize the trade signals. The indicator is used with inputs set as listed below.
10 | STRATEGY CONCEPTS CLUB
The TSL:Trend Capture strategy inputs are displayed in the table below.
Input Default Description
Fast_EMA_Length 50 Look-back length for the fast exponential moving average.
Slow_EMA_Length 120 Look-back length for the slow exponential moving average.
Price_Ch_Length 80 Look-back length for the price channel.
Trail_Stop_Length 40 Look-back length for the highest high (or lowest low) trailing stop to exit trades.
Enable_Position_Sizing 2 {1-2}
Switch to enable position sizing when run-ning strategy outside of Portfolio Maestro (1=On, 2=Off).
PS_Initial_Capital 100000 Initial capital when Position Sizing is enabled.
PS_Perc_Equity 0.01Percent of total capital to risk per trade (e.g., 0.01 = 1%) when Position Sizing is enabled.
PS_ATR_Multiple 2 ATR Multiplier when Position Sizing is enabled.
PS_ATR_Length 20 Look-back length for the ATR when Position Sizing is enabled.
STRATEGY CONCEPTS CLUB | 11
Figure 2: TSL:Trend Capture Strategy Signal Example
The default input values were found, in part, by strategy optimization using a genetic approach in Portfolio Maestro. Applying the strategy to other securities would likely require adjustments to the input values.
STRATEGY RULESThe TSL:Trend Capture strategy was applied to
a custom list of symbols on a daily bar interval using TradeStation’s Portfolio Maestro. However, the strategy
could be modified to be used on other equities, futures, and different bar intervals.
The custom symbol list comprises the ETFs and ETNs shown below. These were chosen because they provide exposure to multiple currencies, commodities, and major U.S. equity markets. Also, several ETFs/ETNs within the list are the most liquid trackers for their particular expo-sure. This is a sample portfolio meant to replicate part of a CTA’s possible universe and should not be taken as bal-anced or optimal in any way.
Symbol Description
IWM iShs Russell 2000 ETF
SPY SPDR S&P 500 ETF
EEM iShs MSCI Emerg Mkt ETF
QQQ PwrShs QQQ Trust Ser 1
GLD SPDR Gold Trust
SLV iShs Silver Trust
PALL ETFS Physical Palladium Shs
UNG United States Natural Gas Fd
USO United States Oil Fd LP
AGG iShs CORE US Agg Bond ETF
SGG iPath Blmbrg Sugar TR ETN
NIB iPath Blmbrg Cocoa TR ETN
BAL iPath Blmbrg Cotton TR ETN
JO iPath Blmbrg Coffee TR ETN
FXE CurrencyShs Euro Trust
FXY CurrencyShs Japanese Yen
FXF CurrencyShs Swiss Franc
FXC CurrencyShs Canadian $
Notes on Using the Position Sizing Settings
Notice the input Enable_Position_Sizing and
four inputs that begin with “PS.” These are for
enabling and controlling the Position Sizing
rules when using the strategy in a chart and
not in Portfolio Maestro.
• If the strategy is applied to a chart with
the Enable_Position_Sizing input set to
1, then the sizing rules will be used.
• If the strategy is applied to a chart with
the Enable_Position_Sizing input set
to 2, then the settings on the Format
Strategy – Properties dialog – General
tab will be used.
• In Portfolio Maestro, the Enable_
Position_Sizing input should be set to
2. The Money Management settings in
Portfolio Maestro can be used to apply
these rules to the entire list of symbols.
All performance results are hypothetical. Past performance, actual or hypothetical, is not necessarily indicative of future results.
The detailed strategy rules are listed below.
Long Entries
u If the close crosses over the TopBand line, and the 50-day exponential moving average is equal to or greater than the 120-day exponential moving average, buy on a market order on the next bar.
Short Entries
u If the close crosses under the LowBand line, and the 50-day exponential moving average is less than the 120-day exponential moving average, sell short on a market order on the next bar.
Exits
u Exit any long on a market order on the open of the next bar when the low is below the lowest low of the last 40 bars.
u Exit any short on a market order on the open of the next bar when the high is above the highest high of the last 40 bars.
STRATEGY PERFORMANCE REPORT HIGHLIGHTS
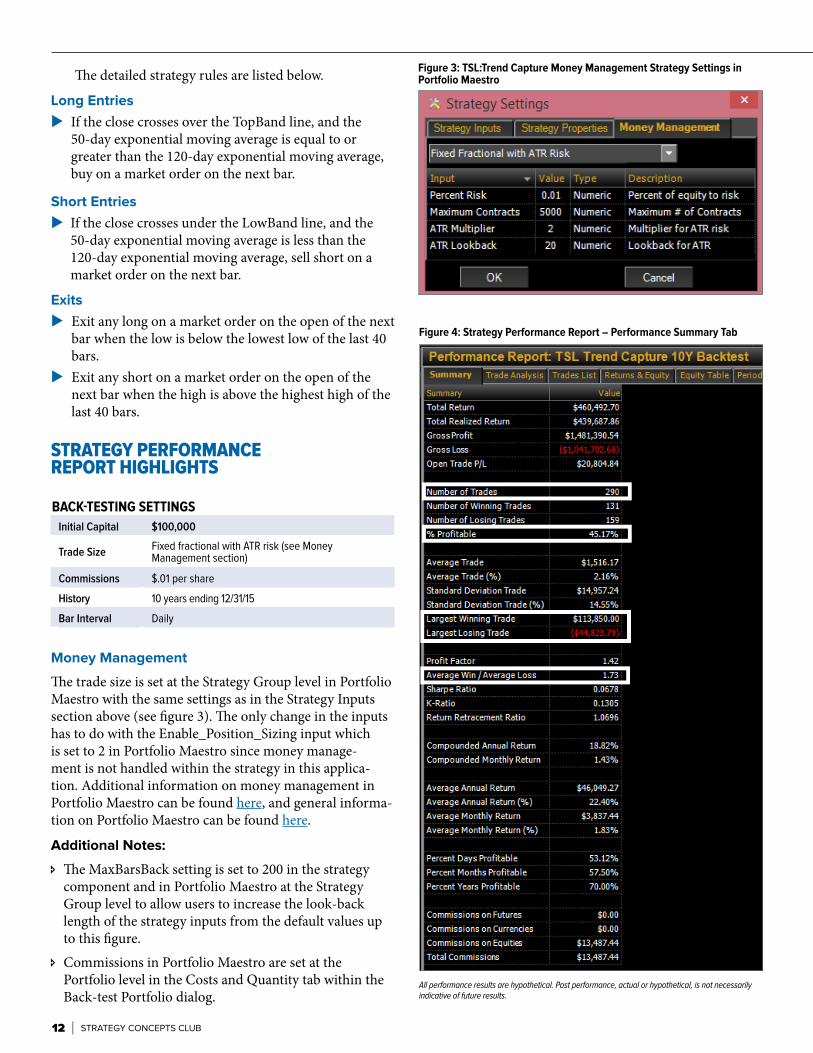
Money Management
The trade size is set at the Strategy Group level in Portfolio Maestro with the same settings as in the Strategy Inputs section above (see figure 3). The only change in the inputs has to do with the Enable_Position_Sizing input which is set to 2 in Portfolio Maestro since money manage-ment is not handled within the strategy in this applica-tion. Additional information on money management in Portfolio Maestro can be found here, and general informa-tion on Portfolio Maestro can be found here.
Additional Notes:
The MaxBarsBack setting is set to 200 in the strategy component and in Portfolio Maestro at the Strategy Group level to allow users to increase the look-back length of the strategy inputs from the default values up to this figure.
Commissions in Portfolio Maestro are set at the Portfolio level in the Costs and Quantity tab within the Back-test Portfolio dialog.
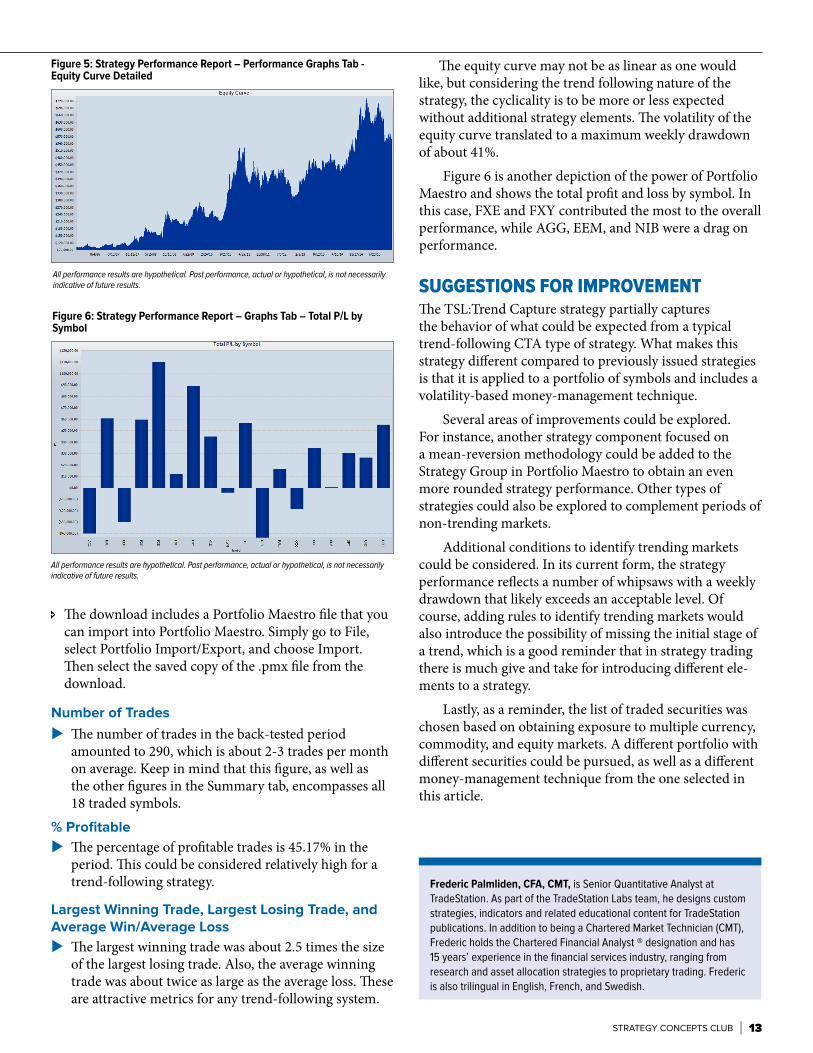
Figure 4: Strategy Performance Report – Performance Summary Tab
BACK-TESTING SETTINGSInitial Capital $100,000
Trade Size Fixed fractional with ATR risk (see Money Management section)
Commissions $.01 per share
History 10 years ending 12/31/15
Bar Interval Daily
Figure 3: TSL:Trend Capture Money Management Strategy Settings in Portfolio Maestro
12 | STRATEGY CONCEPTS CLUB
The download includes a Portfolio Maestro file that you can import into Portfolio Maestro. Simply go to File, select Portfolio Import/Export, and choose Import. Then select the saved copy of the .pmx file from the download.
Number of Trades
u The number of trades in the back-tested period amounted to 290, which is about 2-3 trades per month on average. Keep in mind that this figure, as well as the other figures in the Summary tab, encompasses all 18 traded symbols.
% Profitable
u The percentage of profitable trades is 45.17% in the period. This could be considered relatively high for a trend-following strategy.
Largest Winning Trade, Largest Losing Trade, and Average Win/Average Loss
u The largest winning trade was about 2.5 times the size of the largest losing trade. Also, the average winning trade was about twice as large as the average loss. These are attractive metrics for any trend-following system.
STRATEGY CONCEPTS CLUB | 13
Frederic Palmliden, CFA, CMT, is Senior Quantitative Analyst at TradeStation. As part of the TradeStation Labs team, he designs custom strategies, indicators and related educational content for TradeStation publications. In addition to being a Chartered Market Technician (CMT), Frederic holds the Chartered Financial Analyst ® designation and has 15 years’ experience in the financial services industry, ranging from research and asset allocation strategies to proprietary trading. Frederic is also trilingual in English, French, and Swedish.
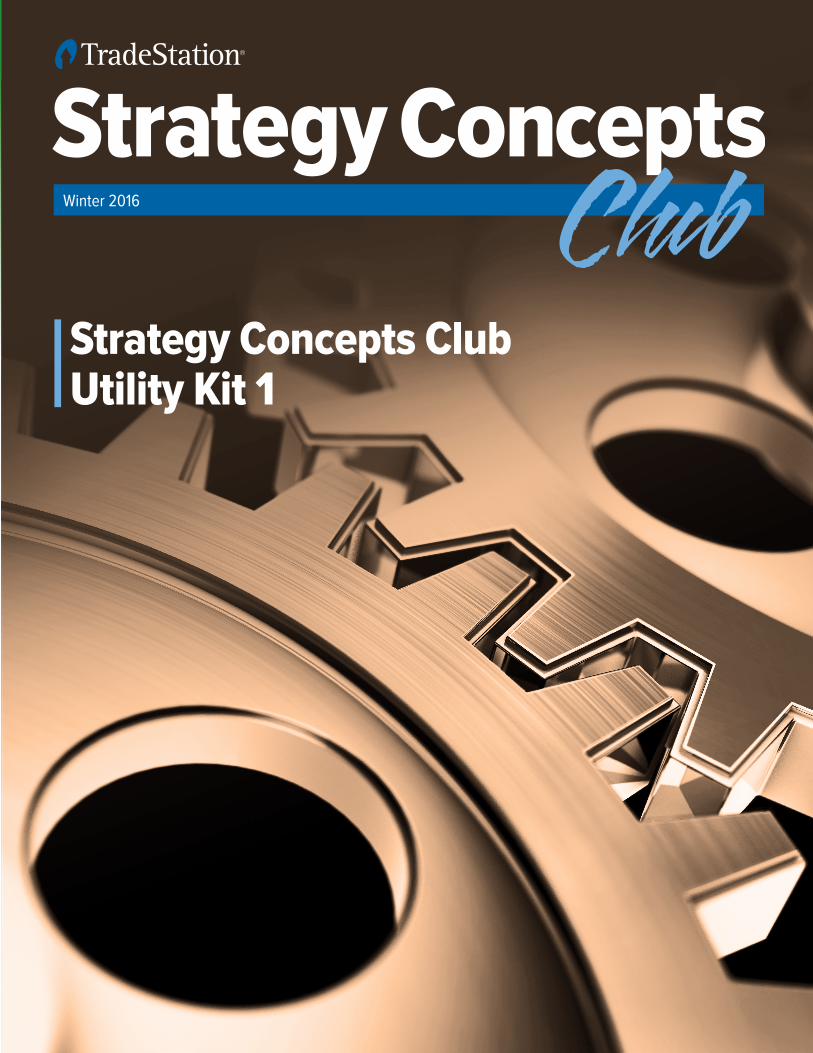
The equity curve may not be as linear as one would like, but considering the trend following nature of the strategy, the cyclicality is to be more or less expected without additional strategy elements. The volatility of the equity curve translated to a maximum weekly drawdown of about 41%.
Figure 6 is another depiction of the power of Portfolio Maestro and shows the total profit and loss by symbol. In this case, FXE and FXY contributed the most to the overall performance, while AGG, EEM, and NIB were a drag on performance.
SUGGESTIONS FOR IMPROVEMENTThe TSL:Trend Capture strategy partially captures the behavior of what could be expected from a typical trend-following CTA type of strategy. What makes this strategy different compared to previously issued strategies is that it is applied to a portfolio of symbols and includes a volatility-based money-management technique.
Several areas of improvements could be explored. For instance, another strategy component focused on a mean-reversion methodology could be added to the Strategy Group in Portfolio Maestro to obtain an even more rounded strategy performance. Other types of strategies could also be explored to complement periods of non-trending markets.
Additional conditions to identify trending markets could be considered. In its current form, the strategy performance reflects a number of whipsaws with a weekly drawdown that likely exceeds an acceptable level. Of course, adding rules to identify trending markets would also introduce the possibility of missing the initial stage of a trend, which is a good reminder that in strategy trading there is much give and take for introducing different ele-ments to a strategy.
Lastly, as a reminder, the list of traded securities was chosen based on obtaining exposure to multiple currency, commodity, and equity markets. A different portfolio with different securities could be pursued, as well as a different money-management technique from the one selected in this article.
All performance results are hypothetical. Past performance, actual or hypothetical, is not necessarily indicative of future results.
Figure 5: Strategy Performance Report – Performance Graphs Tab - Equity Curve Detailed
Figure 6: Strategy Performance Report – Graphs Tab – Total P/L by Symbol
All performance results are hypothetical. Past performance, actual or hypothetical, is not necessarily indicative of future results.

Ready to expand your TradeStation horizons with EasyLanguage ®? Creating your own indicators and strategies will give you
new perspectives on markets and on your trading.TradeStation’s Client Training and Education Department has taught thousands of traders how to use EasyLanguage and would like to count you among them. We can guide you through all the steps in creating indicators, ShowMe™ and PaintBar™ studies and trading strategies. And if you’re thinking “but I’m not a programmer,” well, most of the thousands of people we’ve taught weren’t programmers either. But, like you, they were passionate about markets and willing to spend a few hours working with us to learn.
You’ll be surprised by how quickly you can get up to speed and begin writing your own indicators and trading strategies in EasyLanguage, and how this will open up a whole new world of market analysis.
Beginners CourseFor the EasyLanguage beginner, the same course work can be accessed LiveOnTheWeb and in a self-paced home study course.
EasyLanguage Boot CampA two-day LiveOnTheWeb class
$249 SCC Member Price: $124.50Register with promo code ELBC4SCC
Your instructor will guide you step by step through more than 30 practical exercises covering such topics as creating indicators, ShowMes™, PaintBars™, and trading strategies, including indicators designed specifically for use with TradeStation’s RadarScreen® feature. You will learn how to:
• Use inputs for flexibility and optimization• Design indicators specifically for RadarScreen• Create real-time alerts based on your custom market conditions• Write market, limit and stop orders into strategies• Incorporate money-management exits in your strategies
Exclusive webcast bonus:• Ask questions and interact with your instructor in real time• Review the recordings of the course at any time• Retake the LiveOnTheWeb class any time it is offered
Advanced Users CourseFor advanced users, step up to the latest in EasyLanguage by incorporating objects in your studies and strategies. Here, too, the same course work can be accessed LiveOnTheWeb and in a self-paced home study course.
Implementing Objects in EasyLanguageA two-day LiveOnTheWeb class
$249 SCC Member Price: $124.50Register with promo code IOEL4SCC
In this course, your instructor will guide you through exercises using the latest in EasyLanguage features, including price series providers, timers and accounts providers. These open up possibilities beyond the already formidable capabilities of conventional EasyLanguage. In this advanced course, you’ll learn how to:
• Create multi-data analysis in RadarScreen• Access real-time account and position updates• Place and track real-world orders• Read and write to Excel files• Build your own interactive windows
Exclusive webcast bonus:• Ask questions and interact with your instructor in real time• Review the recordings of the course at any time• Retake the LiveOnTheweb class any time it is offeredEasyLanguage Home Study Course
A self-paced home-study book
$99 SCC Member Price: $49.50Complete and return the order form
This book covers the same range of material as the EasyLanguage Boot Camp, in an easy-to-follow format that takes you through each exercise in the course, with instructions and explanations. The book is printed in vibrant color and is spiral bound, making it easy to work through each exercise right on your computer.
EasyLanguage Objects Home Study CourseA self-paced home-study book
$99 SCC Member Price: $49.50Complete and return the order form
This book covers the same range of material as the Implementing Objects in EasyLanguage web class, in an easy-to-follow format that takes you through each exercise in the course, with instructions and explanations. The book is printed in vibrant color and is spiral bound, making it easy to work through each exercise right on your computer.
Winter 2016
Strategy Concepts Club Utility Kit 1
Strategy Concepts Club Utility Kit 1Stanley Dash, CMTVP, Applied Technical Analysis
Contents
u Strategy: TSL:Friday Exit TSL:Close On Last Bar
u Indicator: TSL:Strategy Equity
u PaintBar: TSL:3rd Friday
u Function: $MinFluc
DOWNLOAD FILES
This is the first in a series of occasional bonus
features known as Utility Kits. Published only
for Strategy Concepts Club subscribers, these
kits provide tools that assist in developing and
testing strategies and otherwise monitoring
market conditions. As always, subscribers will
find that all the EasyLanguage® is open, in the
hope that readers will learn from them and
customize the items they find most useful.
16 | STRATEGY CONCEPTS CLUB
Input Default Description
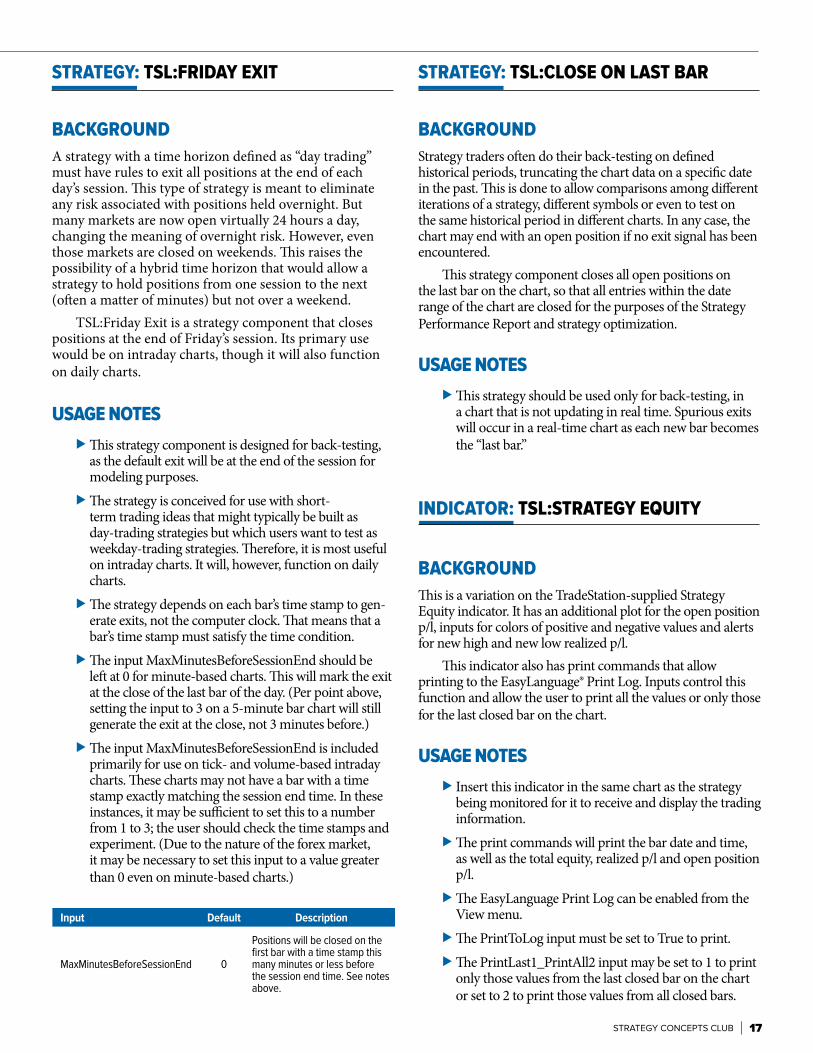
MaxMinutesBeforeSessionEnd 0
Positions will be closed on the first bar with a time stamp this many minutes or less before the session end time. See notes above.
STRATEGY: TSL:CLOSE ON LAST BAR
BACKGROUNDStrategy traders often do their back-testing on defined historical periods, truncating the chart data on a specific date in the past. This is done to allow comparisons among different iterations of a strategy, different symbols or even to test on the same historical period in different charts. In any case, the chart may end with an open position if no exit signal has been encountered.
This strategy component closes all open positions on the last bar on the chart, so that all entries within the date range of the chart are closed for the purposes of the Strategy Performance Report and strategy optimization.
USAGE NOTESu This strategy should be used only for back-testing, in
a chart that is not updating in real time. Spurious exits will occur in a real-time chart as each new bar becomes the “last bar.”
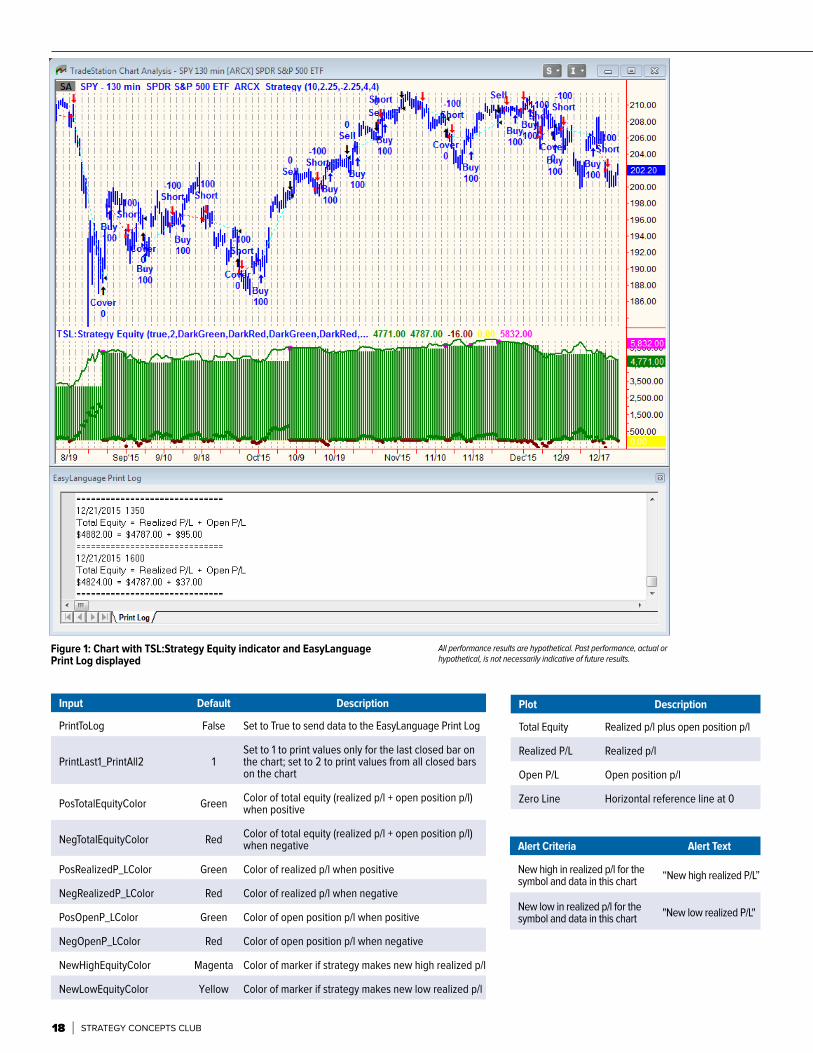
INDICATOR: TSL:STRATEGY EQUITY
BACKGROUNDThis is a variation on the TradeStation-supplied Strategy Equity indicator. It has an additional plot for the open position p/l, inputs for colors of positive and negative values and alerts for new high and new low realized p/l.
This indicator also has print commands that allow printing to the EasyLanguage® Print Log. Inputs control this function and allow the user to print all the values or only those for the last closed bar on the chart.
USAGE NOTESu Insert this indicator in the same chart as the strategy
being monitored for it to receive and display the trading information.
u The print commands will print the bar date and time, as well as the total equity, realized p/l and open position p/l.
u The EasyLanguage Print Log can be enabled from the View menu.
u The PrintToLog input must be set to True to print.u The PrintLast1_PrintAll2 input may be set to 1 to print
only those values from the last closed bar on the chart or set to 2 to print those values from all closed bars.
STRATEGY: TSL:FRIDAY EXIT
BACKGROUNDA strategy with a time horizon defined as “day trading” must have rules to exit all positions at the end of each day’s session. This type of strategy is meant to eliminate any risk associated with positions held overnight. But many markets are now open virtually 24 hours a day, changing the meaning of overnight risk. However, even those markets are closed on weekends. This raises the possibility of a hybrid time horizon that would allow a strategy to hold positions from one session to the next (often a matter of minutes) but not over a weekend.
TSL:Friday Exit is a strategy component that closes positions at the end of Friday’s session. Its primary use would be on intraday charts, though it will also function on daily charts.
USAGE NOTES u This strategy component is designed for back-testing,
as the default exit will be at the end of the session for modeling purposes.
u The strategy is conceived for use with short-term trading ideas that might typically be built as day-trading strategies but which users want to test as weekday-trading strategies. Therefore, it is most useful on intraday charts. It will, however, function on daily charts.
u The strategy depends on each bar’s time stamp to gen-erate exits, not the computer clock. That means that a bar’s time stamp must satisfy the time condition.
u The input MaxMinutesBeforeSessionEnd should be left at 0 for minute-based charts. This will mark the exit at the close of the last bar of the day. (Per point above, setting the input to 3 on a 5-minute bar chart will still generate the exit at the close, not 3 minutes before.)
u The input MaxMinutesBeforeSessionEnd is included primarily for use on tick- and volume-based intraday charts. These charts may not have a bar with a time stamp exactly matching the session end time. In these instances, it may be sufficient to set this to a number from 1 to 3; the user should check the time stamps and experiment. (Due to the nature of the forex market, it may be necessary to set this input to a value greater than 0 even on minute-based charts.)
STRATEGY CONCEPTS CLUB | 17
Input Default Description
PrintToLog False Set to True to send data to the EasyLanguage Print Log
PrintLast1_PrintAll2 1Set to 1 to print values only for the last closed bar on the chart; set to 2 to print values from all closed bars on the chart
PosTotalEquityColor Green Color of total equity (realized p/l + open position p/l) when positive
NegTotalEquityColor Red Color of total equity (realized p/l + open position p/l) when negative
PosRealizedP_LColor Green Color of realized p/l when positive
NegRealizedP_LColor Red Color of realized p/l when negative
PosOpenP_LColor Green Color of open position p/l when positive
NegOpenP_LColor Red Color of open position p/l when negative
NewHighEquityColor Magenta Color of marker if strategy makes new high realized p/l
NewLowEquityColor Yellow Color of marker if strategy makes new low realized p/l
Alert Criteria Alert Text
New high in realized p/l for the symbol and data in this chart “New high realized P/L”
New low in realized p/l for the symbol and data in this chart "New low realized P/L"
Plot Description
Total Equity Realized p/l plus open position p/l
Realized P/L Realized p/l
Open P/L Open position p/l
Zero Line Horizontal reference line at 0
All performance results are hypothetical. Past performance, actual or hypothetical, is not necessarily indicative of future results.
Figure 1: Chart with TSL:Strategy Equity indicator and EasyLanguage Print Log displayed
18 | STRATEGY CONCEPTS CLUB
FUNCTION: $MINFLUC
BACKGROUNDEasyLanguage offers several Reserved Words that reference the price-expression characteristics of a symbol. This function uses two of those words to return the minimum fluctuation (tick) for any symbol. This is particularly useful for futures and forex markets, most of which have different price expressions and minimum fluctuations.
This function may be used for setting orders a number of ticks from a particular level or when using TradeStation-supplied exits such as Stop Loss (SetStopLoss) and Dollar Trailing (SetDollarTrailing). Those exits require a money-based value; this function, combined with BigPointValue, can help convert minimum fluctuations to dollar values, allowing stops to be set in ticks instead of dollars.
Existing subscribers to the Strategy Concepts Club may already have this function as it was used in strategies as noted below.
USAGE NOTESThis function was used in the following strategies published in the Strategy Concepts Club:
TSL:Moving Average Channel Issue 1, January 2015
TSL:Engulfing Candles Issue 10, October 2015
TSL:Pivot Breakout Issue 12, December 2015
PAINTBAR: TSL:3RD FRIDAY
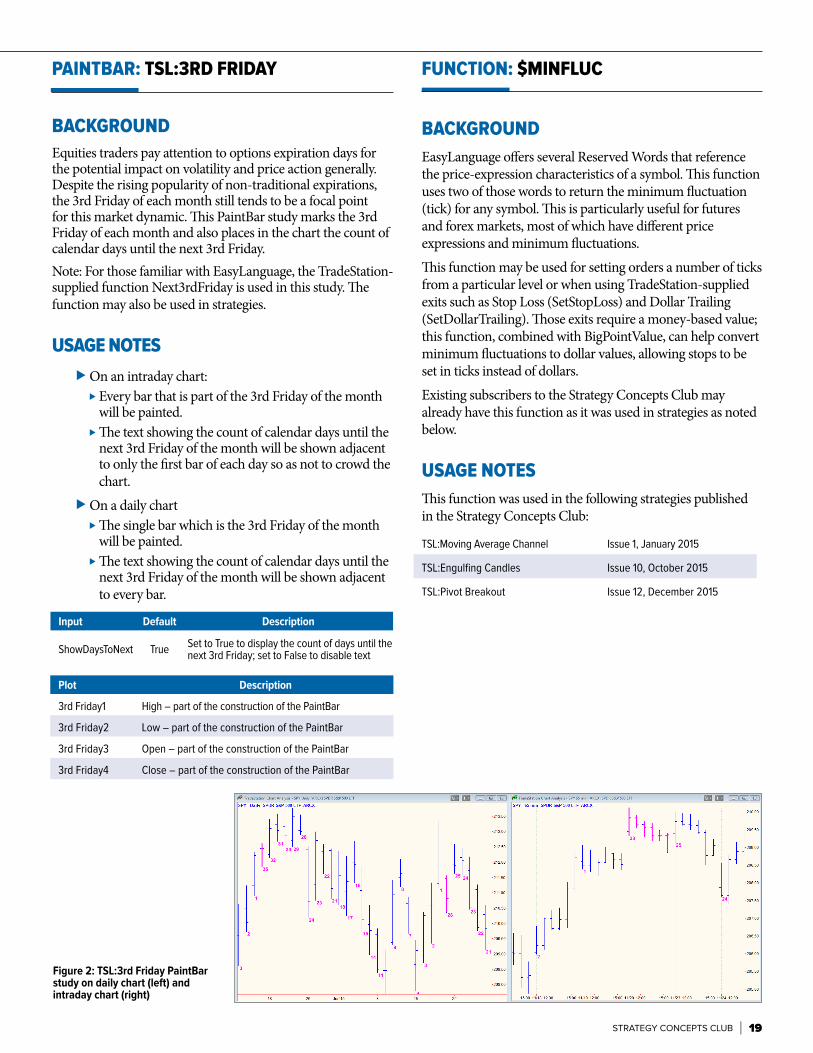
BACKGROUNDEquities traders pay attention to options expiration days for the potential impact on volatility and price action generally. Despite the rising popularity of non-traditional expirations, the 3rd Friday of each month still tends to be a focal point for this market dynamic. This PaintBar study marks the 3rd Friday of each month and also places in the chart the count of calendar days until the next 3rd Friday.Note: For those familiar with EasyLanguage, the TradeStation-supplied function Next3rdFriday is used in this study. The function may also be used in strategies.
USAGE NOTESu On an intraday chart:
u Every bar that is part of the 3rd Friday of the month will be painted.
u The text showing the count of calendar days until the next 3rd Friday of the month will be shown adjacent to only the first bar of each day so as not to crowd the chart.
u On a daily chartu The single bar which is the 3rd Friday of the month
will be painted.u The text showing the count of calendar days until the
next 3rd Friday of the month will be shown adjacent to every bar.
Input Default Description
ShowDaysToNext True Set to True to display the count of days until the next 3rd Friday; set to False to disable text
Plot Description
3rd Friday1 High – part of the construction of the PaintBar
3rd Friday2 Low – part of the construction of the PaintBar
3rd Friday3 Open – part of the construction of the PaintBar
3rd Friday4 Close – part of the construction of the PaintBar
Figure 2: TSL:3rd Friday PaintBar study on daily chart (left) and intraday chart (right)
STRATEGY CONCEPTS CLUB | 19