in the scag economy€¦ · 2002 2004 2006 2008 2010 2012 2014 2016 real gross county product /...
TRANSCRIPT
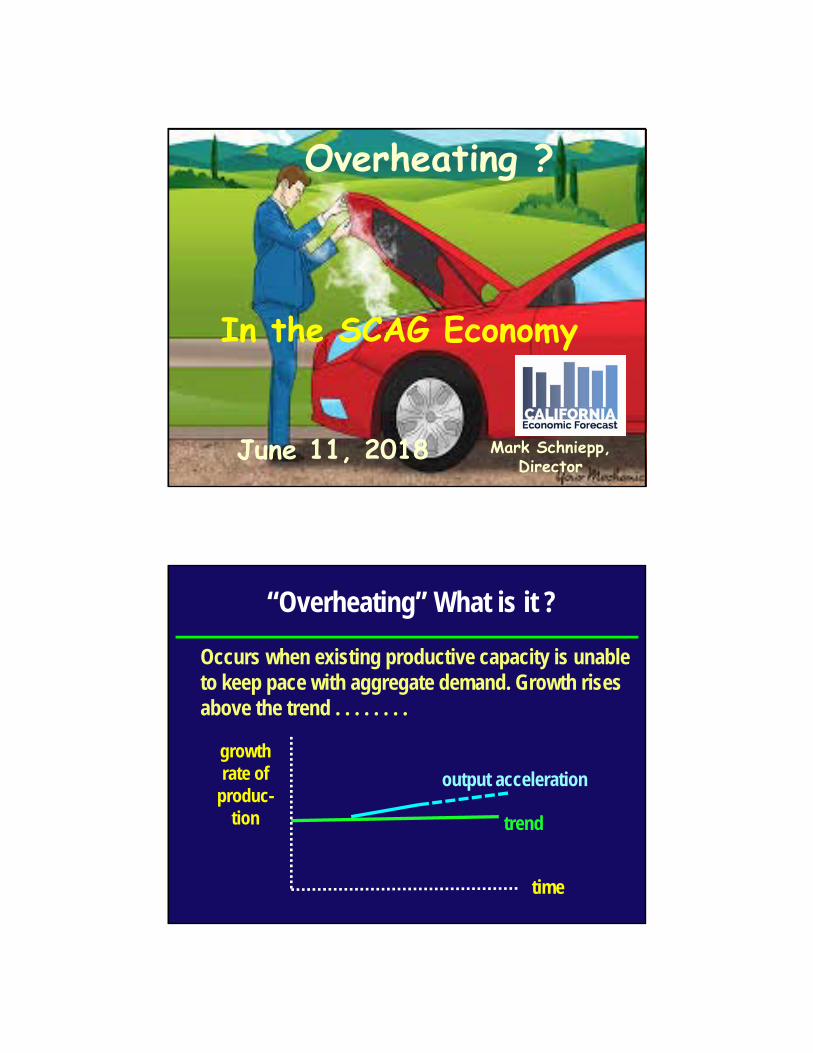
June 11, 2018
Overheating ?
Mark Schniepp, Director
In the SCAG Economy
“Overheating” What is it ?
Occurs when existing productive capacity is unable to keep pace with aggregate demand. Growth rises above the trend . . . . . . . .
time
growth rate of
produc-tion
output acceleration
trend

“Overheating”
……… and price inflation results . . .
pricelevel
rate of production
AD1AD2
S
x zy
50,000
53,000
56,000
59,000
62,000
65,000
68,000
71,000
1987 1990 1993 1996 1999 2002 2005 2008 2011 2014 2017
Real Median Household Income constant 2017 dollars 1987 -- 2017
California
U.S.
-9
-6
-3
0
3
6
9
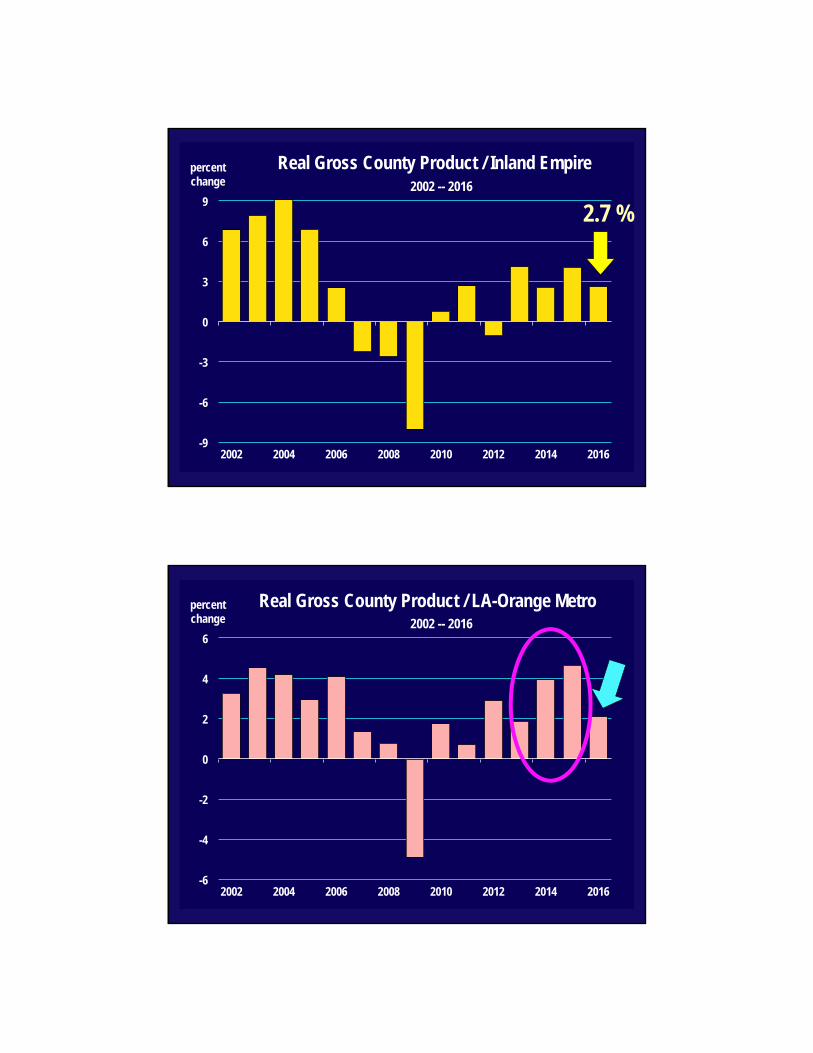
2002 2004 2006 2008 2010 2012 2014 2016
Real Gross County Product / Inland Empire 2002 -- 2016
percent change
2.7 %
-6
-4
-2
0
2
4
6
2002 2004 2006 2008 2010 2012 2014 2016
Real Gross County Product / LA-Orange Metro 2002 -- 2016
percent change

-6
-4
-2
0
2
4
6
2002 2004 2006 2008 2010 2012 2014 2016
Real Gross County Product / Ventura County 2002 -- 2016
percent change
-6
-4
-2
0
2
4
6
8
10
2002 2004 2006 2008 2010 2012 2014 2016
Real Gross County Product / Imperial County 2002 -- 2016
percent change

0
1
2
3
4
Apr-10 Apr-11 Apr-12 Apr-13 Apr-14 Apr-15 Apr-16 Apr-17 Apr-18
LA Metro Region Consumer Price Inflation percent
April 2010 -- April 2018
0
1
2
3
4
Apr-10 Apr-11 Apr-12 Apr-13 Apr-14 Apr-15 Apr-16 Apr-17 Apr-18
LA Metro Region Core Consumer Price Inflation percent April 2010 -- April 2018
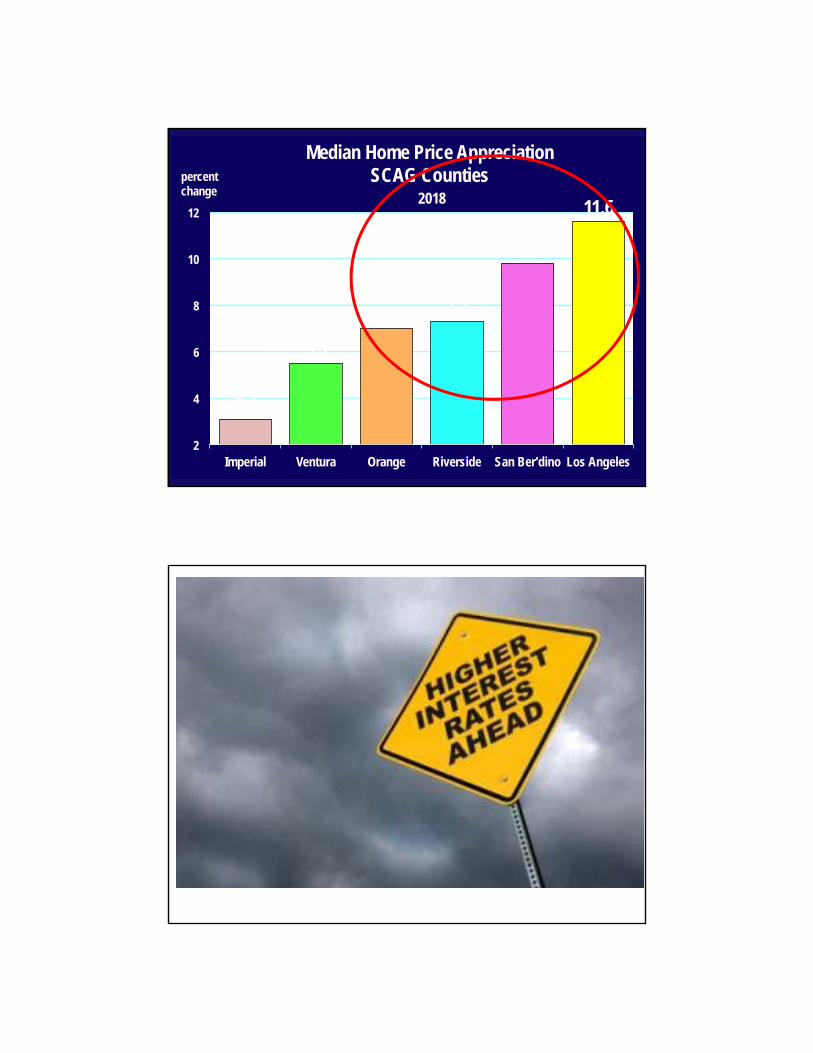
3.1
5.5
7.0 7.3
9.8
11.6
2
4
6
8
10
12
Imperial Ventura Orange Riverside San Ber'dino Los Angeles
Median Home Price Appreciation SCAG Counties
2018
percent change

1.7
1.9
2.1
2.3
2.5
2.7
2.9
3.1
Nov-16 Jan-17 Mar-17 May-17 Jul-17 Sep-17 Nov-17 Jan-18 Apr-18 Jun-18
10 year U.S. Treasury Bond Yield November 6, 2016 -- June 8, 2018
percent yield
Lowest rate ever
2
4
6
8
10
12
14
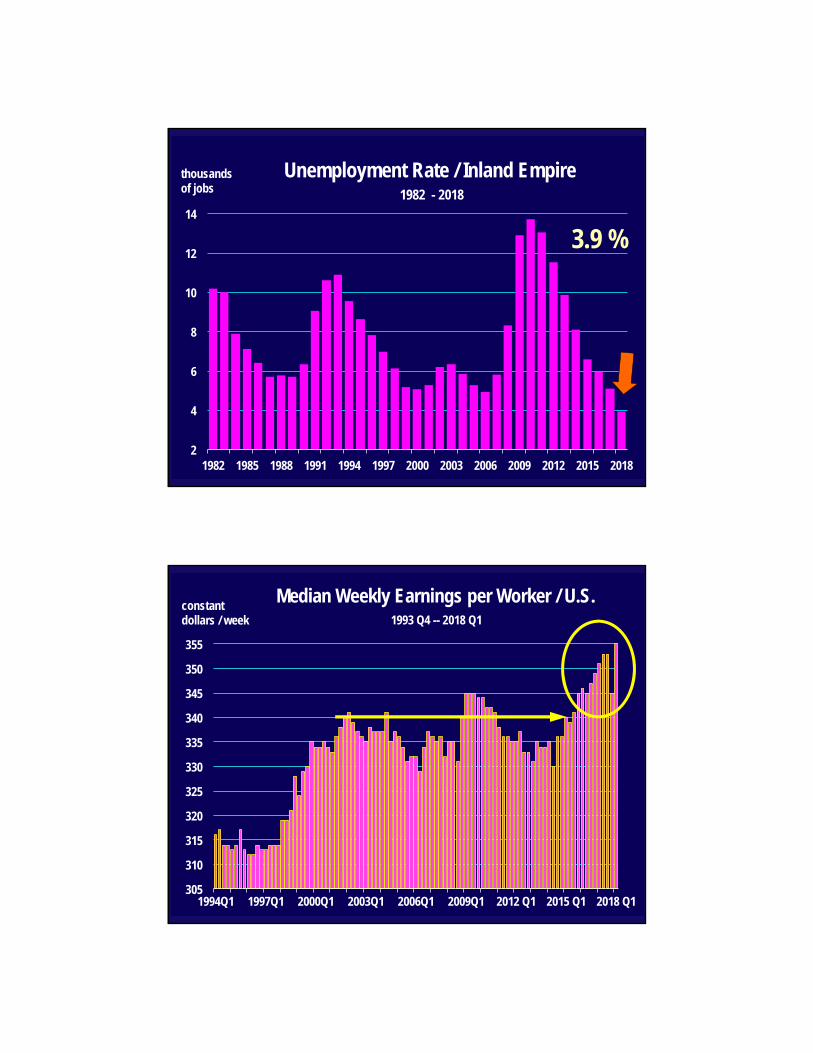
1982 1985 1988 1991 1994 1997 2000 2003 2006 2009 2012 2015 2018
Unemployment Rate / Inland Empire thousands of jobs. 1982 - 2018
3.9 %
305
310
315
320
325
330
335
340
345
350
355
1994Q1 1997Q1 2000Q1 2003Q1 2006Q1 2009Q1 2012 Q1 2015 Q1 2018 Q1
Median Weekly Earnings per Worker / U.S. 1993 Q4 -- 2018 Q1
constant dollars / week
0.5
1.0
1.5
2.0
2.5
3.0
3.5
4.0
4.5
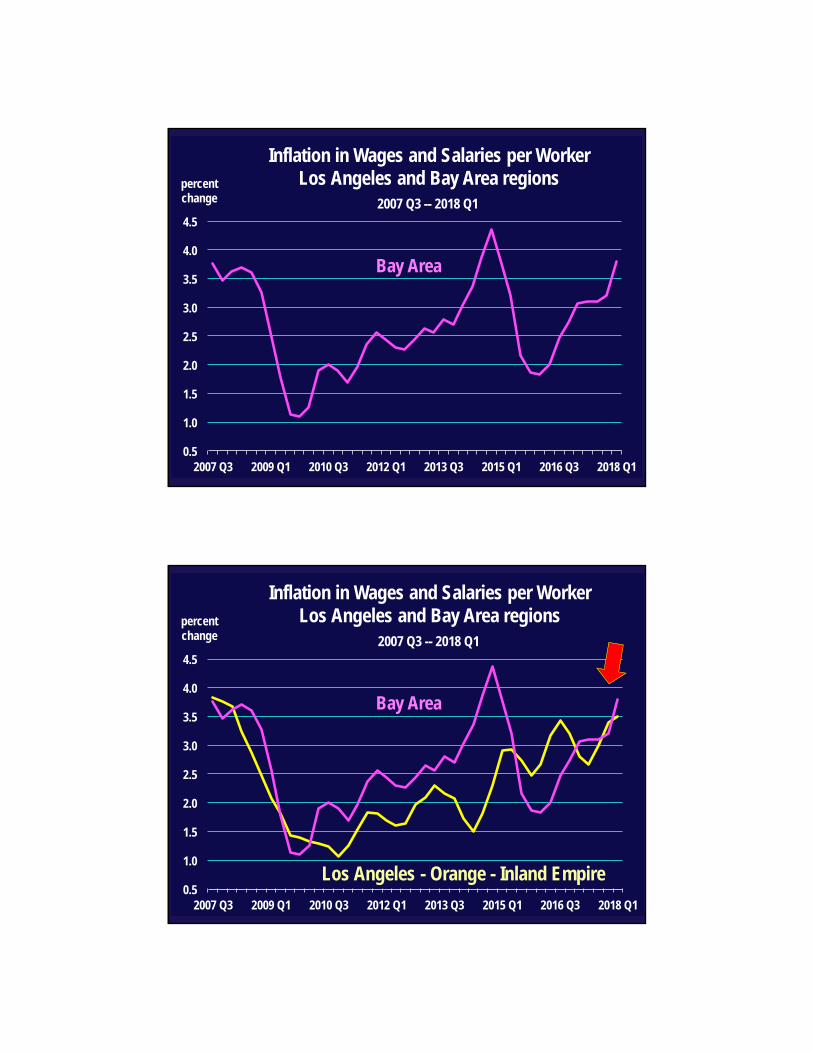
2007 Q3 2009 Q1 2010 Q3 2012 Q1 2013 Q3 2015 Q1 2016 Q3 2018 Q1
Inflation in Wages and Salaries per Worker Los Angeles and Bay Area regions
2007 Q3 -- 2018 Q1
percent change
Bay Area
0.5
1.0
1.5
2.0
2.5
3.0
3.5
4.0
4.5
2007 Q3 2009 Q1 2010 Q3 2012 Q1 2013 Q3 2015 Q1 2016 Q3 2018 Q1
Inflation in Wages and Salaries per Worker Los Angeles and Bay Area regions
2007 Q3 -- 2018 Q1
percent change
Los Angeles - Orange - Inland Empire
Bay Area
-1
0
1
2
3
4
5
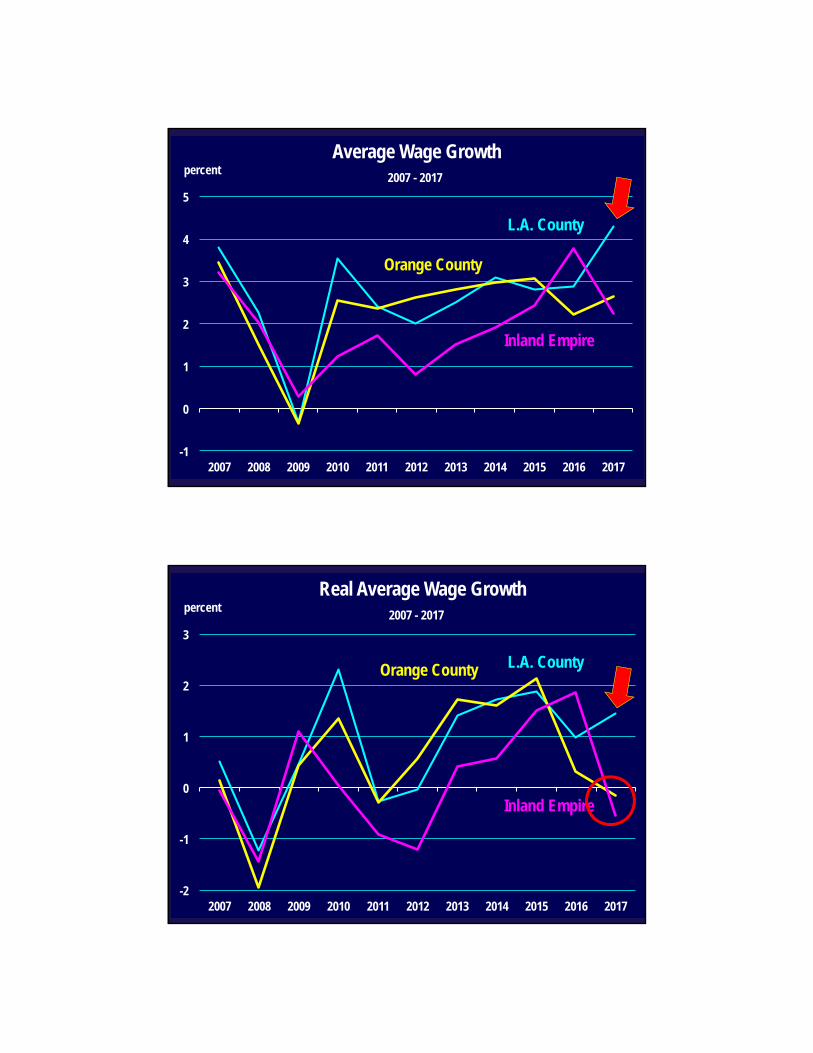
2007 2008 2009 2010 2011 2012 2013 2014 2015 2016 2017
Average Wage Growth 2007 - 2017
percent
Orange County
Inland Empire
L.A. County
-2
-1
0
1
2
3
2007 2008 2009 2010 2011 2012 2013 2014 2015 2016 2017
Real Average Wage Growth 2007 - 2017
percent
Orange County
Inland Empire
L.A. County
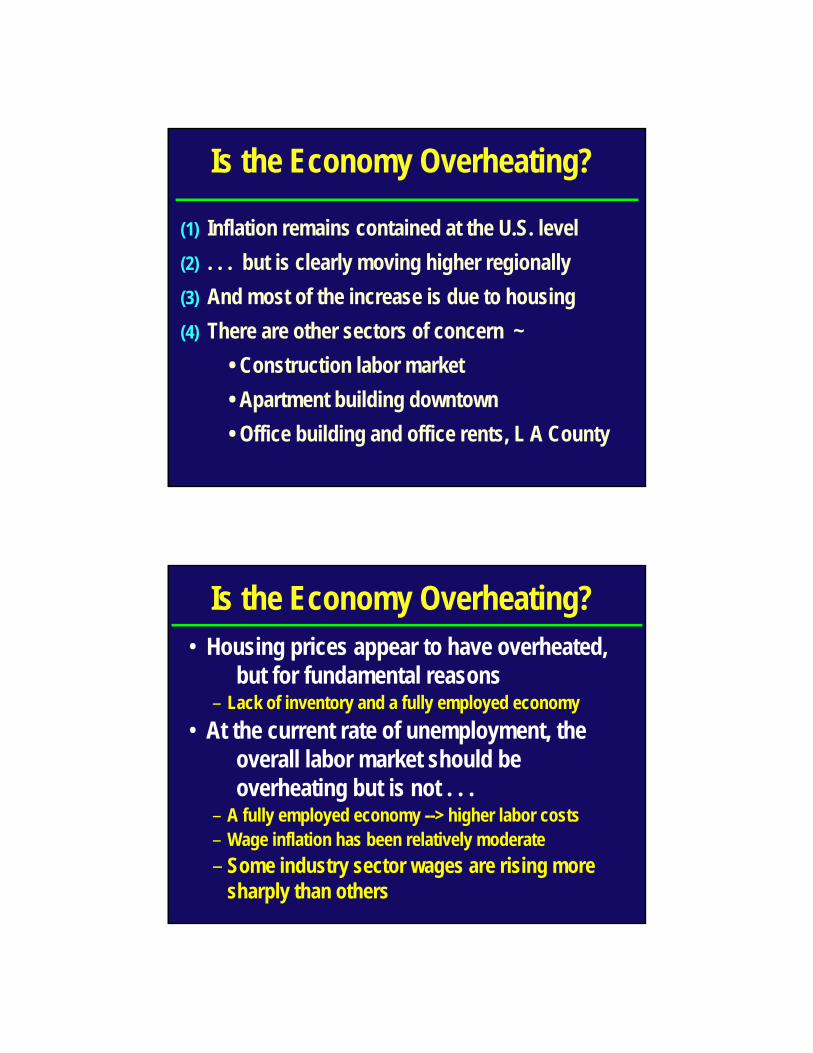
(1) Inflation remains contained at the U.S. level
(2) . . . but is clearly moving higher regionally
(3) And most of the increase is due to housing
(4) There are other sectors of concern ~
• Construction labor market
• Apartment building downtown
• Office building and office rents, L A County
Is the Economy Overheating?
Is the Economy Overheating?• Housing prices appear to have overheated,
but for fundamental reasons– Lack of inventory and a fully employed economy
• At the current rate of unemployment, the overall labor market should be overheating but is not . . .
– A fully employed economy --> higher labor costs– Wage inflation has been relatively moderate
– Some industry sector wages are rising more sharply than others
-2
0
2
4
6
8
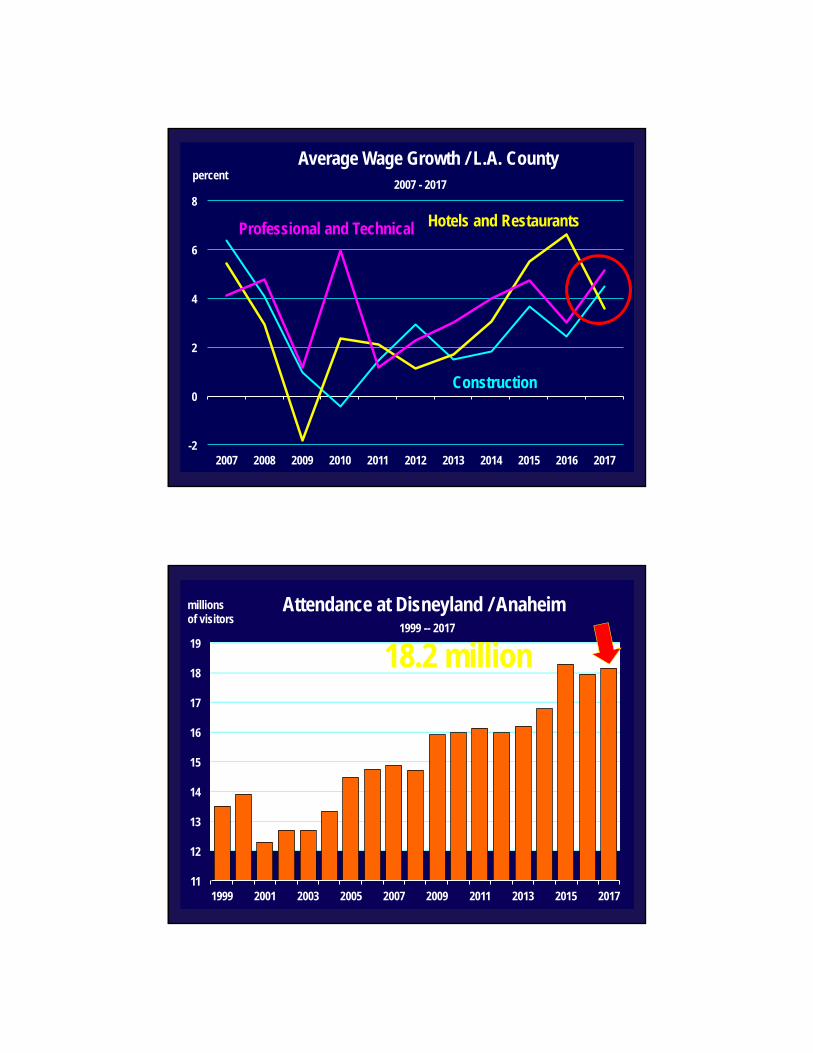
2007 2008 2009 2010 2011 2012 2013 2014 2015 2016 2017
Average Wage Growth / L.A. County 2007 - 2017
percent
Hotels and RestaurantsProfessional and Technical
Construction
11
12
13
14
15
16
17
18
19
1999 2001 2003 2005 2007 2009 2011 2013 2015 2017
Attendance at Disneyland / Anaheim 1999 -- 2017
millions of visitors
18.2 million
10
20
30
40
50
60
70
80
90
100
110
120
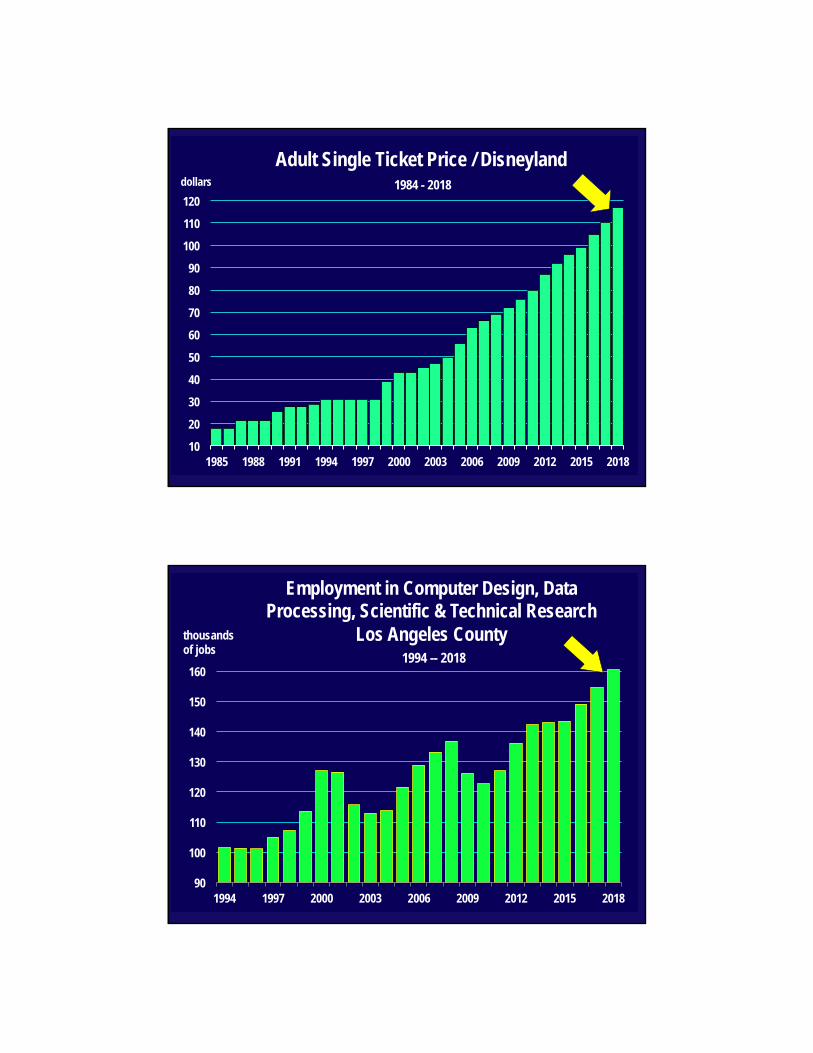
1985 1988 1991 1994 1997 2000 2003 2006 2009 2012 2015 2018
Adult Single Ticket Price / Disneyland 1984 - 2018 dollars
90
100
110
120
130
140
150
160
1994 1997 2000 2003 2006 2009 2012 2015 2018
Employment in Computer Design, Data Processing, Scientific & Technical Research
Los Angeles County thousands of jobs
1994 -- 2018

0
4,000
8,000
12,000
16,000
20,000
24,000
28,000
1988 1993 1998 2003 2008 2013 2018
New Apartment Units / Los Angeles County units permitted
1988 - 2018
0
5,000
10,000
15,000
20,000
25,000
2004 2006 2008 2010 2012 2014 2016 2018
Apartment Units Under Construction Central and Downtown Los Angeles
2004 -- 2018
units underway
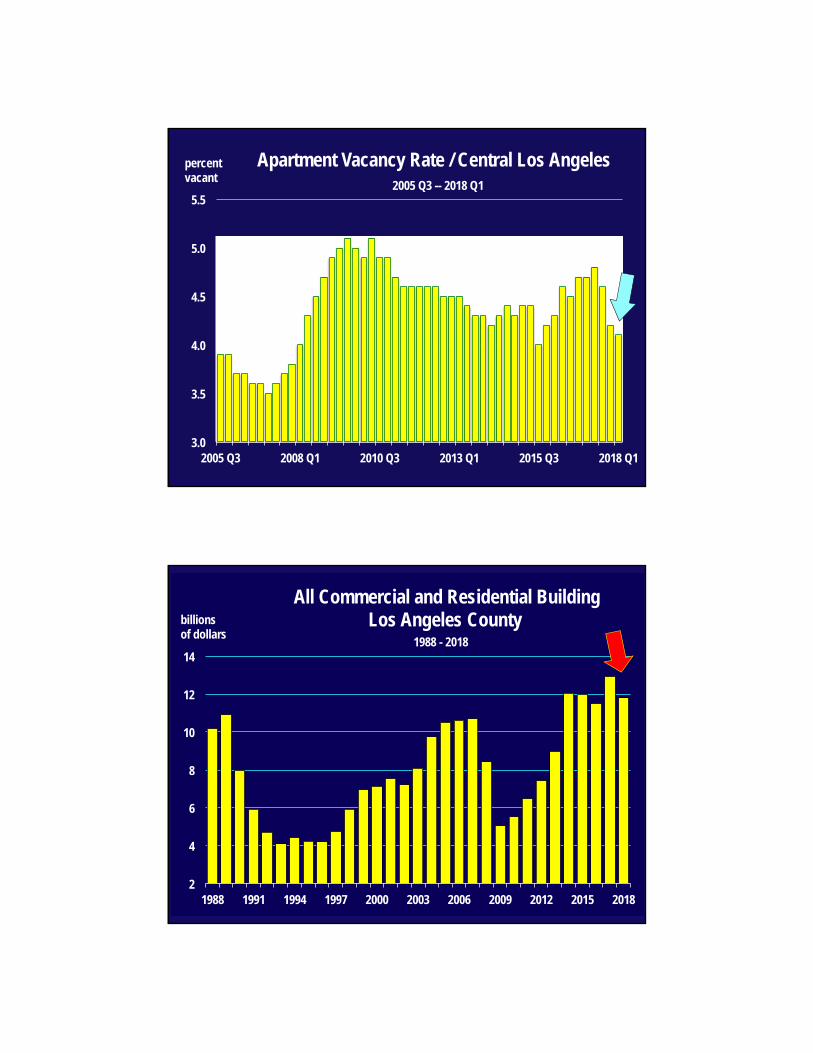
3.0
3.5
4.0
4.5
5.0
5.5
2005 Q3 2008 Q1 2010 Q3 2013 Q1 2015 Q3 2018 Q1
Apartment Vacancy Rate / Central Los Angeles 2005 Q3 -- 2018 Q1
percent vacant
2
4
6
8
10
12
14
1988 1991 1994 1997 2000 2003 2006 2009 2012 2015 2018
All Commercial and Residential Building Los Angeles County
1988 - 2018
billions of dollars

90
100
110
120
130
140
150
160
1990 1994 1998 2002 2006 2010 2014 2018
Employment in Construction Los Angeles County
thousands of jobs
1990 -- 2018
Who Benefits ?• Working people, working families who are
middle to upper income and need housing • Tech workers• Construction workers in all regions• Skilled workers• Homeowners who are selling
– Because inventory is so scarce

Who Loses ?• Fixed income households
– Face higher prices but incomes are constant
• Families wanting to go to Disneyland• Home buyers
– home prices are at record levels in many cities and counties-- longer term mortgage rates are rising
• Residential Real Estate industry – Higher interest rates and higher housing prices are
likely to reduce transactions
75,000
90,000
105,000
120,000
135,000
150,000
165,000
180,000
1998 2000 2002 2004 2006 2008 2010 2012 2014 2016 2018
Existing Home Sales / Southern California 1998 - 2018 (January through April)
sales index

June 11, 2018
Overheating ?
Mark Schniepp, Director
In the SCAG Economy
expansion