in the harmonics - rowan...
TRANSCRIPT

P.Mease 2010 | Signals & Systems in Music | In the Harmonics 1
In the Harmonics
SIGNALS & SYSTEMS IN MUSIC
CREATED BY P. MEASE 2010
[1]
INTRODUCTION & BACKGROUND What if all we had to analyze a signal was its time domain plot? For some signals this is enough to be able
to amply discuss the properties of the waveform, but as soon as you look at more complex waveforms,
the time domain representation is just not enough. This lab will formally introduce you to a new domain.
You should be very excited. This new domain is called the frequency domain and will be used to directly
monitor the exact frequency content, or spectrum, of a signal.
OBJECTIVES
In this lab, you will connect mathematical signals to physical quantities, materialized as sound, and ultimately
timbre. You will experiment with real signals and listen to the effects of changing various parameters. You will see
the content of signals in the frequency domain. You will record actual instruments (a woodwind, string, and brass)
for analysis and create three simulated (or ‘synthesized’) instruments by combining and experimenting with only
sinusoid, triangle, sawtooth, and square waveforms – i.e. you’ll be making make your first basic instrument
synthesizer!
INTRODUCTION & BACKGROUND
Signals that we hear every day are normally realized viewed in what we call the ‘time domain.’ This domain
represents the signals in two dimensions. In an ‘x-y’ graph or plot, the x would be time, in seconds, minutes, or
some other unit of time and the y direction represents the signal’s amplitude. The time domain is very intuitive
because it is directly mapped to what we experience on a daily basis. We are used to time because everything we
do has a time component. Without thinking, we wait for class, the bus, or the dinner timer to go off – all in units of
time.
A ‘signal’ can be many things, even something as simple as the force by our footsteps as we walk or run. If we
want to figure out the frequency of our footsteps, we would simply count the number of steps over some time
window. If you were running from the clutches of an angry bear, for example, the rate of our steps (or frequency
of our footstep signal) may be calculated by counting how many times your feet strike the ground in one minute:
You came up with: 100 steps/minute (and luckily escaped a potential mauling).
Since frequency is in ‘number of times’ per second, we need to simply divide using the factor label method:
100 steps
min
1 min
60 sec = 1.667 Hz
TIP: USE UNITS PROPERLY!
P.Mease 2010 | Signals & Systems in Music | In the Harmonics 2
The frequency of our steps would be 1.667 Hz. From frequency, we can directly get the amount of time it takes us
to make one step. This time is called the ‘period.’ This period is the distance between the steps during our flee for
dear life and is defined as:
𝑇 =1
𝑓
where f is frequency (in Hz) and T is period (in seconds)
In our example:
𝑇 =1
𝑓=
1
1.667 Hz= 0.60 s
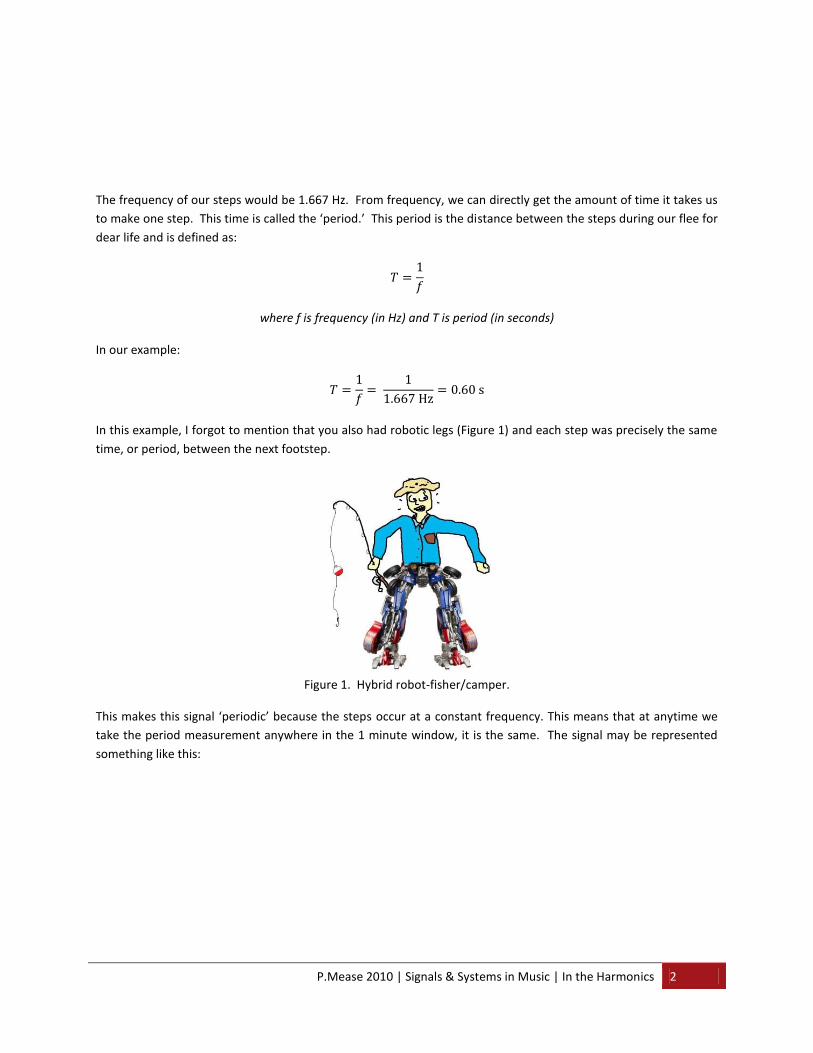
In this example, I forgot to mention that you also had robotic legs (Figure 1) and each step was precisely the same
time, or period, between the next footstep.
Figure 1. Hybrid robot-fisher/camper.
This makes this signal ‘periodic’ because the steps occur at a constant frequency. This means that at anytime we
take the period measurement anywhere in the 1 minute window, it is the same. The signal may be represented
something like this:

P.Mease 2010 | Signals & Systems in Music | In the Harmonics 3
Figure 2. Stepping at fixed frequency.
So what if we wanted to view the frequency of our footsteps just like we can view time in the time domain on the
simple x-y plot? Luckily, there already exists such a thing: the ‘frequency domain.’ This domain is just like our time
domain representation except that now the x axis is no longer time but ‘frequency.’ The frequency domain can tell
us many things including ‘how fast’ a time-domain signal is changing.
This lab relies heavily on viewing a signal in the frequency domain (the signal’s spectrum). From the spectral view,
we can look at the frequency content of any time domain signal in an easy, intuitive format. The spectrum of the
above signal will look like this:
Figure 3. Spectrum of a pure single frequency sinusoid.
By the way, the transformation of a signal from the time domain to the frequency domain is made possible by the
Fourier Transform, named after the French mathematician Joseph Fourier (pronounced “4-yay” – see Figure 4).
His name will come up again in your near future and will make your life much easier. Here he is (cue angelic
ambiance):

P.Mease 2010 | Signals & Systems in Music | In the Harmonics 4
Figure 4. Jean Baptiste Joseph Fourier.
Print this picture and add it with your other idols in your sacred candle-lit closet.
READ THIS MANY TIMES: Mr. Fourier tells us that ANY SIGNAL can be represented as a sum of sinusoids. I’m going
to repeat this because you really should remember this: ANY SIGNAL CAN BE REPRESENTED AS A SUM OF SIMPLE
SINUSOIDS. One more time for good luck: ANY SIGNAL CAN BE REPRESENTED AS A SUM OF SIMPLE SINUSOIDS!
The ‘ANY SIGNAL’ part really means ANY SIGNAL. It could be another sinusoid, it could be a square or triangle
wave, it could be a highly complex radio signal – ANYTHING! I don’t know about you, but that is one BOLD
statement. Why? Because sinusoids are very easy signals to understand, visualize, create, analyze, etc… You will
later SEE and HEAR that this statement is not only true, so awesome it will fill you with joy beyond belief.
Now back to camping, let’s pretend that your camping adventure wasn’t for the purposes of social isolation and
you had a friend with you. Unfortunately, your friend has an older model of robotic legs installed and can’t run
quite as fast (don’t worry, your friend lives, I think). Over the 1 minute, your friend ran at a rate (or frequency) of 1
Hz, or one step every second.
If we took the spectrum of this new periodic signal, we would see something like in Figure 5.

P.Mease 2010 | Signals & Systems in Music | In the Harmonics 5
Figure 5. Spectrum of combined pure sinusoids at two frequencies.
From the above ‘spectrum’ of both the foot signals, we can easily see the frequency content they contain. For
these examples, the time domain waveforms are very basic, but when signals are more complex, the frequency
domain is an invaluable tool. Don’t believe me? Turn on the oscilloscope visualization on one of your media
players and see if you can make sense out of it in the time domain!
Now let’s talk about harmonics. In the above examples, our time-domain signals were sinusoids so we’ll only see
their ‘fundamental’ frequency (remember this term) in the spectrum (recall Figures 3 and 5). This is kind of boring
so let’s plot something that is a little more interesting; a triangle wave (let’s say its frequency is 1 kHz or 1000 Hz):
Figure 6. Triangle wave.
If we look at this signal in the frequency domain, we see its spectrum in Figure 7:

P.Mease 2010 | Signals & Systems in Music | In the Harmonics 6
Figure 7. Spectrum of triangle wave.
A little different than the good-ol sinusoid, huh (or is it?)?! Because the signal has sharper ‘turns’ (at the tops and
bottoms of the triangle), ‘harmonics’ trickle well outside the 1 kHz fundamental. Harmonics are the integer-
multiple frequency components off the fundamental. For the pure triangle wave, only odd harmonics are
produced. Different signals will have different harmonic content. These components (excluding the fundamental)
are called overtones or partials. The spectrum of a signal displays how a signal may sound to us.
You may be saying to yourself: “wait… this is great for looking at signals in this new thing called the ‘frequency
domain’ but how do these harmonics relate to something real, like an instrument?!” Thanks for asking! If we look
closely at a vibrating string (like that on a harp or guitar), you can actually catch these harmonics with your eye if
you look real close and you pluck a low enough note. These harmonics make themselves present as vibrating
modes shown in Figure 8.

P.Mease 2010 | Signals & Systems in Music | In the Harmonics 7
Figure 8. Vibrating modes. Image source: [2]
Many things will affect the spectral content and correspondingly, how an instrument sounds (which is its timbre –
pronounced “tamber”). This includes its shape, what material(s) it’s made from, the room acoustics, the player,
and many other factors. Instruments such as the flute have very pure sinusoidal-esk outputs whereas the clarinet
has much more complex harmonic content.
I will leave you with one more pondering thought: In Figure 3, we see the spectrum of a pure sinusoid whose
frequency is 1.667Hz, which is represented as a single spike. In Figure 7, we see the spectrum of a triangle wave,
which has many ‘spikes’ whose frequencies lie at odd multiples of the fundamental frequency. What would
happen if we took a few simple sinusoids like those in Figure 3, made their frequencies odd multiples of some
fundamental frequency, then added them up? Do you think we’d obtain the same spectrum as in Figure 7?
EQUIPMENT & SOFTWARE
Rope
Audio Interface: UA-25EX
Mixing Console (or MATLAB)
Headphones/Speakers
Breakout Box
Arbitrary Function Generator
Oscilloscope
Laptop/PC
Cabling: BNC, BNC Tee, etc…
Microphones
DAW - Reaper
Flute
Trumpet
Guitar + Amp
MATLAB

P.Mease 2010 | Signals & Systems in Music | In the Harmonics 8
PROCEDURE
Part 1 – Wet Feet in the ECE Lab
- Grab a section of rope approximately 2 m long. Tie one end of the rope to a tree or bench. Have a
partner looking at it from the side.
Move the jump rope and create a simple primary wave (see the first wave in Figure 8).
NOTE: It is very difficult to get the rope to work as a string if you are moving it in just one
direction since the ends are essentially fixed. A string also does not simply vibrate in one
plane. Therefore, try rotating the rope first then slowly restricting arm movement, switching
to wrist till both ends are ‘fixed.’
Now try and get the center of the rope to become stationary by flicking the rope at about
twice the speed. This is the octave harmonic or 2 * ffundamental and can be seen in the second
wave in Figure 8. See if you can get any more modes out of the rope – it will become more
difficult as frequency increases. If you can get 4 or 5, then you should flap both hands and
fly away.
- Back in the lab, create and listen to common signals (sin, saw, tri, square, and noise) using the
function generator. Connect the function generator, scope, and PC speakers as shown in Figure 9.
Figure 9. Connectivity diagram.
The function generator generates and outputs signals, the oscilloscope reads signals, the BNC tee splits
the signal from the function generator into two, the breakout box simply converts a BNC connection to
the 3.5mm stereo jack, and the PC speakers play sound.
- Experiment with both the amplitude and frequency of the signals. Listen!

P.Mease 2010 | Signals & Systems in Music | In the Harmonics 9
- Now capture all of the core signals’ spectra using the oscilloscope while varying the frequency. See
the tutorial on my website for performing an FFT on the oscilloscope. Note where the harmonics or
‘partials’ lie in relation to the fundamental frequency. TIP: Audio signals have a bandwidth between
20 Hz and 20 kHz. Make sure you select frequencies (and set the spectrum analyzer’s range)
somewhere in this band. Spend enough time to be able to quickly locate important sections of the
waveform.
- Now play a song on the PC or iPod and plug it into the oscilloscope. Capture this signal’s spectrum.
- Set your function generator to output a frequency modulated signal (FM). This type of signal
modulates another signal by a varying frequency. Select the modulation frequency so that it is slow
enough to see (remember your eye’s sampling rate is somewhat over 20Hz – NOTE: this number is
NOT exact and will vary!) and monitor its spectrum.
PART 2 – RECORDING SESSION
Now you will record real acoustic instruments and analyze these signals in the frequency domain just like in Part 1.
DELIVERABLES Be sure to submit the following (work as a group) in your lab report. Be concise in your statements. Quality is
extremely important, not quantity!
PART 1
- All screen captures of core signals’ spectra with notes on each (where are the harmonics?).
Circle/highlight the fundamental of each signal’s spectrum.
- Using the screenshots of the signals’ spectra as evidence, explain why a square wave sounds ‘sharper’
than a sinusoid or triangle.
- Using the screenshots of the signals’ spectra as evidence, explain why a sawtooth wave sounds
‘buzzier’ than a sinusoid, square, or triangle.
- What core signal is the triangle closest to? Why?
- What was happening to the FM signal’s spectrum? Explain.
PART 2
- Select 3 different instrument audio tracks we recorded (downloadable off the course webpage) and
capture screenshots of their spectrum. For each instrument you selected, decide which of the core
signals the instruments sounds closest to. Justify your decisions.
SAFETY & LAB PROTOCOL - Be sure to turn down any headphone volumes BEFORE putting them on your head!
- If using the headphone distribution amp, be sure to notify others wearing connected headphones
when you are going to play something
- Do NOT adjust any other headphone volume control but your own
- Return all cabling neatly to the racks
- Take extreme care handling the instruments
- Clean your workspace when finished your experiment
- No food or drink allowed in the lab

P.Mease 2010 | Signals & Systems in Music | In the Harmonics 10
REFERENCES [1] Image source: http://www.sacredpatterns.com/moreHyperStuff.htm
[2] Image source: http://upload.wikimedia.org/wikipedia/commons/4/4f/Moodswingerscale.jpg