in situ raman microscopy applied to large central asian ... · in situ raman microscopy applied to...
TRANSCRIPT
27
5
Research ArticleReceived: 8 March 2009 Accepted: 16 May 2009 Published online in Wiley Interscience: 25 September 2009
(www.interscience.wiley.com) DOI 10.1002/jrs.2443
In situ Raman microscopy applied to largeCentral Asian paintingsRichard R. Ernst∗
Procedures and versatile Raman instruments are described for the non-destructive in situ analysis of pigments in largepaintings. A commercial Raman microscope is mounted on a gantry for scanning paintings with dimensions exceeding 1 m2.Design principles and the physical implementation of the set-up are outlined. Advantages/disadvantages and performance ofthe gantry-based instrument are compared with those of a mobile Raman probe, attached to the same Raman microscope.The two set-ups are applied to Central Asian thangka paintings. The utility of the gantry-mounted Raman microscope isdemonstrated on a 19th century Buddhist painting from Buriatia, South Siberia. Surprisingly, three arsenic-based pigments,i.e. orpiment, realgar, and pararealgar, are found all in the same painting. Pararealgar is used for painting the numerousyellow areas. Realgar is admixed with red lead for adjusting its orange tint. Finally, orpiment is blended with Prussian blue forproducing green. Traditional malachite is used in addition as a non-adulterated green pigment. The mobile Raman probe wasemployed for examining a Tibetan painting of the 18th century from Derge monastery in the Kham area of Sichuan. The highlyunique painting could be dated well and its origin accurately located. In fact, the painter’s workshop, where the thangka hasbeen executed, is shown in great detail on the painting itself. The painter’s palette of this thangka matches the canonical set ofpigments used in Tibet for more than 10 centuries. Copyright c© 2009 John Wiley & Sons, Ltd.
Keywords: Raman microscopy; pigments; Asian paintings; thangkas
Introduction
Pigments in ancient paintings provide a rich source of informationon provenance, the date of production, and the development ofpainting traditions. Some pigments were locally available; othershave travelled over long distances and served, sometimes, asconvenient means of ‘international currency,’ being lightweightand of high monetary value. Knowledge of the pigments appliedby the painter is also of great importance in the context ofthe conservation and restoration of ancient paintings. The scrollpaintings to be studied in this project are rather fragile and oftenseriously damaged, requiring special care in conservation.
Non-destructive examination methods of objects are indis-pensable when investigating historical artworks. Picking pigmentsamples by mechanical means from precious paintings is highly un-desirable. It is understandable that taking samples from paintingsin public collections is discouraged by curators and conservatorswho care for the immaculate preservation of the irreplaceableheritage.
On the other hand, methods for the non-destructive analysis ofpigments are rather scarce. X-ray fluorescence (XRF) spectroscopyis a powerful non-destructive method for determining the localatomic composition in paintings.[1 – 6] Sometimes, pigments canbe identified uniquely by XRF. However, often ambiguities remainwhen several pigments possess similar atomic composition; andmixtures of pigments are notoriously difficult to disentangle.
Fibre-optic reflectance spectroscopy (FORS) in the visibleand infrared is another method suited for the non-destructiveidentification of pigments.[7 – 10] However, the spectral resolutionis often limited; and modern Raman spectroscopy is outperformingFORS in many applications.
Today, Raman spectroscopy is often the method of choice fornon-destructive pigment analysis.[11 – 13] It provides informationon molecular vibrations similar to infrared spectroscopy, but
exhibits better resolved and unique spectra with characteristicbands. Excitation and detection procedures are normally part ofa confocal Raman microscope. Raman microscopy has become arevealing tool for studies in the arts and in archaeology.[14 – 18]
The efforts described in this paper are parts of an exploratoryproject devoted to the identification of pigments in historicpaintings on canvas. The studies concentrate on treasures fromCentral Asia. The painted area of these artworks can easilyexceed 1 m2. Two approaches are explored for investigating non-destructively large paintings by Raman microscopy: (1) A specialdesign of a gantry-mounted versatile Raman microscope has beenimplemented. It allows free movements in two dimensions acrossa large painting surface under investigation; (2) A mobile Ramanprobe, attached via fibre optics to the Raman spectrometer, permitsthe exploration of painted surfaces tens of metres away from theusually rather bulky stationary Raman set-up. Both approaches arediscussed in the following.
The current interests of the author focus on ancient CentralAsian painting traditions and on the historical and local variabilityof pigments. Much of Central Asian art is connected to Buddhisttraditions, all of which are related to Tibetan Buddhism. Buddhistpaintings on canvas may originate from a wide geographic rangecovering Northern India, Nepal, Bhutan, Tibet, Central China,Mongolia, and even Buriatia in Siberia. A great number of Buddhistscroll paintings can be found in public and private collections andcover at least the past 1000 years. Buddhist wall paintings have
∗ Correspondence to: Richard R. Ernst, Laboratorium fur Physikalische Chemie,ETH Zurich, Wolfgang-Pauli-Strasse 10, 8093 Zurich, Switzerland.E-mail: [email protected]
Laboratorium fur Physikalische Chemie, ETH Zurich, Wolfgang-Pauli-Strasse10, 8093 Zurich, Switzerland
J. Raman Spectrosc. 2010, 41, 275–287 Copyright c© 2009 John Wiley & Sons, Ltd.
27
6
R. R. Ernst
an even longer tradition and are found, for example, in the world-famous Mogao Caves of Dunhuang in Gansu Province, China, andin the monumental Ajanta Caves in Maharashtra, India. Most ofthe scroll paintings are on cotton, rarely on silk, and sometimeson paper. The pigments are usually of mineral origin; and they arefixed to the canvas by hide glue.
Recently, we started an extensive series of experimentalinvestigations of pigments on ancient scroll paintings from theabove-mentioned countries and periods. The unlimited directaccess to the author’s personal collection of several hundredCentral Asian paintings from the 12th to the 19th century provedessential for this study, which otherwise would have been verydifficult to accomplish.
So far, few Raman studies of Asian paintings on fabric orpaper support have been reported[19 – 24] in spite of the enormouswealth of such artworks in public and private collections.Raman investigations of pigments in frescos are somewhat moreabundant.[25 – 30] This may be explained by the ease of samplingwall paintings by means of a tungsten needle or a scalpel withoutcausing noticeable damage of the rather coarse fresco structures.Usually, one finds plenty of ancient defects, which permit virtually‘non-destructive’ sampling. An Indian polychrome figure was alsostudied by Raman microscopy.[31]
Often, Central Asian paintings on fabric and paper are enor-mously detailed with essential sub-millimetre features. Thesedetails can be appreciated only by means of a good magnificationglass or even a microscope. Obviously, sampling by mechanicalmeans would cause irreparable damage of the details. Moreover,Buddhist paintings on canvas are frequently quite large, easilyexceeding 1 m2. In graphical terms, such paintings can possessmore than 100 MB of visual information, rendering the spectro-scopic investigation (as well as photography) quite demanding.A comprehensive Raman study of such elaborate paintings bymechanical sampling is clearly out of question.
This first publication by the author on pigment analysisby Raman spectroscopy describes procedures for in situ non-destructive Raman microscopy. The utility of the procedures isdemonstrated on two thangka paintings, one from Buriatia, SouthSiberia, and one from the region of Kham in East Tibet. Moreextensive accounts of the exploratory endeavour on Central Asianthangka paintings will be published on other occasions.
Design of a Gantry-Mounted Raman Micro-scope
In collaboration with Bruker-Optics, Ettlingen and Fallanden, theauthor designed a versatile mount of a modified SENTERRARaman Microscope Spectrometer (Bruker Optik GmbH) on amobile gantry. The latter accepts large paintings with a widthof 1200 mm and a length limited only by the accessible laboratoryspace. The dispersive Raman spectrometer SENTERRA that wasused is equipped with two diode lasers operating at 532 nmwith nominally 20 mW and at 785 nm with nominally 100mW. The Raman module forms part of a split reflected-lightbrightfield/darkfield Olympus microscope BX51M.
The design of the gantry mount for the Raman microscopeis illustrated in Figs 1 and 2. All the basic features of the high-quality Raman Microscope SENTERRA are retained by mountingthe upper part of the Raman microscope, including all the opticalcomponents and the charge-coupled device (CCD) detector, on a
gantry that can be moved in two dimensions across large paintings.The following features are incorporated in the design:
1. The microscopy table on which the investigated paintingresides has an area (X/Y) of 1200/1000 mm. The gantry can bemoved manually on steel rollers and steel shafts by 850 mm inthe Y direction. The microscope itself is mounted on a carriagethat can be moved across the gantry by 1100 mm in the Xdirection, again on steel rollers moving on steel shafts. (Dueto limitations of the accessible laboratory space, the rangesof mobility in X and Y had to be slightly reduced for the firstimplementation of this design.)
2. The microscope is attached to the mobile carriage via a verticallinear translation stage (supplied by Bruker Optik GmbH). Thez-axis position can be adjusted under computer-control to anaccuracy of better than 1 µm for focusing the microscope.Autofocusing by means of a computer routine, forming partof the OPUS operating system, is also implemented.
3. The coarse positioning of the gantry can be done manually. Forachieving a positioning accuracy of 1 µm, the painting to beexamined is placed on an extended motorized and computer-controlled stage for movements in the incremental range of150 × 150 mm.
The ease of operation of the gantry-mounted Raman microscopeis virtually identical to that of a standard SENTERRA RamanMicroscope. All the essential features of a standard OlympusBX51M reflected brightfield/darkfield microscope with objectivesfrom 5× to 100× and with polarized optical observation areretained.
The instrument design is reminiscent of a SENTERRA RamanMicroscope in operation at the Metropolitan Museum inNew York. The latter incorporates also a modified mountingof the microscope part and an enlarged stage, acceptingsomewhat larger paintings than a standard Raman microscope(private communication by Marco Leona, The Metropoli-tan Museum of Art, NY 10028-0198; cf. Internet Address:http://www.cogito.org/Interviews/InterviewsDetail.aspx?ContentID=17267.).
Some Essential Construction Details
1. The design of Figs 1 and 2 allows most of the re-quired mechanical elements to be procured commer-cially. The gantry is assembled from Kanya extru-sion aluminium profile (Base 50 mm) with its propri-etary PVS extrusion connecting system (Kanya AG, CH-8630 Ruti, Switzerland, http://www.kanya.ch/global/PVS-pdf/2003 PVS engl.pdf). Also the steel rollers with ball bear-ings, running on 12-mm steel shafts, are chosen from theKanya set of building blocks. Except for the plates that carrythe steel rollers, little mechanical work arises where a pro-fessional workshop would be needed. The standard elementscan be ordered from Kanya AG, pre-cut to the proper dimen-sions. Only the z-axis motional assembly with the screw-threadmount of the spectrometer, under computer-control, was spe-cially manufactured and supplied by Bruker-Optics. The baserails, inserted into the 1080 × 1280 mm microscopy table, areusing Base 40-mm Kanya extrusion profile.
2. The motions of the gantry in the Y direction and of thecarriage in the X direction are guided by polycarbonate slidingextrusion profiles, inserted into the grooves of the aluminium
www.interscience.wiley.com/journal/jrs Copyright c© 2009 John Wiley & Sons, Ltd. J. Raman Spectrosc. 2010, 41, 275–287

27
7
In situ Raman microscopy applied to large Central Asian paintings
Figure 1. Front view of the gantry with the mounted SENTERRA Raman microscope. The mount consists of a ground plate of X/Y = 1200/1000 mm;a gantry on wheels with a free height of 500 mm; a carriage on wheels carrying the SENTERRA Raman microscope mounted on a motorized verticaltranslation stage; and a motorized measuring stage to which optionally a stage extension by Teflon-covered Plexiglas plates can be attached. Themeasuring stage can easily be removed for accommodating larger paintings.
Figure 2. Side view of the gantry with the mounted SENTERRA Raman microscope. The stage extension by two Teflon-covered Plexiglas plates and thebreaks, acting on the front wheels, mentioned in the text, are not shown.
profile, while the full load of carriage and gantry is borne by
the steel rollers. For controlling the Y motion, two adjustable
friction breaks (not shown in the drawings) have been installed.
They act directly onto the wheels on the left and right leg of
the gantry for adjusting the ease of motion and can arrest the
gantry for particularly critical measurements.
3. The stage for moving large paintings is built around a
commercial 150 × 150 mm microscope stage (supplied by
Bruker-Optics). The object table of 300×211 mm can be moved
under computer control by 150 mm in both X and Y by the
OPUS operating system. Its repeatability of positioning is better
than 1 µm. For accepting medium-size objects, such as small
thangka paintings and tsakalis, the object table is extended to
450 × 320 mm by covering it with a 5-mm aluminium plate
without measurably affecting the repeatability of positioning.
4. For the movement and for positioning of larger paintings
under computer control, the stage is extended by attaching a
900×700×6 mm Plexiglas plate. It is gliding on another equally
sized Plexiglas plate, residing on the microscopy table. Both
are covered with self-adhesive 0.25-mm PTFE fibreglass cloth
(Techflon, Technische Gewebe, D-78467 Konstanz, Germany)
for reducing the motional friction. The upper Plexiglas plate is
attached to the microscope stage (it can easily be detached by
loosening five wing-nuts, as shown in Fig. 2) and tightly follows
its motion. In this way, it is possible to move conveniently large
(up to 1000 × 700 mm) and reasonably heavy paintings (up
to 10 kg). Not unexpectedly, the repeatability of motion and
positioning of this extension is reduced, especially at the end
of the Plexiglas plate most remote from the point of fixation
to the stage.
J. Raman Spectrosc. 2010, 41, 275–287 Copyright c© 2009 John Wiley & Sons, Ltd. www.interscience.wiley.com/journal/jrs

27
8
R. R. Ernst
When working on even larger paintings, up to a maximum widthof Xmax = 1200 mm, it becomes necessary to move manuallythe Raman microscope on its gantry across the painting. Longpaintings exceeding Ymax = 850 mm, can be brought by handinto a range that can be covered by the gantry motion. Here,obviously, some convenience and reproducible positioning mustbe sacrificed. Finally, the ultimate step towards investigations ofobjects without upper size limit is to take advantage of a fibre-opticRaman probe, as described below.
Stability Limitations of the Gantry-MountedRaman Microscope
The larger the dimensions of the gantry, the longer the ‘mechanicalpathway’ from the painting detail under investigation to themicroscope objective and the more critical the stability issues. Inthe present design, the ‘mechanical pathway’ from the paintingthrough the gantry, through the carriage, and through the screw-thread mount, to the microscope and to its objective can measureup to 3 m. It requires a stability of 1 part in 3×10⁶ of the entire gantryassembly for maintaining an accuracy of positioning the objectiveto 1 µm. It is indeed amazing that under ‘regular’ conditions thenecessary stability is met without difficulty. But ‘irregular’ eventsmay occur that may affect adversely stability. For example, it isnot permitted to touch during a measurement the microscopytable on which the gantry is residing or to stamp on the floor ofthe spectroscopy room. External vibrations, arising, for example,from construction work using heavy machinery, may also seriouslyaffect stability and performance. The construction of a new motorroad 100–300 m away caused serious perturbations. On ‘bad days,’the measurement had to be postponed until evening after theworkers’ closing time! Sometimes, minor motions are tolerable,leading to spatially averaged chemical compositions, which arenot undesirable. Installing the gantry on a vibration-isolatedoptical table would certainly ease the operation of the Ramanmicroscope. Fortunately, Raman spectroscopy is less sensitive tomotional artefacts than visual imaging; and excellent results couldbe obtained in the past without an optical table.
It was found that the halogen illumination lamp of the Olympusmicroscope can cause temperature effects on the focus and induceslow positional shifts of up to 20 µm in X and 40 µm in Y. Obviously,these drifts can be prevented by applying constant illuminatingpower during the entire experiment, reducing the drifts to lessthan 3 µm per hour in both directions.
In this paper, all indications of the laser power refer to powerlevels measured in front of 10× objectives by a LaserCheck powermeter from Coherent Inc. The ratios R of the measured laser powerto the ‘nominal’ laser power indicated by the OPUS operatingsystem of the SENTERRA Raman microscope are as follows: redlaser at 785 nm for the SENTERRA microscope: RS785 = 0.44 andfor the UNILAB Raman probe: RU785 = 0.22; green laser at 532 nmfor the SENTERRA microscope: RS532 = 0.67.
Application to Pigment Analysis of a ThangkaPainting from Buriatia That Includes ThreeArsenic Sulfides
The utility of the gantry-mounted SENTERRA Raman microscopeis demonstrated by a pigment study of an ancient painting
Figure 3. Thangka painting (ET98) from 19th century Buriatia depictingthe ‘Western Paradise’, Sukhavati, with Buddha Amitabha in his palacesurrounded by monks and reborn souls. In the lower half, two ‘soulboats’ are paddled by ferrymen across a lake into the Western Paradise.Below are shown two processions of monks and musicians, surroundingtwo appearances of the living Buddha Sakyamuni. The areas selected forRaman measurements, mentioned in the text, are marked by numberedrectangles.
from Buriatia, Southern Siberia. An accidental finding was themotivation for putting a special focus on arsenic-based pigments.More comprehensive studies of pigments in historical CentralAsian paintings will be described in further publications.
Thangka paintings represent a most remarkable expression ofMahayana Buddhist tradition.[32 – 36] Thangkas are painted on acanvas, usually consisting of cotton, sometimes also of linen orsilk. At first, the canvas is primed by applying a ‘gesso’ consistingof chalk, gypsum, or clay components. The binding mediumfor painting in distemper is hide glue, i.e. gelatine, preparedfrom the skins or bones of local animals, such as yaks.[37] Thepigments consist primarily of finely powdered inorganic minerals,supplemented by a few organic dyes from plants. Some syntheticpigments, such as red lead, have been prepared already sinceancient times by chemical procedures. The scroll paintings withtheir fragile surfaces, sensitive to humidity, are frequently rolled forstorage and transports. Correspondingly, they often show seriousdamage by abrasion and require special care in conservation.
The thangka painting from Buriatia (designation: ET98) to beanalysed is shown in Fig. 3. It depicts Buddha Amitabha in his
www.interscience.wiley.com/journal/jrs Copyright c© 2009 John Wiley & Sons, Ltd. J. Raman Spectrosc. 2010, 41, 275–287

27
9
In situ Raman microscopy applied to large Central Asian paintings
palace in the centre of the Western Paradise, called Sukhavati, adesirable place into which deceased Buddhist believers hope to bereborn. The painting was published in Ref. [38]. The philosophicaland psychological significance of its contents are analysed inRef. [39]. The painting, dealing with the process of rebirth, is quiteremarkable by the unique appearance of two ‘soul-boats,’ eachwith a ferryman who paddles the souls of diseased Buddhistsacross a sacred lake, a reminder of Lake Baikal, into the WesternParadise. Some souls are being reborn into the Western Paradise,emerging from lotus flowers, the symbol of the origin of life,as is visible in the lower centre of Fig. 3. In the bottom part,two processions with monks and musicians, each with BuddhaSakyamuni in their midst, are shown. The strict symmetrical andgeometrical arrangement of many details is a characteristic for theBuriatian painting style and differentiates itself from those of otherareas of Central Asia, which prefer a more freely conceived design.
Buriatia is a rather latecomer in the Buddhist painting traditionwith the earliest preserved paintings stemming from the 17thcentury. Most of the paintings that have survived originate fromthe 18th or 19th century. For the dating of the present painting,Raman spectroscopy will be of further help.
The Raman measurements on this thangka were made withoutremoving the covering mineral glass of the painting, using a long-distance MPlan N 10×/0.25 Olympus objective with a workingdistance of 10.6 mm. Thus, the preparations for the measurementswere minimal. The painting with its frame measures 750×560 mm.Much larger paintings have been explored recently with the sameset-up.
Blue pigment
The blue pigment, dominating the sky and background, wasfound to be Prussian blue, Fe4[Fe3(CN)6]3·14–16H2O. Prussian blueexhibits in the Raman spectrum of Fig. 4(A) a solitary characteristicpeak at 2154 cm−1. Prussian blue is known to be a poor Ramanscatterer, and the peak is invariably very weak and often notdiscernable within the rather strong fluorescence background.However, when visible, the peak can hardly be misinterpreted andclearly indicates the presence of this pigment in the painting. It iswell known that Prussian blue was synthesized for the first time in1704 by the colourist H. Diesbach in Berlin. It is also documentedthat Prussian blue was manufactured, among many other places,in Gorodets, Western Siberia, even before 1778.[40] It is thereforepossible that this pigment has found its way from Gorodets toBuriatia and into the present painting. A dating of the thangka tothe 19th century, probably to its first half, appears to be reasonable,also based on its characteristic painting style.
Red pigment
The red pigment, applied abundantly to this painting, is cinnabar,HgS, a very common pigment that occurs virtually in any colouredpainting across entire Central Asia.
White pigment
The white pigment in this painting is lead white,(PbCO3)2·Pb(OH)2.[41] It was applied, for example, for colouringthe two soul boats as is verified by Fig. 4(B). In addition, it was alsomixed with other pigments. For example, the blue areas (Fig. 4(A))invariably contain some lead white for adjusting the tint of therather dark Prussian blue.
In the course of this study, it was found that lead white is quitesusceptible to damage by laser power, more than other pigments.Especially, the mixture of lead white and Prussian blue in theareas of sky and background could easily be impaired by the laserbeam, as is demonstrated by Fig. 4(A). With laser power of 1.3 mWat 532 nm, no damage could be observed. However, irradiationby 3.4 mW at 532 nm for 20 s leads already to a significantattenuation of the lead white band at 1050 cm−1 and of thePrussian-blue band at 2154 cm−1, as well. At the same time, twonew Raman signals emerge at 143 and 289 cm−1. These Ramanbands closely correspond to massicot, which is orthorhombic PbO,possibly with a contribution from litharge, which is tetragonalPbO. The laser-induced decomposition reaction appears to be(PbCO3)2·Pb(OH)2 →3PbO + 2CO2 + H2O. Visually, the paint layeris not damaged; and no ‘hole burning’ occurs. The characteristiclead white peak at 1050 cm−1 is often very weak (Fig. 4) anddifficult to discern. On the other hand, the photodegradationproducts are exhibiting Raman bands of much higher intensityand may indicate the presence of lead white, even when the leadwhite band itself remains obscure.
It is revealing to compare the behaviour of lead white in thepresence of Prussian blue with ‘pure’ lead white, as applied, forexample, for the colouring of the soul boats. Figure 4(B) (blue line)shows clearly a lead white band at 1050 cm−1. It was found thata 30-s irradiation of 3.4 mW at 532 nm reduces the backgroundfluorescence level by 50%; further irradiation of 6.7 mW at 532 nmduring 30 s cuts fluorescence by another 10%. But the Ramanbands remain, so far, unaffected. Only when the laser power isincreased to 13.4 mW for 20 s, the decomposition of lead whitesets in with new resonance bands appearing at 143, 289, and385 cm−1. The variable relative band intensities in Fig. 4(A) and (B)suggest that the laser-induced decomposition of lead white leadsto a mixture of lead oxides, predominantly containing massicotand litharge.
Lead white purum, as purchased from Fluka Company, productno. 15323, could not be damaged at all by the available laserpower. However, heating to 270 ◦C on a heat stage leads to asimilar decomposition, producing Raman bands at 143 (vs), 289(s), 336 (m), and 385 cm−1 (w). This suggests again the presenceof massicot and litharge. A careful study of the photodegradationof lead white and of lead oxides has been published by Burgioet al.[42] Similar observations have also been made by De Santiset al.[43] in a study of laser-induced degradation of pigments. Theseauthors also stress the importance of Prussian blue in promotingthe photodegradation of lead white, in agreement with the presentaccidental findings.
From surface-analytical measurements, it has been concludedby other authors that ‘laser-induced discolouration’ of lead whiteleads to the appearance of an altered surface layer containingelemental lead.[44,45] This process cannot be excluded by thepresent Raman measurements. However, the appearance of leadoxides by the degradation of lead white seems to be more relevantin the context of Raman studies.
Green pigments
The green aura of Amitabha is painted with malachite,Cu2CO3(OH)2, a very traditional green pigment, used widely inTibet and China. Often, green is obtained by mixing blue andyellow pigments. In South Asia, normally a mixture of indigoand orpiment, As4S6, is used for producing a warm green tone.This green is very abundant in paintings from India and Nepal,
J. Raman Spectrosc. 2010, 41, 275–287 Copyright c© 2009 John Wiley & Sons, Ltd. www.interscience.wiley.com/journal/jrs
28
0
R. R. Ernst
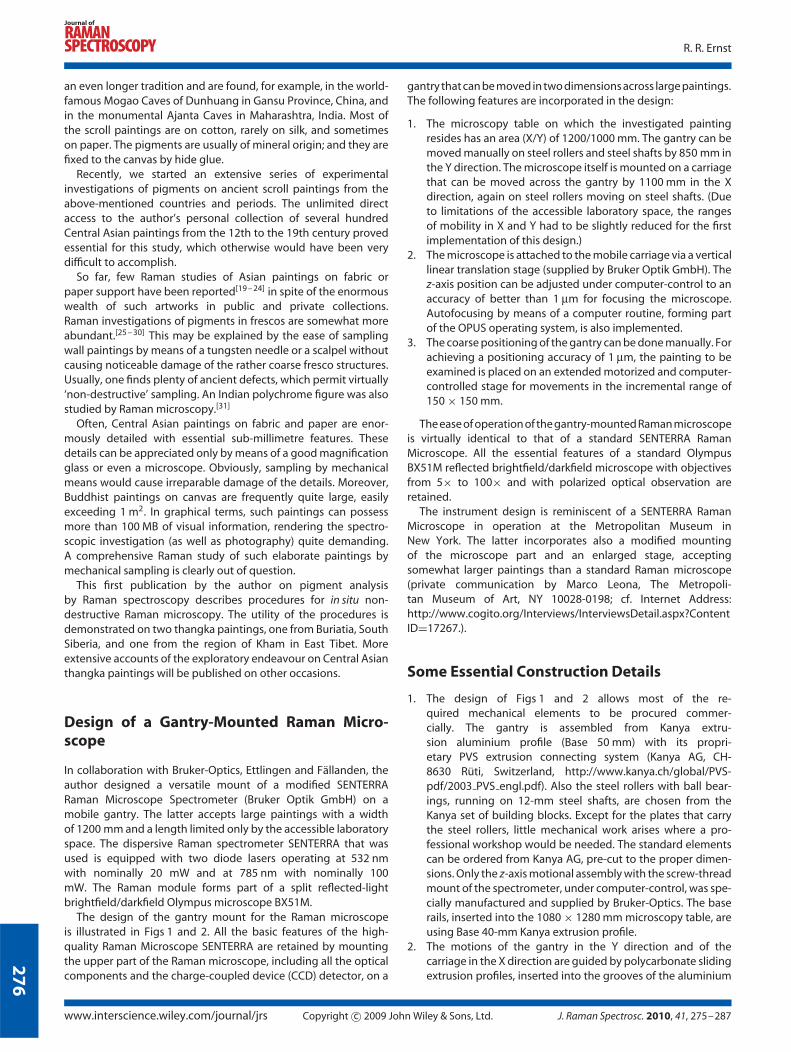
Figure 4. Decomposition of lead white by laser irradiation. (A) Area of blue background in thangka of Fig. 3 (marked �1). The spectrum recorded with10 × 2 s scans of 1.3 mW at 532 nm (blue line) shows a Prussian blue peak at 2154 cm−1 and a lead white peak at 1050 cm−1. Both peaks are notoriouslyweak and often not discernible. After continuous irradiation for 20 s with 3.4 mW at 532 nm, a second spectrum, recorded under the same conditions,(red line) reveals additional strong peaks at 143 and 289 cm−1, indicating the partial conversion of lead white into massicot. (B) Area of white soul boatin thangka of Fig. 3 (marked �2). Spectrum recorded with 10 × 2 s scans of 1.3 mW at 532 nm (blue line) reveals a lead white peak at 1050 cm−1. Afterirradiation with 13.4 mW at 532 nm for 20 s, a spectrum recorded under the same conditions (red line) shows strong peaks at 143, 289, and 385 cm−1 thatcorrespond to massicot. The Prussian blue and lead white peaks are attenuated. Pure lead white shows no decomposition under the same conditions.
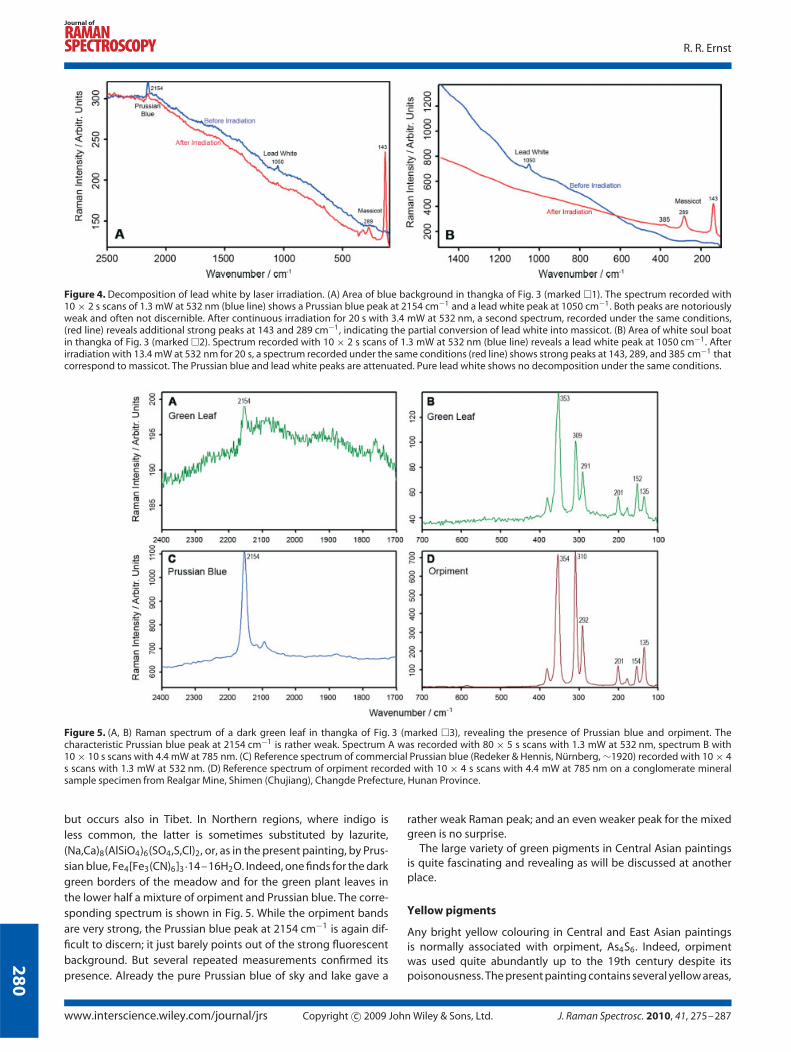
Figure 5. (A, B) Raman spectrum of a dark green leaf in thangka of Fig. 3 (marked �3), revealing the presence of Prussian blue and orpiment. Thecharacteristic Prussian blue peak at 2154 cm−1 is rather weak. Spectrum A was recorded with 80 × 5 s scans with 1.3 mW at 532 nm, spectrum B with10 × 10 s scans with 4.4 mW at 785 nm. (C) Reference spectrum of commercial Prussian blue (Redeker & Hennis, Nurnberg, ∼1920) recorded with 10 × 4s scans with 1.3 mW at 532 nm. (D) Reference spectrum of orpiment recorded with 10 × 4 s scans with 4.4 mW at 785 nm on a conglomerate mineralsample specimen from Realgar Mine, Shimen (Chujiang), Changde Prefecture, Hunan Province.
but occurs also in Tibet. In Northern regions, where indigo isless common, the latter is sometimes substituted by lazurite,(Na,Ca)8(AlSiO4)6(SO4,S,Cl)2, or, as in the present painting, by Prus-sian blue, Fe4[Fe3(CN)6]3·14–16H2O. Indeed, one finds for the darkgreen borders of the meadow and for the green plant leaves inthe lower half a mixture of orpiment and Prussian blue. The corre-sponding spectrum is shown in Fig. 5. While the orpiment bandsare very strong, the Prussian blue peak at 2154 cm−1 is again dif-ficult to discern; it just barely points out of the strong fluorescentbackground. But several repeated measurements confirmed itspresence. Already the pure Prussian blue of sky and lake gave a
rather weak Raman peak; and an even weaker peak for the mixedgreen is no surprise.
The large variety of green pigments in Central Asian paintingsis quite fascinating and revealing as will be discussed at anotherplace.
Yellow pigments
Any bright yellow colouring in Central and East Asian paintingsis normally associated with orpiment, As4S6. Indeed, orpimentwas used quite abundantly up to the 19th century despite itspoisonousness. The present painting contains several yellow areas,
www.interscience.wiley.com/journal/jrs Copyright c© 2009 John Wiley & Sons, Ltd. J. Raman Spectrosc. 2010, 41, 275–287

28
1
In situ Raman microscopy applied to large Central Asian paintings
Figure 6. Raman spectrum of yellow area, marked �4 in Fig. 3, fitting perfectly to a spectrum of pararealgar. Instead, orpiment would have been expected!The spectrum was recorded with 10 × 2 s scans and 4.4 mW at 785 nm. The reference spectrum of pararealgar was obtained with 10 × 4 s scans and 4.4mW at 785 nm on a mineral sample specimen from Realgar Mine, Shimen (Chujiang), Changde Prefecture, Hunan Province.
Figure 7. Raman spectrum of the orange cloth of Amitabha (black line), marked �5 in Fig. 3, showing the presence of red lead and, surprisingly, of realgarfor adjusting the tint. The spectrum was recorded with 50 × 2 s scans with 4.4 mW at 785 nm. The reference spectrum of red lead (Kremer no.4250) (redline) was recorded with 10 × 4 s scans with 4.4 mW at 785 nm. The reference spectrum of realgar (orange line) was recorded with 10 × 4 s scans with 4.4mW at 785 nm on a mineral sample specimen from Realgar Mine, Shimen (Chujiang), Changde Prefecture, Hunan Province.
such as the framework of the five temples, the two yellow monks inthe lower procession, and the yellow part of the two-coloured scarpleft and right of the vase in the bottom centre. They all exhibit thesame Raman spectrum, shown by the red line in Fig. 6. Surprisingly,this spectrum does not fit the expected spectrum of orpiment,As4S6. However, it closely matches the spectrum of pararealgarwith the formula As4S4, represented in Fig. 6 by the black line.Pararealgar is a light yellow to orange-brown mineral found atnumerous places, for example in British Columbia, Canada, butalso in China and in Central Asia.
It has often been emphasized that pararealgar results from asun-light-induced conversion of the better known but less stablerealgar, As4S4, an orange-red mineral. Because the application ofpararealgar as a pigment in Central Asian scroll paintings was so farvirtually unknown, it would be tempting to attribute its presenceto this light-induced degradation of realgar. To check for a possiblesun-light effect, a Raman depth profile was recorded. It did not
show the slightest variation throughout the entire paint layer inall three dimensions. It is thus likely that, indeed, pararealgar wasused as a veritable yellow pigment in this painting, replacing themore common orpiment. The reason for the painter’s preferenceis unknown.
So far, only rare occasions around the globe have been reportedin literature where pararealgar was applied as a pigment. InWestern paintings, the most remarkable findings, to the author’sknowledge, refer to a painting in the Winnipeg Art Gallery (Canada),which has been tentatively attributed to the School of Titian[46] , andto a painting by Tintoretto (1518–1594) ‘The Dreams of Men.’[47]
In a 13th century Byzantine illuminated manuscript, all threepigments: i.e. orpiment, realgar, and pararealgar, were discovered;and is argued by the authors that the painter purposely tookadvantage of the colour shades of the three arsenic sulfides.[48,49]
Further observations of pararealgar have been made on anEgyptian papyrus,[50] in Iraqi stuccoes from Samarra,[51] and within
J. Raman Spectrosc. 2010, 41, 275–287 Copyright c© 2009 John Wiley & Sons, Ltd. www.interscience.wiley.com/journal/jrs
28
2
R. R. Ernst
illuminations of 16th to 18th century Islamic manuscripts.[52] Theauthor is aware of only a single report on the usage of pararealgaras a pigment in Central Asian painting art.[28] It refers to muralpaintings within a 15th century Buddhist temple in Nepal wheregilding was applied to a priming layer consisting of pararealgarand small amounts of orpiment. In all these cases, the questionwas raised whether pararealgar might arise as a photodegradationproduct of realgar or as an autonomous pigment.
The painting from Buriatia exhibits yet another yellowishpigment in the rows of tiles of the five temples, the frame ofthe painting, the two ladders, and the lower part of the dress ofAmitabha (Fig. 3). Orpiment was expected again, although the tintis a little bit too brownish. Raman scattering revealed, however, aspectrum with only two rather weak bands at 143 and 1052 cm−1.The latter peak corresponds undoubtedly to lead white. The peakat 143 cm−1, on the other hand, must be responsible for theyellowish tint. Tentatively, we assign it to a low concentration ofmassicot, orthorhombic PbO. It is rather unlikely that the yellowcolour is the result of degrading of lead white, as discussed above;the mentioned areas need to be yellowish for functional reasonsand cannot have been painted in white originally.
The painting of Fig. 3 is indeed remarkable by the extensiveusage of pararealgar. Not many other paintings are known withsuch a large-scale application of this rather unusual pigment.
Just before completion of this study, the author discoveredaccidentally pararealgar in yet another thangka painting (paintingdesignation: ET830), showing as the central figure the deity ofdeath, Yama on a bull, accompanied, as usual, by his sisterYami. It was acquired from Ulaanbaatar, Mongolia. A possibleorigin of the painting, or of the applied yellow pigment, fromneighbouring Buriatia cannot be excluded nor confirmed. Thepainting is remarkable by the fact that the two yellow pigmentspararealgar and orpiment are used side by side, orpiment witha little bit more brownish shade. Again, a Raman depth profilewas taken without any significant depth variation. Although byRaman microscopy a few grains of realgar were accidentally foundin the pararealgar layer, it is likely again that pararealgar wasthe originally applied pigment. This opinion is supported by thefact that orange tints in other parts of the painting are achievedby a variable mixture of orpiment and cinnabar, for example inthe yellow-orange flames of the fierce deities. Thus there wasno obvious need for another orange pigment, such as realgar.Based on further pigments found in this painting and on stylisticconsiderations, ET830 is likely to originate from the late 18thcentury.
Orange pigments
Orange-red shades in thangka paintings are usually producedby the ancient synthetic pigment red lead,[53] Pb3O4, which isoccasionally mixed with red cinnabar, HgS, to adjust its tint.Surprisingly, however, for this painting, red lead was blended withrealgar. For example, the orange-red cloth of Buddha Amitabhais painted with this mixture. The addition of realgar leads to arather subtle change in tint that was obviously essential to thepainter. The corresponding Raman spectrum is shown in Fig. 7and compared with the reference spectra of its two components.
It appears that the skilled Buriatian painter had a large variety ofpigments at hand, including the three arsenic sulfides mentioned.A priori, it is not possible to exclude the possibility of their syntheticorigin. Several recipes are known for the synthesis of orpiment andrealgar.[54] They start all with arsenic trioxide (As2O3) and sulfur.
Normally, the synthetic product contains a significant remainderof white arsenic trioxide. The latter possesses a characteristicRaman spectrum with a very strong peak at 372 cm−1 andtwo peaks at 271 and 563 cm−1. None of these was found inthe present spectra. It is thus likely that the pigments havea mineral origin. Well-known mineral deposits in Russia, whichcould have supplied orpiment, realgar, and pararealgar, are theElbrusskiy mine in the Northern Caucasus and mines of Yakutia inSiberia.
As a side line, it may be mentioned that orpiment is also anunstable pigment. It can decompose, in time, into arsenic trioxideand sulfur. Both decay products form pronounced (cubic andorthorhombic, respectively) crystals that are, sometimes, wellvisible in ancient paintings. They may give the yellow areas aglittering appearance as if mica had been incorporated into thepaint. This explanation of a widely observed phenomenon waspublished first by Leona and Jain.[21] The remarkable glitteringeffect is thus due to aging of the pigment and was not causedby purpose. It can also be seen in several ancient paintings withinthe author’s personal collection.
An Alternative Solution: the Fibre-Optic Ra-man Probe
A newly developed Raman Video Probe, the ‘UNILAB Probe’, waspurchased recently from Bruker Optics for remote Raman studiesof pigments in paintings that cannot easily be transported tothe stationary Raman microscope. A fibre-optic light guide of50 µm diameter feeds the laser beam of the SENTERRA Ramanmicroscope to the UNILAB Probe, while a light guide of 300 µmdiameter carries the Raman signal back to the Raman microscope.Two light guides with a length of 30 m were acquired in orderto allow for convenient measurements also in other exhibitionrooms, even on other floors of the building without having tomove the Raman microscope. The purchased Raman probe can beused, however, only for the red 785-nm laser.
The UNILAB Probe is equipped with a digital camera thatgenerates a 720 × 576 pixel colour image of the sampled area.For operational convenience, it is necessary to place a secondcomputer in direct vicinity of the UNILAB Probe for localizing asuitable measurement spot on the painting and for checking thefocusing. A DELL X1 laptop was installed on the mount of theUNILAB Probe. In this way, a photographic image of the sampledarea can be recorded. It is possible, in principle, to operate theSENTERRA Microscope computer remotely from the front-endcomputer; but such a feature has not yet been implemented,without causing too much operational inconvenience.
The UNILAB Probe incorporates standard infinity-correctedoptics with an RMS 25-mm thread. The measurements describedbelow utilize a 10×/0.20 Zeiss Epiplan objective No. 442930 witha convenient working distance of 18.5 mm. Other objectives canbe used as well. In particular, the lens supplied by Bruker-Opticsfor the UNILAB Probe gives Raman signals stronger by a factor 2but has rather poor video imaging properties.
The Raman probe was mounted on a heavy Manfrotto tripod,equipped with wheels. To allow for reaching heights of up to2.5 m, a quadratic 40-mm Kanya rail profile of 1100 mm lengthwas mounted vertically on the tripod. To this rail, a horizontalside arm of 700 mm length was attached, borrowed from aSinar large-format camera system (Sinar AG, CH-8245 Feuerthalen,Switzerland). (The side arm could easily be extended by further
www.interscience.wiley.com/journal/jrs Copyright c© 2009 John Wiley & Sons, Ltd. J. Raman Spectrosc. 2010, 41, 275–287

28
3
In situ Raman microscopy applied to large Central Asian paintings
Figure 8. Photograph of the mount of the Raman UNILAB Probe (BrukerOptics) in front of the thangka ET10 of Fig. 9. A Manfrotto tripod on wheels(not visible) was vertically extended by a 40 × 40 mm Kanya rail. It holds ahorizontal arm, taken from the Sinar large-format camera module system,that carries a Sinar P Front Standard allowing the UNILAB Probe to bemoved in a controlled manner in all directions. The video image of the areasampled by a 10× objective is displayed on a Dell X1 computer screen.
Sinar system elements.) The Raman probe is attached to a SinarP Front Standard, which allows controlled movements and tilts invirtually all directions. The Raman probe can easily be mountedand detached by a single winged screw. The upper half of themount is shown in Fig. 8.
The stability of the mount was of some concern. However,it was found that the major source of instability is actually notthe tripod itself but minute movements of the floor on which
tripod is positioned; and there is little universal remedy to improvethis situation. But with some care, excellent measurements arenevertheless feasible.
Not surprisingly, the optical performance of the UNILAB Probeis somewhat reduced in comparison to direct measurements withthe stationary SENTERRA Microscope. Using the 785-nm laser witha nominal output of 100 mW, 44 mW is available at the focusof the 10×/0.25 Olympus objective being part of the SENTERRAMicroscope, while 22 mW is measured at the focus of the 10×/0.20Zeiss objective of the UNILAB Probe (measured with a LaserCheckpower meter of Coherent Inc.). Thus only a factor 2 in laser poweris lost through the 30 m of fibre-optic cable from the microscopeto the UNILAB Probe. The loss in Raman signal returning tothe microscope is larger. Measurements with the UNILAB Probeproduce a signal weaker by a factor 8 than when the same sampleis measured with the Raman microscope using the same objective.In spite of this marked loss, in many situations the sensitivity ofthe UNILAB Probe is more than adequate for obtaining excellentRaman spectra.
The application of the UNILAB Probe, described in the following,is certainly not the first reported usage of portable Raman equip-ment for pigment analysis. In Ref. [55], for example, the usage ofa Renishaw RP10 compact spectrometer and the application of aportable micro-Raman apparatus of Horiba Jobin-Yvon, Model HE,are described for characterizing pigments in medieval illuminatedmanuscripts. Another group has used a Renishaw fibre-optic Ra-man micro-probe for exploring hand-crafted wallpaper.[56] Furtherapplications of a modified Spectracode portable Raman imagingmicroscope are mentioned in Ref. [57]. Indeed, mobile Ramanprobes have become quite popular during the past years forapplication in the context of cultural heritage.
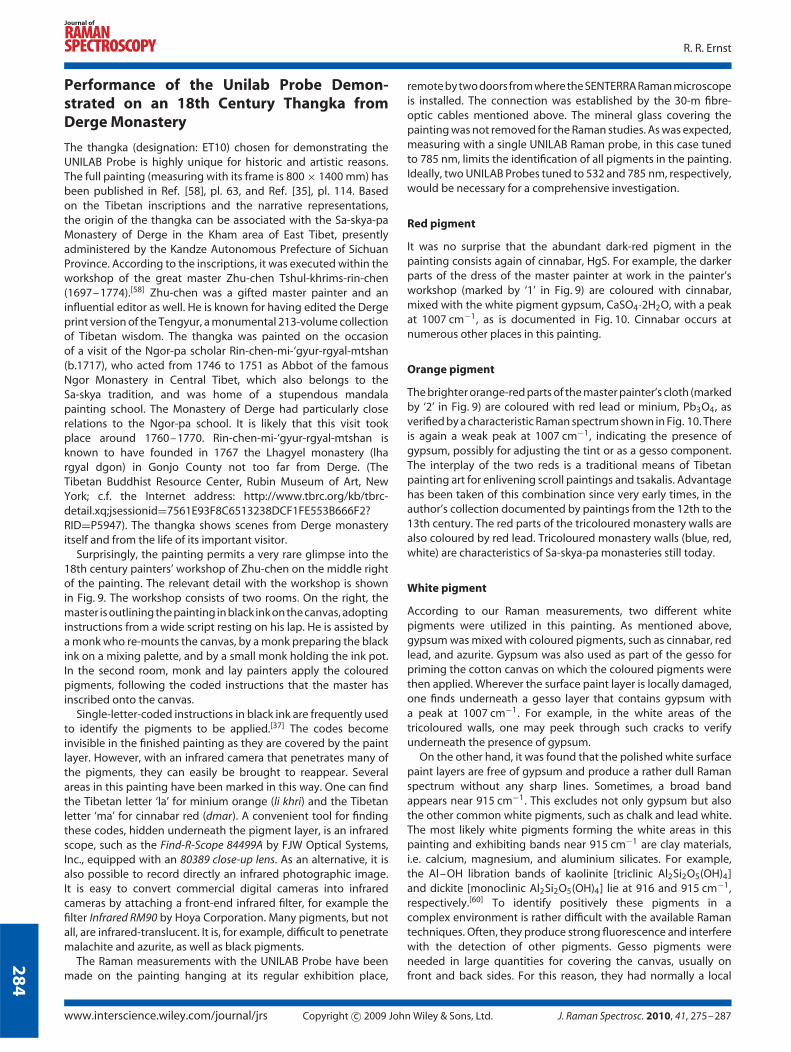
Figure 9. Detail of thangka ET10, painted in Derge monastery, East Tibet, in the workshop of the great Master Zhu-chen about 1760–1770. The entirethangka[35,58] depicts scenes from the monasterial life in Derge monastery and from the life of the Ngor-pa scholar Rin-chen-mi-‘gyur-rgyal-mtshan(b.1717). The detail displayed[59] shows the painter’s workshop with the Master Zhu chen in the room on the right, outlining the drawing for a thangka inblack ink, and in the room on the left, monk and lay disciples are filling in the colours according to the Master’s prescriptions. The areas studied by theUNILAB Probe, mentioned in the text, are numbered 1–4.
J. Raman Spectrosc. 2010, 41, 275–287 Copyright c© 2009 John Wiley & Sons, Ltd. www.interscience.wiley.com/journal/jrs
28
4
R. R. Ernst
Performance of the Unilab Probe Demon-strated on an 18th Century Thangka fromDerge Monastery
The thangka (designation: ET10) chosen for demonstrating theUNILAB Probe is highly unique for historic and artistic reasons.The full painting (measuring with its frame is 800 × 1400 mm) hasbeen published in Ref. [58], pl. 63, and Ref. [35], pl. 114. Basedon the Tibetan inscriptions and the narrative representations,the origin of the thangka can be associated with the Sa-skya-paMonastery of Derge in the Kham area of East Tibet, presentlyadministered by the Kandze Autonomous Prefecture of SichuanProvince. According to the inscriptions, it was executed within theworkshop of the great master Zhu-chen Tshul-khrims-rin-chen(1697–1774).[58] Zhu-chen was a gifted master painter and aninfluential editor as well. He is known for having edited the Dergeprint version of the Tengyur, a monumental 213-volume collectionof Tibetan wisdom. The thangka was painted on the occasionof a visit of the Ngor-pa scholar Rin-chen-mi-‘gyur-rgyal-mtshan(b.1717), who acted from 1746 to 1751 as Abbot of the famousNgor Monastery in Central Tibet, which also belongs to theSa-skya tradition, and was home of a stupendous mandalapainting school. The Monastery of Derge had particularly closerelations to the Ngor-pa school. It is likely that this visit tookplace around 1760–1770. Rin-chen-mi-‘gyur-rgyal-mtshan isknown to have founded in 1767 the Lhagyel monastery (lhargyal dgon) in Gonjo County not too far from Derge. (TheTibetan Buddhist Resource Center, Rubin Museum of Art, NewYork; c.f. the Internet address: http://www.tbrc.org/kb/tbrc-detail.xq;jsessionid=7561E93F8C6513238DCF1FE553B666F2?RID=P5947). The thangka shows scenes from Derge monasteryitself and from the life of its important visitor.
Surprisingly, the painting permits a very rare glimpse into the18th century painters’ workshop of Zhu-chen on the middle rightof the painting. The relevant detail with the workshop is shownin Fig. 9. The workshop consists of two rooms. On the right, themaster is outlining the painting in black ink on the canvas, adoptinginstructions from a wide script resting on his lap. He is assisted bya monk who re-mounts the canvas, by a monk preparing the blackink on a mixing palette, and by a small monk holding the ink pot.In the second room, monk and lay painters apply the colouredpigments, following the coded instructions that the master hasinscribed onto the canvas.
Single-letter-coded instructions in black ink are frequently usedto identify the pigments to be applied.[37] The codes becomeinvisible in the finished painting as they are covered by the paintlayer. However, with an infrared camera that penetrates many ofthe pigments, they can easily be brought to reappear. Severalareas in this painting have been marked in this way. One can findthe Tibetan letter ‘la’ for minium orange (li khri) and the Tibetanletter ‘ma’ for cinnabar red (dmar). A convenient tool for findingthese codes, hidden underneath the pigment layer, is an infraredscope, such as the Find-R-Scope 84499A by FJW Optical Systems,Inc., equipped with an 80389 close-up lens. As an alternative, it isalso possible to record directly an infrared photographic image.It is easy to convert commercial digital cameras into infraredcameras by attaching a front-end infrared filter, for example thefilter Infrared RM90 by Hoya Corporation. Many pigments, but notall, are infrared-translucent. It is, for example, difficult to penetratemalachite and azurite, as well as black pigments.
The Raman measurements with the UNILAB Probe have beenmade on the painting hanging at its regular exhibition place,
remote by two doors from where the SENTERRA Raman microscopeis installed. The connection was established by the 30-m fibre-optic cables mentioned above. The mineral glass covering thepainting was not removed for the Raman studies. As was expected,measuring with a single UNILAB Raman probe, in this case tunedto 785 nm, limits the identification of all pigments in the painting.Ideally, two UNILAB Probes tuned to 532 and 785 nm, respectively,would be necessary for a comprehensive investigation.
Red pigment
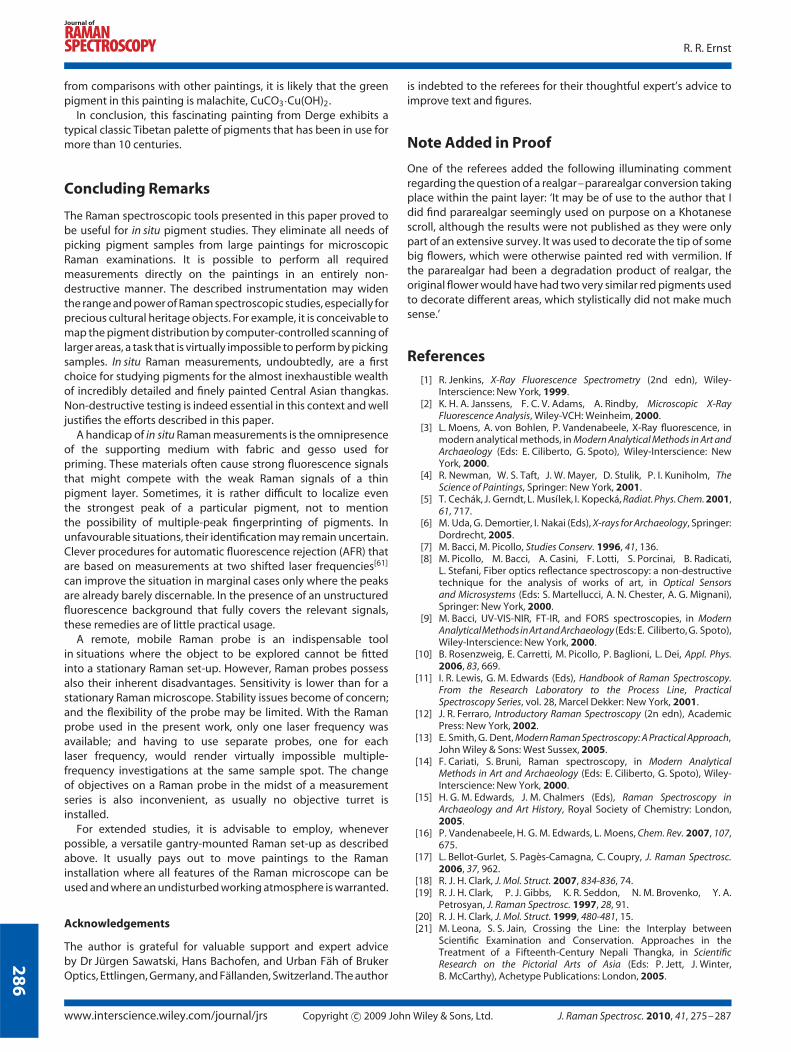
It was no surprise that the abundant dark-red pigment in thepainting consists again of cinnabar, HgS. For example, the darkerparts of the dress of the master painter at work in the painter’sworkshop (marked by ‘1’ in Fig. 9) are coloured with cinnabar,mixed with the white pigment gypsum, CaSO4·2H2O, with a peakat 1007 cm−1, as is documented in Fig. 10. Cinnabar occurs atnumerous other places in this painting.
Orange pigment
The brighter orange-red parts of the master painter’s cloth (markedby ‘2’ in Fig. 9) are coloured with red lead or minium, Pb3O4, asverified by a characteristic Raman spectrum shown in Fig. 10. Thereis again a weak peak at 1007 cm−1, indicating the presence ofgypsum, possibly for adjusting the tint or as a gesso component.The interplay of the two reds is a traditional means of Tibetanpainting art for enlivening scroll paintings and tsakalis. Advantagehas been taken of this combination since very early times, in theauthor’s collection documented by paintings from the 12th to the13th century. The red parts of the tricoloured monastery walls arealso coloured by red lead. Tricoloured monastery walls (blue, red,white) are characteristics of Sa-skya-pa monasteries still today.
White pigment
According to our Raman measurements, two different whitepigments were utilized in this painting. As mentioned above,gypsum was mixed with coloured pigments, such as cinnabar, redlead, and azurite. Gypsum was also used as part of the gesso forpriming the cotton canvas on which the coloured pigments werethen applied. Wherever the surface paint layer is locally damaged,one finds underneath a gesso layer that contains gypsum witha peak at 1007 cm−1. For example, in the white areas of thetricoloured walls, one may peek through such cracks to verifyunderneath the presence of gypsum.
On the other hand, it was found that the polished white surfacepaint layers are free of gypsum and produce a rather dull Ramanspectrum without any sharp lines. Sometimes, a broad bandappears near 915 cm−1. This excludes not only gypsum but alsothe other common white pigments, such as chalk and lead white.The most likely white pigments forming the white areas in thispainting and exhibiting bands near 915 cm−1 are clay materials,i.e. calcium, magnesium, and aluminium silicates. For example,the Al–OH libration bands of kaolinite [triclinic Al2Si2O5(OH)4]and dickite [monoclinic Al2Si2O5(OH)4] lie at 916 and 915 cm−1,respectively.[60] To identify positively these pigments in acomplex environment is rather difficult with the available Ramantechniques. Often, they produce strong fluorescence and interferewith the detection of other pigments. Gesso pigments wereneeded in large quantities for covering the canvas, usually onfront and back sides. For this reason, they had normally a local
www.interscience.wiley.com/journal/jrs Copyright c© 2009 John Wiley & Sons, Ltd. J. Raman Spectrosc. 2010, 41, 275–287

28
5
In situ Raman microscopy applied to large Central Asian paintings
Figure 10. Two Raman spectra of the dress of the master painter in the painter’s workshop of Fig. 9. The dark-red cloth (marked by ‘1’ in Fig. 9) reveals thepresence of cinnabar, blended with gypsum. The spectrum of the orange-red cloth (marked by ‘2’ in Fig. 9) shows the presence of red lead, also blendedwith gypsum. Both spectra were recorded with the UNILAB Probe, 10 × 4 s scans, and 22 mW at 785 nm. No damage by the relatively high laser powerwas noticed.
Figure 11. Black line: Raman spectrum of the mixing palette (marked by ‘3’ in Fig. 9) in use by a monk in the Master painter’s room. The spectrum showsthat the palette was painted in orpiment and carbon black (band near 1400 cm−1), representing the ink in preparation. Orange line: The Raman spectrumof the brown-yellow rim of the monastery’s wall (marked by ‘4’ in Fig. 9) revealing unambiguously orpiment. Both spectra were recorded with the UNILABProbe with 10 × 4 s scans and 22 mW at 785 nm. No damage by the relatively high laser power was noticed.
origin; and whatever white material was available has been used asa gesso. Commonly utilized gesso pigments were chalk, gypsum,and clays. For shining a clearer light on the question of these gessopigments, XRF and X-ray crystallography would be helpful.
Yellow pigment
The mixing palette of the monk helper in the Master’s workshop(marked by ‘3’ in Fig. 9) is painted in orpiment (Fig. 11). It is coveredin the centre with carbon black with a broad band near 1400 cm−1,representing the ink that is just in preparation for the Master to beapplied. For comparison, the orpiment spectrum of the yellow rimof the monastery wall (marked by ‘4’ in Fig. 9) is shown in Fig. 11.The only yellow pigment found in this painting is orpiment; realgarand pararealgar have not been detected.
Blue pigments
Blue pigments are difficult to discern with the 785-nm laseralone. Nevertheless, from measured blue areas, weak signals forazurite, 2CuCO3·Cu(OH)2, were localized at 403 cm−1. Azurite isindeed the most common traditional blue pigment in Tibet. Itdominates Tibetan paintings, except where indigo was in usethat had been brought into Tibet first by migrant painters fromNepal.
Green pigments
Green pigments are notoriously the most difficult ones to bemeasured with a 785-nm laser. Indeed, no decent signals of greenpigments could be found. However, from its appearance and
J. Raman Spectrosc. 2010, 41, 275–287 Copyright c© 2009 John Wiley & Sons, Ltd. www.interscience.wiley.com/journal/jrs
28
6
R. R. Ernst
from comparisons with other paintings, it is likely that the greenpigment in this painting is malachite, CuCO3·Cu(OH)2.
In conclusion, this fascinating painting from Derge exhibits atypical classic Tibetan palette of pigments that has been in use formore than 10 centuries.
Concluding Remarks
The Raman spectroscopic tools presented in this paper proved tobe useful for in situ pigment studies. They eliminate all needs ofpicking pigment samples from large paintings for microscopicRaman examinations. It is possible to perform all requiredmeasurements directly on the paintings in an entirely non-destructive manner. The described instrumentation may widenthe range and power of Raman spectroscopic studies, especially forprecious cultural heritage objects. For example, it is conceivable tomap the pigment distribution by computer-controlled scanning oflarger areas, a task that is virtually impossible to perform by pickingsamples. In situ Raman measurements, undoubtedly, are a firstchoice for studying pigments for the almost inexhaustible wealthof incredibly detailed and finely painted Central Asian thangkas.Non-destructive testing is indeed essential in this context and welljustifies the efforts described in this paper.
A handicap of in situ Raman measurements is the omnipresenceof the supporting medium with fabric and gesso used forpriming. These materials often cause strong fluorescence signalsthat might compete with the weak Raman signals of a thinpigment layer. Sometimes, it is rather difficult to localize eventhe strongest peak of a particular pigment, not to mentionthe possibility of multiple-peak fingerprinting of pigments. Inunfavourable situations, their identification may remain uncertain.Clever procedures for automatic fluorescence rejection (AFR) thatare based on measurements at two shifted laser frequencies[61]
can improve the situation in marginal cases only where the peaksare already barely discernable. In the presence of an unstructuredfluorescence background that fully covers the relevant signals,these remedies are of little practical usage.
A remote, mobile Raman probe is an indispensable toolin situations where the object to be explored cannot be fittedinto a stationary Raman set-up. However, Raman probes possessalso their inherent disadvantages. Sensitivity is lower than for astationary Raman microscope. Stability issues become of concern;and the flexibility of the probe may be limited. With the Ramanprobe used in the present work, only one laser frequency wasavailable; and having to use separate probes, one for eachlaser frequency, would render virtually impossible multiple-frequency investigations at the same sample spot. The changeof objectives on a Raman probe in the midst of a measurementseries is also inconvenient, as usually no objective turret isinstalled.
For extended studies, it is advisable to employ, wheneverpossible, a versatile gantry-mounted Raman set-up as describedabove. It usually pays out to move paintings to the Ramaninstallation where all features of the Raman microscope can beused and where an undisturbed working atmosphere is warranted.
Acknowledgements
The author is grateful for valuable support and expert adviceby Dr Jurgen Sawatski, Hans Bachofen, and Urban Fah of BrukerOptics, Ettlingen, Germany, and Fallanden, Switzerland. The author
is indebted to the referees for their thoughtful expert’s advice toimprove text and figures.
Note Added in Proof
One of the referees added the following illuminating commentregarding the question of a realgar–pararealgar conversion takingplace within the paint layer: ‘It may be of use to the author that Idid find pararealgar seemingly used on purpose on a Khotanesescroll, although the results were not published as they were onlypart of an extensive survey. It was used to decorate the tip of somebig flowers, which were otherwise painted red with vermilion. Ifthe pararealgar had been a degradation product of realgar, theoriginal flower would have had two very similar red pigments usedto decorate different areas, which stylistically did not make muchsense.’
References
[1] R. Jenkins, X-Ray Fluorescence Spectrometry (2nd edn), Wiley-Interscience: New York, 1999.
[2] K. H. A. Janssens, F. C. V. Adams, A. Rindby, Microscopic X-RayFluorescence Analysis, Wiley-VCH: Weinheim, 2000.
[3] L. Moens, A. von Bohlen, P. Vandenabeele, X-Ray fluorescence, inmodern analytical methods, in Modern Analytical Methods in Art andArchaeology (Eds: E. Ciliberto, G. Spoto), Wiley-Interscience: NewYork, 2000.
[4] R. Newman, W. S. Taft, J. W. Mayer, D. Stulik, P. I. Kuniholm, TheScience of Paintings, Springer: New York, 2001.
[5] T. Cechak, J. Gerndt, L. Musílek, I. Kopecka, Radiat. Phys. Chem. 2001,61, 717.
[6] M. Uda, G. Demortier, I. Nakai (Eds), X-rays for Archaeology, Springer:Dordrecht, 2005.
[7] M. Bacci, M. Picollo, Studies Conserv. 1996, 41, 136.[8] M. Picollo, M. Bacci, A. Casini, F. Lotti, S. Porcinai, B. Radicati,
L. Stefani, Fiber optics reflectance spectroscopy: a non-destructivetechnique for the analysis of works of art, in Optical Sensorsand Microsystems (Eds: S. Martellucci, A. N. Chester, A. G. Mignani),Springer: New York, 2000.
[9] M. Bacci, UV-VIS-NIR, FT-IR, and FORS spectroscopies, in ModernAnalyticalMethods inArt and Archaeology (Eds: E. Ciliberto, G. Spoto),Wiley-Interscience: New York, 2000.
[10] B. Rosenzweig, E. Carretti, M. Picollo, P. Baglioni, L. Dei, Appl. Phys.2006, 83, 669.
[11] I. R. Lewis, G. M. Edwards (Eds), Handbook of Raman Spectroscopy.From the Research Laboratory to the Process Line, PracticalSpectroscopy Series, vol. 28, Marcel Dekker: New York, 2001.
[12] J. R. Ferraro, Introductory Raman Spectroscopy (2n edn), AcademicPress: New York, 2002.
[13] E. Smith, G. Dent, Modern Raman Spectroscopy: A Practical Approach,John Wiley & Sons: West Sussex, 2005.
[14] F. Cariati, S. Bruni, Raman spectroscopy, in Modern AnalyticalMethods in Art and Archaeology (Eds: E. Ciliberto, G. Spoto), Wiley-Interscience: New York, 2000.
[15] H. G. M. Edwards, J. M. Chalmers (Eds), Raman Spectroscopy inArchaeology and Art History, Royal Society of Chemistry: London,2005.
[16] P. Vandenabeele, H. G. M. Edwards, L. Moens, Chem. Rev. 2007, 107,675.
[17] L. Bellot-Gurlet, S. Pages-Camagna, C. Coupry, J. Raman Spectrosc.2006, 37, 962.
[18] R. J. H. Clark, J. Mol. Struct. 2007, 834-836, 74.[19] R. J. H. Clark, P. J. Gibbs, K. R. Seddon, N. M. Brovenko, Y. A.
Petrosyan, J. Raman Spectrosc. 1997, 28, 91.[20] R. J. H. Clark, J. Mol. Struct. 1999, 480-481, 15.[21] M. Leona, S. S. Jain, Crossing the Line: the Interplay between
Scientific Examination and Conservation. Approaches in theTreatment of a Fifteenth-Century Nepali Thangka, in ScientificResearch on the Pictorial Arts of Asia (Eds: P. Jett, J. Winter,B. McCarthy), Achetype Publications: London, 2005.
www.interscience.wiley.com/journal/jrs Copyright c© 2009 John Wiley & Sons, Ltd. J. Raman Spectrosc. 2010, 41, 275–287

28
7
In situ Raman microscopy applied to large Central Asian paintings
[22] R. J. H. Clark, Raman microscopy in the identification of pigments onmanuscripts and other artwork, Sackler NAS Symposium) ScientificExamination of Art: Modern Techniques in Conservation and Analysis,The National Academy Press: New York, 2005.
[23] P. Vandenabeele, M. C. Christensen, L. Moens, J. Raman Spectrosc.2008, 39, 1030.
[24] L. Burgio, R. J. H. Clark, P. J. Gibbs, J. Raman Spectrosc. 1999, 30, 181.[25] J. A. Zuo, C. S. Wang, C. Y. Xu, P. Qui, G. J. Xu, H. B. Zhao, Spectrosc.
Lett. 1999, 32, 841.[26] J. Zuo, X. Zhao, R. Wu, G. Du, C. Xu, C. Wang, J. Raman Spectrosc.
2003, 34, 121.[27] X. Q. Wang, C. S. Wang, J. L. Yang, L. Chen, J. Feng, M. L. Shi, J.Raman
Spectrosc. 2004, 35, 274.[28] R. Mazzeo, P. Baraldi, R. Lujan, C. Fagnano, J. Raman Spectrosc. 2004,
35, 678.[29] R. Mazzeo, E. Joseph, V. Minguzzi, G. Grillini, P. Baraldi,
D. Prandstraller, J. Raman Spectrosc. 2006, 37, 1086.[30] N. S. Li, Y. M. Yang, N. He, Z. W. Mao, Spectrosc. Spectral Anal. 2008,
28, 946.[31] H. G. M. Edwards, E. Beale, N. C. Garrington, J.-M. Alia, J. Raman
Spectrosc. 2007, 38, 316.[32] M. M. Rhie, R. A. F. Thurman, Wisdom and Compassion, The Sacred
Art of Tibet, Asian Art Museum of San Francisco and Tibet House:New York, 1991.
[33] J. C. Singer, P. Denwood (Eds), Tibetan Art, Towards a Definition ofStyle, Laurence King Publications: London, 1997.
[34] S. M. Kossak, J. C. Singer, R. Bruce-Gardner, Secret Visions, EarlyPaintings from Central Tibet, Metropolitan Museum of Art: NewYork, 1998.
[35] A. Heller, Tibetan Art, Jaca Book, Antique Collectors’ Club: Milan,1999.
[36] J. C. Huntington, D. Bangdel, The Circle of Bliss, Buddhist MeditationalArt, Columbus Museum of Art, Columbus, Serindia Publications:Chicago, 2003.
[37] D. P. Jackson, J. A. Jackson, Tibetan Thangka Painting: Methods &Materials, Serindia Publications: London, 1984.
[38] D. Ashencaen, G. Leonov, ArtofBuriatia,BuddhistIconsfromSouthernSiberia, Spink & Sons Ltd: London, 1996.
[39] S. Hummel, Anthropos 2000, 95, 555.[40] B. H. Berrie, Prussian blue, in Artists’Pigments, A Handbook of Their
History and Characteristics (Ed.: E. W. Fitzhugh), vol.3, NationalGallery of Art: Washington, DC, 1997.
[41] R. J. Gettens, H. Kuhn, W. T. Chase, Lead white, in Artists’Pigments,A Handbook of Their History and Characteristics (Ed.: A. Roy), vol.2,National Gallery of Art: Washington, DC, 1993.
[42] L. Burgio, R. J. H. Clark, S. Firth, Analyst 2001, 126, 222.[43] A. de Santis, E. Mattei, C. Pelosi, J. Raman Spectrosc. 2007, 38, 1368.[44] P. Pouli, D. C. Emmony, C. E. Madden, I. Sutherland, Appl. Surf. Sci.
2001, 173, 252.[45] M. I. Cooper, P. S. Fowles, C. C. Tang, Appl. Surf. Sci. 2002, 201, 75.[46] M.-C. Corbeil, K. Helwig, Studies Conserv. 1995, 40, 133.[47] K. Trentelman, L. Stodulski, M. Pavlosky, Anal. Chem. 1996, 68, 1755.[48] R. J. H. Clark, P. J. Gibbs, Chem. Commun. 1997, 1003.[49] R. J. H. Clark, P. J. Gibbs, Anal. Chem. 1998, 70, 99A.[50] L. Burgio, R. J. H. Clark, J. Raman Spectrosc. 2000, 31, 395.[51] L. Burgio, R. J. H. Clark, M. Rosser-Owen, J. Archaeol. Sci. 2007, 34,
756.[52] L. Burgio, R. J. H. Clark, V. S. F. Muralha, T. Stanley, J. Raman
Spectrosc. 2008, 39, 1482.[53] E. West Fitzhugh, Red lead and minium, in Artists’Pigments, A
Handbook of Their History and Characteristics (Ed.: R. L. Feller), Vol.1,National Gallery of Art: Washington, DC, 1986.
[54] E. W. Fitzhugh, Orpiment and realgar, in Artists’Pigments, AHandbook of Their History and Characteristics (Ed.: E. W. Fitzhugh),Vol. 3, National Gallery of Art: Washington, DC, 1997.
[55] D. Bersani, P. P. Lottici, F. Vignali, G. Zanichelli, J. Raman Spectrosc.2006, 37, 1012.
[56] K. Castro, M. Perez-Alonso, M. D. Rodriguez-Laso, J. M. Madariaga,Spectrochim. Acta A 2004, 60, 2919.
[57] P. Vandenabeele, T. L. Weis, E. R. Grant, L. J. Moens, Anal. Bioanal.Chem. 2004, 379, 137.
[58] D. Jackson, A History of Tibetan Painting, Verlag der OsterreichischenAkademie der Wissenschaften: Wien, 1996.
[59] R. R. Ernst, Chimia 2001, 55, 900.[60] R. L. Frost, T. H. Tran, L. Rintoul, J. Kristol, Analyst 1998, 123, 611.[61] J. Zhao, M. M. Carrabba, F. S. Allen, Appl. Spectrosc. 2002, 56, 171A.
J. Raman Spectrosc. 2010, 41, 275–287 Copyright c© 2009 John Wiley & Sons, Ltd. www.interscience.wiley.com/journal/jrs