in situ mpas-ocean image-based...
TRANSCRIPT

In Situ MPAS-Ocean Image-based Visualization
James AhrensLos Alamos National Laboratory
Los Alamos, NM 87545Email: [email protected]
John PatchettLos Alamos National Laboratory
Los Alamos, NM 87545Email: [email protected]
Andrew BauerKitware Inc
Clifton Park, NY 12065Email: [email protected]
Sebastien JourdainKitware Inc
Santa Fe, NM 87505Email: [email protected]
David H. RogersLos Alamos National Laboratory
Los Alamos, NM 87545Email: [email protected]
Mark PetersenLos Alamos National Laboratory
Los Alamos, NM 87545Email: [email protected]
Benjamin BoeckelKitware Inc
Clifton Park, NY 12065Email: [email protected]
Patrick O’LearyKitware Inc
Santa Fe, NM 87505Email: [email protected]
Patricia FaselLos Alamos National Laboratory
Los Alamos, NM 87545Email: [email protected]
Francesca SamselUniversity of Texas at Austin
Austin, TX 78727Email: [email protected]
Abstract—Due to power and I/O constraints associated withextreme scale scientific simulations, in situ visualization andanalysis to will become a critical component to scientific discovery.The options for extreme scale visualization and analysis are oftenpresented as a stark contrast: write files to disk for interactive,exploratory analysis, or perform in situ analysis to save dataproducts about phenomena that a scientists knows about inadvance. In this video demonstrating large-scale visualizationof MPAS-Ocean simulations, we leveraged a third option basedon ParaView Cinema, which is a novel framework for highlyinteractive, image-based in situ visualization and analysis thatpromotes exploration.
I. INTRODUCTION
Extreme scale (≥ 1015 FLOPS) supercomputing is heretoday or just over the horizon. These massive computingsystems require scientist to change the manner in which theyvisualize and analyze simulation results. Until recently, data, atsomewhat smaller scales, have been primarily stored or movedto another machine for post-processing. Moving forward, thestandard post-processing techniques will not be able to effec-tively scale due to availability of storage and relatively slowincrease in both storage and network bandwidth.
In situ techniques that visualize and analyze simulation datain simulation memory show a promising path forward. Up tonow, in situ approaches typically operate on a predefined setof visualizations and analyses. In order for in situ visualizationand analysis to meet scientist needs at extreme scale, itshould: 1) preserve important elements of the simulations, 2)significantly reduce the data needed to preserve these elements,and 3) offer as much flexibility as possible for post-processingexploration.
In this video depicting a large-scale Model for PredictionAcross Scales (MPAS) Ocean simulation, we leveraged a thirdoption based on ParaView Cinema [1], which is a novelframework for highly interactive, image-based in situ visual-ization and analysis that promotes exploration. This interactiveexploration - so important to scientific discovery - is supportedin a meaningful manner (beyond simple animation of in situproducts). ParaView Cinema effectively preserves the ability tointeractively explore the same “operation space” defined at thestart of the problem, so that data elements can be combinedin much the same way they could in the original ParaViewpost-processing tool.
Fig. 1. MPAS-Ocean simulation indicating isosurfaces that represent thelocations of water masses within the ocean of temperature colored by salinity.
Imagery is on the order of 106 in size, whereas extremescale simulation data is on the order of ≥ 1015 in size.
This provides the scientist with nearly ≤ 109 images tofacilitate capture, curation, and exploration of important el-ements (features) in the simulation. ParaView Cinema is anexploration tool of a traditional in situ mode, but we samplethe visualization and analysis parameter space, such as camerapositions, operations, parameters to operations, etc. to producea set of images stored in a data-intensive database.
The simulation depicted in the video is a run of MPAS-Ocean. MPAS is a new software framework for the rapiddevelopment of climate model components on unstructuredgrids. The grids may be quasi-uniform or variable density, ona spherical or rectangular domain, and may use quadrilateralcells, triangle cells, or Voronoi tessellations. MPAS variabledensity grids are particularly well suited to regional climatesimulations. MPAS is developed cooperatively by Los AlamosNational Laboratory and the National Center for AtmosphericResearch for the purpose of decadal to century-long climatechange research, as well as short-term weather forecasting.
In particular, we are demonstrating results from the MPAS-Ocean model component, which was publicly released in2013 [2]. The visualization shows a high-resolution globalocean simulation with realistic topography, using 1.8 millionhorizontal 15 km-sized grid cells and 40 vertical levels. Oceancurrents and eddy activity compare well with observations [3].These simulations are typically run on 6000 processors, andachieve two simulated years per wall clock day. At this reso-lution, file output sizes present difficulties for traditional post-processing analysis and visualization workflows. In addition,using ParaView Cinema, the visualizations and analyses arederived from full-resolution data with high accuracy.
In Figure 1, the isosurfaces of temperature and salinityindicate the locations of water masses within the ocean.Water masses, with names like North Atlantic Deep Waterand Antarctic Bottom Water, occur within specific ranges oftemperature and salinity. These visualizations allow oceanogra-phers to view the pathways and extents of these water masses,and compare them to observed climatology. Meandering oceanjets and eddies are visible as perturbations to these visualiza-tion objects.
II. RELATED WORK
ParaView Cinema has a number of contributions, whilebuilding on a vast amount of previously disseminated results.Therefore, we quickly review related work for interactive ex-ploration databases, creating new visualizations and metadataand content searching.
Interactive Exploration Database. The large image col-lection is produced from a structured sampling of time steps,visualization operators and camera positions. One option forthe management of this large image collection is to com-press them into movies. Chen et al [4] and Kageyama andYamada [5] used this approach. ParaView Cinema extendsthese approaches by support compositing of images to createnew visualizations as well as metadata and content searching.Tikhonova et al in [6], [7], [8] represent data as a collectionof proxy images. Combining the approaches would supportadditional data compression, flexibility and exploration possi-bilities.
Creation of New Visualizations. Our approach supportsthe creation of new visualization by combining images usingdepth ordering information. Tikhonova et al [6] also supportsthe creation of new visualizations from their database using in-terpolation. When compositing images with opaque geometryresults will be pixel accurate whereas with image interpolationsome loss is expected. The idea for compositing visualizationresults evolved from the long history of parallel compositingtechniques that enable scalable interactive visualization [9].
Metadata and Content Searching. Recent work by Sub-rahmaniam [10] identifies issues and future research directionsfor multimedia databases. Responding to ParaView Cinema’sunique access patterns we created our own image database.When we create imagery in situ we save camera positions, timesteps, details about the visualization operators, and statisticsabout the data. Directly storing analysis results and how theyare created is important and encompasses our connection toprovenance systems, such as VisTrails [11].
Image content queries support querying about the visualweight of the objects in the generated visualization. Thereare many approaches to calculating the statistics of the 2Dprojection of a set of 3D objects [12]. Related to our approach,Jun Tao et al [13] computes a collection streamline images,applies an image quality metric to select an optimal viewpoint.Our approach extends this work by virtue of being in situ andour ability to change our evaluation metric dynamically witha scientist generated query.
III. APPROACH
Exploratory, interactive post-processing visualization andanalysis will still be essential for scientific discovery at extremescale. First, the debugging use-case while developing newsimulators requires exploratory visualization and analysis sup-port. Second, the collaboration use-case for colleagues withoutequal computing resources need exploratory visualization andanalysis support. Finally, the transition use-case for existingsimulators demands a transition path from terascale/petascale(1012/1015 FLOPS) to extreme scale.
A. From Simulation Data To Image Database
ParaView Cinema utilizes ParaView [14], a modern vi-sualization and analysis tool used around the world in post-processing for advanced modeling and simulation workflowsof extremely large data sets leveraging distributed memorycomputing resources.
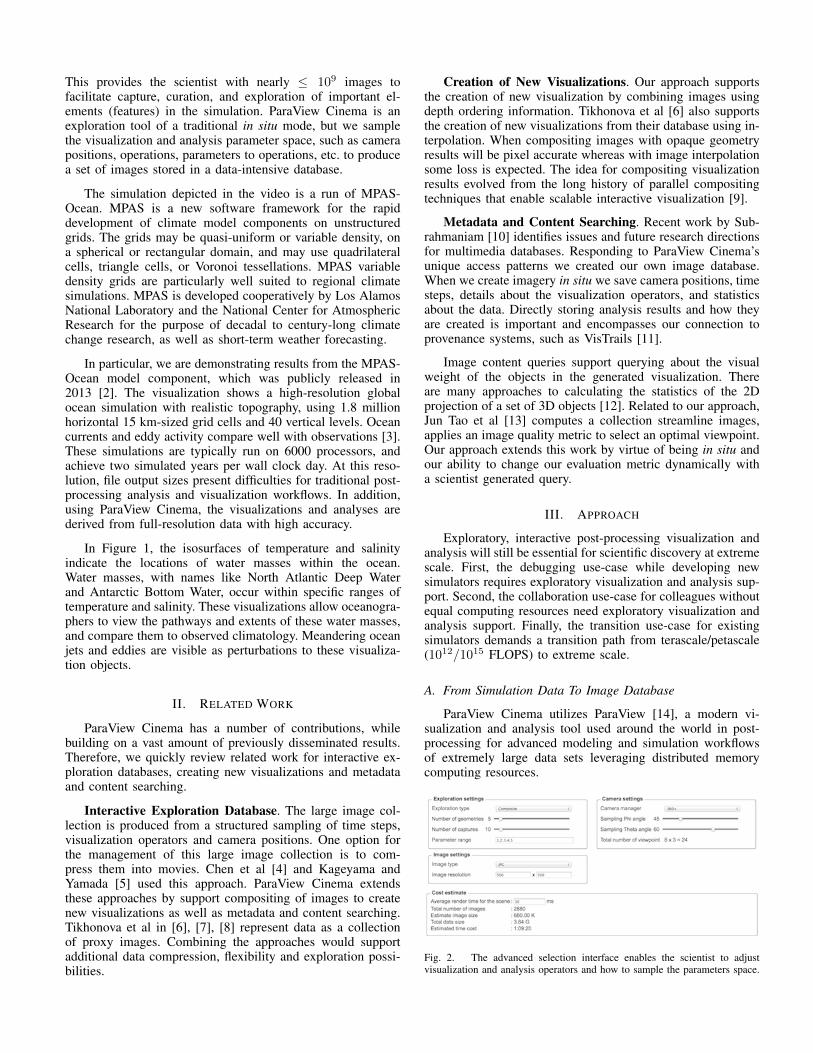
Fig. 2. The advanced selection interface enables the scientist to adjustvisualization and analysis operators and how to sample the parameters space.
When starting an analysis based on ParaView Cinema, thescientist will define a desired set of visualization and analysisoperators using a test data set and ParaView. Next, the scientistuses the advanced selection interface, shown in Figure 2, tomake sophisticated prioritized decisions for the production ofanalysis output.
Using the Exploration settings section, the scientists deter-mines: how often to perform in situ analysis, what visualizationand analysis objects to create, and how to sample the visual-ization object parameter space. The Camera settings sectionallows the scientist to describe how to sample the cameraspace by defining a camera manager, and making appropriateselections for θ and φ sampling. In the Image settings section,the scientists select the image sampling (resolution) and thethe image type ( raw data TIFF format or compressed losslessdata PNG format). The results of these choices are constantlyupdated in the Cost estimate section. The costs are reportedas the number of images, the image size, the collection size,and the additional computational time.
As simulations progress towards extreme scale, scientistswill operate in a constrained storage and bandwidth envi-ronment. Hence, the sampling of the parameter and cameraspace will require prioritization by the scientist to fit within astorage/bandwidth budget. ParaView Cinema was designed tooperate within these constraints.
The output of the advanced selection interface, see Fig-ure 2, is an in situ visualization and analysis Python scriptthat implements the defined selections. For the in situ vi-sualization and analysis, we leverage ParaView Catalyst, anopen-source in situ (and other use cases) data visualizationand analysis optimized C++ library, which includes an APIfor C, FORTRAN, Python and C++. Catalyst is designed tobe tightly coupled with simulation codes, and can be directlyembedded into parallel simulation codes to perform scalablein situ data visualization and analysis at run time.
Fig. 3. ParaView Catalyst generalizes to many simulation codes through theuse of adaptors. Adaptors translate the data structures of the simulation intoVTK-based data structures the Catalyst library can process.
Finally, as the simulation runs, the image results areingested into the database. By this we mean, that the metadata,image provenance (i.e. a search-able description of how theimage was created – the simulation, the input deck, andwhich operators were applied), and the image uniform resourcelocator (URL). There is potentially no need to move thepotentially large image data around in bulk.
B. New Visualizations and Content Querying
ParaView Cinema utilizes real-time compositing to cre-ate an experience reminiscent of interactively exploring thesimulation resulting data itself. The visualization and analysisobject compositing allows the scientist to reason about theirsimulation results from visualization space as opposed to theexplorations offered from other image space rendering andsampling tools. But it’s the user experience that significant en-hances ParaView Cinema capabilities seemingly beyond thoseavailable in traditional post-processing tools. Complicated,computationally intensive visualization and analysis algorithmsrun in constant time, from a end-user perspective, using theprecomputed images and analysis products.
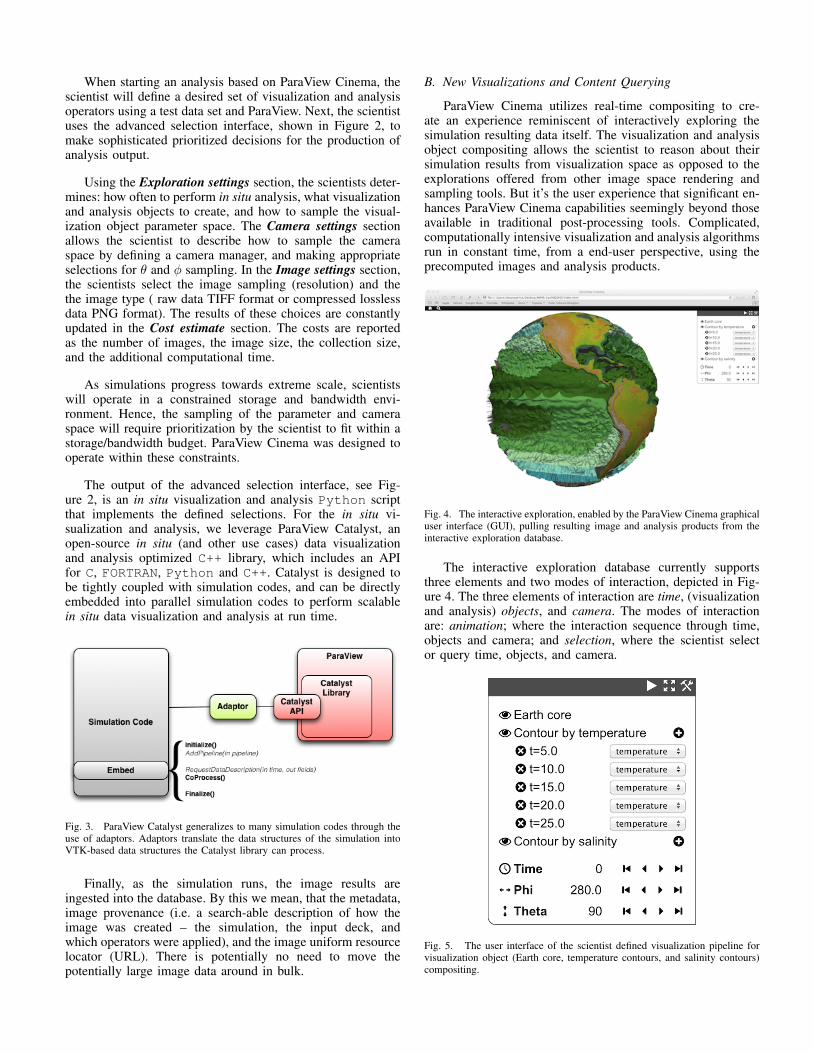
Fig. 4. The interactive exploration, enabled by the ParaView Cinema graphicaluser interface (GUI), pulling resulting image and analysis products from theinteractive exploration database.
The interactive exploration database currently supportsthree elements and two modes of interaction, depicted in Fig-ure 4. The three elements of interaction are time, (visualizationand analysis) objects, and camera. The modes of interactionare: animation; where the interaction sequence through time,objects and camera; and selection, where the scientist selector query time, objects, and camera.
Fig. 5. The user interface of the scientist defined visualization pipeline forvisualization object (Earth core, temperature contours, and salinity contours)compositing.
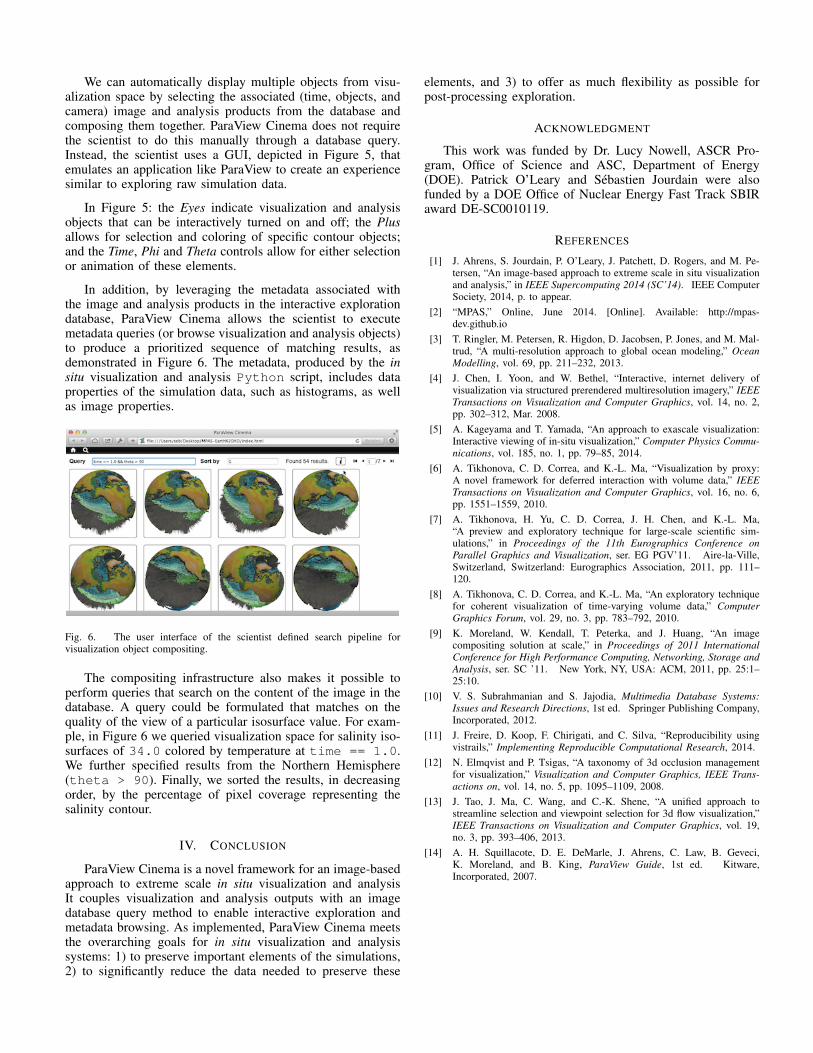
We can automatically display multiple objects from visu-alization space by selecting the associated (time, objects, andcamera) image and analysis products from the database andcomposing them together. ParaView Cinema does not requirethe scientist to do this manually through a database query.Instead, the scientist uses a GUI, depicted in Figure 5, thatemulates an application like ParaView to create an experiencesimilar to exploring raw simulation data.
In Figure 5: the Eyes indicate visualization and analysisobjects that can be interactively turned on and off; the Plusallows for selection and coloring of specific contour objects;and the Time, Phi and Theta controls allow for either selectionor animation of these elements.
In addition, by leveraging the metadata associated withthe image and analysis products in the interactive explorationdatabase, ParaView Cinema allows the scientist to executemetadata queries (or browse visualization and analysis objects)to produce a prioritized sequence of matching results, asdemonstrated in Figure 6. The metadata, produced by the insitu visualization and analysis Python script, includes dataproperties of the simulation data, such as histograms, as wellas image properties.
Fig. 6. The user interface of the scientist defined search pipeline forvisualization object compositing.
The compositing infrastructure also makes it possible toperform queries that search on the content of the image in thedatabase. A query could be formulated that matches on thequality of the view of a particular isosurface value. For exam-ple, in Figure 6 we queried visualization space for salinity iso-surfaces of 34.0 colored by temperature at time == 1.0.We further specified results from the Northern Hemisphere(theta > 90). Finally, we sorted the results, in decreasingorder, by the percentage of pixel coverage representing thesalinity contour.
IV. CONCLUSION
ParaView Cinema is a novel framework for an image-basedapproach to extreme scale in situ visualization and analysisIt couples visualization and analysis outputs with an imagedatabase query method to enable interactive exploration andmetadata browsing. As implemented, ParaView Cinema meetsthe overarching goals for in situ visualization and analysissystems: 1) to preserve important elements of the simulations,2) to significantly reduce the data needed to preserve these
elements, and 3) to offer as much flexibility as possible forpost-processing exploration.
ACKNOWLEDGMENT
This work was funded by Dr. Lucy Nowell, ASCR Pro-gram, Office of Science and ASC, Department of Energy(DOE). Patrick O’Leary and Sebastien Jourdain were alsofunded by a DOE Office of Nuclear Energy Fast Track SBIRaward DE-SC0010119.
REFERENCES
[1] J. Ahrens, S. Jourdain, P. O’Leary, J. Patchett, D. Rogers, and M. Pe-tersen, “An image-based approach to extreme scale in situ visualizationand analysis,” in IEEE Supercomputing 2014 (SC’14). IEEE ComputerSociety, 2014, p. to appear.
[2] “MPAS,” Online, June 2014. [Online]. Available: http://mpas-dev.github.io
[3] T. Ringler, M. Petersen, R. Higdon, D. Jacobsen, P. Jones, and M. Mal-trud, “A multi-resolution approach to global ocean modeling,” OceanModelling, vol. 69, pp. 211–232, 2013.
[4] J. Chen, I. Yoon, and W. Bethel, “Interactive, internet delivery ofvisualization via structured prerendered multiresolution imagery,” IEEETransactions on Visualization and Computer Graphics, vol. 14, no. 2,pp. 302–312, Mar. 2008.
[5] A. Kageyama and T. Yamada, “An approach to exascale visualization:Interactive viewing of in-situ visualization,” Computer Physics Commu-nications, vol. 185, no. 1, pp. 79–85, 2014.
[6] A. Tikhonova, C. D. Correa, and K.-L. Ma, “Visualization by proxy:A novel framework for deferred interaction with volume data,” IEEETransactions on Visualization and Computer Graphics, vol. 16, no. 6,pp. 1551–1559, 2010.
[7] A. Tikhonova, H. Yu, C. D. Correa, J. H. Chen, and K.-L. Ma,“A preview and exploratory technique for large-scale scientific sim-ulations,” in Proceedings of the 11th Eurographics Conference onParallel Graphics and Visualization, ser. EG PGV’11. Aire-la-Ville,Switzerland, Switzerland: Eurographics Association, 2011, pp. 111–120.
[8] A. Tikhonova, C. D. Correa, and K.-L. Ma, “An exploratory techniquefor coherent visualization of time-varying volume data,” ComputerGraphics Forum, vol. 29, no. 3, pp. 783–792, 2010.
[9] K. Moreland, W. Kendall, T. Peterka, and J. Huang, “An imagecompositing solution at scale,” in Proceedings of 2011 InternationalConference for High Performance Computing, Networking, Storage andAnalysis, ser. SC ’11. New York, NY, USA: ACM, 2011, pp. 25:1–25:10.
[10] V. S. Subrahmanian and S. Jajodia, Multimedia Database Systems:Issues and Research Directions, 1st ed. Springer Publishing Company,Incorporated, 2012.
[11] J. Freire, D. Koop, F. Chirigati, and C. Silva, “Reproducibility usingvistrails,” Implementing Reproducible Computational Research, 2014.
[12] N. Elmqvist and P. Tsigas, “A taxonomy of 3d occlusion managementfor visualization,” Visualization and Computer Graphics, IEEE Trans-actions on, vol. 14, no. 5, pp. 1095–1109, 2008.
[13] J. Tao, J. Ma, C. Wang, and C.-K. Shene, “A unified approach tostreamline selection and viewpoint selection for 3d flow visualization,”IEEE Transactions on Visualization and Computer Graphics, vol. 19,no. 3, pp. 393–406, 2013.
[14] A. H. Squillacote, D. E. DeMarle, J. Ahrens, C. Law, B. Geveci,K. Moreland, and B. King, ParaView Guide, 1st ed. Kitware,Incorporated, 2007.