in-season root-zone n management for mitigating greenhouse gas emission and reactive n losses in...
TRANSCRIPT

In-Season Root-Zone N Management for Mitigating Greenhouse GasEmission and Reactive N Losses in Intensive Wheat ProductionZhenling Cui, Shanchao Yue, Guiliang Wang, Fusuo Zhang, and Xinping Chen*
Center for Resources, Environment and Food Security, China Agricultural University, Beijing 100193, China
*S Supporting Information
ABSTRACT: Although both the grain yields and environmentalcosts of nitrogen (N) fertilization are gaining more public andscientific debate, the complex linkages among crop productivity, Napplication rate, environmental footprints, and the consequences ofimproved N management are not well understood. We consideredthe concept of linking greenhouse gas (GHG) emission, reactive Nlosses, and N fertilizer application rates with crop productivity todetermine the response of the GHG emission and reactive N lossesto N surplus and further evaluated the potential to reduce these Nenvironmental footprints by in-season root-zone N management. Ameta-analysis suggested an exponential increase in the response ofdirect N2O emissions and nitrate leaching to an increasing N surplus, while NH3 volatilization increased linearly with anincreasing N application rate for intensive wheat production in north China. The GHG emission and reactive N losses during Nfertilizer application increased exponentially with an increasing N surplus. By pooling all 121 on-farm experimental sites, an in-season root-zone N management strategy was shown to reduce the N application rate by 61% from 325 kg N ha−1 to 128 kg Nha−1 compared to the farmers’ N practice, with no loss in wheat grain yield. As a result, the intensity of GHG emission andreactive N losses were reduced by 77% and 80%, respectively. The intensity of GHG emission and reactive N losses can befurther reduced due to the improved N recovery and increased grain yield achieved by best crop management. In conclusion, Nrecovery efficiency and yield improvements should be used to reduce future agricultural N environmental footprints, rather thanreducing the N application rate.
■ INTRODUCTION
Worldwide, a 2.9-fold increase in nitrogen (N) fertilizationduring the past 40 years (from year 1972 to 2011) has doubledagricultural cereal crop production, thus supporting an increasein human populations.1 In the next 40 years, a 1.4-fold increasein N fertilization has been projected to double crop productionto support the estimated 2.3 billion person increase in globalpopulation and their associated dietary changes.2−4 However,the efficient use of N in agriculture has proven challenging, withless than one-half of applied N being recovered in theaboveground portion of cereal crops.5,6 With current intensivecropping systems, a large N fertilizer loss, including nitrate(NO3
−) leaching, ammonia (NH3) volatilization, and nitrous(N2O) emissions, has generated substantial environmentalproblems, such as greenhouse gas (GHG) emissions,eutrophication, soil acidification, and a loss of biodiversity.7−11
In the future, sustainable agriculture requires an understandingof the trade-offs among the environmental costs of Napplication, N fertilizer management practices, and crop yieldto develop management strategies that reduce the environmentimpacts of agricultural N, while increasing crop productivityand economic returns.The quantification of the environmental impacts of N
fertilization is receiving more public and scientific debate,including issues such as reactive N losses to the environment
(N2O, NH3, and NO3−) and GHG emission. Agriculture
accounted for approximately 60% (∼6 Tg N2O−N) of totalglobal anthropogenic emissions of N2O in 2005, largelythrough emissions from agricultural soils after application ofN fertilizer, meaning that the agricultural sector offers thegreatest potential for N2O mitigation.12 Commonly, directreactive N losses and GHG emission from N fertilization areexpressed as a function of N application, indicating that highfertilizer applications always lead to large N losses to theenvironment.13−16 However, the relationship between agro-nomic management and N losses depends on more than justthe amount of N input. Appropriate source, timing, placement,or product (slow and controlled-released fertilizer) of fertilizerN and related practice which tend to enhance crop recovery ofapplied N, increased crop yield, and could also contribute tolower reactive N losses.17 Crop health, insect and weedmanagement, moisture and temperature regimes, supplies ofnutrients other than N, and use of the best adapted cultivar orhybrid all contribute to more efficient uptake of available N andgreater conversion of plant N to grain yield, therefore reducing
Received: January 21, 2013Revised: May 7, 2013Accepted: May 10, 2013
Article
pubs.acs.org/est
© XXXX American Chemical Society A dx.doi.org/10.1021/es4003026 | Environ. Sci. Technol. XXXX, XXX, XXX−XXX

reactive N losses.5 Therefore, because of the global demand foragricultural produce, agronomic conditions, other than Napplication rate, should be included when assessing reactive Nlosses and GHG emission from N fertilization.N management practices, such as the right fertilizer N source,
rate, timing, place, and product, have been developed tomaximize crop recovery of applied N, crop yield, and farmers’profits.18 In practice, the agronomic effect of these Nmanagement practices has been widely evaluated, but anintegrated assessment of the management alternatives in termsof their ability to reduce the N environmental footprints andyet be agronomically feasible has received less attention. Formaize grown in the United States, Millar et al.16 reported thatthe maximum return to N approach could reduce N2Oemissions from fertilized row-crop agriculture by more than50%, but detailed guidance was not given. Based on some site-specific field experiments, Kim and Dale19 suggested that theappropriate N application rate could reduce the GHGemissions associated with maize grain, but more informationregarding the trade-off among grain yield, N managementpractice, and environmental impact is required for variousfarming practices.Wheat production in the North China Plain has some of the
most intensive N applications in the world, and the enrichmentof N in soil, water, and air has created serious environmentproblems.11,20,21 An in-season root-zone N managementstrategy based on a soil NO3−N content test for wheatproduction in this region has been developed to maintain thesoil N supply in the root zone within a range that matches thequantity required by the crop and to synchronize Napplications with N supply and crop N requirements.22,23
Experimental results have demonstrated that the application ofN fertilizer using this in-season root-zone N management in theNorth China Plain have been significantly reduced by 40−60%when compared with the farmers’ N practice, withoutsacrificing crop yield and also improving the nitrogen useefficiency.22,23
Clearly, the in-season root-zone N management provides theability to sustain crop yields and reduce N fertilizer applicationrates, but additional evidence is required to assess whether thisin-season root-zone N management minimizes the potentialenvironmental impacts of N fertilization. Determining this mayimprove our ability to help farmers manage N fertilizationbetter, resulting in sustainable crop yields and a reduction inagriculture’s environmental footprints. We considered theconcept of linking the N environmental footprint and Napplication rate with crop productivity and examining therelationship between N losses and surpluses (the latter isdefined as N fertilizer applied minus aboveground N uptake).Although the N surplus can be used to gauge the agronomicand environmental performance of N fertilization strategies, fewstudies have systematically evaluated the response of cropproductivity and environmental footprint to N surplus. Thisstudy evaluated grain yield, reactive N losses (N2O, NH3, andNO3
−), and GHG emission response to N surplus and thepotential of reducing the intensity of reactive N losses andGHG emission by in-season root-zone N management.
■ MATERIALS AND METHODSThe climate in the North China Plain is warm−temperatesubhumid continental monsoon with cold winters and hotsummers. The annual cumulative mean temperature for dayswith mean temperatures above 10 °C is 4000−5000 °C, and
the annual frost-free period is 175−220 days. The annualprecipitation is 500−700 mm, with about 70% of the rainfalloccurring during the summer season.24
Experimental Design and Management. Eleven in-tensive experiments were conducted during 2003−2007, inHuimin County (HM), Shandong Province. All experimentalsites received six N treatments: 0 (control), optimal N rate(ONR, see below), traditional N management (TNM), and40%, 70%, and 130% of the ONR. TNM was determined froma survey of farmers practice and set at 369 kg N ha−1 (103 and266 kg N ha−1 applied before planting and at shooting stage,respectively), which was typical for this region.23 The inclusionof below ONR treatments (40% and 70% ONR) was designedto explore the potential to further lower N fertilizer applicationrates and environmental footprints, while the above ONRtreatment (130% ONR and the TNM) was to ensure theattainment of maximum grain yield.For ONR based on in-season root-zone N management
strategy,22,23 urea application was made before the sowing ofwinter wheat and again at shooting stage according to the levelof N treatments before irrigation. The ONR in different wheatgrowth periods was determined by deducting measured soilnitrate-N content in wheat root-zone (0−30 cm and 0− 90 cmfor planting and shooting stage, respectively) from N targetvalues, which was the sum of N uptake by shoot and rootestimated by target yield and N content. A more detaileddescription about target N demand value can be found in theSupporting Information (SI). A randomized complete blockdesign was employed with four replications; each plot measuredat least 40 m2. Detailed descriptions of these experiments areprovided in the Supporting Information (SI).In total, 121 on-farm experimental sites were selected in
seven counties of three provinces, all within the North ChinaPlain region (YZ, TA, and HM in Shandong Province, YJ andHT in Shanxi Province, and XX and SP in Henan Province).Each site received three treatments: 0 (control), ONR (seeabove), and the farmer’s N practice, which was determined bythe respective producer based on their experience. Underfarmer’s N practice condition, urea N fertilizer was applied onetime before planting at 22 sites in HT, YJ, and XX counties,while at the other 99 sites, farmers applied N two times: beforeplanting and at shooting stage. Across all sites, an average of130 and 195 kg N ha−1 was applied by farmers before plantingand at shooting stage, respectively.All experimental sites were located in farmers’ fields and were
managed by farmers as a winter wheat/summer maize rotationsystem. Winter wheat was sown in early October and harvestedin mid-June. Based on soil phosphorus (P) and potassium (K)test results, all plots received appropriate amounts of triplesuperphosphate (0−150 kg P2O5 ha
−1) and potassium chloride(0−120 kg K2O ha−1) before sowing. Except for fertilizerapplication and harvesting, the plots were managed in the samemanner as the rest of the field by the individual farmer.
Data Collection. An exhaustive literature survey of peer-reviewed publications was undertaken using the ChinaKnowledge Resource Integrated (CNKI) database (Beijing,China), ISI-Web of Science (Thomson Reuters, NY, USA), andGoogle Scholar (Google Inc., Mountain View, CA, USA) toidentify articles published before December 2012. Theliterature survey focused on field measurements of N lossesin the major Chinese winter wheat-producing regions, includingNH3 volatilization, nitrate leaching, and N2O emissions. Studieshad to meet specific criteria to be included in the data set. First,
Environmental Science & Technology Article
dx.doi.org/10.1021/es4003026 | Environ. Sci. Technol. XXXX, XXX, XXX−XXXB

N losses must have been measured both during fieldexperiments and throughout the entire growing season. Second,NH3 volatilization must have been measured using themicrometeorological method25 or the German wind tunnelmethod,26 with at least two weeks after N fertilization. TheN2O emissions must have been measured using the staticchamber technique27 and were manually measured daily for 7−10 days after N fertilization, and after other events which mayhave triggered N2O gas emissions such as rainfall, irrigation, ortillage for 3−10 days, and weekly or biweekly during theremaining periods, and nitrate leaching must have beenmeasured using the suction cap or lysimeter method28 or thesoil sample method.29 Third, only studies that reported cropyields were included. The detailed information for these datawas described in Tables S1−S3.Data Analysis. Based on the literature survey, the final data
set consisted of 12 papers (14 studies and 40 observations), 7papers (15 studies and 59 observations), and 11 papers (18studies and 34 observations) for studies of direct N2Oemissions, nitrate leaching, and NH3 volatilization, respectively.The N surplus was defined as N application minus above-ground N uptake. For the studies that only reported the yieldand provided no data for N uptake, the aboveground N uptakewas calculated based on the N required to produce 1 Mg grainat different grain yield levels.30 Relationships between N2Oemission, nitrate leaching or NH3 volatilization and Napplication rate or N surplus were subjected to regressionanalysis to identify the best-fit curve from the linear orexponential models for data from the literature. The correctedR2-values were used for model selection in addition to visualinspection of each response curve type. The results revealed anexponential relationship between the N surplus and both directN2O emissions and NO3 leaching, while NH3 volatilization waslinearly correlated with the rate of N fertilizer application(Figure 1a−c).Total N2O emissions that result from anthropogenic N
inputs to agricultural soils occur through a direct pathway (i.e.,directly from the soils to which the N is added) and throughtwo indirect pathways: the volatilization of compounds such asNH3 and NOx with subsequent redeposition and throughleaching and runoff. The indirect N2O emissions can beestimated by following the IPCC methodology,31 where 1%and 0.75% of the volatilized N-NH3 and leached N-NO3 is lostas N2O−N, respectively. Based on the N loss response curves(Figure 1), we calculated direct, indirect, and total N2Oemissions per unit area, expressed as kg N ha−1. The detailed
calculation of indirect and total N2O emissions is given in theSI.The GHG emission of total N2O emissions was calculated in
units of CO2 equivalents (CO2 eq) over a 100-year time periodand was 298 times the intensity of CO2 on a mass basis.32
Using the above total N2O emissions per unit area, wecalculated the GHG emission, expressed as kg CO2 eq ha−1,and the GHG emission intensity (GHG emission per unitwheat grain yield), expressed as kg CO2 eq Mg−1. Based on theN loss response curves (Figure 1), we calculated the amount ofreactive N lost (N2O, NH3, NO3−N) to the environment,expressed as kg N ha−1, and the reactive N losses intensity(reactive N losses per unit wheat grain yield), expressed as kg NMg−1.The relative yield (RY) was calculated as the percentage of
the grain yield obtained for a given N rate to the grain yield ofthe ONR treatment at each site. For the N use efficiency, weused the N-fertilizer recovery N efficiency (REN), which isdefined as the percentage of N fertilizer recovered inaboveground plant biomass during the growing season
= − *RE (UN U0)/N 100N ([1])
where UN and U0 are crop N uptake in applied N plots andN0 plots, and N is N from the applied fertilizer.The wheat grain yield response curve to the N surplus was
subjected to regression analysis to identify the best-fit curvefrom the linear plateau, exponential, or exponential plateaumodels using the NLIN procedure in SAS for 11 extensiveexperimental sites. The response curves to the N surplus forGHG emission and reactive N losses were generated fromlinear or exponential growth models for 11 extensiveexperimental sites. Pooling data from all 132 experimentalsites and N treatments, including 11 intensive experimentalsites, and the 121 on-farm sites, the intensity of GHG emissionand reactive N losses response curves to REN were generatedfrom a linear or exponential model. The corrected R2-valueswere used for model selection in addition to visual inspection ofeach response curve.
■ RESULTSNitrogen Surplus and N Losses. By examining the
acquired data sets, direct N2O emissions and nitrate leachingwere seen to increase exponentially as the N surplus increased(P < 0.001; Figure 1a, b), while the linear model provided thebest fit for the response of NH3 volatilization to the Napplication rate (P < 0.001; Figure 1c). The linear relationship
Figure 1. Relationships between (a) direct N2O emissions, (b) N leaching with the N surplus, and (c) NH3 volatilization, and the N application ratefor winter wheat production in China. The solid line represents the relationship, and the dashed lines represent the prediction band (P = 0.95). ***indicates significance at the 0.001 level.
Environmental Science & Technology Article
dx.doi.org/10.1021/es4003026 | Environ. Sci. Technol. XXXX, XXX, XXX−XXXC
indicates a constant proportion (17%) of fertilizer N was lost asNH3 volatilization (Figure 1c). Total N fertilizer applicationsranged from 0 to 400 with a mean of 155 kg N ha−1 in studieson N2O emission, from 0 to 360 kg N ha−1 with a mean of 169kg N ha−1 in studies on nitrate leaching, and from 34 to 355 kgN ha−1 with a mean of 172 kg N ha−1 in studies on NH3volatilization (Tables S1−S3).When N fertilizer applications were equal to wheat N uptake,
direct N2O emissions and nitrate leaching were 0.54 and 13.6kg N ha−1 for N application rates of 0.34% and 8.49%,respectively. When the N surplus was 50 kg N ha−1, direct N2Oemissions and nitrate leaching increased by 37% and 57%,respectively, compared to levels when N balanced, while directN2O emissions and nitrate leaching increased by 88% and146%, respectively, when the N surplus was 100 kg N ha−1.The Response of Grain Yield, GHG Emission, and
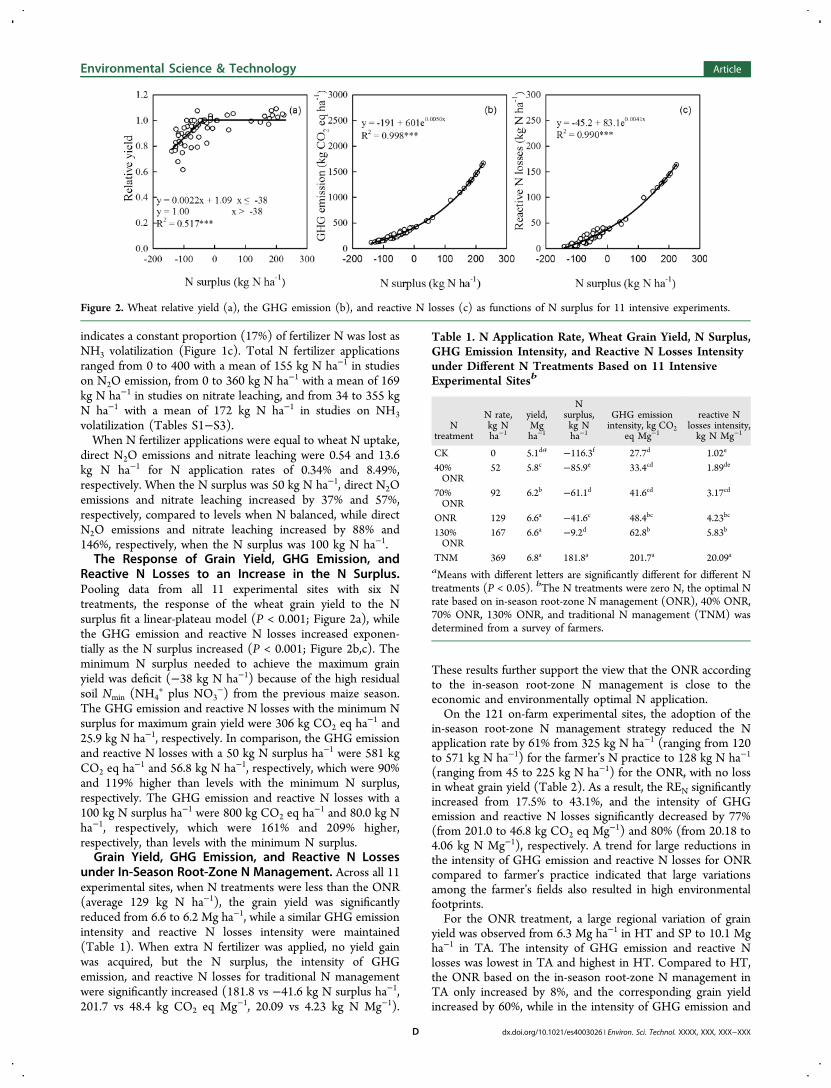
Reactive N Losses to an Increase in the N Surplus.Pooling data from all 11 experimental sites with six Ntreatments, the response of the wheat grain yield to the Nsurplus fit a linear-plateau model (P < 0.001; Figure 2a), whilethe GHG emission and reactive N losses increased exponen-tially as the N surplus increased (P < 0.001; Figure 2b,c). Theminimum N surplus needed to achieve the maximum grainyield was deficit (−38 kg N ha−1) because of the high residualsoil Nmin (NH4
+ plus NO3−) from the previous maize season.
The GHG emission and reactive N losses with the minimum Nsurplus for maximum grain yield were 306 kg CO2 eq ha−1 and25.9 kg N ha−1, respectively. In comparison, the GHG emissionand reactive N losses with a 50 kg N surplus ha−1 were 581 kgCO2 eq ha−1 and 56.8 kg N ha−1, respectively, which were 90%and 119% higher than levels with the minimum N surplus,respectively. The GHG emission and reactive N losses with a100 kg N surplus ha−1 were 800 kg CO2 eq ha−1 and 80.0 kg Nha−1, respectively, which were 161% and 209% higher,respectively, than levels with the minimum N surplus.Grain Yield, GHG Emission, and Reactive N Losses
under In-Season Root-Zone N Management. Across all 11experimental sites, when N treatments were less than the ONR(average 129 kg N ha−1), the grain yield was significantlyreduced from 6.6 to 6.2 Mg ha−1, while a similar GHG emissionintensity and reactive N losses intensity were maintained(Table 1). When extra N fertilizer was applied, no yield gainwas acquired, but the N surplus, the intensity of GHGemission, and reactive N losses for traditional N managementwere significantly increased (181.8 vs −41.6 kg N surplus ha−1,201.7 vs 48.4 kg CO2 eq Mg−1, 20.09 vs 4.23 kg N Mg−1).
These results further support the view that the ONR accordingto the in-season root-zone N management is close to theeconomic and environmentally optimal N application.On the 121 on-farm experimental sites, the adoption of the
in-season root-zone N management strategy reduced the Napplication rate by 61% from 325 kg N ha−1 (ranging from 120to 571 kg N ha−1) for the farmer’s N practice to 128 kg N ha−1
(ranging from 45 to 225 kg N ha−1) for the ONR, with no lossin wheat grain yield (Table 2). As a result, the REN significantlyincreased from 17.5% to 43.1%, and the intensity of GHGemission and reactive N losses significantly decreased by 77%(from 201.0 to 46.8 kg CO2 eq Mg−1) and 80% (from 20.18 to4.06 kg N Mg−1), respectively. A trend for large reductions inthe intensity of GHG emission and reactive N losses for ONRcompared to farmer’s practice indicated that large variationsamong the farmer’s fields also resulted in high environmentalfootprints.For the ONR treatment, a large regional variation of grain
yield was observed from 6.3 Mg ha−1 in HT and SP to 10.1 Mgha−1 in TA. The intensity of GHG emission and reactive Nlosses was lowest in TA and highest in HT. Compared to HT,the ONR based on the in-season root-zone N management inTA only increased by 8%, and the corresponding grain yieldincreased by 60%, while in the intensity of GHG emission and
Figure 2. Wheat relative yield (a), the GHG emission (b), and reactive N losses (c) as functions of N surplus for 11 intensive experiments.
Table 1. N Application Rate, Wheat Grain Yield, N Surplus,GHG Emission Intensity, and Reactive N Losses Intensityunder Different N Treatments Based on 11 IntensiveExperimental Sitesb
Ntreatment
N rate,kg Nha−1
yield,Mgha−1
Nsurplus,kg Nha−1
GHG emissionintensity, kg CO2
eq Mg−1
reactive Nlosses intensity,kg N Mg−1
CK 0 5.1da −116.3f 27.7d 1.02e
40%ONR
52 5.8c −85.9e 33.4cd 1.89de
70%ONR
92 6.2b −61.1d 41.6cd 3.17cd
ONR 129 6.6a −41.6c 48.4bc 4.23bc
130%ONR
167 6.6a −9.2d 62.8b 5.83b
TNM 369 6.8a 181.8a 201.7a 20.09a
aMeans with different letters are significantly different for different Ntreatments (P < 0.05). bThe N treatments were zero N, the optimal Nrate based on in-season root-zone N management (ONR), 40% ONR,70% ONR, 130% ONR, and traditional N management (TNM) wasdetermined from a survey of farmers.
Environmental Science & Technology Article
dx.doi.org/10.1021/es4003026 | Environ. Sci. Technol. XXXX, XXX, XXX−XXXD
reactive N losses, it decreased by 46% and 41%, respectively(Table 2).Pooling data from all 132 experimental sites and N
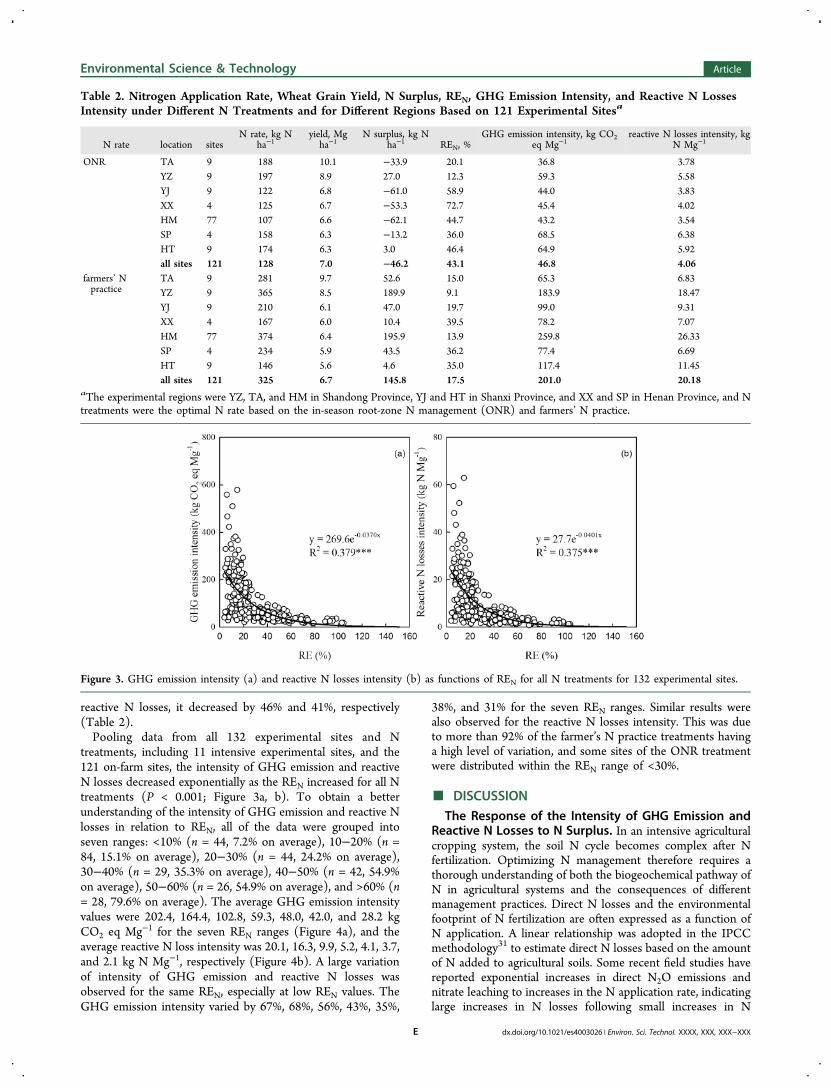
treatments, including 11 intensive experimental sites, and the121 on-farm sites, the intensity of GHG emission and reactiveN losses decreased exponentially as the REN increased for all Ntreatments (P < 0.001; Figure 3a, b). To obtain a betterunderstanding of the intensity of GHG emission and reactive Nlosses in relation to REN, all of the data were grouped intoseven ranges: <10% (n = 44, 7.2% on average), 10−20% (n =84, 15.1% on average), 20−30% (n = 44, 24.2% on average),30−40% (n = 29, 35.3% on average), 40−50% (n = 42, 54.9%on average), 50−60% (n = 26, 54.9% on average), and >60% (n= 28, 79.6% on average). The average GHG emission intensityvalues were 202.4, 164.4, 102.8, 59.3, 48.0, 42.0, and 28.2 kgCO2 eq Mg−1 for the seven REN ranges (Figure 4a), and theaverage reactive N loss intensity was 20.1, 16.3, 9.9, 5.2, 4.1, 3.7,and 2.1 kg N Mg−1, respectively (Figure 4b). A large variationof intensity of GHG emission and reactive N losses wasobserved for the same REN, especially at low REN values. TheGHG emission intensity varied by 67%, 68%, 56%, 43%, 35%,
38%, and 31% for the seven REN ranges. Similar results werealso observed for the reactive N losses intensity. This was dueto more than 92% of the farmer’s N practice treatments havinga high level of variation, and some sites of the ONR treatmentwere distributed within the REN range of <30%.
■ DISCUSSIONThe Response of the Intensity of GHG Emission and
Reactive N Losses to N Surplus. In an intensive agriculturalcropping system, the soil N cycle becomes complex after Nfertilization. Optimizing N management therefore requires athorough understanding of both the biogeochemical pathway ofN in agricultural systems and the consequences of differentmanagement practices. Direct N losses and the environmentalfootprint of N fertilization are often expressed as a function ofN application. A linear relationship was adopted in the IPCCmethodology31 to estimate direct N losses based on the amountof N added to agricultural soils. Some recent field studies havereported exponential increases in direct N2O emissions andnitrate leaching to increases in the N application rate, indicatinglarge increases in N losses following small increases in N
Table 2. Nitrogen Application Rate, Wheat Grain Yield, N Surplus, REN, GHG Emission Intensity, and Reactive N LossesIntensity under Different N Treatments and for Different Regions Based on 121 Experimental Sitesa
N rate location sitesN rate, kg N
ha−1yield, Mgha−1
N surplus, kg Nha−1 REN, %
GHG emission intensity, kg CO2eq Mg−1
reactive N losses intensity, kgN Mg−1
ONR TA 9 188 10.1 −33.9 20.1 36.8 3.78YZ 9 197 8.9 27.0 12.3 59.3 5.58YJ 9 122 6.8 −61.0 58.9 44.0 3.83XX 4 125 6.7 −53.3 72.7 45.4 4.02HM 77 107 6.6 −62.1 44.7 43.2 3.54SP 4 158 6.3 −13.2 36.0 68.5 6.38HT 9 174 6.3 3.0 46.4 64.9 5.92all sites 121 128 7.0 −46.2 43.1 46.8 4.06
farmers’ Npractice
TA 9 281 9.7 52.6 15.0 65.3 6.83YZ 9 365 8.5 189.9 9.1 183.9 18.47YJ 9 210 6.1 47.0 19.7 99.0 9.31XX 4 167 6.0 10.4 39.5 78.2 7.07HM 77 374 6.4 195.9 13.9 259.8 26.33SP 4 234 5.9 43.5 36.2 77.4 6.69HT 9 146 5.6 4.6 35.0 117.4 11.45all sites 121 325 6.7 145.8 17.5 201.0 20.18
aThe experimental regions were YZ, TA, and HM in Shandong Province, YJ and HT in Shanxi Province, and XX and SP in Henan Province, and Ntreatments were the optimal N rate based on the in-season root-zone N management (ONR) and farmers’ N practice.
Figure 3. GHG emission intensity (a) and reactive N losses intensity (b) as functions of REN for all N treatments for 132 experimental sites.
Environmental Science & Technology Article
dx.doi.org/10.1021/es4003026 | Environ. Sci. Technol. XXXX, XXX, XXX−XXXE

application at high N application rates.13,14,33 Different studieshave reported large variations in emission factors, whichunderscores the need for additional hypothesis-driven studiesto improve our understanding of how excess N inputs affectdirect N losses in N managed ecosystems.The relationship between agronomic management and N
losses depends on more than just the amount of N input. Inthese complex soil N transformations, crops can uptake andcompete for soil NH4
+ and NO3− for biomass accumulation.
When N fertilizer input is less than or closely matches croprequirements, N uptake processes can consume the N availablein the root-zone and thus limit N losses. Excessive soil N levels,which occur when N additions exceed crop requirements, canlead to nitrate accumulation and promote the production ofN2O in soil.34−36 Crop N uptake and microbial N competitionresulted in an exponential increase in the response of directN2O emissions and nitrate leaching to an increase in the Nsurplus in this study (Figure 1a,b).This N surplus approach assumes N2O emission and nitrate
leaching account for tremendous variability in the efficiencywith which applied N is used by the crop fields, crops, andregions due to difference in yield level and competence infertilizer management. This N surplus approach can be used forintensive cropping system, especially for high yield and highREN cropping system. The IPCC method to estimate N2Oemissions based on a fixed proportion of applied N inputs islikely to overestimate N loses from well-managed, high-yield,high-input systems, such as irrigated maize in Nebraska.37 IfN2O emissions are estimated based on the linear model used inthe IPCC method, the direct N2O emissions for farmer’spractice should be 3.25 kg N ha−1 and 97% higher than thelevels measured in this study; in contrast, these values are 1.28and 196% for ONR treatments (data shown in SI-3). Linquistet al.38 indicated that the global direct N2O emissions for wheatwere 1.44 kg N ha−1, which was also higher than the averagevalue from all N treatments in this study (0.78 kg N ha−1). Thelower direct N2O emissions in this study may have been due tothe limited denitrification from the low carbon levels and lowsoil moisture in most subhumid upland soils in the NorthChina Plain.20,39
For current wheat production in the North China Plain, mostNH3 volatilization from soil occurs shortly after fertilizationbecause of the high NH4
+ abundance and high pH (7.5−8) inthe regional soils, resulting in a linear response of NH3volatilization to the N application rate (Figure 1c). The NH3volatilization loss from N fertilizer was 17%, which was similarto the study of Bouwman et al.15
As an integrated assessment indicator, the GHG emissionand reactive N losses from N fertilization also exponentiallyincreased with an increase in N surplus. To the best of ourknowledge, this is the first on-farm study to report GHGemission and reactive N losses in response to N surplus. Thisexponential response of GHG emission and reactive N losses toan increase in N surplus indicated that agricultural managementpractices that reduce the N environmental footprints canmaximize the uptake of N applied to the crop while alsoachieving high yields rather than focusing on reducing the Napplication rate.
Opportunities to Reduce N Environmental FootprintIntensity. Although a large number of studies have indicatedthat improving REN can substantially reduce N losses fromsurplus N,9,40,41 the relationship between REN and the Nenvironmental footprints is not well understood. In this study,the exponential decrease of the GHG emission and reactive Nlosses with increasing REN indicated that the agronomic aim ofan increased REN is directly linked to the intensity of GHGemission and reactive N losses by minimizing direct N losses.Globally, the REN for cereal production systems ranges onlyaround 20−40% of fertilized N recovered,6,42 suggesting a highpotential to reduce the intensity of GHG emission and reactiveN losses by improving the REN. In some developing countriessuch as China, the REN for the main cereal cropping system isless than 30%.21,43
The low REN in the current cropping system is attributableto a poor synchrony between N fertilizer applications and cropdemand, and a failure to account for temporally variableinfluences on crop N needs.22,43 To achieve satisfactoryagronomic performance while minimizing negative environ-mental impact, N fertilization recommendations must considerthe dynamics between N supply from the soil and N demandby the crops through the right fertilizer N source, rate, timing,
Figure 4. GHG emission intensity (a) and reactive N losses intensity (b) of all the N treatments at different REN ranges for 132 experimental sites.Solid and dashed lines in this figure indicate the median and mean, respectively. The box boundaries indicate the 75% and 25% quartiles, the whiskercaps indicate the 90th and 10th percentiles, and the circles indicate the 95th and 5th percentiles.
Environmental Science & Technology Article
dx.doi.org/10.1021/es4003026 | Environ. Sci. Technol. XXXX, XXX, XXX−XXXF

and place.5,21 In this study, the ONR determined according tothe in-season root-zone N management indicated that ONRcould meet crop N requirements, while avoiding N surpluses.As a result, the REN significantly improved from 17.5% for thefarmer’s N practice to 43.1% for ONR, and the resultingintensity of GHG emission and reactive N losses at the ONRcould be reduced by 77% and 80%, respectively, whencompared to the farmer’s N practice, with no loss of yield(Table 2). In addition, the placement of N fertilizer into the soiland near the zone of active root uptake (e.g., deep injection,banding, or fertigation) may both reduce surface N loss andincrease plant N use, resulting in less N loss as NO2 andnitrate.16 Slow release, controlled release, and stabilizedfertilizers have been shown to enhance crop recovery andreduce losses of N via drainage or atmospheric emissions.17
The large regional variation in the GHG emission andreactive N losses for in-season root-zone N management(GHG emission intensity: from 36.8 kg CO2 eq Mg−1 in TA to68.5 kg CO2 eq Mg−1 in HT; reactive N losses intensity: 3.78kg N Mg−1 in TA to 6.38 kg N Mg−1 in HT) indicated thepotential for further reducing environmental footprints byincreased grain yields. Rapidly growing plants have larger rootsystems that more effectively exploit available soil N, leading tohigher yields and avoiding N losses to the environment.5 Thewheat grain yield in TA was the highest of all regions studiedbecause the region has the best crop management, and thecorresponding intensity of GHG emission and reactive N lossesunder the in-season root-zone N management were the lowestof the seven regions (Table 2). A study on irrigated maize incentral Nebraska, USA, suggested high yields with a smallintensity of global warming.37 Some global studies have alsoindicated that further yield improvements should be expectedfollowing efforts to reduce future GHG emissions.4
Considering the global demand for agricultural produce,agricultural management practices to reduce the N environ-mental footprint should focus on a portfolio of strategies,improving the REN by optimal N management and increasinggrain yield by adopting the best crop management practices,rather than by reducing the N application rate. On a regionalscale, a low intensity of GHG emission and reactive N losses islikely to be achieved through a combination of an improvedREN in regions where N fertilizer use is already high and anincreased grain yield by N application in regions with a low Ninput. With significant overfertilization in some regions, such asChina and India,44 N application should first be optimized byadopting techniques to improve the REN and reduce GHGemission and reactive N losses, such as reducing the rate of Napplication by optimizing N fertilizer placement and timing,and by using fertilizers stabilized with urease or nitrificationinhibitors or slow- or controlled-release fertilizers. With yieldsmaintained, N rates dramatically decreased, and REN increased;therefore, the intensity of GHG emission and reactive N lossesminimize in a given region. In some underfertilized regionssuch as Africa,44 more N fertilizer may be needed to increaseyields, while the intensity of GHG emission and reactive Nlosses may significantly decrease.
■ ASSOCIATED CONTENT
*S Supporting InformationDetailed information of data were extracted for establishmentof empirical N loss model and detailed descriptions of all 132experimental sites and quantification of the total N2O
emissions. This material is available free of charge via theInternet at http://pubs.acs.org.
■ AUTHOR INFORMATIONCorresponding Author*Phone: + 86 010 6273 3454. Fax + 86 010 6273 1016. E-mail:[email protected] authors declare no competing financial interest.
■ ACKNOWLEDGMENTSWe thank the National Basic Research Program of China (973,Program: 2009CB118606), Special Fund for Agro-scientificResearch in the Public Interest (201103003), the InnovativeGroup Grant of National Natural Science Foundation of China(31121062) for their financial support.
■ REFERENCES(1) FAO, 2012. FAOSTAT-Agriculture Database. Available at http://faostat.fao.org/site/339/default.aspx (accessed May 15, 2013).(2) Tilman, D. Global environmental impacts of agriculturalexpansion: the need for sustainable and efficient practices. Proc. NatlAcad. Sci. 1999, 96 (11), 5995−6000.(3) Tilman, D.; Fargione, J.; Wolff, B.; D’Antonio, C.; Dobson, A.;Howarth, R.; Schindler, D.; Schlesinger, W. H.; Simberloff, D.;Swackhamer, D. Forecasting agriculturally driven global environmentalchange. Science 2001, 292 (5515), 281−284.(4) Tilman, D.; Balzer, C.; Hill, J.; Befort, B. L. Global food demandand the sustainable intensification of agriculture. Proc. Natl Acad. Sci.2011, 108 (50), 20260−20264.(5) Cassman, K. G.; Dobermann, A.; Walters, D. T. Agroecosystems,nitrogen-use efficiency, and nitrogen management. AMBIO 2002, 31(2), 132−140.(6) Ladha, J. K.; Pathak, H.; J. Krupnik, T.; Six, J.; van Kessel, C.Efficiency of fertilizer nitrogen in cereal production: retrospects andprospects. Adv. Agron. 2005, 87, 85−156.(7) Erisman, J. W.; Sutton, M. A.; Galloway, J.; Klimont, Z.;Winiwarter, W. How a century of ammonia synthesis changed theworld. Nat. Geosci. 2008, 1 (10), 636−639.(8) Sutton, M. A.; Oenema, O.; Erisman, J. W.; Leip, A.; vanGrinsven, H.; Winiwarter, W. Too much of a good thing. Nature 2011,472 (7342), 159−161.(9) Robertson, G. P.; Vitousek, P. M. Nitrogen in agriculture:balancing the cost of an essential resource. Annu. Rev. Environ. Resour.2009, 34 (1), 97−125.(10) Smith, V. H.; Tilman, G. D.; Nekola, J. C. Eutrophication:impacts of excess nutrient inputs on freshwater, marine, and terrestrialecosystems. Environ. Pollut. 1999, 100 (1−3), 179−196.(11) Guo, J. H.; Liu, X. J.; Zhang, Y.; Shen, J. L.; Han, W. X.; Zhang,W. F.; Christie, P.; Goulding, K. W. T.; Vitousek, P. M.; Zhang, F. S.Significant acidification in major Chinese croplands. Science 2010, 327(5968), 1008−1010.(12) Smith, P.; Martino, D.; Cai, Z.; Gwary, D.; Janzen, H.; Kumar,P.; McCarl, B.; Ogle, S.; Mara, F. O.; Rice, C.; Scholes, B.; Sirotenko,O. Agriculture. In Climate Change 2007: Mitigation. Contribution ofWorking Group III to the Fourth Assessment Report of the Inter-governmental Panel on Climate Change, Metz, B., Davidson, O. R.,Bosch, P. R., Dave, R., Meyer, L. A., Eds.; Cambridge University Press:Cambridge, United Kingdom and New York, NY, USA, 2007.(13) Goulding, K. Nitrate leaching from arable and horticultural land.Soil Use Manage. 2000, 16, 145−151.(14) Hoben, J. P.; Gehl, R. J.; Millar, N.; Grace, P. R.; Robertson, G.P. Nonlinear nitrous oxide (N2O) response to nitrogen fertilizer in on-farm corn crops of the US Midwest. Global Change Biol. 2011, 17 (2),1140−1152.(15) Bouwman, A. F.; Boumans, L. J. M.; Batjes, N. H. Estimation ofglobal NH3 volatilization loss from synthetic fertilizers and animal
Environmental Science & Technology Article
dx.doi.org/10.1021/es4003026 | Environ. Sci. Technol. XXXX, XXX, XXX−XXXG

manure applied to arable lands and grasslands. Global Biogeochem.Cycles 2002, 16 (2), 1024.(16) Millar, N.; Robertson, G.; Grace, P.; Gehl, R.; Hoben, J.Nitrogen fertilizer management for nitrous oxide (N2O) mitigation inintensive corn (Maize) production: an emissions reduction protocolfor US Midwest agriculture. Mitig. Adapt. Strateg. Glob. Change 2010,15 (2), 185−204.(17) Snyder, C. S.; Bruulsema, T. W.; Jensen, T. L.; Fixen, P. E.Review of greenhouse gas emissions from crop production systemsand fertilizer management effects. Agric. Ecosyst. Environ. 2009, 133(3−4), 247−266.(18) Roberts, T. L. Right product, right rate, right time and rightplace ... the foundation of best management practices for fertilizer. InFertilizer Best Management Practices. General Principles, Strategy for theirAdoption and Voluntary Initiatives vs Regulations. Proceedings of theIFA International Workshop on Fertilizer Best Management Practices,7−9 March 2007, Brussels, Belgium. Published by InternationalFertilizer Industry Association, Paris, France, 2007.(19) Kim, S.; Dale, B. E. Effects of nitrogen fertilizer application ongreenhouse gas emissions and economics of corn production. Environ.Sci. Technol. 2008, 42 (16), 6028−6033.(20) Ju, X.; Xing, G.; Chen, X.; Zhang, S.; Zhang, L.; Liu, X.; Cui, Z.;Yin, B.; Christie, P.; Zhu, Z.; Zhang, F. Reducing environmental risk byimproving N management in intensive Chinese agricultural systems.Proc. Natl Acad. Sci. 2009, 106 (9), 3041−3046.(21) Cui, Z.; Chen, X.; Zhang, F. Current nitrogen managementstatus and measures to improve the intensive wheat-maize system inChina. AMBIO 2010, 39 (5), 376−384.(22) Cui, Z.; Zhang, F.; Chen, X.; Miao, Y.; Li, J.; Shi, L.; Xu, J.; Ye,Y.; Liu, C.; Yang, Z.; Zhang, Q.; Huang, S.; Bao, D. On-farmevaluation of an in-season nitrogen management strategy based on soilNmin test. Field Crops Res. 2008, 105 (1−2), 48−55.(23) Cui, Z.; Zhang, F.; Chen, X.; Dou, Z.; Li, J. In-season nitrogenmanagement strategy for winter wheat: maximizing yields, minimizingenvironmental impact in an over-fertilization context. Field Crops Res.2010, 116 (1−2), 140−146.(24) Tan, F.; Wang, J.; Song, Y. Characteristics of climate change inthe North China Plain for recent 45 years. (In Chinese). Meteorol.Mon. 2010, 36 (5), 40−45.(25) Denmead, O. T. Micrometerological methods for measuringgaseous losses of nitrogen in the field. In Gaseous Loss of Nitrogen fromPlant-Soil Systems; Freney, J. R., Simpson, J. R., Eds.; Martinus NijhoffPublishers: The Hague, Netherlands, 1983.(26) Braschkat, J.; Mannheim, T.; Horlacher, D.; Marschner, H.Measurement of ammonia emissions after liquid manure application: I.Construction of a wind tunnel system for measurements under fieldconditions. Z. Pflanzenernaehr. Bodenkd. 1993, 156 (5), 393−396.(27) Holland, E.; Robertson, G.; Greenberg, J.; Groffman, P.; Boone,R.; Gosz, J. Soil CO2, N2O, and CH4 exchange. In Standard SoilMethods for Long-Term Ecological Research; Robertson, G. P., Coleman,D. C., Bledsoe, C. S., Sollins, P., Eds.; Oxford University Press: NewYork, 1999; pp 185−201.(28) Lehmann, J.; Schroth, G. Nutrient leaching. In Trees, Crops andSoil fertility - Concepts and Research methods; Schroth, G., Sinclair, F.,Eds.; CAB International: Wallingford, UK, 2003.(29) Zhao, R.; Chen, X.; Zhang, F. Nitrogen cycling and balance inwinter wheat/summer maize rotation system in Northern China. (InChinese). Acta Pedol. Sin. 2009, 46 (4), 684−697.(30) Yue, S.; Meng, Q.; Zhao, R.; Ye, Y.; Zhang, F.; Cui, Z.; Chen, X.Change in nitrogen requirement with increasing grain yield for winterwheat. Agron. J. 2012, 104 (6), 1687−1693.(31) IPCC, Agriculture, forestry and other land use. In 2006 IPCCGuidelines for National Greenhouse Gas Inventories, Prepared by theNational Greenhouse Gas Inventories Programme, Eggelston, S., Buendia,L., Miwa, K., Ngara, T., Tanabe, K., Eds.; IGES: Japan: 2006; p 54.(32) Forster, P.; Ramaswamy, V.; Artaxo, P.; Berntsen, T.; Betts, R.;Fahey, D. W.; Haywood, J.; Lean, J.; Lowe, D. C.; Myhre, G.; Nganga,J.; Prinn, R.; Raga, G.; Schulz, M.; Van Dorland, R. Changes inatmospheric constituents and in radiative forcing. In Climate Change
2007: The Physical Science Basis. Contribution of Working Group I to theFourth Assessment Report of the Intergovernmental Panel on ClimateChange, Solomon, S., Qin, D., Manning, M., Chen, Z., Marquis, M.,Averyt, K. B., Tignor, M., Miller, H. L., Eds.; Cambridge UniversityPress: Cambridge, United Kingdom and New York, NY, USA, 2007.(33) Xia, Y.; Yan, X. Ecologically optimal nitrogen application ratesfor rice cropping in the Taihu Lake region of China. Sustain. Sci. 2012,7 (1), 33−44.(34) Hong, N.; Scharf, P. C.; Davis, J. G.; Kitchen, N. R.; Sudduth, K.A. Economically optimal nitrogen rate reduces soil residual nitrate. J.Environ. Qual. 2007, 36 (2), 354−362.(35) Kim, D.; Hernandez-Ramirez, G.; Giltrap, D. Linear andnonlinear dependency of direct nitrous oxide emissions on fertilizernitrogen input: a meta-analysis. Agric. Ecosyst. Environ. 2013, 168, 53−65.(36) Van Groenigen, J. W.; Velthof, G. L.; Oenema, O.; VanGroenigen, K. J.; Van Kessel, C. Towards an agronomic assessment ofN2O emissions: a case study for arable crops. Eur. J. Soil Sci. 2010, 61(6), 903−913.(37) Grassini, P.; Cassman, K. G. High-yield maize with large netenergy yield and small global warming intensity. Proc. Natl Acad. Sci.2012, 109 (4), 1074−1079.(38) Linquist, B.; van Groenigen, K. J.; Adviento-Borbe, M. A.;Pittelkow, C.; van Kessel, C. An agronomic assessment of greenhousegas emissions from major cereal crops. Global Change Biol. 2012, 18(1), 194−209.(39) Ju, X.; Lu, X.; Gao, Z.; Chen, X.; Su, F.; Kogge, M.; Romheld,V.; Christie, P.; Zhang, F. Processes and factors controlling N2Oproduction in an intensively managed low carbon calcareous soil undersub-humid monsoon conditions. Environ. Pollut. 2011, 159 (4), 1007−1016.(40) Matson, P. A.; Naylor, R.; Ortiz-Monasterio, I. Integration ofenvironmental, agronomic, and economic aspects of fertilizer manage-ment. Science 1998, 280 (5360), 112−115.(41) Reay, D. S.; Davidson, E. A.; Smith, K. A.; Smith, P.; Melillo, J.M.; Dentener, F.; Crutzen, P. J. Global agriculture and nitrous oxideemissions. Nat. Clim. Change 2012, 2 (6), 410−416.(42) Raun, W. R.; Johnson, G. V. Improving nitrogen use efficiencyfor cereal production. Agron. J. 1999, 91 (3), 357−363.(43) Zhang, F.; Cui, Z.; Chen, X.; Ju, X.; Shen, J.; Chen, Q.; Liu, X.;Zhang, W.; Mi, G.; Fan, M.; Jiang, R. Integrated nutrient managementfor food security and environmental quality in China. Adv. Agron.2012, 116, 1−40.(44) Foley, J. A.; Ramankutty, N.; Brauman, K. A.; Cassidy, E. S.;Gerber, J. S.; Johnston, M.; Mueller, N. D.; O’ Connell, C.; Ray, D. K.;West, P. C.; Balzer, C.; Bennett, E. M.; Carpenter, S. R.; Hill, J.;Monfreda, C.; Polasky, S.; Rockstrom, J.; Sheehan, J.; Siebert, S.;Tilman, D.; Zaks, D. P. M. Solutions for a cultivated planet. Nature2011, 478 (7369), 337−342.
Environmental Science & Technology Article
dx.doi.org/10.1021/es4003026 | Environ. Sci. Technol. XXXX, XXX, XXX−XXXH