in search of pollution havens? dirty … · led to a rapid tightening of pollution regulation in...
TRANSCRIPT

Workshop 3: Pollution havens and pollution halos
This is a room document presented to the OECD Conference onFDI and the Environment (The Hague, 28-29 January 1999). Theopinions expressed in this document are those of the author and donot necessarily represent those of the OECD or any of its Membercountries
IN SEARCH OF POLLUTION HAVENS?DIRTY INDUSTRY IN THE WORLD ECONOMY, 1960-1995
Muthukumara Mani*David Wheeler
PRDEI
April, 1997
*The authors are respectively Environmental Economist, Economic Development Institute and LeadEconomist, Development Research Group of the World Bank. Funding for this study has beenprovided by the World Bank’s Research Support Budget and the Netherlands Trust Fund for“Social and Environmental Consequences of Growth-Oriented Policies.”

2
Abstract
The last three decades have witnessed rapid economic development, particularly in countrieswhich have pursued relatively open economic policies. Rising environmental awareness in the 1960s alsoled to a rapid tightening of pollution regulation in the industrial economies. According to the ‘pollutionhavens’ hypothesis, the result should have been more rapid growth of dirty industries in unregulatedeconomies which were open to international trade.
Using data for the period 1960-1995, the authors find that the displacement of pollution todeveloping countries has not been a major phenomenon for several reasons. Tendencies towardformation of pollution havens have been self-limiting, because economic growth has generatedcountervailing effects through increases in regulation, technical expertise, and investment in cleanerproduction. In practice, the authors argue that pollution havens have apparently been as transient as low-wage havens.

3
Acknowledgments
Funding for this study has been provided by the World Bank’s Research Support Budget and theNetherlands Trust Fund for “Social and Environmental Consequences of Growth-Oriented Policies.” Thefindings, interpretations, and conclusions expressed in this paper are entirely those of the authors. They donot necessarily reflect the views of the World Bank, its Executive Directors, or the countries theyrepresent. For useful comments, we would like to thank Judy Dean, Per Fredriksson and other participantsin the workshop on Social and Environmental Consequences of Growth-Oriented Policies, World Bank,Washington, DC, May 1, 1997 and the Conference on Trade, Global Policy and the Environment, WorldBank, Washington, DC, April 21, 1998.

4
1. Introduction
During the past three decades, many poor countries have experienced rapid economicdevelopment after adopting liberal economic policies. In manufacturing sectors such as apparel assembly,a ‘cascading’ pattern of growth has accompanied this global movement toward openness. Production hasaccelerated in progressively poorer countries, as wage increases in rapidly-developing open economieshave changed the pattern of comparative advantage. Downward migration of garment assembly hasreflected its continuing labour-intensity: Low unit labour costs in poor economies have been sufficient tooffset the potential for automated production in higher-wage countries.1 We might therefore characterisethe world garment story as a continuous (and self-defeating) search for ‘low wage havens’ by apparelmanufacturers. From the perspective of development economics, this has been salutary: Exports ofgarments and other light assembly goods have provided the first rung on the ladder of rapid income growthand skills development for millions of poor workers.
Although they are critical factors, relative wages and labour skills are not the only determinantsof locational advantage. Other long-recognised factors include the quality and local price of availableenergy and raw materials, agglomeration economies, etc.2 More recently, attention has turned to thepossible impact of differences in environmental regulation. In the OECD economies, stricter regulationmeans polluters pay more – for pollution control equipment, conversion to cleaner processes, or penaltiesfor unacceptable emissions. This regulatory gap between developed and developing countries could, inprinciple, produce ‘pollution havens’ analogous to ‘low wage havens.’ Pollution-intensive industries (i.e.,those with low elasticities of substitution between use of the environment and other productive factors)might join labour-intensive industries in the migration from the OECD countries to open developingeconomies, if the latter remained unregulated and environmental pricing were a significant determinant ofcomparative advantage.
Have ‘pollution havens’ in fact emerged? In this paper, we examine the record usinginternational information on industrial production, trade and environmental regulation for the period 1960 -1995. The paper is organised as follows. In Section 2, we use recent results on the relationship betweenregulation and development to argue that ‘pollution havens’ must be as transient as ‘low wage havens:’ Inthe worst case, we would expect to see pollution-intensive sectors follow the ‘cascading’ internationalgrowth pattern of garment production. Section 3 draws on several empirical approaches to identifyindustry sectors which are clearly among the most pollution-intensive. Focusing on these sectors, the restof the paper examines the evidence on shifts in pollution-intensive production from the OECD todeveloping economies. Section 4 focuses on the OECD, giving particular attention to the Japanese case.Section 5 considers the experience of developing Asia and Latin America, while Section 6 provides asummary and conclusions.
2. Development, Regulation and ‘Pollution Havens’
‘Low wage havens’ are transient because incomes and wages increase continuously withdevelopment. Similarly, recent evidence suggests that ‘pollution havens,’ if they exist, may be transientbecause environmental regulation also increases with development. Dasgupta, et. al. (1996) document thestriking correlation between national income per capita and the strictness of environmental regulation.Recent studies of regional income and regulation in China (Wang and Wheeler, 1996; Dasgupta andWheeler, 1997) and Indonesia (Pargal and Wheeler, 1996) find similar relationships.
Regulation of industrial pollution increases with economic development for two main reasons.First, the demand for environmental quality rises with income, both for aesthetic reasons and because the
1 For a detailed discussion, see Mody and Wheeler (1990)2 See Wheeler and Mody (1992)

5
valuation of pollution damage increases. Secondly, more developed economies have (on average) morehighly-developed public institutions and are more capable of enforcing desirable environmental norms3. Ifthe income elasticity of regulation is greater than one, then developing countries will not retain acomparative advantage in dirty production. However, the interplay of relative prices and agglomerationeconomies might lead to a garment-style ‘cascading’ pattern of growth, in which rapid growth of dirtysectors is visible during transitional periods when regulation lags behind the growth of output and income.
3. Defining Dirty Industries
To test for pollution havens, we need a clearly-defined set of ‘dirty’ industries. A conventionalapproach in the literature has been to identify pollution-intensive sectors as those which have incurred highlevels of abatement expenditure per unit of output in the US and other OECD economies (Robison (1988),Tobey (1990), Mani (1996)). By this criterion, five sectors emerge as leading candidates for ‘dirtyindustry’ status: Iron and Steel, Non-Ferrous Metals, Industrial Chemicals, Pulp and Paper, and Non-Metallic Mineral Products.4 Another, more direct, approach is to select sectors which rank high on actualemissions intensity (emissions per unit of output). To determine high-ranking sectors by this criterion, wehave used detailed emissions intensities by medium for US manufacturing at the 3-digit Standard IndustrialClassification (SIC) level, computed by the World Bank in collaboration with the US EPA and the USCensus Bureau (Hettige, et. al., 1995). We have computed average sectoral rankings for conventional airpollutants, water pollutants, and heavy metals, with results displayed in Table 1.
Table 1. Ranking of Pollution-Intensive Industries
Rank Air Water Metals Overall
1 371 Iron and Steel 371 Iron and Steel 372 Non-Ferrous Metals 371 Iron and Steel2 372 Non-Ferrous Metals 372 Non-Ferrous Metals 371 Iron and Steel 372 Non-Ferrous
Metals3 369 Non-Metallic Min.
Prd.341 Pulp and Paper 351 Industrial
Chemicals351 IndustrialChemicals
4 354 Misc. Petroleum,Coal Prd.
390 MiscellaneousManufacturing
323 Leather Products 353 PetroleumRefineries
5 341 Pulp and Paper 351 Industrial Chemicals 361 Pottery 369 Non-MetallicMin Prd.
6 353 Petroleum Refineries 352 Other Chemicals 381 Metal Products 341 Pulp and Paper7 351 Industrial Chemicals 313 Beverages 355 Rubber Products 352 Other Chemicals8 352 Other Chemicals 311 Food Products 383 Electrical Products 355 Rubber Products9 331 Wood Products 355 Rubber Products 382 Machinery 323 Leather Products10 362 Glass Products 353 Petroleum Refineries 369 Non-Metallic Min.
Prd.381 Metal Products
3 This is confirmed in a recent study by Hettige, Mani, and Wheeler (1998)4 Petroleum has been excluded because a very few countries are actually involved in its production.

6
Again, five of the six sectors with highest overall ranks are Iron and Steel, Non-Ferrous Metals,Industrial Chemicals, Pulp and Paper, and Non-Metallic Mineral Products. We have therefore selectedthem as the ‘dirty sectors’ for this analysis. If there is a significant pollution havens story, it should emergein their international development history since 1960. However, since this is a comparative advantagestory, we need to be sure that it is not confounded by changes in relative prices of factors other than‘environment’ in which dirty industries may also be intensive.
In fact, it is quite reasonable to suppose that pollution-intensive industries are intensive in otherinputs, particularly bulk raw materials, energy and land. Pollutants are waste residuals – harmful by-products of industrial processes which are not profitable to recycle or resell at existing prices (including theprice of pollution). The volume of such residuals is, almost tautologically, largest in weight-reducingindustries which transform bulk raw materials into primary inputs for industrial production. Suchindustries should be land intensive, because some bulk material inventories must be stored on-site. Theyshould also be energy-intensive, because transformation processes generally involve the application of hightemperature, pressure, and /or mechanical force to raw material inputs. We are agnostic about their capital-and labour-intensity, but these factors are also clearly important for the comparative advantage story.
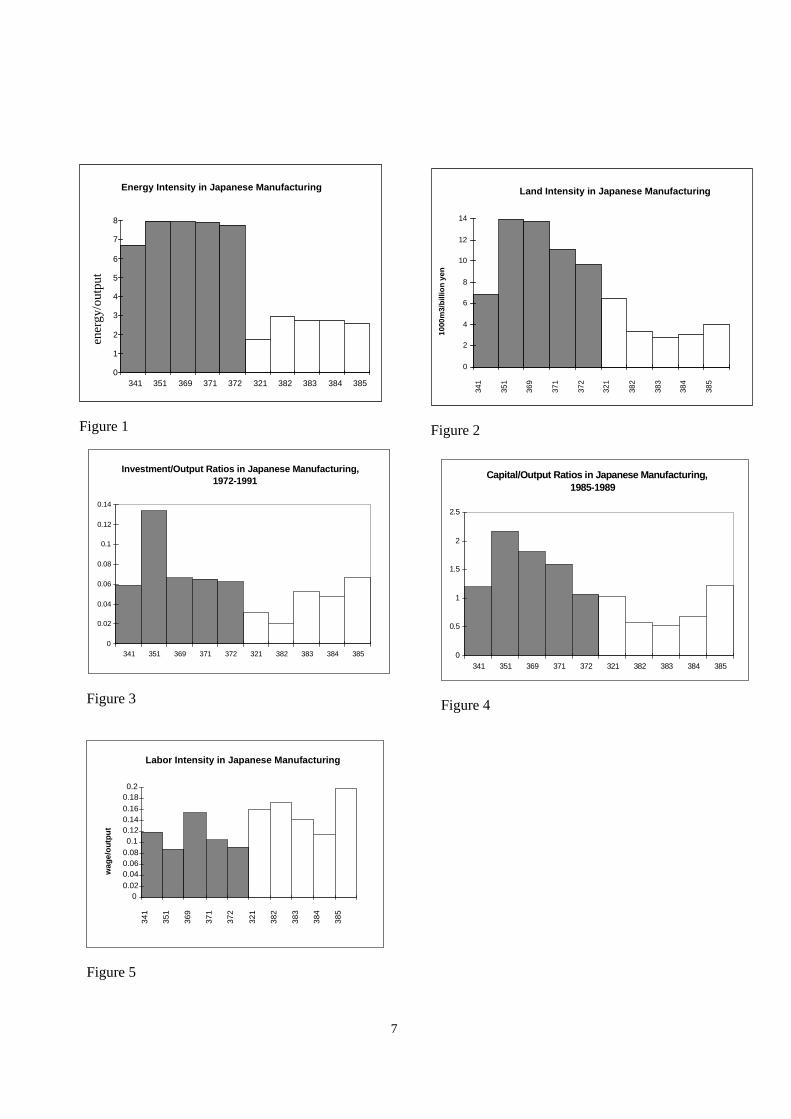
To test for differential intensities, we have identified the five ‘cleanest’ sectors using the samepollution-intensity rankings employed for Table 1. They are SIC sectors 321 (Textiles), 382 (Non-Electrical Machinery), 383 (Electrical Machinery), 384 (Transport Equipment), and 385 (Instruments).Using available data from Japan, we have computed energy, land and labour intensities for the fivecleanest and dirtiest sectors and compared the results.
The results for energy intensity, displayed in Figure 1, are very clear: The five dirty sectors areabout three times more energy intensive than the five clean sectors, and there is striking uniformity withinthe two groups. Although there is more within-group variation, the result is basically the same for landintensity (Figure 2): It is about three times higher in the dirty sectors. Capital intensity is alsosubstantially higher in the dirty sectors, with an average ratio around 2:1 for capital/output (Figure 3) andinvestment/output (Figure 4). Labour intensity shows considerable variation within groups, but the cleansectors are about 40% more labour intensive on average (Figure 5).
To summarise, our evidence suggests that dirty industries are relatively intensive in capital, energyand land; their clean counterparts are relatively intensive in labour, although the difference is not asstriking. Clearly, the pollution havens hypothesis cannot be tested using information on environmentalregulation alone. Shifts in pollution-intensive production might also be explained by differences in therelative prices of these other inputs. In the following section, we take a careful look at the relative pricestory for Japan.
7
Land Intensity in Japanese Manufacturing
0
2
4
6
8
10
12
14
341
351
369
371
372
321
382
383
384
385
1000
m3/
bill
ion
yen
Figure 2
Energy Intensity in Japanese Manufacturing
0
1
2
3
4
5
6
7
8
341 351 369 371 372 321 382 383 384 385
ener
gy/o
utpu
t
Figure 1
Capital/Output Ratios in Japanese Manufacturing, 1985-1989
0
0.5
1
1.5
2
2.5
341 351 369 371 372 321 382 383 384 385
Figure 4
Investment/Output Ratios in Japanese Manufacturing, 1972-1991
0
0.02
0.04
0.06
0.08
0.1
0.12
0.14
341 351 369 371 372 321 382 383 384 385
Figure 3
Labor Intensity in Japanese Manufacturing
00.020.040.060.080.1
0.120.140.160.180.2
341
351
369
371
372
321
382
383
384
385
wag
e/o
utp
ut
Figure 5

8
4. Pollution-Intensive Production in the OECD
4.1 The Japanese Story
4.1.1 The Relative Decline of Pollution-Intensive Sectors
During the past three and one-half decades, Japan has gone through major changes in economicand environmental conditions. As Figures 6 and 7 suggest, these changes have had significantconsequences for pollution-intensive industry in Japan. Whether compared to the five cleanest sectors(Figure 6) or Japanese manufacturing as a whole (Figure 7), the share of our five dirtiest sectors trendedstrongly downward during the period 1963-1993. As a proportion of clean-sector production, dirty-sectoroutput dropped from nearly 70% in 1963 to about 30% in the mid-1990’s. As a proportion of totalmanufacturing production, dirty-sector output dropped from about 25% in the early 1960’s to about 15% inthe mid-1990’s. Both series show clear breaks in trend during the two periods of rapid energy priceescalation, 1973-74 and 1978-80. Since the dirty sectors have relatively high energy intensity, the short-run response to the energy price increases was a ‘pass-through’ to customers and temporary escalation ofoutput value relative to the value of sectors with lower energy intensity. After each break, however, thedownward trend quickly reasserted itself. What explains this decline? Obvious candidates are pricechanges for factors in which the pollution-intensive sectors are highly intensive: Energy, land andenvironment.
4.1.2 Energy and Land Prices
Energy prices escalated sharply in 1973, and this increase may well explain part of the decline inthe share of pollution-intensive production in the 1970’s. However, relative energy prices were notincreasing during the 1960’s and 1980’s -- periods when Japan’s dirty industry share was also declining.
Japanese Production Ratio (Polluting/Non-Polluting)
0
0.1
0.2
0.3
0.4
0.5
0.6
0.7
1963 1965 1967 1969 1971 1973 1975 1977 1979 1981 1983 1985 1987 1989
Figure 6
0
0.05
0.1
0.15
0.2
0.25
1963 1966 1969 1972 1975 1978 1981 1984 1987 1990 1993
Japan’s Production of Polluting ProductsAs a % of Total Manufacturing
Figure 7
9
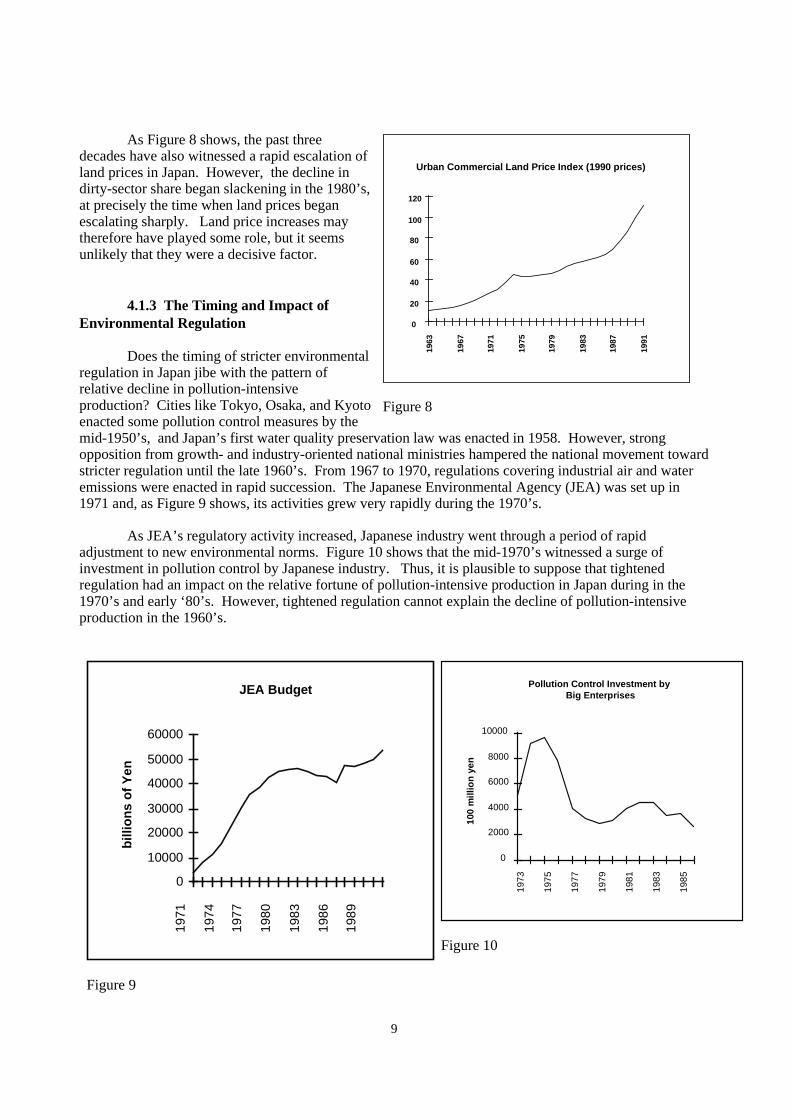
As Figure 8 shows, the past threedecades have also witnessed a rapid escalation ofland prices in Japan. However, the decline indirty-sector share began slackening in the 1980’s,at precisely the time when land prices beganescalating sharply. Land price increases maytherefore have played some role, but it seemsunlikely that they were a decisive factor.
4.1.3 The Timing and Impact ofEnvironmental Regulation
Does the timing of stricter environmentalregulation in Japan jibe with the pattern ofrelative decline in pollution-intensiveproduction? Cities like Tokyo, Osaka, and Kyotoenacted some pollution control measures by themid-1950’s, and Japan’s first water quality preservation law was enacted in 1958. However, strongopposition from growth- and industry-oriented national ministries hampered the national movement towardstricter regulation until the late 1960’s. From 1967 to 1970, regulations covering industrial air and wateremissions were enacted in rapid succession. The Japanese Environmental Agency (JEA) was set up in1971 and, as Figure 9 shows, its activities grew very rapidly during the 1970’s.
As JEA’s regulatory activity increased, Japanese industry went through a period of rapidadjustment to new environmental norms. Figure 10 shows that the mid-1970’s witnessed a surge ofinvestment in pollution control by Japanese industry. Thus, it is plausible to suppose that tightenedregulation had an impact on the relative fortune of pollution-intensive production in Japan during in the1970’s and early ‘80’s. However, tightened regulation cannot explain the decline of pollution-intensiveproduction in the 1960’s.
Urban Commercial Land Price Index (1990 prices)
0
20
40
60
80
100
120
1963
1967
1971
1975
1979
1983
1987
1991
Figure 8
JEA Budget
0
10000
20000
30000
40000
50000
60000
1971
1974
1977
1980
1983
1986
1989
bill
ion
s o
f Y
en
Figure 9
Pollution Control Investment by Big Enterprises
0
2000
4000
6000
8000
10000
1973
1975
1977
1979
1981
1983
1985
100
mill
ion
yen
Figure 10

10
4.1.4 Income Growth
Figures 6 and 7 suggest a consistent pattern of decline in the share of dirty industry from thesixties to the nineties, despite large interim changes in the prices of energy, land and environment. Duringthis entire period, of course, Japanese income per capita increased rapidly. Our five dirty sectors are‘basic’ industries, whose domestic demand elasticity falls as income increases. Thus, income growth alonemay explain a significant part of their relative decline.
Figures 11 and 12 tell an intriguing story in this context. During the ‘pre-environmental’ period ofrapid growth, from 1963 to the mid-1970’s, declining trends in both consumption/production andimport/export ratios are consistent with the income-elasticity hypothesis. However, in the mid-1970’s bothratios reversed course: Production of polluting products slowed relative to consumption, and importsincreased much more rapidly than exports. Thus, although relative domestic demand for pollution-intensive products undoubtedly continued to decline with income growth after 1975, the evidence suggeststhat the pure ‘income effect’ was outweighed by another factor which suddenly retarded the growth ofdomestic production and exports. In light of the regression results, the most plausible candidate for thisrole is increased environmental regulation.
4.1.6 Dirty Industry’s ‘Retreat’ from Japan: A Summary Perspective
Many factors can be invoked to explain the relative decline of pollution-intensive industry inJapan since 1963. Although energy and land prices are plausible culprits, our regression analysis suggeststhat they have not played dominant roles in the story. Lower income elasticities for dirty-sector productshave undoubtedly played a role. Indeed, the evidence suggests that they played a dominant role in the1960’s. However, the most striking part of Japan’s dirty-sector story is the rapid increase inconsumption/production and import/export ratios since 1976, coupled with rapid growth of the JEA andsharp increases in industrial pollution control investments. A plausible inference is that stricterenvironmental regulation had a significant impact on Japan’s comparative advantage in pollution-intensiveproducts. We conclude that regulation probably led to both significant abatement by pollution-intensiveindustries in Japan, and displacement of some pollution-intensive production to Japan’s trading partners.
Import-Export Ratio of Polluting Products in Japan
0
0.1
0.2
0.3
0.4
0.5
0.6
0.7
0.8
0.9
1
1963
1966
1969
1972
1975
1978
1981
1984
1987
1990
1993
Figure 12
Consumption-Production Ratio of Polluting Products in Japan
0.75
0.8
0.85
0.9
0.95
1
1963
1965
1967
1969
1971
1973
1975
1977
1979
1981
1983
1985
1987
1989
1991
1993
Figure 11

11
4.2 Dirty Production in North America and Western Europe
Although we have used the Japanese case to examine the ‘environmental transition’ in detail,regulation was also increasing rapidly in North America and Western Europe during the same period.Rapidly-rising real wages in the 1960’s and energy price hikes in the 1970’s were common to all threeOECD regions. As in the case of Japan, the growth of environmental regulation imposed substantialabatement costs on industry in North America and Western Europe during the 1970’s. However, otherconditions were different. Slower income growth after 1970 should have dampened the domestic incomeelasticity effect and kept the escalation of land prices well below Japanese rates. In the case of NorthAmerica, three additional factors were operative: Relative to Japan and Western Europe, North Americahas low settlement density (and land prices), a much greater supply of bulk raw materials, and substantiallylower energy prices -- all factors which would enhance comparative advantage in pollution-intensiveproducts. North America also has a skilled labour force capable of rapid adjustment toward cleanerproduction processes. It is therefore at least possible that the environmental era witnessed displacement ofpollution-intensive production from Japan and Western Europe to North America, whose higher abatementexpenses would have been compensated by a cost advantage in other factors.
Figures 13-16 tell us what actually happened. In the case of North America, the evidencesuggests that the impact of environmental regulation outweighed the potentially-displacing effects oftighter regulation in Japan and Western Europe. From 1963 - 1993, the dirty-sector share of industrialproduction declined steadily in the US and, more modestly, in Canada. North America’s dirty-sectorconsumption/production ratio shows no trend and fluctuates within a very narrow range; its import/exportratio increases steadily. Thus, despite several possible countervailing factors, the North Americanexperience was actually quite similar to that of Japan.
Western Europe also displays a declining share of dirty-sector production throughout the period,although its dirty-sector import/export ratio has remained approximately constant. Paradoxically, it is theWestern European, not North American, consumption/production ratio which exhibits a downward trendwell into the 1980’s before returning to its 1960’s level in the 1990’s.
4.3 Summarising the OECD Experience
To summarise briefly, two general patterns are visible in dirty-sector production trends for the OECDeconomies since 1960. In all three regions, the share of pollution-intensive industries has significantlydeclined. In two of the regions – Japan and North America – this decline has been accompanied by netdisplacement of polluting production to trading partners, while approximate trade balance has beenpreserved in Western Europe.
Part of the decline was probably due to low income elasticity of demand for pollution-intensiveproducts. In all three cases, however, another part is most plausibly attributed to stricter environmentalregulation and rising abatement costs. The energy price shock may also have had an impact, but ourregression results for Japan cast some doubt on this hypothesis.

12
Production of Polluting Products in U.S. and Canada
0
0.05
0.1
0.15
0.2
0.25
1963
1966
1969
1972
1975
1978
1981
1985
1982
1990
1993
CANADA
USA
Figure 13
Production of Polluting Products in Europe
0
0.05
0.1
0.15
0.2
0.25
1963
1966
1969
1972
1975
1978
1981
1984
1987
1990
1993
As
a %
of
To
tal M
anu
fact
uri
ng
Figure 14
NORTH AMERICA’S IMPORT-EXPORT RATIO
0
0.2
0.4
0.6
0.8
1
1.2
1963
1966
1969
1972
1975
1978
1981
1984
1987
1990
1993
Figure 15
EUROPE’S IMPORT-EXPORT RATIO
0
0.2
0.4
0.6
0.8
1
1.2
1963
1966
1969
1972
1975
1978
1981
1984
1987
1990
1993
Figure 16
USA-Canada Consumption-Production Ratio
0.99986
0.99988
0.9999
0.99992
0.99994
0.99996
0.99998
1
1.00002
1.00004
1.00006
1963
1966
1969
1972
1975
1978
1981
1984
1987
1990
1993
Figure 17
Europe’s Consumption-Production Ratio
0.86
0.88
0.9
0.92
0.94
0.96
0.98
1
1.02
1963
1966
1969
1972
1975
1978
1981
1984
1987
1990
Figure 18

13
5. Pollution-Intensive Production in Developing Asia and Latin America
5.1 The General Story
The international impact of regulation, income growth and (perhaps) energy price changes arestrikingly illustrated by the juxtaposition of OECD trends with Figures 19-22 for Latin America and Asia.5
For these developing regions, the graphs show a steady upward trend in pollution-intensive productionshare - a mirror image of the downward trends in North America, Europe and Japan. Superposed on thissteady increase are pronounced turning points in Latin American and Asian import/export ratios in themid-1970’s. Latin America exhibits a rising trend beforehand, a steep fall afterwards, and a levelling inthe 1980’s. The Asian series also exhibits a sudden shift downward in the mid-1970’s, but approximateconstancy otherwise.
5 We do not have complete data series for all Asian countries for the entire period. Our Asia series in Figure
16 includes data for Korea, Singapore, Pakistan, Philippines and India.
Asia (Excl. Japan): Import/Export RatioFor Polluting Products, 1964 - 1994
2
2.2
2.4
2.6
2.8
3
3.2
3.4
3.6
3.8
4
1964 1968 1972 1976 1980 1984 1988 1992
Figure 22
Latin America’s Production of Polluting Products
0
0.05
0.1
0.15
0.2
0.25
1963
1965
1967
1969
1971
1973
1975
1977
1979
1981
1983
1985
1987
1989
1991
Figure 19
Latin America’s Import/Export Ratio
0
0.5
1
1.5
2
2.5
3
3.5
4
1963 1969 1975 1981 1987 1993
Figure 20
Asia (Excl. Japan): Polluting Sector ProductionShare, 1964-1898
0.12
0.13
0.14
0.15
0.16
0.17
0.18
0.19
1964 1966 1968 1970 1972 1974 1976 1978 1980 1982 1984 1986 1988
Figure 21

14
Although other interpretations are doubtless possible, these data are consistent with the followingargument: During the 1960’s, rapid growth in all regions coincided with relatively weak environmentalregulation in the OECD economies and low, stable energy prices world-wide. During this period, domesticincome elasticity effects were dominant: Relative demand for pollution-intensive basic products such asmetals, chemicals, paper and cement fell in the OECD economies and grew at least as rapidly as domesticproduction in the poorer nations of Asia and Latin America (apparently more rapidly in the latter).
When the environment/energy shock hit in the mid-1970’s, the sudden shift in relative priceschanged conditions very significantly at the margin. From a position as net importers of pollution-intensive goods (with imports at three times the level of exports), Latin America and Asia experienced arapid decline in import/export ratios as weaker regulation and, possibly, lower energy prices alteredcomparative advantage in dirty-sector production. During this period, changes in relative costs augmentedthe income elasticity effect: Pollution-intensive production grew faster in the developing regions, andreceded more quickly in the industrial economies, than could have been predicted from income changealone.
By the mid-1980’s, three mitigating factors had again changed the picture significantly. First, asincome growth continued, the more industrialised (and polluted) economies of Latin America and Asiaprobably experienced some decline in the income elasticity of demand for dirty-sector production. Second,rising consciousness of environmental problems led to enactment and enforcement of stricterenvironmental regulations in both Latin America and Asia.6 Third, the energy price gap narrowed asworld petroleum prices stabilised and developing countries began abandoning energy subsidies. As aresult of these three changes, the share of dirty-sector production stopped increasing and import/exportratios stopped decreasing in both regions. Latin America’s import/export ratio stabilised near unity(balanced trade), while Asia remaining a significant net importer of pollution-intensive products.
5.2 Asian Sub-Regions
We turn to Asia for a more detailed analysis of historical trends because its recent growthexperience has included rapid transitions in income and economic structure for a number of countries.These raise the possibility of rapid change in locational advantage for pollution-intensive sectors, and infact the data suggest that such transitions actually occurred. For our analysis, it is convenient to group theAsian economies into three categories (see Table 3):7 the Newly Industrialising Economies (NIE’s -- HongKong, Singapore, Korea, Taiwan); Developing East Asia (DEA -- Malaysia, Indonesia, Thailand,Philippines and China); and South Asia (SA -- India, Pakistan, Bangladesh, Sri Lanka).
Tables 2-3 and Figure 23 provide comparative evidence on economic growth, degree of openness(by the Summers-Heston measure8) and the timing of environmental regulation during the past threedecades. The NIE’s were relatively open in 1970, at the beginning of the environmental era and werealready experiencing rapid growth; DEA began liberalising significantly and growing rapidly in the1970’s. Stricter enforcement of environmental regulation began in the 1970’s in the NIE’s and the 1980’sin DEA. SA began more rapid growth in the 1980’s, but stricter environmental regulation was delayeduntil the 1990’s.
6 For a detailed analysis, see Wheeler and Mody (1992).7 Data were not available for the other Asian developing economies.8 Summers-Heston openness index is defined as (exports + imports)/nominal GDP.

15
Table 2. Openness and Economic Progress in selected developingcountries in Asia and Latin America
Openness Economic Progress
Degree ofopenness
1990a
Average annualgrowth of GNP per
capita (percent)
1970-1995
People living on lessthan $1 a day
(percent)
1981-95
Average annualgrowth of exports
(percent)
1980-95East AsiaChina 25.4 6.9 29.4 12.5Indonesia 52.6 4.7 14.5 10.6Korea 62.5 10.0 -- 11.6Malaysia 154.20 4.0 5.6 13.6Philippines 61.5 0.6 27.5 5.3Thailand 75.8 5.2 0.1 16.7
South AsiaBangladesh 26.9 1.5 -- 10.1India 18.8 2.4 52.5 6.5Pakistan 35.0 2.9 11.6 9.1Sri Lanka 67.4 3.2 4.0 11.5
LatinAmericaBrazil 12.6 -- 28.7 6.3Chile 65.5 1.8 15.0 7.3Colombia 35.4 1.9 7.4 8.1Mexico 32.7 0.9 14.9 13.0Peru 26.8 1.1 49.4 2.4Venezuela 59.6 1.1 11.8 1.0
-- Not available.
a. Summers-Heston openness index defined as (exports + imports)/nominal GDP.
Source: World Bank 1997.

16
Table 3: Initial National Environmental Legislation in Asia
Country Air Water ToxicsJapan 1967 1958 1958
NICs Hong Kong Singapore 1978 ----- ----- Korea Taiwan 1975 -----
Developing EastAsia Malaysia 1977 1977 1979 Indonesia 1988 1988 ----- Thailand 1975 1975 1989 China 1985 1985 1989 Philippines
South Asia India 1974 1981 1986 Pakistan 1983 1983 ----- Bangladesh ----- ----- -----
Source: Brandon and Ramankutty (1993)
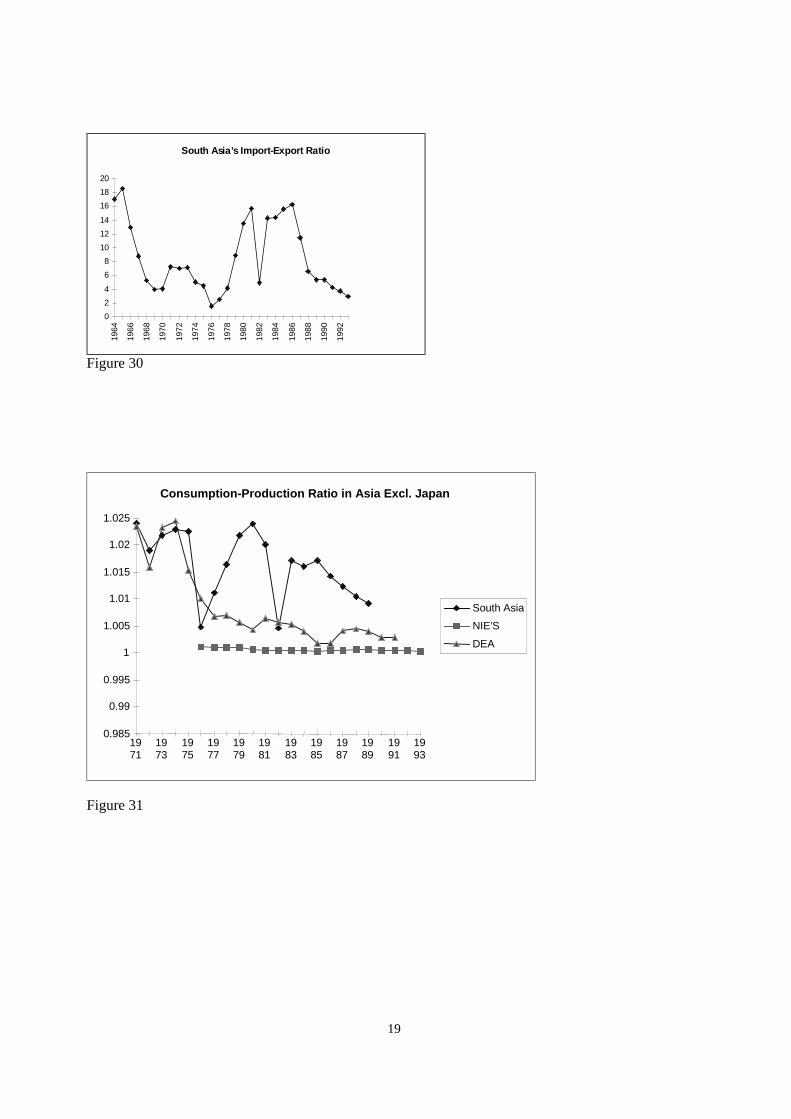
Across the three regions, the growth experience of pollution-intensive industry seems to reflectthese developments in a ‘cascading’ pattern. Figures 24-30 show changes in dirty-sector productionshares and import/export ratios. The dirty-sector share grew in all three regions during the 1970’s; itlevelled off in the NIE’s and DEA, but continued rising in SA. The NIEs’ dirty-sector import/export ratiofell sharply during the 1970’s. When regulation tightened and the NIEs’ ratio levelled off in the early1980’s, it began falling in DEA. As regulation tightened in DEA during the late 1980’s, the import/exportratio began falling in SA.
To summarise, for dirty-sector production in Asia we see an adjustment pattern which looks like a‘cascading pollution havens’ story. It begins in Japan in the early 1970’s, and continues for two decades inthe NIE’s, DEA and SA. However, in each region it has remained a markedly short story. In the NIE’sand DEA, the combined effect of regulation and falling demand elasticity has apparently stabilised thedirty-sector production share, leaving both regions (and SA) as net importers of pollution-intensiveproducts.
The same story is reflected in the historical pattern of consumption/production ratios (Figure 31).Although they have declined for over two decades in both DEA and SA, they remain above one in all threeregions. In fact, all the ratios have been very close to one during the entire period. Thus, our ‘cascading’dirty-sector production story has been a decidedly marginal affair.

17
0
10
20
30
40
50
60
70
80
East Asia
South Asia
Figure 23
OPENNESS IN ASIA
0
50
100
150
200
250
NIEs

18
Korea: Pollution-Intensive Industry Share, 1963-1993
0.15
0.16
0.17
0.18
0.19
0.2
0.21
0.22
0.23
1963
1965
1967
1969
1971
1973
1975
1977
1979
1981
1983
1985
1987
1989
1991
1993
Figure 24
NIEs’ Production of Pollutin g Products
0
0.05
0.1
0.15
0.2
0.25
1976 1978 1980 1982 1984 1986 1988 1990 1992
Figure 25
NIEs’ Import/Export Ratio
0
1
2
3
4
5
6
7
8
9
1963 1966 1969 1972 1975 1978 1981 1984 1987 1990 1993
Figure 26
Developing East Asia’s Production of Polluting Products
0
0.02
0.04
0.06
0.08
0.1
0.12
0.14
1971
1973
1975
1977
1979
1981
1983
1985
1987
1989
1991
As
a %
of
To
tal M
anu
fact
uri
ng
Figure 27
Developing East Asia’s Import-Export Ratio
0
1
2
3
4
5
6
1964
1966
1968
1970
1972
1974
1976
1978
1980
1982
1984
1986
1988
1990
1992
1994
Figure 28
South Asia’s Production of Polluting Products
0
0.05
0.1
0.15
0.2
0.25
0.3
1971
1973
1975
1977
1979
1981
1983
1985
1987
1989
As
a %
of
To
tal M
anu
fact
uri
ng
Figure 29
19
South Asia’s Import-Export Ratio
0
2
4
6
8
10
12
14
16
18
20
1964
1966
1968
1970
1972
1974
1976
1978
1980
1982
1984
1986
1988
1990
1992
Figure 30
Consumption-Production Ratio in Asia Excl. Japan
0.985
0.99
0.995
1
1.005
1.01
1.015
1.02
1.025
1971
1973
1975
1977
1979
1981
1983
1985
1987
1989
1991
1993
South Asia
NIE’S
DEA
Figure 31

20
6. Conclusions and Implications
The last three decades have witnessed rapid economic development, particularly in countrieswhich have pursued relatively open economic policies. Rising environmental awareness in the 1960s alsoled to a rapid tightening of pollution regulation in the industrial economies. This created an internationalgap in environmental pricing between industrial and developing economies in the 1970s. According tothe pollution havens hypothesis, the result should have been more rapid growth of dirty industries inunregulated economies which were open to international trade.
In this paper, we argue that a full understanding of the pollution havens problem requires goodevidence about the interactions linking economic development to regulation, industrial location, sectoralpollution intensity, energy and other input prices. Most of the previous studies have focused on thelocation issue, typically suppressing the other factors by lumping countries into simple‘developed/developing’ categories and basing conclusions on sectoral changes evaluated at constant(generally U.S.-based) abatement expenditures. In addition, the locational analyses have typically notconsidered many of the standard location factors in drawing inferences about the impact of differentialregulation and abatement costs.
Although data restrictions have prevented us from incorporating some of the factors mentionedhere, our(as we have shown for Japan) results do point to some interesting findings and implications forfuture research and policy analysis.
Our cross-country analysis has found a pattern of evidence which does seem consistent with thepollution havens story: Pollution-intensive output as a percentage of total manufacturing has fallenconsistently in the OECD and risen steadily in the developing world. Moreover, the periods of rapidincrease in net exports of pollution-intensive products from developing countries coincided with periods ofrapid increase in the cost of pollution abatement in the OECD economies.
However, our evidence also shows that pollution haven effects have not had major significance,for several reasons. First, consumption/production ratios for dirty-sector products in the developing worldhave remained close to unity throughout the period; most of the dirty-sector development story is strictlydomestic. Second, a significant part of the increase in dirty-sector production share in the developingregions seems due to a highly income-elastic demand for basic industrial products. With continuedincome growth, this elasticity has declined9. Third, some portion of the international adjustment hasprobably been due to the energy price shock and the persistence of energy subsidies in many developingcountries. These subsidies have been on the wane for a decade. Finally, environmental regulationincreases continuously with income and seems to have played a role in the shift from dirty to cleanersectors.
Thus, any tendency toward formation of a pollution havens seems to have been self-limiting,because economic growth brings countervailing pressure to bear on polluters through increased regulation,technical expertise, and ‘clean sector’ production. In practice, pollution havens have apparently been astransient as low-wage havens.
In closing, it is worth asking whether these results are a cause for of optimism or pessimismabout the relationship between economic development and environmental quality. The appropriate answerseems to be ‘both’. It is comforting to see that industrial pollution levels off or declines in richer countries,because pollution intensity has an elastic response to income growth. In addition, our results suggest that
9 Dasgupta, et. al. (1995) also find a very strong, monotone increasing relationship between
national income per capita and the strictness of environmental regulation.
21
pollution haven effects have been transient and relatively unimportant. It is clear that no feasible tradepolicy could ‘neutralise’ this effect. Cross-country differences in environmental regulation reflect a broadcontinuum of experience, and the domestic impacts of regulation dwarf international displacement impacts.
However, the evidence suggests that something like a pollution havens effect is real, even if it hasbeen transient for many countries. The results, however, also suggest there will be some countries that lagbehind in their efforts to control pollution now and may even take years to catch-up with the rest of theworld. This also rises serious issues about continued existence of polluted waterways and lands left behindby itinerant dirty industries, and their legacy will remain for generations.
What, if anything, then should the industrial countries or rest of the world do about this disparity?Our results cast strong doubt on the wisdom of intervention through trade-related measures. Thecontinuous, smooth relationship between income growth and environmental performance shows thatdeveloping countries are already making social choices which reflect the calculus of benefits and costs.Countries become less polluted as rising incomes makes a cleaner environment more desirable andaffordable. Fortunately, there are progressive alternatives to heavy-handed intervention: The positivealternative to heavy-handed intervention lies in aiding activities to finance pollution control training; thetransfer of cost-effective pollution control technologies; and appropriate information systems for regulationand public dissemination of environmental information. At each level of development, such assistance canhelp developing countries move closer to locally-appropriate levels of pollution control. Ultimately,income growth will be the answer. As developing economies prosper and tighten their regulations, we areconfident that the shadow of pollution havens will recede to insignificance.

22
REFERENCES
Birdsall, N. & Wheeler, D.R. (1993). Trade Policy and Industrial Pollution in Latin America: Where Arethe Pollution Havens. Journal of Environment and Development, 2, 1, 137-149.
Brandon, C., & Ramankutty, R. (1993). Toward an Environmental Strategy for Asia. World BankDiscussion Paper Number 224. Washington, DC: World Bank.
Dasgupta, S. & Wheeler, D.R. (1997). Citizen Complaints as Environmental Indicators: Evidence fromChina. Policy Research Department Working Paper 1704, Washington, DC: World Bank.
Dasgupta, S, Mody, A., Roy, S., & Wheeler, D.R. (1995). Environmental Regulation and Development:A Cross-Country Empirical Analysis. Policy Research Department, Working Paper No. 1448,Washington, DC: World Bank.
Hettige, H., Martin, P., Singh, M. & Wheeler, D.R. (1995). IPPS: The Industrial Pollution ProjectionSystem. Policy Research Department Working Paper 1431, Washington, DC: World Bank.
Hettige, H., Mani, M., Wheeler, D.R.. (1998). Industrial Pollution in Economic Development: KuznetsRevisited. Policy Research Working Paper 1876. Washington, DC: World Bank.
Mani, M. (1996). Environmental Tariffs on Polluting Imports: An Empirical Study. Environmental andResource Economics, 7, 391-411
Mody, A. & Wheeler, D.R. (1990). Automation and World Competition: New Technologies, IndustrialLocation, and Trade. London: Macmillan Press.
Pargal, S. & Wheeler, D.R. (1996). Informal Regulation in Developing Countries: Evidence fromIndonesia. Journal of Political Economy, 104, 1314-27.
Robison, D.H. (1988) Industrial Pollution Abatement: The Impact on the Balance of Trade. CanadianJournal of Economics, 21, 702-706.
Tobey, J.A. (1990). The Effects of Domestic Environmental Policies on Patterns of World Trade: AnEmpirical Test. Kyklos, 43, 2, 191-209.
Wang, H. & Wheeler, D.R. (1996). Pricing Industrial Pollution in China: An Econometric Analysis of theLevy System. Policy Research Department Working Paper No. 1644. Washington, DC: The World Bank.
Wheeler, D.R. & Mody, A. (1992). International Investment Location Decisions: The Case of U.S. Firms.Journal of International Economics, 33, 57-76.
World Bank (1997). World Development Indicators 1997. Washington, DC: World Bank