in search of liquidity: an analysis of order submission ...finance/020601/news/kumar... · markets,...
TRANSCRIPT

In Search of Liquidity: An Analysis of Order Submission Strategies in Automated Markets*
Hendrik Bessembinder University of Utah
Marios Panayides University of Utah
Kumar Venkataraman Southern Methodist University
This Draft November, 2006
Comments Appreciated
* We thank Alex Butler, Kelsey Wei, and in particular, Harold Zhang, and seminar participants at the University of Texas at Dallas, the University of Oklahoma, and the University of Cyprus for valuable comments and discussion, Machiko Hollifield for programming assistance, and Marianne Demarchi of Euronext-Paris for assistance in obtaining the data.

In Search of Liquidity:
An Analysis of Order Submission Strategies in Automated Markets
Abstract
We study limit order traders’ joint decisions regarding order price, order size, and order exposure
in markets where they have the option to hide a portion of order size. Using order-level data
from Euronext-Paris, we document that hidden orders are used extensively by market
participants, representing approximately 44% of order volume. After controlling for
determinants of order price aggressiveness, order exposure, and order size, and allowing for
simultaneity in the decisions, we document that order aggressiveness and order exposure are
used as compliments, in that more price-aggressive orders tend to be exposed and less price-
aggressive orders are more often hidden. Further, the relation is attributable to orders that are not
expected to execute immediately, suggesting that traders are inclined to hide orders to mitigate
the option value of orders that are likely to be left standing in the book. We also find that order
size and order exposure are used by traders as substitutes, in that larger orders tend to be exposed
less.
1. Introduction
Electronic limit order markets, which automatically execute traders’ orders on the basis
of specified priority rules, account for a large and increasing percentage of global financial and
commodity trading.1 As a consequence, understanding optimal order submission strategies in
electronic markets is becoming increasingly important to investors as well as to those who
regulate and design automated markets. Those who wish to transact in an electronic limit order
market must submit buy or sell orders that specify size, i.e., the maximum number of shares to
transact, and price, i.e., the highest price to be paid or lowest price to be received. In many
markets, traders may also specify that a portion of order size be hidden, rather than displayed to
other market participants. In this paper, we use data drawn from the Euronext Paris market to
study the factors that affect limit order traders’ selection of order price, order size, and order
exposure. While prior studies (reviewed in Section 2) have considered aspects of limit order
price and order exposure decisions separately, our study is distinguished in part by our emphasis
on limit price, size, and exposure being modeled as simultaneous decisions, and our examination
of the extent to which traders use these order attributes as complements or substitutes.
Trades occur in financial markets as the successful outcome of a bilateral search for
trading partners. The odds of locating a trading partner typically increase if a potential trader
disseminates widely and credibly their interest in trading. For this reason, stock exchanges,
which have an interest in promoting trading activity, typically implement price and time priority
rules that encourage potential traders to be the first to submit attractively priced limit orders.
Under a typical priority system, those orders with limit prices aggressive enough to execute
against standing orders are matched first with standing orders displaying the best limit prices
(highest for purchase limits and lowest for sell limits), and among orders with the same price,
against the order placed earliest.
Many limit order stock markets, including the Toronto Stock Exchange, Euronext, the
Swiss Stock Exchange, the Madrid Stock Exchange, the Australian Stock Exchange, and the
Electronic Communications Networks (ECNs) that trade U.S. stocks, offer traders the ability to
enter buy or sell orders that are partially or wholly hidden from market participants. A hidden
(or “iceberg”) order’s price is displayed to other investors, but only a portion of the order’s full
1 In a study on stock exchanges around the world, Jain (2005) reports that electronic trading is the leading stock market structure in 101 of the 120 countries that the study investigates. Furthermore, of these 101 exchanges, 85 are fully electronic, with no floor trading.
1
size is displayed, typically subject to a minimum displayed size requirement. In some cases, e.g.
on the INET ECN or the Madrid Stock Exchange, hidden orders are not displayed at all.
Marketable orders execute against both the displayed and the undisplayed size of hidden orders.
If the marketable order does not fully exhaust the hidden portion of the order, the minimum
displayed size becomes visible, but the remainder stays hidden. Hidden orders typically
maintain price priority, but lose time priority to other orders at the same price.
Traders considering whether to expose the full size of their orders face both costs and
benefits of doing so. Exposing an order increases the chance that it will attract a counterparty
who is sufficiently interested in trading to monitor the market, but who has not yet revealed
herself. On the other hand, exposing an order could cause other traders to withdraw liquidity, if
they infer that the limit order submitter may have access to private information regarding
security value. Or, other traders could employ front-running strategies that take advantage of
information conveyed by a standing order. These considerations are likely to be magnified if the
order is larger. Hidden orders allow liquidity suppliers to control their order exposure risk, thus
lowering front-running costs and the value of the implicit option provided to other traders by
their limit order. The likelihood that other market participants will draw inferences on the
information content of an order is likely to be related to the price aggressiveness of the order and
the observed order size, since informed traders typically wish to complete trades before their
information becomes public. We argue that order exposure captures an important dimension of
order aggressiveness. We therefore anticipate that the cost of exposing order size will depend in
part on the limit price selected and in part on order size, so that limit prices, order size, and order
exposure will optimally be selected simultaneously.
To examine the determinants of order size, aggressiveness, and exposure, we rely on a
sample of 100 stocks traded on Euronext-Paris during the month of April 2003. The sample
includes a broad cross-section of stocks ranging from the most actively traded to illiquid stocks
that trade less than once per day on average. Our key findings are the following. First, hidden
orders are used extensively on Euronext. For the full sample, we document that 18% of the
incoming orders include a hidden size and 44% of the order volume is hidden. The usage of
hidden orders is more prevalent for the less liquid firms, increasing from 30% of order volume
for firms in the most liquid quintile to around 50% for firms in the less liquid quintiles, and for
larger orders, increasing from 5% of order volume for order sizes less than €5,000 to over 70%
2
for order sizes greater than €50,000. We also find that a higher proportion of orders that are not
expected to execute immediately have hidden depth, suggesting that traders are reluctant to
provide free trading options and are inclined to hide orders that are likely to be left standing in
the book.
Consistent with prior work, we document that orders are less aggressive when the spread
is wide and when market conditions are turbulent. We also find that, cross-sectionally, orders
are less likely to be hidden for stocks with a larger minimum tick size, which is consistent with
Harris (1996). We also find that the average waiting time between orders, a proxy for market
conditions, is positively related to hidden order usage, which likely reflects that a slower order
arrival rate reduces the cost of losing time priority on the hidden portion of the order. We
document that traders select larger order sizes when there is greater depth at the quotes (on both
the same and opposite side of the book), when more trades have recently executed, when the
prior trade execution was large, and when the market is more volatile.
We model the simultaneous choice of the limit price, order size, and portion of the order
to be displayed in a simultaneous regression framework. We document that greater order
exposure (a lesser percentage hidden) is accompanied by the use of more aggressive limit prices,
suggesting that aggressively priced orders are intended to execute quickly, either by taking
liquidity from the book or by drawing out passive traders by exposing size. We find that the
choice of a more aggressive limit order price is also accompanied by greater order exposure.
That is, a trader who wishes to complete a trade quickly can increase the odds of attracting
counterparties by offering a higher (lower) price for buy (sell) order, and by displaying more
size. Our results support the notion that traders view order exposure and order aggressiveness as
complements.
When we consider the role of endogenously selected order size, we find that, consistent
with Harris (1996) and Aitkin et al (2001), traders choose to hide a larger portion of their orders
when they have also selected larger orders. Thus, the data indicates that order exposure and
order size are substitutes. In contrast, we find no relation between endogenously selected order
size and order price aggressiveness.
These findings have important implications for stock exchanges, market regulators and
institutional trading desks. The portfolio of order types that traders can submit represents an
important dimension of trading system design. That a substantial volume of the incoming order
3
flow in Euronext includes a hidden size indicates that hidden orders are an important tool for
market participants to control order exposure risk. In the absence of such tools, market
participants may choose alternative means to complete their transactions e.g. relying on informal
upstairs markets to selectively expose orders, thereby lowering market quality and price
efficiency in the electronic exchange. Our findings may also prove useful for institutional
trading desks responsible for executing block orders received from portfolio managers. By
modeling the hidden dimension of liquidity for firms with varying liquidity characteristics and
by relating order exposure to market conditions, we provide insights on the circumstances when
liquidity is more likely to be hidden and when the search for hidden liquidity is likely to be most
important.
2. Our Analysis in Relation to the Recent Literature
Our paper is related to both the literature on the determinants of limit order price
aggressiveness and to that addressing the decision to use hidden limit orders. It is distinguished
from the existing literature in part because the order exposure decision and the order size
decision has been relatively unstudied, but also because we explicitly accommodate the fact that
order aggressiveness, order size, and order exposure decisions are made simultaneously, and we
relate the trader’s order submission strategies to market conditions, order characteristics and firm
liquidity.
2.1 The Literature on Order Submission Strategies.
Biais, Hillion and Spatt, (1995) were among the first to study order submission strategies,
using data on order flow on the Paris Bourse (one of the three markets that subsequently merged
to form Euronext). They report that traders monitor the evolution of the book and submit limit
orders rather quickly when the bid-ask spread widens or depth declines, which they attribute to
motivational effect of time priority rules. They also find that a large fraction of the limit orders
submitted are at prices at or within the quotes, which they attribute to price competition
stemming from price priority rules. Nevertheless, they find that the bulk of the unexecuted
orders in the limit order book tend to be at prices away from the quotes, reflecting that less
competitive orders take longer to execute.
Griffiths, Smith, Turnbull, and White (2000) study limit order submissions on the
Toronto Stock Exchange during June of 1997, focusing on relations between order price
4
aggressiveness and orders’ price impacts (or execution costs), measured as the difference
between an order’s weighted average execution price and the quote midpoint at order submission
time. They report a monotone positive relation between order aggressiveness and price impacts.
However, while passive orders have smaller price impacts conditional on execution, they also
execute less often. The authors also report that narrower spreads and more depth on the same
side (at the bid price for sales and at the ask price for purchases) lead to more aggressive orders,
resulting in improved execution probabilities in these more competitive market states.
Ronaldo (2006) generalizes Griffiths et. al. by also investigating the effect of market
volatility on order aggressiveness, and by investigating asymmetries in buy versus sell orders.
His study focuses on fifteen Swiss Stock Exchange issues during the months of March and April
1997. Like Griffiths et. al. he finds that limit order traders are more aggressive when the own
side of the book is thicker, which he attributes to the “crowding out” hypothesis formally
developed by Parlour (1998). He also finds that increased recent volatility is associated with
more aggressive orders, and that the crowding out effect is less notable for sell than buy orders.
Ellul, Holden, Jain, and Jennings (2006) provide a recent analysis of limit orders
submissions on the NYSE, focusing in particular on the autocorrelation properties of various
order types and interaction between orders that take and those that replenish liquidity. In
addition, a number of authors, including Chakravarty and Holden (1995), Anand, Chakravarty
and Martell (2005), and Bae, Jang, and Park (2003) have studied traders choice of market versus
limit orders. However, in many markets, including Euronext Paris, the distinction between
market and limit orders is only a matter of the degree of price aggressiveness: all orders are limit
orders; some are marketable (i.e. prices are aggressive enough that the order can be immediately
executed in whole or part against orders already in the book) while orders with less aggressive
prices are non-marketable, and enter the book.
2.2 The Literature on Hidden Orders
The existing work on hidden orders is primarily descriptive, with little theoretical
guidance. However, Harris (1996 and 1997) has articulated some important economic reasoning
relevant to understanding hidden order usage. He observes that some traders follow a passive
strategy, waiting for other traders to indicate their interest in trading on favorable terms. The
presence of passive or “reactive” traders increases the attractiveness of publicly displaying one’s
own interest in trading, to draw out the passive traders.
5

Other traders, in contrast, follow what Harris terms “defensive” and “parasitic” strategies.
If a display of trading interest, e.g. the posting of a large buy limit order, conveys that the limit
order trader may possess positive private information regarding security values, defensive traders
may react by ceasing to submit market sell orders and/or canceling existing limit sell orders,
which decrease the chance that the buy limit order will execute. Parasitic traders may seek to
exploit the existence of the large buy order by “front running” the order, or by using “order
matching” strategies, i.e. by posting a limit order at a price one tick more favorable than the
existing order.2 This reasoning implies that traders will be more likely to display orders when
passive traders are predominant, and will be more likely to hide orders in situations where traders
will become defensive or in the presence of parasitic traders.
Harris (1996) presents empirical evidence from the Paris Bourse that is largely consistent
with this reasoning. In particular, he finds that traders are more likely to display their orders
when the tick size is larger, as the tick size captures the cost of quote matching strategies. He
also reports that traders are more likely to hide size for large rather than small orders, and expose
less size when market volatility is high.
Aitken, Berkman, and Mak (2001) study the Australian Stock Exchange (ASX), where
hidden orders need to meet a minimum size threshold and are displayed to the public as having
size “U” (for undisplayed). Hence, market participants can observe all hidden orders on this
market. In contrast, orders that include a hidden quantity are not labeled as such on most other
markets that allow them. This distinction is important, because it implies that traders on most
markets can detect hidden orders with certainty only by firmly committing to trade through the
use of a marketable order, while ASX traders need not do so. Further, in contrast to most other
markets, the hidden portion of an order at the ASX does not lose time priority.
Aitken et al. find that price impact of hidden orders does not differ from that of other
limit orders, and conclude from this evidence that hidden orders are not primarily used by
informed traders. However, an alternative explanation is that informed traders do use hidden
orders, and that this strategy successfully mitigates price impact. In a cross-sectional analysis
that is similar to Harris (1996), Aitken et al report that hidden order use is positively related to
tick size, volatility, and order size. These results are consistent with Harris’ (1996) reasoning
2 The quote matching strategy relies on the fact that if the buy limit order is executed the quote matcher will capture any upward movement in prices, while if prices fall she can sell to the party that posted the original buy limit order and lose only one tick.
6

that limit order traders hide order size to reduce the value of the trading options that they provide
to other market participants.
Two other published papers provide evidence on hidden orders. Bessembinder and
Venkataraman (2004) show that hidden orders were commonly used on the Paris Bourse during
their 1997-98 sample. In particular, they find that the implied transaction costs for block-sized
marketable orders walking up the limit order book were on average only half as large when
hidden orders were considered as compared to costs that would have been incurred had the limit
order book contained only the displayed liquidity. Anand and Weaver (2004) examine the
abolition in 1996 and reintroduction in 2002 of hidden orders on the Toronto Stock Exchange.
Their key finding is that the size of the publicly displayed orders at the inside quote did not
change after either event, implying that total order size decreases when orders cannot be hidden.
In addition, several recent working papers consider aspects of hidden order usage. De
Winne and D’Hondt (2005) study 82 blue-chip Euronext stocks during the fourth quarter of
2002. They report that order aggressiveness depends in part on the presence of hidden orders at
the best quote, which they interpret to mean that traders can infer that hidden orders exist. An
alternate interpretation, which we investigate, is that order aggressiveness and exposure
decisions are simultaneous, with both dependent on market conditions. They also report that,
consistent with Bessembinder and Venkataraman (2004), hidden orders can substantially reduce
implicit transaction costs for traders using marketable orders.
D’Hondt, De Winne and Francois-Heude (2003) provide descriptive data regarding six
Euronext Paris stocks during December 2000. They find that hidden orders are concentrated at
the five price increments closest to the best quotes, and that hidden depth varies more across the
trading day than total depth. They also report that order exposure is higher during Euronext’s
pre-auction phase than during continuous trading.
Pardo and Pascual (2004) examine 79 stocks traded on the Madrid Stock Exchange
during the second half of 2000. Their primary conclusion, based on findings that spreads do not
widen and depth does not shrink after hidden order executions, is that hidden orders are primarily
used by large institutional liquidity traders, rather than informed traders. They also report that
hidden order usage displays a form of momentum, in that hidden orders can be forecast to a
degree based on lagged hidden orders and returns. A limitation of Pardo and Pascual (2004) is
the absence of actual data on hidden orders, the presence of which is instead inferred based on
7

execution prices. This implies that hidden orders that are never traded against are not included
in the study.
Hasbrouck and Saar (2002) study the Island ECN during the fourth quarter of 1999.
They document the extensive use of fleeting orders, which are limit orders that are cancelled
within a few seconds of order submission. These fleeting orders are likely used by aggressive
traders searching for hidden orders, which on Island are not displayed at all.
2.3 Our Contributions and Testable Predictions
The studies described in the preceding sections examine order aggressiveness and order
exposure, while effectively treating the two decisions as independent. The order size decision
appears to have been little studied. We consider it self-evident that limit order traders will select
the three attributes of their order decision, including order size, order price, and order exposure,
simultaneously in order to optimize their trading objectives.3 A formal model of traders’
decisions is beyond the scope of this empirical paper. We simply note that the three first-order
conditions that would emerge from a formal optimization model would, except under restrictive
assumptions, typically include each of the other choice variables. That is, the first order
condition for order size would typically also include as an argument for order aggressiveness and
order exposure, etc. If one decision variable, e.g. order size, enters the first order condition of
another decision variable, e.g. the percentage of the order exposed, with a positive (negative)
coefficient, then order size is a complement (substitute) to order exposure, etc.
Limit-order traders are likely to better attract trading interest from passive traders by
either posting a more aggressive price or by exposing the size of their order. However, these
two methods of attracting passive traders differ in their relative costs and benefits. A more
aggressive order gains price priority over orders at inferior prices, while a fully exposed order
gains time priority versus hidden orders at the same price. Further, the relative costs and
benefits are likely to depend on the limit price selected. The model presented by Easley and
O’Hara (1987) implies that, other things equal, informed traders are likely to submit larger and
more aggressive orders, because they typically have an interest in assuming large positions
before their information becomes public. Large, aggressively priced orders are therefore likely
to be perceived as originating with informed traders, which can cause defensive traders to exit
3 Indeed, a number of studies, including Lee, Mucklow and Ready (1993), Kavajecz (1999), Ready (1999), and Goldstein and Kavajecz (2004) have documented substitutability between the price and depth dimensions of quoted spreads on the NYSE.
8
the market, or parasitic traders to indulge in front running strategies. The informed limit order
trader may be able to counteract this effect by hiding a portion of their trading interest,
suggesting that both larger and more aggressively priced orders are more likely to be hidden.
We therefore anticipate that informed traders are likely to view order aggressiveness and order
exposure as substitutes, and are also likely to view order size and order exposure as substitutes.
The option value granted to other traders by a limit order depends both on price
aggressiveness and on the exposure decision. A trader who primarily wishes to transact quickly
will price their limit order aggressively so as to transact against orders in the book and/or attract
passive traders. An order that is immediately executed in part (full) provides less valuable (no)
options to other traders, implying a reduced benefit to hiding order size to further reduce the
value of the trading options. In contrast, a more patient trader can post a less aggressively priced
order in hopes that the market price will move towards the limit price. A less aggressive order
will likely remain in the book longer, thereby providing a more valuable option to other traders,
and more of need to mitigate the option value by hiding the order’s size. This line of reasoning
suggests that limit order price aggressiveness and limit order exposure may be used by more
patient traders as compliments, i.e. patient traders who price their orders more aggressively will
also choose to expose more of their orders’ size, while traders choosing less aggressive prices
will more likely choose to hide order size. Further, controlling for price aggressiveness, it may
be optimal for traders to hide size when suitable trading opportunities are rare, i.e., when the
order is expected to stand in the book for long, such as during slow moving markets or for less
actively traded stocks. These considerations are only enhanced for larger orders.
These discussions support the following testable hypothesis:
Hypothesis IA: If hidden orders are used primarily by informed traders who wish to protect themselves against defensive and/or parasitic trading strategies, then order aggressiveness and order exposure are likely to be viewed as substitutes.
Hypothesis 1B: If hidden orders are used primarily by patient traders whose orders are likely to remain on the books, then order aggressiveness and order exposure are likely to be viewed as compliments.
Hypothesis II: Order Size and Order Exposure are likely to be used as substitutes. Hypothesis III: Hidden order usage is expected to be greater for stocks with larger relative
tick size (Harris (1996)).
3. Sample selection and descriptive statistics
9
3.1. Sample selection
Our objective is to obtain a better understanding of the order submission strategies for a
broad cross-section of firms. Our initial sample consists of all stocks that are listed on Euronext-
Paris (N=1,109) in the Base de Donnees de Marche (BDM) database in April 2003. We retain
common stocks that have listed “France” as the home country, as prior research documents that
home country stocks exhibit trading patterns than differ significantly from cross-listed stocks.4
Less-liquid stocks on Euronext trade in a call auction market structure with auctions occurring
either once or twice a day. We eliminate all stocks that trade in the call auction, so that the
analysis captures the decision to make or take liquidity at the time of order submission.5 Prior
research also suggests that initial public offerings (IPOs) exhibit unusual trading patterns in the
initial months after listing, partly reflecting the market making activity of the underwriting
syndicate.6 We therefore eliminate stocks that appear for the first time in the BDM database after
December 2002. We also eliminate stocks that switched from continuous trading to call auctions
(or vice-versa) or were de-listed from the exchange in 2003. The screens reduce the sample size
to 320.
We select our sample based on transaction frequency during January 2003, choosing
firms with wide variation in market liquidity and adverse selection risk in a point in time prior to
our April 2003 main sample period. Trade, quote, and order data are obtained from the BDM
database. Based on the number of transactions in January 2003, the sample firms are sorted into
liquidity quintiles, with quintile 5 being most liquid and quintile 1 being least liquid. The final
sample consists of 20 firms that are selected randomly from each of the liquidity quintiles,
resulting in a final sample size of 100 firms.
3.2 Descriptive statistics
Table 1, Panel A, presents summary statistics for the full sample, and Panel B presents
the statistics by liquidity groups. For the full sample, the mean (median) stock price and market
capitalization in April 2003 are €54 (€43) and €2,990 million (€386 million), respectively. The
mean stock price does not differ markedly across liquidity groups, increasing from €42 for the
4 See Bacidore and Sofianos (2002) and Eleswarapu and Venkataraman (2006) for recent evidence on trading patterns of U.S. and cross-listed securities (ADR’s) on the NYSE. 5 For the same reason, we include only orders that arrive during regular trading hours, thereby excluding orders submitted for the opening and closing batch auction. We also implement a series of error filters. 6 See Corwin, Harris and Lipson (2004) for evidence from NYSE and Ellis, Michaely and O’Hara (2002) for evidence from Nasdaq.
10

least liquid to €60 for the most liquid group. However, within groups, the distribution of stock
price displays considerable variation, suggesting that it may be important to control for stock
price in a regression framework. As expected, the average market size increases monotonically
across liquidity groups, from €101 million for the least liquid to €12,155 million for the most
liquid group.
The market activity in a stock, measured as number of monthly trades or quote updates or
incoming orders or cumulative trading volume, exhibit wide variation across sample firms, as
evidenced by the significant difference between the mean and median statistic. In April 2003,
the average firm in the sample reported 4,920 trades, 6,475 quote updates, 20,840 order
submissions, and a cumulative monthly trading volume of 3.5 million shares. However, the
average firm in the least liquid quintile reported only 62 trades, 79 quote updates, 296 order
submissions, and a cumulative monthly trading volume of 13,563 shares. In sharp contrast, the
average firm in the most liquid quintile reported 22,227 trades, 29,180 quote updates, 92,229
order submissions, and a cumulative monthly trading volume of 16.9 million shares. The average
trade size and order size increases monotonically from the least liquid group to the most liquid
group. These statistics suggest that the sample selection approach has been successful in
identifying firms with different market activity and that order submission strategies are likely to
differ across liquidity groups.
4. An Analysis of the Order Submission Strategies
4.1. Institutional features
The majority of stock exchanges around the world operate as electronic limit order
markets. In these markets, liquidity is supplied by patient traders who submit limit orders that
specifies a quantity and a limit price - a maximum price for a buy order and a minimum price for
a sell order. The limit orders are registered in the electronic order book, and the highest limit
price to buy and the lowest limit price to sell at any point in time represents the best bid and offer
quote. A trade is completed when an impatient trader submits an aggressive order; that is, a buy
(sell) order that demands immediate execution and specifies a limit price that is higher (lower)
than or equal to the ask (bid) quote in the book.
Electronic exchanges differ considerably in their level of transparency; that is,
information on market conditions that is conveyed to market participants in a timely manner.
11

Transparency is often characterized as pre-trade transparency, which concerns disseminating
information about quotations and also unexecuted orders in the book, and post-trade
transparency, which concerns disseminating information about the recently completed trade,
such as the transaction price and quantity. Prior research has suggested that the level of
transparency has first order effects on execution quality and the evolution of prices.
The level of pre-trade transparency is related to order types that exchanges allow traders
to submit. Many electronic exchanges, including Euronext and many U.S. based-ECNs, allow
traders to use hidden limit orders, also called Iceberg orders, where only a portion of the total
quantity that the trader wishes to buy or sell is publicly displayed to other market participants.
Other electronic markets, such as the Hong Kong Stock Exchange, do not permit hidden orders.
When executing a block transaction, a trader might be unwilling to post the entire trading interest
in the electronic book, as parasitic traders could employ front-running or quote matching
strategies to take advantage of the large standing order. Hidden orders allow liquidity suppliers
to control the risk of exposing their orders, lowering the costs of front-running or quote
matching, and the value of the implicit trading option provided by a limit order.7
On Euronext, the order precedence rules are price, exposure, and time. Specifically, an
incoming buy (sell) order that desires full execution will first exhaust the depth on the best offer
(bid) and walk up (down) the book. At any price, the hidden portion is filled only after an
incoming order has exhausted the displayed portion. When the displayed size of a hidden order is
filled, the displayed quantity is automatically renewed and is positioned at the end of the queue
of displayed quantities. Thus, the cost of hidden order submission is the loss in time priority, as
the hidden portion of an order is executed only after exhausting displayed size of all orders at the
same price, including those orders that have arrived after the hidden order was submitted. While
some markets, such as U.S.-based INET, allow limit orders to be fully hidden (‘no display’
option), Euronext requires that each order must display at least 10 times the minimum trading lot
(10 shares).
4.2. Univariate analysis of Order Exposure Strategies
Table 2, Panel A, presents statistics on the percentage of orders that were submitted with 7 Many studies that examine the New York Stock Exchange’s floor-based market structure have argued that the floor broker acts as a smart limit order, displaying only a portion of the total order size to the entire market to minimize front running strategies, and selectively exposing the trading interests to those counterparties that are most likely to take the other side of the transaction. (See, for example, Hasbrouck and Sofianos (1993), Sofianos and Werner (2003) and Venkataraman (2001) for related discussions.)
12

a hidden size. We calculate the relevant statistic for each firm during April 2003 and report the
(cross-sectional) average across sample firms. For the full sample, 18% of the orders include a
hidden size. The usage of hidden orders is more prevalent for less liquid firms, increasing from
9% for firms in the most liquid quintile to over 20% for firms in the less liquid quintiles. This
pattern is consistent with the longer expected waiting time until execution, all else equal, for
limit orders in less liquid firms, due to lower order arrival rate. As a result, limit order traders
hide a portion of their order to lower the value of the implicit free trading option.
Consistent with the notion that hidden orders are particularly useful for large transactions
(Hypothesis II), we document a monotonic increase in hidden order usage with total order size.
For the full sample, only 1% of orders with size less than €1,000 has a hidden size. In contrast,
over 75% of orders with size greater than €50,000 had a hidden size. Controlling for order size,
hidden orders are used more frequently in less liquid firms, suggesting that liquidity providers
are more concerned about exposing size when executed large orders in less liquid firms.
Table 2, Panel B, presents statistics on the percentage of order volume that is hidden.
Remarkably, we document that, for the full sample, 44% of the incoming order flow in shares is
hidden. The percentage of order volume that is hidden is significant for all liquidity groups,
increasing from 30% for firms in the most liquid group to around 50% for firms in the less liquid
groups. Consistent with Panel A, hidden order volume increases with order size and that, after
controlling for order size, hidden order usage is more prevalent in less liquid firms.
Panel C, Table 2, presents statistics on hidden volume for those orders that include a
hidden size. For the full sample, the percentage of order volume that is hidden, conditional on a
hidden size, is 75%. Consistent with earlier results, the percentage of hidden volume is higher
for larger orders. However, the percentage of hidden order volume, conditional on a hidden size,
does not differ significantly across liquidity groups, suggesting that the motivation for hidden
order usage might be similar across firms.
4.3 Univariate Analysis of Order Aggressiveness and Order Exposure
Traders’ order submission strategies have been examined in a number of empirical
studies. In a seminal study, Biais, Hillion, and Spatt (1995) analyze the dynamics of order flow
in the Paris Bourse and relate the aggressiveness of incoming orders to market conditions.
However, to our knowledge, the prior literature on order aggressiveness has not studied the
interplay between order aggressiveness, size and exposure. We argue that order exposure
13

represents an important dimension of order aggressiveness. Specifically, after controlling for
order size and limit price, an order that displays trading interest is more aggressive than an order
that hides trading interest. In section 2, we developed the hypothesis that the choice between
order aggressiveness and order exposure is simultaneously determined and that traders may view
the exposure decision as a complement or a substitute to the aggressiveness decision. Here, we
present preliminary evidence on the interplay between the two decisions.
For descriptive purposes, we follow Biais, Hillion and Spatt (1995) in defining seven
categories of order aggressiveness on each side of the market. The first four categories represent
orders that demand liquidity from the book and the last three categories represent orders that
supply liquidity to the book. The Most Aggressive orders (category 1) represents buy (sell)
orders with order size greater than those displayed in the inside ask (bid) and with instructions to
walk up (down) the book until the order is fully executed. Category 2 represents buy (sell) orders
with order size greater than those displayed in the inside ask (bid) and with instructions to walk
up (down) the book, but the order specifies a limit price such that the order is not expected to
execute fully based on displayed book. Such an order may execute fully due to the hidden
liquidity but there exists the possibility that the order clears the book until the limit price and
converts into a standing limit order. Category 3 represents buy (sell) orders with the limit price
equal to the inside ask (bid) and with order sizes greater than those displayed in the inside ask
(bid). Such an order may execute fully due to hidden liquidity in the inside quote but there exists
the possibility that it converts into a standing limit order. Category 4 represents buy (sell) orders
with the limit price equal to the inside ask (bid) and with order size less than those displayed in
the inside ask (bid). These orders are expected to immediately execute the full size. Category 5
represents orders with limit prices that lie within the inside bid and ask prices. Category 6
represents buy (sell) orders with limit price equal to the inside bid (ask). Finally, Category 7
represents buy (sell) orders with limit price less (greater) than to the inside bid (ask).8
In order to categorize the aggressiveness of each order, we reconstruct from the BDM
data estimates of the limit order book, including liquidity that is publicly displayed and liquidity
that is hidden, at the time of each order submission. Our reconstruction of the limit order book
(LOB) closely follows the approach described in Appendix B of Bessembinder and
8 Biais, Hillion and Spatt (1995) define six categories of orders, as they combine categories 1 and 2 defined above into a single category. Our definitions are consistent with Biais et al for the other categories.
14
Venkataraman (2004). The BDM database contains information on all orders for all stocks,
including detailed order data on the total size and the hidden size for each incoming order.9 Our
approach can be briefly summarized as follows: During the period before the opening call
auction at 9:30 a.m., we accumulate orders that arrived before 9:30 a.m. and orders submitted on
prior trading days that have not expired, cancelled or fully executed. Using the auction clearing
price and size information from the trade file, we clear buy and sell orders in the book that
executed at the open. During the regular trading hours, we add newly arrived limit orders
(aggressiveness categories = 5, 6, 7) to the book. When an incoming order demands liquidity
(aggressiveness categories = 1, 2, 3, 4), we clear orders from the book based on the limit price
and size of the incoming order, and add any unexecuted portion of the incoming order to the
book. We cross-check the executed price and size with the trade file to ensure that our
reconstructed book is able to replicate information in the trade file.
The data also contains fields that allow tracking of the date and time of any modifications
made to an order; the only exception being that the data set does not record the time of order
cancellations. However, the database contains fields that allow us to identify orders that were
cancelled and the date of order cancellation, so the effect of not observing order cancellations
will never accumulate across days.10 These imperfections may cause us to sometimes overstate
limit order book depth during the trading day; however the BDM database contains variables that
allow an accurate assessment of the limit order book at the end of each day.
At the time of submission of each order, we estimate a snapshot of the limit order book
and accumulate information on book depth, both total and hidden, at different distances from the
quote midpoint. The snapshot provides detailed information on book depth and is an important
conditioning variable in the regression analysis. We categorize the aggressiveness of each order
by comparing its limit price and order size with the state of the book at the time of order
submission.
Table 3, Panel A, presents statistics on the percentage of orders with hidden size, by order
9 The order data provides information on the date and time of order submission; a buy and a sell indicator; the total size of the order (in shares); the displayed size (in shares); an order type indicator; a limit price in case of a limit order; an order validity variable with information on order expiration; etc. 10 In many instances, we are able to infer when an order has been cancelled. If we observe a quote revision but we do not observe a new order in the order file, we can infer that an order at the inside quote is cancelled. Further, as every transaction generates a quote revision, we cross check whether our reconstructed LOB generates the same quotes as the quote file. If we observe any discrepancies, it results from an order cancellation. In many instances, we can identify and delete a cancelled order to make the constructed LOB consistent with the quote file.
15

aggressiveness groups, for the full sample. Traders who submit orders that are expected to
execute fully based on displayed depth, category 1 and 4, are least likely to use hidden orders.
Only 1% of the orders in category 4 and 7% of orders in category 1 are submitted with a hidden
size. In contrast, traders are more likely to hide orders (26%) that would be left standing in the
book and would provide free trading options to market participants. We document that almost
20% of orders that are not expected to execute immediately, categories 5, 6 and 7, have hidden
depth. Similarly, orders that are expected to be left standing in the book after partial execution,
category 2 and 3, also exhibit a higher proportion of hidden orders.
Table 3, Panel B, presents statistics on the percentage of order volume that is hidden, by
order aggressiveness groups. Consistent with Panel A, we document that hidden order usage is
more prevalent in the less aggressive order categories, where almost 50% of the order volume is
not publicly displayed. The relation between order aggressiveness and order exposure is similar
after controlling for order size. It is interesting to note that, for order size greater than €50,000,
traders who submit less aggressive orders choose to hide over 75% of the order size. From Panel
C, we observe that, conditional on a hidden size, the percentage of order volume that is hidden is
higher for orders that are expected to be left standing relative to orders that are expected to
execute fully.
The univariate analysis provides empirical evidence consistent with the discussions in
section 2 and indicates economic variables that should be included in the regression analysis.
The findings provide preliminary support for the hypothesis that the choice between order
aggressiveness and order exposure is simultaneously determined, suggesting that the trader’s
decision process should be modeled in a simultaneous equation framework.
4.5 The Joint Determinants of Order Aggressiveness, Size, and Exposure
In this section, we report the results of multivariate analyses of limit order traders’ price
aggressiveness, size, and exposure decision. Importantly, we explicitly allow for traders
simultaneous selection of their limit price, the order size, and the portion of their order size that
will be hidden. We model the following set of simultaneous equations on a firm by firm basis:
16
Aggressiveit = α0 + α1PctHiddenit + α2OrderSizeit + α3Volatilit + α4Aggressiveit-1 +
α5DepthSameit + α6DepthOppit + α7Spreadit + α8HiddenSameSideit-1 +
α9HiddenOppSideit-1 + εit (1)
PctHiddenit = γ0 + γ1 Aggressiveit + γ2OrderSizeit + γ3Volatilit + γ4WaitTimeit +
γ5HiddenSameSideit-1 + γ6HiddenOppSideit-1 + ηit (2)
OrderSizeit = δ0 + δ1PctHiddenit + δ2 Aggressiveit + δ3Volatilit + δ4DepthSameit +
δ5DepthOppit + δ6TradesHourit + δ7TradesHalfHourit + δ8TradesSizeit-1 +
δ9HiddenSameSideit-1 + δ10HiddenOppSideit-1 + νit (3)
where Aggressive is a continuous measure of order aggressiveness, defined as the distance in
basis points of the order’s limit price from the opposite quote price (positive aggressiveness
indicates the order will execute in whole or part, and thus, is taking liquidity from the book,
while negative aggressiveness implies the order will not immediately execute, and thus provides
liquidity); PctHidden is the percentage of total order size that is hidden; Volatil is the standard
deviation of quote midpoint returns over the preceding hour; DepthSame is the displayed depth
at the best bid (ask) for a buy (sell) order; DepthOpp is the displayed depth at the best ask (bid)
for a buy (sell) order; spread is the percentage bid-ask spread; OrderSize is the total (exposed
plus hidden) size of the order; WaitTime is the average elapsed time between the prior three
order arrivals on the same side; HiddenSameSide is the size of hidden orders revealed by the last
transactions for orders on the same side as the current order; HiddenOppSide is the size of
hidden orders revealed in the last transaction for orders in the opposite side of the current order;
TradesHour is the number of trades in the last hour; TradesHalfHour is the number of Trades in
the last half hour divided by the number of orders in the last hour; TradesSize is the size of the
last trade; and the subscript “i,t” refers to the time t order in stock i.
The exogenous explanatory variables for equations modeling order aggressiveness and
order exposure are based on the discussions in the literature review (Section 2). For order size,
we anticipate that traders will enter larger orders at times when they can reasonably expect more
shares to execute, i.e. when there is more depth in the book and when the market has recently
been more active. We anticipate that order size will depend on market volatility. Finally, we
anticipate that order size will be affected by the revelation that hidden orders exist on the same
side of the market, due to a crowding out effect (Parlour 1997).
17

To render results more comparable across stocks, we normalize some variables. The
depth and spread variables are each normalized by dividing the actual observation by the median
for that stock during the month, while order size and trade Size are normalized by dividing the
actual observations by the stock’s average daily trading volume. Since each trader will select
order price, size and the extent to which the order is exposed simultaneously so as to maximize
their objective function, we treat PctHidden, OrderSize and Aggressive as endogenous variables,
and employ two-stage least squares to estimate the simultaneous equations model. The model is
identified by exclusion restrictions.
Equations 1 to 3 are estimated on a firm-by-firm basis. Table 4 reports results aggregated
across firms using the Bayesian framework of DuMouchel (1994). In particular, we use the
following model for each individual time series estimated coefficient (i is the i-th time series-
company):
iβ̂
),(...~|ˆ 2iiii sNdii βββ
and each
),(...~ 2σββ Ndiii
where N is the Gaussian distribution. We estimate β and by maximum likelihood. The
aggregated estimate is obtained from the N individual firm estimates as:
2σ
∑
∑
=
=
+
+= N
i elmi
N
i elmi
i
s
s
12
..2
12
..2
)ˆ(1
)ˆ(
ˆ
ˆ
σ
σβ
β (3)
and the variance of the aggregate estimate is:
∑= +
= N
i elmis
Var
12
..2 )ˆ(
11)ˆ(
σ
β (4)
where is the maximum likelihood estimator of . The aggregate t-statistic is based on
the aggregated coefficient estimate relative to the standard error of the mean estimate. Note that
the Bayesian aggregation method allows for cross-sectional difference in the precision with
which is estimated, and places more weight on more precise estimates.
2..ˆ elmσ 2σ
iβ̂
Focusing first on the results of estimating equation (1) for price aggressiveness, we note
18

from column (1) in Table 4 that the most significant variable is the bid-ask spread. Consistent
with the results reported by Griffiths et al (2000), the negative coefficient implies that orders are
less aggressive when the spread is wide, as limit order traders prefer to provide liquidity rather
than take liquidity from the book. We obtain a positive and significant coefficient on lagged
order aggressiveness, which is also consistent with results reported by Griffiths (et al), and
implies a degree of momentum in order aggressiveness. We estimate a significant negative
coefficient (t-statistic = -6.7) on market volatility, implying that orders are less aggressive when
market conditions are turbulent. This likely reflects limit order traders concerns that their orders
may be “picked off” by better-informed traders during times of greater uncertainty. Our results
do not support the “crowding out” hypothesis of Parlour (1997), as we do not detect a significant
effect on price aggressiveness of depth on either the same or the opposite side. The positive and
significant (t-statistic = 2.6) on HiddenOppSid is consistent with the reasoning that the revelation
of hidden depth attracts reactive traders seeking to execute against additional hidden size that
may be present.
Importantly, we estimate in equation (1) a significant negative coefficient (t-statistic =
-2.4) on the percentage of the order that is hidden. This implies that a choice to expose more of
an order (a lesser percentage hidden) is associated also with the use of more aggressive limit
prices, after allowing for endogeneity and time series variation in other explanatory variables.
This result implies a complimentary relation, in that the limit price is more aggressive when the
order is more exposed, other things equal. Aggressively priced orders tend to also be exposed,
while orders placed away from the best quotes tend to be hidden. This likely reflects that
aggressively price orders are intended to execute quickly, either by taking liquidity from the
book or by drawing out passive traders. Exposing these orders helps to attract passive traders,
and a quick execution implies that costs associated with defensive traders withdrawing from the
market or predatory traders attempting quote matching strategies are mitigated.
Results of estimating equation (2) on a firm-by-firm basis are also reported on Table 4.
A significant determinant of the decision to hide orders is the simultaneous selection of order
size (t-statistic = 6.8). The positive coefficient implies that traders choose to hide a greater
percentage of their orders when they have also elected to use a large order size. The result,
consistent with that of Harris (1996) and Aitkin et al (2001), likely reflects that large limit order
traders seek to mitigate reactions by either defensive or predatory traders that would result from
19
the public exposure of a large order. We also find that the percentage of the order that is hidden
is positively related (overall t-statistic = 2.97) to average waiting time between orders. A slower
order arrival rate implies a decreased likelihood that a subsequent limit order will arrive at the
same price, meaning that the loss of time priority due to hiding a portion of the order is less
costly. We also document that the traders choose to hide more of their orders when the
execution of the prior trade on either the same (t-statistic = 5.9) side reveals the presence of
hidden orders, implying a degree of momentum in the order exposure decision. Somewhat
surprisingly, we do not detect a significant effect of market volatility on the exposure decision.
We document a negative effect of endogenously selected order aggressiveness on the
percentage of the order that is hidden (t-statistic = -2.4), after controlling for simultaneity and
variation in other variables. This implies that the choice of a more aggressive limit order price
also leads to greater order exposure. A more aggressive price may be interpreted by market
participants as suggestive that the limit order submitter possesses private information. Exposing
more of the order can offset that perception, attracting more passive traders or preventing passive
traders from becoming defensive. Further, a more aggressive price implies a quicker execution
on average, and a reduced need to limit the option value of the limit order by hiding its size.
We investigate further the effect of order aggressiveness on the decision to expose the
order. Increasing price aggressiveness beyond the opposite quote (i.e. increasing buy limit prices
above the ask quote or decreasing sell limit prices below the bid quote) takes liquidity from the
book and the order immediately executes, at least in part. In contrast, increasing price
aggressiveness while still outside the quotes (increasing buy limit prices toward the ask, or
decreasing sell limit prices toward the bid) makes the orders more attractive to passive traders,
but generally results in the order standing in the book for a period of time. To assess whether
the effect of price aggressiveness on the exposure decision depends on the limit price relative to
the quotes, we estimate a simultaneous system that replaces expression (2) above with:
PctHiddenit = γ0 + γ 11D1Aggressiveit + γ 12D2Aggressiveit + γ 13D3Aggressiveit + γ2OrderSizeit +
γ3Volatilit + γ4WaitTimeit + γ5HiddenSameSideit-1 + γ6HiddenOppSideit-1 + ηit (2a)
where D1 is an indicator variable that equals one for limit orders priced outside the best same-
side quote (aggressiveness categories 6 and 7) and zero otherwise, D2 is an indicator variable
20

that equals one for limit orders priced in the range from best ask to best bid (aggressiveness
category 5) and zero otherwise, and D3 is an indicator variable that equals one for limit orders
priced beyond the opposite side quote (aggressiveness categories 1 to 4) and zero otherwise.
Results, reported in columns (2) of Table 4, imply that relation between order
aggressiveness and order exposure is highly non-linear. The negative effect of increased order
aggressiveness on the portion of the order that is hidden is attributable to orders placed outside
the quotes (i.e. sell orders above the ask and buy orders below the bid), which are not expected to
automatically execute (t-statistic of -8.8). Specifically, for the least aggressive orders, which are
likely to remain on the books for a period of time, traders expose the least shares. This is
consistent with the reasoning that traders are reluctant to provide free trading options to other
market participants and are inclined to hide orders that are likely to be left standing in the book.
As prices become more aggressive in this range (i.e. prices approach the quote), traders elect to
hide less of their orders, perhaps to attract reactive traders. Within the quotes, increased
aggressiveness is not associated with any additional reduction in the portion of the order hidden
(t-statistic = -0.2). Surprisingly, for orders with prices beyond the opposite quote, i.e. for orders
that will execute at least in part against the book, increased price aggressiveness is associated
with an increase (t-statistic = 9.8) in the proportion of the order that is hidden. This may reflect
that traders are concerned that changes in circumstances that cause opposite side traders to
withdraw liquidity (leading to non-execution of an aggressive order) should also imply caution in
order exposure, as these aggressively priced orders are more likely to be perceived to be
information motivated.
Table 4 also reports results of estimating equation (3) for order size. The results are
strongly consistent with the reasoning that traders increase order size when markets are active
and can reasonably be expected to absorb more shares. Estimated coefficients on same side
quote depth (t-statistic 3.6), opposite side quote depth (t-statistic = 3.6), the number of trades in
the prior hour (t-statistic = 3.4) and the size of the most recent trade execution (t-statistic = 9.6)
are all positive and significant. Order size decreases (t-statistic = -8.3) if the prior trade
execution reveals hidden depth on the same side, which can likely be attributed to a crowding out
effect similar to that described by Parlour (1997).
Regarding interactions between the simultaneously selected variables, we document a
positive (t-statistic = 4.5) effect of the percentage hidden on order size. The estimated
21

coefficient on order aggressiveness does not differ significantly from zero (t-statistic = -0.3),
suggesting that order aggressiveness and order size are neither substitutes nor complements, i.e.
are for practical purposes selected independently.
4.6 Cross-Sectional Estimation
Data limitations forced the exclusion of some important variables from the firm-by-firm
analysis reported in Table 4. For example, Harris (1996) has argued and presented evidence that
the relative tick size affects order exposure decisions. In the present sample tick size varies
across stocks, but for most stocks does not vary through time. Cross-sectional estimation allows
us to assess whether average order aggressiveness, the average percentage of orders that are
hidden, and average order size are related to the tick size, as well as other attributes that vary
across firms, but not through time. In addition to tick size, we include in the cross-sectional
regressions the market capitalization of stock and total trading activity during the sample month.
However, simple averages of the dependent variables computed over all observations in
the sample month will be affected by outcomes on the various explanatory variables that proxy
for market conditions and were included in equations (1) to (3). To assess whether tick size,
market capitalization, and overall trading activity affect average outcomes on the dependent
variables after controlling for variation in market conditions, we regress estimated intercepts
obtained when estimating equations (1) to (3) on these firm characteristics.11
Results are reported in Table 5. In the regression explaining intercepts for percentage
hidden (Panel B), we observe a negative and highly significant coefficient on the relative tick
size, which provides strong empirical support for Harris (1996) prediction that traders will
display more size when the relative tick size is larger (Hypothesis III). The positive coefficient
on either trading activity or market capitalization indicates that traders tend to hide size in more
actively traded firms and larger firms. This result is the opposite of what might be expected
based on the raw data, for example as displayed in Figure 1. The positive univariate relation
between trading activity and order exposure observed in the raw data can therefore be attributed
to endogeneity and cross-sectional variation in average market conditions. 11 Regression intercepts in general measure the mean of the dependent variable, conditional on explanatory variables being set to zero. We do wish to evaluate conditional means at a common level of the explanatory variables. However, outcomes of zero on the explanatory variables lie outside the economically relevant range. We therefore normalize every individual explanatory variable on the right side of equations (1), (2), and (3) by deducting the full sample mean of the explanatory variable. Note that only intercepts are affected by the normalization. The new intercepts are interpreted as the conditional mean outcome on the dependent variable, evaluated for each firm at the full-sample average of the explanatory variables.
22

Panels A and C of Table 5 report results obtained when regressing intercepts from
equations (1) and (3) for order aggressiveness and order size, respectively on firm characteristics.
Most notably, these results indicate that a larger tick size encourages the submission of larger
orders, but at less aggressive prices. The result with respect to order size is consistent with
studies of the decimalization of U.S. markets, which reported that order and trade sizes decreased
with the reduction in the tick to one cent. The result with respect to price aggressiveness may
reflect that increased coarseness of the pricing grid constrains the minimum possible spread to be
larger. Finally, we document that orders are on average more aggressive for larger and more
actively traded stocks, which may reflect decreased risk of being picked off and lower inventory
holding costs for liquidity providers.
5. Conclusions and Extensions
Hidden orders are allowed on most limit order based markets to help liquidity providers
control the order exposure risk. Traders considering whether to expose the size of their orders
face both costs and benefits of doing so. Exposing an order increases the chance that it will
attract counterparty. On the other hand, exposing an order could cause other traders to withdraw
liquidity, or employ front-running strategies.
To examine the determinants of order aggressiveness and order exposure, we rely on a
sample of 100 stocks traded on Euronext-Paris during the month of April 2003. The sample
includes a broad cross-section of stocks ranging from the most actively traded to illiquid stocks
that trade less than once per day on average. We document that hidden orders are used
extensively on Euronext, and more so for larger orders and for less actively traded stocks.
We model the simultaneous choice of the limit price, order size, and the portion of the
order size to be displayed in a simultaneous regression framework. Consistent with prior work,
we document that orders are less aggressive when the spread is wide and when market conditions
are turbulent. We document that traders choose to hide a greater percentage of their orders when
they have also simultaneously elected to use a larger order size, suggesting that traders mitigate
reactions by either defensive or predatory traders on observing a larger size by hiding a portion
of the order. Our results also support the notion that traders view order exposure and order
aggressiveness as complements, in that more price aggressive orders tend to be exposed and less
price aggressive orders are more often hidden. Further, the relation is attributable to orders that
23

are not expected to execute immediately, and are likely to remain on the books for a period of
time. These findings suggest that traders are reluctant to provide free trading options and are
inclined to hide orders that are likely to be left standing in the book.
These findings have important implications for stock exchanges, market regulators and
institutional trading desks. The portfolio of order types that traders can submit represents an
important dimension of trading system design. That a substantial volume of the incoming order
flow in Euronext includes a hidden size indicates that hidden orders are an important tool for
market participants to control order exposure risk. In the absence of such tools, market
participants may choose alternative means to complete their transactions e.g. relying on informal
upstairs markets to selectively expose orders, potentially lowering market quality and price
efficiency in the electronic exchange. Our findings may also prove useful for institutional
trading desks responsible for executing block orders received from portfolio managers. By
modeling the hidden dimension of liquidity for firms with differing liquidity characteristics and
by relating order exposure to market conditions, we provide insights on the circumstances when
liquidity is more likely to be hidden and when the search for hidden liquidity is likely to be most
important.
24

References
Aitken, M., Berkman, H., and D. Mak, 2001, The use of undisclosed limit orders on the Australian Stock Exchange, Journal of Banking and Finance, 25, 1589-1603.
Anand, A., S. Chakravarty, and T. Martell, 2005, “Empirical Evidence on the Evolution of
Liquidity: Choice of Market versus Limit Orders”, Journal of Financial Markets, 8, 265-287. Anand, A., and D.G. Weaver, 2004, Can order exposure be mandated?, Journal of Financial
Markets, forthcoming. Bacidore, J.M., and G. Sofianos, 2002, Liquidity provision and specialist trading in NYSE-listed
non-U.S. stocks, Journal of Financial Economics, 63, 133-158. Bae, K., H. Jang, and K. Park, 2003, “Traders’ choice between limit and market orders: Evidence
from NYSE stocks”, Journal of Financial Markets, 6, 517-538. Bessembinder, H., and K. Venkataraman, 2004, Does an Electronic Stock Exchange need an
Upstairs Market?, Journal of Financial Economics, 73, pg. 3-36.. Biais, B., Hillion, P. and C. Spatt, 1995, An empirical analysis of the limit order book and the
order flow in the Paris bourse, Journal of Finance 50(5), 1655-1689. Chakravarty, S., and C. Holden, 1995, An integrated model of market and limit orders, Journal
of Finance, 4, 213-241. Chung, K., L., Van Ness, B., F., and Van Ness, R., A., 1999, Limit Orders and the Bid-Ask
Spread, Journal of Financial Economics, 53, 255-287 Corwin, S., J. Harris and M. Lipson, 2004, The development of secondary market liquidity for
NYSE-listed IPOs, Journal of Finance, 59 (5), 2339-2373. D’Hondt, C., and R. De Winne, 2005, Market Transparency and Trader Behavior: An analysis on
Euronext with full order book data, Working Paper, FUCaM EDHEC Business School. Dodd, O., and Warner, J., 1983. On Corporate Governance: A study of Proxy Contests, Journal
of Financial Economics, 11, 401-438. Easley, D. and M. O'Hara, 1987, "Price, Trade Size and Information in Securities Markets,"
Journal of Financial Economics, pp. 69-90. Eleswarapu, V., and Venkataraman, K., 2006, The Impact of Legal and Political Institutions on
Equity Trading Costs: A Cross-country Analysis, Review of Financial Studies, 19 (3), 1081-1111.
Ellis, K., R., Michaely, and M. O’Hara, 2000, When the underwriter is the market maker: An
25

examination of trading in the IPO market, Journal of Finance, 55, 2289-2316. Ellul, A., Holden, C., Jain, P., and R. Jennings, 2006, “Order Dynamics, Recent Evidence from
the NYSE”, working paper, Indiana University. Goldstein, M., and K. Kavajecz, 2004, Trading strategies during circuit breakers and extreme
market movements, Journal of Financial Markets, 7, 301-333. Griffiths, M., Smith, B., Turnbull, D. and R. White, 2000, The costs and determinants of order
aggressiveness, Journal of Financial Economics 56, 65{88}. Harris, L., 1996, Does a minimum price variation encourages order exposure?, Working Paper,
Marshall School of Business. Harris, L., 1997, Order Exposure and Parasitic Traders, Working Paper, Marshall School of
Business. Hasbrouck, J., and G. Sofianos, 1993, The trades of market makers: An analysis of NYSE
specialist, Journal of Finance, 48, 1565-1594. Hasbrouck, J., and G. Saar, 2004, Limit Orders and Volatility in a Hybrid Market: The Island
ECN, Working Paper, NYU Stern School of Business. Jain, P., 2005, Financial Market Design and the Equity Premium: Electronic versus Floor
Trading, Journal of Finance, 60(6), 2955-2985. Kavajecz, K., 1999, The specialist's quoted depth and the limit order book, Journal of Finance,
52(2), 747-771. Lee, C., Mucklow, B., and M. Ready, 1993, Spreads, depth and the impact of earnings
information: An intraday analysis, Review of Financial Studies 6, 345-374. Meulbroek, L., 1992. An empirical analysis of illegal insider trading, Journal of Finance, 47,
1661-1699. Pardo, A. & Pascual, R., 2003, On the hidden side of liquidity, Working Paper - University of
Valencia . Ranaldo, A., 2004, Order aggressiveness in limit order book markets, Journal of Financial
Markets 7, 53-74. Sofianos, G., and I., Werner, 2003, The trades of NYSE floor brokers, Journal of Financial
Markets, 139-176. Warner, J., Watts, R., and Wruck, K., 1988, Stock prices and top management changes, Journal
of Financial Economics, 20, 461-492.
26

Venkataraman, K., 2001, Automated versus Floor Trading: An analysis of execution costs on the
Paris and New York exchanges, Journal of Finance, 56 (4), 1445-1885.
27
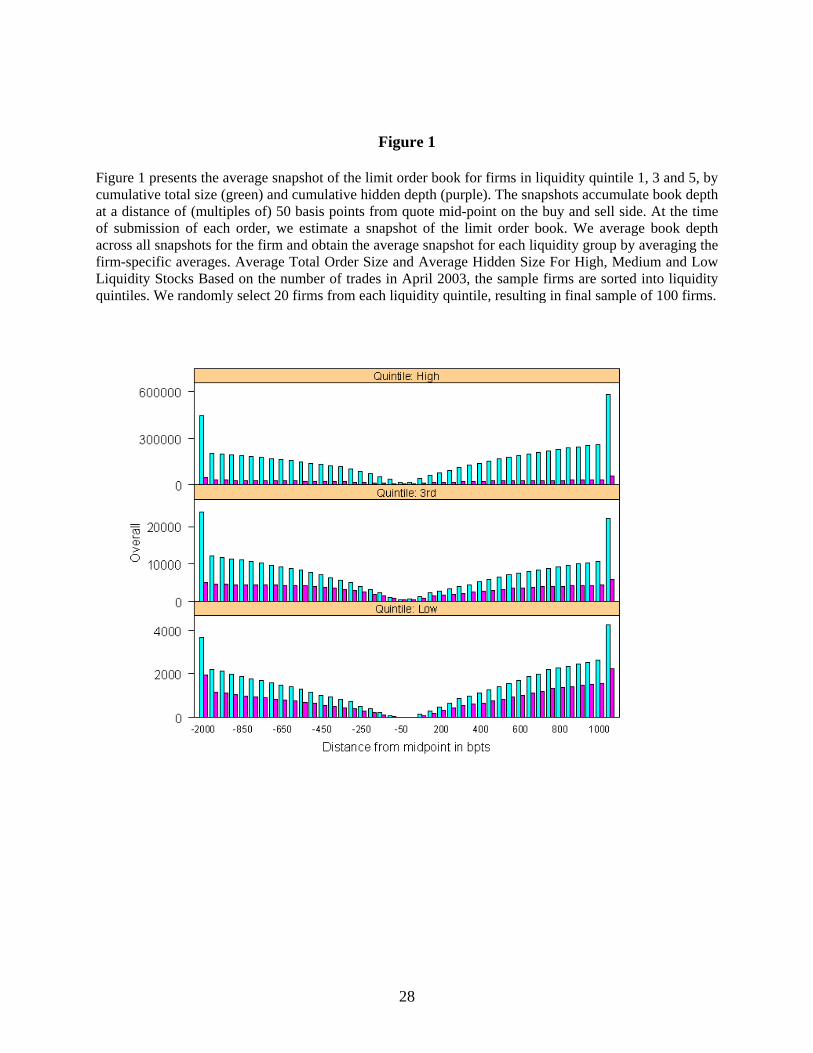
Figure 1
Figure 1 presents the average snapshot of the limit order book for firms in liquidity quintile 1, 3 and 5, by cumulative total size (green) and cumulative hidden depth (purple). The snapshots accumulate book depth at a distance of (multiples of) 50 basis points from quote mid-point on the buy and sell side. At the time of submission of each order, we estimate a snapshot of the limit order book. We average book depth across all snapshots for the firm and obtain the average snapshot for each liquidity group by averaging the firm-specific averages. Average Total Order Size and Average Hidden Size For High, Medium and Low Liquidity Stocks Based on the number of trades in April 2003, the sample firms are sorted into liquidity quintiles. We randomly select 20 firms from each liquidity quintile, resulting in final sample of 100 firms.
28

Table I Descriptive Statistics on Sample
The average market capitalization, stock price, daily return volatility, monthly trading volume, trade and order size, and monthly trading activity in April 2003 are reported for the over all sample (in Panel A) and for each liquidity group (in Panel B). Based on the number of trades in April 2003, the sample firms are sorted into liquidity quintiles. We randomly select 20 firms from each liquidity quintile, resulting in the final sample of 100 firms. The data are obtained from the Base de Donnees de Marche (BDM) database from Euronext-Paris.
N Mean Median Std Dev Maximum Minimum
Panel A: Descriptive statistics based on firm averages, full sample
Average Stock Price (in €) 100 54 43 48 235 1Market Capitalization (in € millions) 100 2,990 386 7,821 65,121 3Number of monthly trades 100 4,920 325 10,137 44,267 12Number of monthly quote updates 100 6,475 379 13,253 58,309 15Number of monthly orders 100 20,840 1,273 42,312 210,444 28Cumulative Monthly Trading Volume (in shares) 100 3,512,852 54,619 11,394,139 98,362,569 723Daily Return Volatility (%) 100 3 2 2 21 1Average Trade Size (in shares) 100 397 204 652 4,323 20Average Order Size (in shares) 100 676 400 883 5,821 26
Panel B: Descriptive statistics based on firm averages, by liquidity quintiles
Least Liquid QuintileAverage Stock Price (in €) 20 42 40 33 124 4Market Capitalization (in € millions) 20 101 69 89 275 4Number of monthly trades 20 62 57 39 145 12Number of monthly quote updates 20 79 71 48 179 15Number of monthly orders 20 296 264 189 680 28Cumulative Monthly Trading Volume (in shares) 20 13,563 5,638 17,800 59,686 723Daily Return Volatility (%) 20 4 3 4 21 1Average Trade Size (in shares) 20 193 138 184 728 23Average Order Size (in shares) 20 404 313 310 1,208 50
Liquidity Quintile 2Average Stock Price (in €) 20 50 47 47 165 1Market Capitalization (in € millions) 20 591 192 1,325 5,897 3Number of monthly trades 20 132 127 76 301 34Number of monthly quote updates 20 162 163 89 359 42Number of monthly orders 20 611 635 308 1,183 171Cumulative Monthly Trading Volume (in shares) 20 30,575 13,986 38,944 164,989 2,553Daily Return Volatility (%) 20 2 2 1 5 1Average Trade Size (in shares) 20 349 133 814 3,750 20Average Order Size (in shares) 20 589 351 870 3,357 26
29

……continued
N Mean Median Std Dev Maximum Minimum
Liquidity Quintile 3Average Stock Price (in €) 20 61 47 58 235 1Market Capitalization (in € millions) 20 634 395 803 3,547 7Number of monthly trades 20 353 338 222 833 88Number of monthly quote updates 20 440 407 268 900 114Number of monthly orders 20 1,835 1,468 1,621 7,543 387Cumulative Monthly Trading Volume (in shares) 20 157,426 37,876 303,500 1,121,519 3,870Daily Return Volatility (%) 20 2 2 2 9 1Average Trade Size (in shares) 20 430 134 723 2,556 25Average Order Size (in shares) 20 766 250 1,174 4,641 69
Liquidity Quintile 4Average Stock Price (in €) 20 57 43 50 180 2Market Capitalization (in € millions) 20 1,471 1,118 1,528 6,933 176Number of monthly trades 20 1,828 1,548 1,135 4,646 331Number of monthly quote updates 20 2,514 1,870 1,803 6,579 387Number of monthly orders 20 9,230 6,134 8,206 30,052 1,003Cumulative Monthly Trading Volume (in shares) 20 416,949 336,412 333,731 1,382,817 44,502Daily Return Volatility (%) 20 2 2 1 5 1Average Trade Size (in shares) 20 252 185 194 882 63Average Order Size (in shares) 20 441 310 319 1,226 172
Most Liquid QuintileAverage Stock Price (in €) 20 60 48 52 199 2Market Capitalization (in € millions) 20 12,155 7,904 14,229 65,122 219Number of monthly trades 20 22,227 22,417 11,740 44,267 2,585Number of monthly quote updates 20 29,180 27,981 15,143 58,309 2,733Number of monthly orders 20 92,229 90,778 49,967 210,444 7,207Cumulative Monthly Trading Volume (in shares) 20 16,945,746 12,186,656 20,945,750 98,362,569 1,370,177Daily Return Volatility (%) 20 3 3 1 4 2Average Trade Size (in shares) 20 759 601 867 4,323 202Average Order Size (in shares) 20 1,177 987 1,146 5,821 352
30

Table II Descriptive Statistics on Hidden Orders, by Firm Liquidity and Order Size
The table presents descriptive statistics on hidden order usage in April 2003 by liquidity quintiles and by order size. The relevant statistic is calculated for each firm during April 2003 and the table reports the (cross-sectional) average across sample firms. Based on the number of trades in April 2003, the sample firms are sorted into liquidity quintiles. We randomly select 20 firms from each liquidity quintile, resulting in the final sample of 100 firms. Panel A presents statistics on the percentage of orders that were submitted with a hidden size. Panel B presents statistics on the percentage of order volume that is hidden. Panel C presents statistics on hidden volume for those orders that include a hidden size. The data are obtained from the Base de Donnees de Marche (BDM) database from Euronext-Paris.
All Orders Less than 1,000 1,000-5,000 5,000-50,000 50,000-250,000 Greater than 250,000
Panel A: Percentage of orders with a hidden size (based on firm average)
Full Sample 18% 1% 5% 34% 75% 76%Least Liquid Quintile 21% 1% 6% 46% 87% 80%Quintile 2 23% 2% 10% 44% 87% 92%Quintile 3 21% 1% 6% 46% 88% 75%Quintile 4 15% 0% 2% 27% 81% 80%Most Liquid Quintile 9% 0% 1% 7% 43% 69%
Panel B: Percentage of order volume that is hidden (based on firm average)
Full Sample 44% 1% 4% 35% 69% 72%Least Liquid Quintile 45% 0% 5% 48% 82% 73%Quintile 2 48% 1% 7% 43% 79% 90%Quintile 3 53% 1% 5% 46% 80% 74%Quintile 4 43% 0% 2% 29% 74% 78%Most Liquid Quintile 30% 0% 0% 7% 39% 62%
Panel C: Conditional on a hidden size, the percentage of order volume that is hidden
Full Sample 75% 15% 46% 71% 87% 90%Least Liquid Quintile 79% 9% 37% 79% 92% 92%Quintile 2 74% 23% 49% 70% 92% 98%Quintile 3 75% 9% 49% 74% 90% 88%Quintile 4 75% 15% 46% 71% 88% 89%Most Liquid Quintile 72% 20% 49% 62% 78% 90%
By Order Size (in €)
31

Table III Descriptive Statistics on Hidden Orders, by Order Aggressiveness Categories
The table presents descriptive statistics on hidden order usage in April 2003 by Order Aggressiveness groups and by Order Size. The relevant statistic is calculated for each firm during April 2003 and the table reports the (cross-sectional) average across sample firms. The Most Aggressive category (category 1) represents buy (sell) orders with order size greater than those displayed in the inside ask (bid) and with instructions to walk up (down) the book until the order is fully executed. Category 2 represents buy (sell) orders with order size greater than those displayed in the inside ask (bid) and with instructions to walk up (down) the book, but the order specifies a limit price such that the order is not expected to execute fully based on displayed book. Category 3 represents buy (sell) orders with the limit price equal to the inside ask (bid) and with order sizes greater than those displayed in the inside ask (bid). Category 4 represents buy (sell) orders with the limit price equal to the inside ask (bid) and with order size less than those displayed in the inside ask (bid). Category 5 represents orders with limit prices that lie within the inside bid and ask prices. Category 6 represents buy (sell) orders with limit price equal to the inside bid (ask). Category 7 represents buy (sell) orders with limit price less (greater) than to the inside bid (ask). The data are obtained from the Base de Donnees de Marche (BDM) database from Euronext-Paris.
Variable All Orders Less than 1,000 1,000-5,000 5,000-50,000 50,000-250,000 Greater than 250,000
Panel A: Percentage of orders with a hidden size (based on firm average)
Most Aggressive 7% 2% 2% 8% 17% 43%Category 2 18% 0% 2% 15% 30% 47%Category 3 13% 1% 4% 15% 37% 63%Category 4 1% 0% 1% 3% 13% 10%Category 5 19% 1% 6% 41% 80% 80%Category 6 26% 0% 8% 47% 83% 88%Least Aggressive 21% 1% 4% 35% 84% 84%
Panel B: Percentage of order volume that is hidden (based on firm average)
Most Aggressive 15% 0% 1% 7% 15% 41%Category 2 25% 0% 1% 14% 30% 44%Category 3 25% 0% 3% 15% 35% 61%Category 4 2% 0% 1% 3% 10% 11%Category 5 48% 1% 5% 41% 74% 76%Category 6 50% 0% 5% 43% 74% 84%Least Aggressive 45% 1% 3% 35% 76% 78%
Panel C: Conditional on a hidden size, the percentage of order volume that is hidden
Most Aggressive 43% 0% 12% 40% 58% 77%Category 2 61% 0% 3% 51% 67% 73%Category 3 67% 2% 26% 60% 74% 83%Category 4 33% 6% 20% 32% 54% 48%Category 5 75% 11% 48% 72% 89% 91%Category 6 68% 6% 32% 67% 86% 94%Least Aggressive 72% 5% 34% 68% 86% 90%
By Order Size (in €)
32

Table IV Simultaneous Equation Model of Order Aggressiveness, Order Exposure and Order Size,
Firm by Firm Estimates Column (1) and (2) reports on coefficients of a simultaneous equation model of limit order traders’ price aggressiveness, order exposure and order size decision, employing two-stage least squares estimation that allows for endogeneity. Specifically, we model the following set of simultaneous equations on a firm by firm basis and report on average results across firms, including the aggregate mean coefficient and the t-statistics of the mean:
Aggressiveit = α0 + α1PctHiddenit + α2OrderSizeit + α3Volatilit + α4Aggressiveit-1 +
α5DepthSameit + α6DepthOppit + α7Spreadit + α8HiddenSameSideit-1 +
α9HiddenOppSideit-1 + εit (1)
PctHiddenit = γ0 + γ1 Aggressiveit + γ2OrderSizeit + γ3Volatilit + γ4WaitTimeit +
γ5HiddenSameSideit-1 + γ6HiddenOppSideit-1 + ηit (2)
OrderSizeit = δ0 + δ1PctHiddenit + δ2 Aggressiveit + δ3Volatilit + δ4DepthSameit +
δ5DepthOppit + δ6TradesHourit + δ7TradesHalfHourit + δ8TradesSizeit-1 +
δ9HiddenSameSideit-1 + δ10HiddenOppSideit-1 + νit (3)
where Aggressive is a continuous measure of order aggressiveness defined as the distance in basis points of the order price from the opposite quote price; PctHidden is the percentage of to the total order size that is hidden, Volatil is the standard deviation of quote midpoint returns over the preceding hour, DepthSame is the quoted depth on the same side as the order, DepthOpp is the quoted depth of the opposite side quote that the order, spread is the percentage bid-ask spread, OrderSize is the total (exposed plus hidden) size of the order; WaitTime is the average elapsed time between the prior three order arrivals on the same side; HiddenSameSide is the size of hidden orders revealed by the last transactions for orders on the same side as the current order; HiddenOppSide is the size of hidden orders revealed in the last transaction for orders in the opposite side of the current order; TradesHour is the number of trades in the last hour; TradesHalfHour is the number of Trades in the last half hour divided by the number of orders in the last hour; TradesSize is the size of the last trade; and the subscript “i,t” refers to the time t order in stock i..
To assess whether the effect of price aggressiveness on the exposure decision depends on the limit price relative to the quotes, we estimate a simultaneous system that replaces expression (2) above with:
PctHiddenit = γ0 + γ 11D1Aggressiveit + γ 12D2Aggressiveit + γ 13D3Aggressiveit + γ2OrderSizeit + γ3Volatilit + γ4WaitTimeit + γ5HiddenSameSideit-1 + γ6HiddenOppSideit-1 + ηit (2a) where D1 is an indicator variable that equals one for limit orders priced outside the best same-side quote (aggressiveness categories 6 and 7) and zero otherwise, D2 is an indicator variable that equals one for limit orders priced in the range from best ask to best bid and zero otherwise, and D3 is an indicator variable that equals one for limit orders priced beyond the opposite side quote and zero otherwise. Column (3) and (4) reports on the coefficient estimates for the new set of simultaneous equations.
33

(Table IV- continued …)
Variable Coefficient tValue Coefficient tValue(1) (2)
Dependent Variable is Order Aggressiveness
Intercept -0.0141 -8.89 -0.0141 -9.01Percentage Hidden (Endo) -0.0258 -2.48 -0.0244 -2.30Normalized Order Size (Endo) 0.0050 0.95 0.0036 0.70Volatility -0.0030 -6.71 -0.0030 -6.50Lag (Order Agg) 0.0942 7.11 0.0915 7.00Same side depth (norm) 0.0000 0.44 0.0000 0.30Opposite side depth (norm) 0.0000 -0.62 0.0000 -0.60Bid-ask spread (norm) -0.5702 -22.98 -0.5716 -22.60Hidden Exec (same side) -0.0013 -0.73 -0.0018 -1.00Hidden Exec (opp side) 0.0066 2.64 0.0072 3.20Dependent Variable is Percentage of Order Hidden
Intercept 0.0509 6.24 0.0627 7.08Order Aggressiveness (Endo) -0.4295 -2.42Order Agg * D1 -1.5961 -8.77Order Agg * D2 -0.0411 -0.24Order Agg * D3 3.9451 9.79Normalized Order Size (Endo) 1.1674 6.80 1.0158 5.97Volatility 0.0032 0.48 0.0056 0.79Waiting time 0.0975 2.97 0.1057 3.12Hidden Exec (same side) 0.8141 5.91 0.7804 5.90Hidden Exec (opp side) 0.1251 1.11 0.3265 2.09Dependent Variable is Order Size
Intercept 0.0032 2.64 0.0018 2.18Percentage Hidden (Endo) 0.2061 4.94 0.1895 4.51Order Aggressiveness (Endo) -0.0043 -0.27 -0.0048 -0.30Same side depth (norm) 0.0004 3.45 0.0004 3.59Opposite side depth (norm) 0.0000 3.66 0.0000 3.62Volatility 0.0015 3.70 0.0017 3.43Trade freq (last hour) 0.0002 3.43 0.0002 3.08Rel. Trad frequency 0.0006 0.88 0.0002 0.30Last Trade Size (Norm) 0.1900 11.24 0.1848 9.56Hidden Exec (same side) -0.1852 -8.81 -0.1943 -8.28Hidden Exec (opp side) 0.1032 2.68 0.1084 2.79
Firm-By-Firm Regressions
34

Table V: Cross-Sectional Regressions of the Order Aggressiveness, Order Size and Order Exposure Decisions
The table reports regression coefficients (and t-values) of order aggressiveness (Panel A), percentage hidden (Panel B) and order size (Panel C) respectively on firm characteristics after controlling for time series variation in market conditions. Relative Tick size is the tick size divided by stock price; market capitalization is the market size at the beginning of the sample period; and trading frequency and cumulative volume are the number of trades and cumulative trading volume during the sample period. The dependent variables are the intercepts obtained from firm-by-firm simultaneous regressions of order aggressiveness, order exposure and order size on market conditions and order characteristics, after normalizing every individual explanatory variable on the right side of equations (1), (2), and (3) by deducting the full sample mean of the explanatory variable.
Variables Coefficient tValue Coefficient tValue Coefficient tValue Coefficient tValue(1) (2) (3) (4)
Intercept -0.0132 -3.10 -0.0176 -4.00 -0.0198 -4.50 -0.0176 -4.00Relative Tick Size -8.9469 -6.40 -8.6431 -6.40 -8.496 -6.50 -8.6993 -6.50Market Capitalization 0.0013 2.80Trading Frequency 1.3423 3.50Cumulative Volume 0.0017 2.70R-Square
Intercept 0.0953 9.70 0.0854 8.40 0.0813 7.80 0.0868 8.30Relative Tick Size -8.2689 -2.60 -7.5997 -2.40 -7.32 -2.40 -7.8015 -2.50Market Capitalization 0.0029 2.60Trading Frequency 2.8243 3.10Cumulative Volume 0.0032 2.20R-Square
Intercept -0.0172 -1.10 -0.0191 -1.20 -0.0259 -1.50 -0.0282 -1.80Relative Tick Size 17.6344 3.60 17.7613 3.60 18.2193 3.70 18.2389 3.70Market Capitalization 0.0005 0.30Trading Frequency 1.741 1.20Cumulative Volume 0.0042 1.80R-Square
Panel A: Dependent Variable is the (firm-by-firm) Intercept From OrderAggressiveness Regressions
0.34 0.40 0.43 0.40
Panel B: Dependent Variable is the (firm-by-firm) Intercept From Hidden Percentage Regressions
0.08 0.15 0.18 0.13
Panel C: Dependent Variable is the (firm-by-firm) Intercept From Order Size Regressions
0.13 0.14 0.15 0.17
35