in productivity and prices pepper -...
TRANSCRIPT
CHAPTER IV
TRENDS IN AREA, PRODUCTION, PRODUCTIVITY AND PRICES OF PEPPER
Spices Economy - An Outline
Spices have played a crucial role in the history of human civilization.
Christopher Morley defined spice as the plural of spouse (George, 1989).
According to Webster, spices are specifically any of various aromatic
vegetable production (Khan, 1990). In the view of International spices group,
"spices are any of the flavoured or aromatic substance of vegetable origin
obtained from tropical or other plants, coinmonly used as condiinents or
employed for other purposes on account of their fragrance, prcservative or
medicinal qualities". In brief, one can say that spices are agricultural products
significant for their taste, aroma, flavour and colours in food, beverages, as
preservative, as medicine, as a substance in perfume industry and what not.
Since pre-historic times Inan has been using spices to flavour his food
(Padinai~abhan, 1976). The significance of spice was put by Ridley (1912) as,
"the history of cultivation and use of spices is perhaps the most romantic story
of any vegetable product".
The number of items enlisted as spices differs from country to country.
Forty-one items were included by the American Spice Trade Association.

Nearly 107 spice varieties are reported by John (1969). Spices Board has
included 52 iteins in the list. Bureau of Indian standards notifies 63 spices as
grown in the country.
From time immemorial, India is known as 'the land of spices' to the
world. Let us take a historical record of spices of India. The earliest literary
record in India can be found in Rig Veda (6000 B.C). Manu, the proponent of
law (around 4000 F3.C) was awarc of the origin of spices. The epic Rainayana
also mentions about spices. References about Indian spices were made by the
Babylonians and Assyrians (around 3000 BC) and in the Old Testainent (1000
B.C) of the Bible (Sivarainan and Peter, 1999). Susruta (500 B.C.) also
mentions about spices in the writings of Ayurvedic texts.
Alexandria (Alexander the Great, 332 B.C) was a iilajor trading centre
in spices between the East and the Mediterraneans (Purseglove, et. al, 1981).
Travellers like Hiuen Tsang (629 AD), Masudi of Baghadad (890-956 AD),
A b d ~ ~ l Feda (1273-1331 AD), Rashid-Ud-Dina (1300 AD) etc. had made
valuable citatioils regarding the treasure house of Indian spices (George,
1989). By fifteenth century, European countries, especially Portugal, Spain
and U.K. showed keen interest with the East in spice trade. Thus, froin several
historical incidents, it can be observed that spices are the spring of inspiration
for waging war, expeditions, voyages and even for romance.
This treasure of spice had lured explorers to Indian shores for centuries
which became a spectator for the rise and fall of several empires. India got a
wide-range of agro clilnatic conditions suited Sor its varied cultivations. All
kinds of spices can be produced from different parts of Indian soil. That is
how India got a unique position in the world as the largest producer of spice.
Some of the important spices grown are black pepper. cardamom, tunneric,
ginger, chillies, coriander, cumin, fennel, fenugreek, celery, aniseed, saffron,
clove, nutmeg, cinnamon etc. According to the importance in foreign trade and
internal marketing spices such as black pepper, cadamom, ginger, chillies and
turmeric are grouped under major spices and the remaining as ininor spices.
Major spices and seed spices are export oriented whereas tree spices and other
minor spices are consumed internally (Ravindran and Manoj Kuinar, 200 1).
Spices contributed to 1.24 per cent of India's total export earning, and
its share in export earnings from agricultural and allied products works out to
be 8.5 per cent during 1999-2000 (Spices Board, 1999-2000). This sector
alone has the potential of earning an annual foreign exchange of over Rs.1000
crore by way of exports to the Indian economy (Behera and Indira, 2002). This
signifies the iinportance one has to attach to the spices economy of India.
Since pepper is one of the important spices, it is better to know its origin,
cultivation, propagation, harvesting, value added products and marlteting.
A Brief History of Pepper
Pepper from piper nigrum is one of the important spices o f the world. A
wide genus, with over thousand species piper is from the Botanical family of
piperaceae (Spices Board, 1993). The Greek name Pepperi, the Latin piper and
96

the English pepper all derived from the Sansltrit 'pippali', which was the name
for the long pepper (Purseglove, et. al. 198 1). Piper nigruln is a native of the
inonsoon forests along Malabar coast of south western India. Christopher
Morley has called pepper as the king of spices and cardamom as the queen of
spices (George, 1989).
'Two kinds of pepper were mentioned by Theophrastus in the fourth
century B.C. Discorides in the first century A.D. mentions black and long
pepper. Mention was also made by Roinan writers in the fifth century A.D.
(Majeed and Prakash, 2000). Pioneering sea voyages of the 1 51h century were
intended to find sea routes to the sources of pepper and other aromatic objects.
Landing of Vasco da Gaina in 1498 in the Malabar coast of India is a
landinarlc in the history of spices (Mathew, 2002). This followed intense fight
between empires to control for Eastern spice producing regions. References
about the use of medicinal properties of pepper were seen in Materia Medica
of A y ~ w e d a which dates back: to 6000 B.C. Pepper thus has historical and
geographical significance besides trade importance.
Cultivation
Pepper is mostly herbaceous or woody climbers or shrubs in the tropics
of both hemispheres. It is a perennial climber to 10 rn or more in height. The
pepper plants has 10-20 main adventitious roots from the base of the mature
stein which penetrates to a depth of 1-2 in and there is an extensive mass of
surface feeding roots (Purseglove, 1968). The climbing branch becomes stout
97

4-6 c.ln. in diameters at the base with a thick flake - like bark; the internodes
are 5-12 c.m. long. Spikes are borne opposite to leaves on the plagiotropic
branches and are 3-1 5 c.m. long; bearing 50- 150 minute flowers borne in the
axils of ovate fleshy bracts. The fruit is a sessible, globose drupe 4-6 c.m. in
diameter, with a pulpy pericarp, borne in spikes 5-15 c.m. long. Each spilte
produce 50-60 single seeded fruits. The unripe fruit is green with the exocarp
turning red when ripe and drying black. The seed is 3-4 lnin in diameters with
a minute embryo, little endosperm and copious perisperm (Purseglove, 1968).
A well-distributed rainfall and high temperature is required for this crop
of wet tropics. Generally pepper has been cultivated as far as 20' north and
south of the equator. A well drained alluvium soil with humus content is ideal
for its cultivation. Though a humid climate crop, it can be grown in places
where rainfall ranges from 125-200 cm. It can thrive well at a minimuin
temperature of 10°C and a maxiinurn of 40°C temperature and upto 1500 m
above sea level. Pepper can be grown in a wide range of soil which is acidic in
nature with pH 4.5 - 6.0 (Sit, et. al, 2002).
Pepper has been cultivated either as a monocrop or mixed crop on live
standards (i.e. live and non live support). In India the land under blaclc pepper
is classified as (Sivaraman, et. al, 2002):
(i) Coastal areas where pepper is grown in almost every homestead or
plot of land.
(ii) Slopes and valleys.
(iii) Hills at an elevation of 800 in - 1500 in with shade trees in coffee/
tree plantation.
(iv) Valleys as a mixed crop in arecanut gardens.
Pepper is generally propagated by stern cutting. Over 75 varieties /
cultivars are popular ainong farmers. Varieties of pepper are cultivated
according to the soil and climatic conditions and be naturally resistant to pests
and disease of the region. Sorne of the varieties that are popular in India are
Panniyur, Kariinunda, Icottanadan, Balanltotta, Neelamundi, Narayakodi,
Araltulamunda, Kalluvally, Ailnpiriyan etc. (Ravindran and KalIupuracltal,
2000).
Pepper plantation is beset with several diseases. Phytophthora foot root
disease is a serious problem in India. Two inajor diseases spreading in Icerala
are stunted disease caused by piper nigruin strain of cucuinber mosaic virus
(CMV - P,) and yellow inottle disease caused by piper yellow inottle virus
(PY M.V) (Govindan, et. al, 2003).
Prime harvesting of pepper is usually done in the third year. This
perennial plant lasts for about 20 to 25 years. With good yield and under
favourable conditioils it may long for more years. The maturation period of
pepper varies froin 5 to 6 months in Indonesia and 7 to 8 months in India from
flowering to harvest.

Value Added Products
The two primary products of piper nigruin that are internationally
traded are black pepper and white pepper. Black pepper is the whole dried
fruit; white pepper is the fruit from which the mesocarp has been removed.
Some of the other value added products of black pepper produced and
exported froin India are pepper powder, pepper oil, pepper oleoresin, piprine,
dehydrated green pepper, pepper in brine, pink pepper, frozen green pepper
and encapsulated spices. Being a native of western ghats, pepper constitutes an
important ingredieiit of several indigenous inedicines of India.
Since time iinineinorial India has been in the international trade of
pepper. Indian pepper called "Malabar black pepper" is popular in
international markets. The particular grade "Tellicherry Garbled Extra Bold"
fetches tlie highest price due to its size and supreme quality. Majority of
Indian exports is to the U.S.A, foriner USSR and East and West European
countries. India contributes about 25 per cent to 30 per cent of the world
production and Kerala accounts for over 96 per cent of the production in India
(George, 1989).
Tl~us, it can be observed that ainong spices, pepper is a doininant
product. It is an important contributor to foreign exchange. On an average, the
contribution of pepper in spices export earning is found to be 41.2 per cent
during 1960-61 to 1999-2000 (Table 4.1). On the domestic front, pepper is
consumed throughout the length and breadth of the country. Other than a main

spice in food items; it has several medicinal uses also. Hence, it can be
otxerved that pcpper is a universal com~nodity consumed throughout the
globe. Now as part of integrating world trade, there is unanimity about
economic liberalisation and globalisation among nations. On this global effort
Government of India too has initiated several reforrn measures.
The process of liberalisation has started in July 199 1. The initial focus
of structural adjustment was on industry. Later on agricultural trade
liberalisation also became part of liberalisation agenda. Some of the important
measures are reinoval of import control on several agricultural products,
relaxation of quantitative restriction on imports and exports, bringing a variety
of articles under Open General Licence Policy; delicensing certain imports,
slashing of basic in~port duty etc. (Gulati and Kelley, 1999). These relaxations
opened new avenues for international co~npetition for exports. Hence, these
trade policy reforms exposed Indian agriculture to world markets. Now
because of the export exposure of pepper, these trade policy reforins definitely
will have an effect on pepper econoiny.
On this background, the present chapter investigates the trend of
different iiidicators of pepper with spccial reference to Kerala state. Besides, it
also investigates the ilnpact of recent economic reform on different indicators
of pepper product of Kerala.

Methodology
Ratio and percentage methods were employed to examine the trend in
area, production, productivity and prices of pepper in India and Kerala.
Co~npound growth rate of various indicators of pepper are calculated by using
the following semi-logarithmic regression equation:
Logyi= a + b T + u
where
y; = indicators of pepper,
t = time trend, and
u = randoin error term
C.G.R. = [ Antilog b - 1 ] x 100.
Multiple linear regression analysis were carried out to examine the
impact of economic reforins on area, production and prices of pepper and it is
presented below:
Y i = a 0 + p i t+PzD+u ,a i id
Y i = a , + P I t + P 2 D + P 3 D t + u
where
Yi = different indicators of pepper,
t = time trend,
D = duinmy variable, i.e. '0' for pre-reform and ' 1' for post-reform period,
Dt = dummy x trend, and
u = random error terin.

Empirical Results and Discussion
For the sake of si~nplicity and clarity the empirical results are classilled
under the following heads:
( i ) Trends in Countrywise area, production and yield of pepper
(ii) Trends in Countrywise export of pepper
(iii) Trends in Statewise area, production and productivity of pepper
(iv) Trends in Districtwise area, production and yield of pepper
(v) Trends in Price of pepper assembling markets of Kerala.
(i) Trends in Country wise Area, Production and Yield of Pepper:
Some of the major producers of pepper in the world are India,
Indonesia, Brazil, Malaysia, Vietnam and China. Minor contribution are also
made by Sri Lanka, Thailand, Madagascar and Mexico. In this section special
emphasis will be given to India's acreage and production of pepper. Table 4.2
accounts for a country wise analysis of acreage, production and productivity
for the year 1973-2003. India's percentage share to world acreage and world
production of pepper for the same period is presented in Table 4.3.
India has earmarked the inaxilnuln area of land for pepper cultivation in
the world during the period of our study. In 1973-74 the area of pepper
cultivation in India was 121 thousand hectares which comes to 6 1.5 per cent of
the world (Table 4.2 & 4.3) and it went up to 173 thousands hectares in 1990-
91. Further, it can be observed that there is only a marginal increase in the area
of pepper cultivation after 1990-9 1. It implies that after economic reform,
there isn't any significant change in Indian acreage of pepper. This may be
because of the mixed cropping pattern and the perennial feature of pepper
crop.
The compound growth rate of area of pepper cultivation during pre-
reforin (2.5 per cent) is greater than the post reform (1.7 per cent) period
(Table 4.9).
The estimated lnultiple linear regression equation to identify the impact
of econoinic reform on area of pepper cultivation in India is presented below.
Froin the estimated equation it can 'be observed that there is an increase
of 0.0 10642 per cent of area of cultivation of pepper per year during the period
of our study. Besides, estimated coefficients reveals that econoinic reform
doesn't have ally iinpact on area of pepper cultivation in India. This non-
response on area of pepper cultivation may be because of the following
reasons. Firstly, pepper is inainly cultivated as a mixed crop. So the area of
pepper will change only if there is a change in the area of the main crop.
Change in the area of main crop depends on how far econoinic refonn will

exert an influence on it. Secondly, all of a sudden shift in the area of pepper
cultivation is not feasible due to its perennial character.
In terms of quantum of production, India ranks first in 1973-74, with a
quantity of 28.7 tliousand tonnes out of 106.8 thousand tonnes. In the later
year India iost its unique position either to Malaysia or Indonesia. In 1979-80
Malaysia got the highest production of 37.4 thousand tonnes out of 126.2
thousand tonnes. Except for few years, Indonesia ranked first and India was in
the second position in production throughout the eighties (Table 4.2).
However, India has allnost regained its position during 90's. Indonesia
and Brazil were in neck to neck colnpetition in terms of quantum of
production of pepper. The year 1993- 1994 witnessed an increased production
by India with 50 thousand tonnes out of 182 thousand tonnes which comes to
27.5 per cent. Indonesian production was nearly half of the Indian production
during 1995 to 1999. Besides, the trend of pepper production was more or less
inixed during 2000-2003.
The high level of pepper production in Indonesia is because of the
following facts. In Indonesia pepper is cultivated on a coinmercial basis.
Highly productive vines are used for cultivation. Once the vines became
unproductive and senile, new vines are transplanted. The Indonesian fanners
are considering pepper as a major crop than their Indian counter part (mixed or
subsidiary crop). Fanners producing pepper on a commercial base use dead
stead as climbers.

Indian production of pepper has increased by inore than two fold during
1973-74 to 2002-2003. During the saine period coinpound growth rate of
pepper production is worked out to be 4.7 per cent. Further, the coinpound
growth rate of pepper production during pre-reform is slightly higher than the
post reforin period in India (Table 4.9).
Multiple linear regression analysis was carried out to identify the
iinpact of econolnic reforin on pepper production in India. The result of the
estimated equation is presented below.
The value of ii shows that 75.6 per cent change in production of
pepper is explained by time trend and dummy variable. Pepper production of
India has increased 0.0 169 per cent per annuin during the period of our study.
The duininy coefficients are found to be statistically insignificant, which
implies that economic reform does not have any significant iinpact on pepper
production in India. This inay be because of the earlier experience fanners had
with other plantation. For instance, during the nineties there was a sudden
increase in the international price of cocoa. By seeing the bullish behaviour of
market prices farmers have shifted their plantation to cocoa cultivation. This

raised the quantum of cocoa production, which ultimately caused the prices to
fall even below the cost of production. This in turn, forced the farmers to keep
away froin cocoa cultivation. Such experiences may be the reason for the
immediate non-response of farmers on economic liberalisation and hence on
pepper production.
On the productivity front India is showing a dismal picture (Table 4.2).
In 1973-74 Malaysia ranlts the list with a productivity of 3,23 1 kg Per hectare,
Brazil got the second position with 2,202 kg and the Indian figure was just 236
kg. In simple terms, Malaysian productivity is 14 times inore than Indian
yield. During 70's Malaysian productivity is far ahead of other nations. Brazil
becanze a leader in productivity front in the eighties.
The nineties has witnessed another interesting picture. Thailand
became a stiff challenger to all other countries by having inore than double the
productivity of Malaysia. Throughout the entire period of our study, Indian
productivity has remained more or less in the range of 200-400 kg per hectare.
Colnpound growth rate of yield of pepper in India are found to be 1.6
per cent, 2.0 per cent and 3.7 per cent during pooled, pre-reform and post
reforin periods respectively (Table 4.9). It can also be observed that post-
reforin compound growth rate of pepper export (both in quantity and value
terms) from India is far greater than the pre-reform compound growth rate
(Table 4.9).

India can claim a better position both in acreage and production but on
productivity front its position is bleak. From the results of Table 4.3, it can be
observed that on an average India cultivated pepper about 5 1.25 per cent area
of world acreage. But Indian share to world production on an average is 24.57
per cent. This perccntage share of lndian pepper in world production clearly
indicates the predominance of India in world pepper market. But, productivity
of pepper in India is relatively low. The reasons for low Indian productivity
can be cited as follows. Majority of pepper farmers are considering pepper
only as a secondary crop. It means that it is cultivated as a mixed crop in
arecanut or coconut gardens. Here attention is inaiiily given to the primary
crop. This mixed cropping syste~n leads to another serious problem. Pepper
vines used to grow with the support of these live steads (climbers). Therefore
whatever manure is applied to pepper plant will be squeezed by these live
steads. Soine other reasons are the continuous cultivation of poor yielding
vines, existence of senile and unproductive vines, loss due to pests, diseases
and drought. All these factors kept Indian productivity to its low level.
However, concerted effort is required to increase productivity. Farmers
should be encouraged to cultivate pepper as a rnonocrop and dead steads
should be used instead of live steads as climbers. Highly productive vines
should be planted. All the senile and unproductive vines should be replaced.
Tilnely application of insecticide is required. Implementation of the above

measures will help the country to increase its productivity and hence, can
benefit froin its dominance in acreage and production.
(ii) Trends in Countrywise Export of Pepper
'l'rends in countrywise export of pepper for the period 1973-2000 is
presented in Table 4.4. India's contribution in the year 1973 was 32 per cent;
the highest ainong pepper exporting countries of the world. Tl~roughout
seventies Indian share ranged between 12 to 32 per cent. Indonesian share
ranged between 16 to 30 per cent, whereas Malaysian share is in between 24-
35 per cent. In the seventies Malaysia topped the countries. On an average
India contributed 30 per cent to world export during the period of our study.
Besides, Indonesia, Brazil and Malaysia remained stiff competitors to India in
pepper export.
Hence, one can maintain that on an average wit11 5 1 per cent share of
world acreage, 25 per cent of world production and 30 per cent of world
export, India's dominance in pepper is undoubtful. In this context it will be
interesting to kizow the statewise contribution of pepper cultivation and
production.
(iii) Trends in State wise Area, Production and Productivity of Pepper
Kerala, Karnatalta, Tainil Nadu, Pondicherry, Andaiz~an and Nicobar
Islands are the states / Uiiion Territories where pepper is produced. Treiids of
statewise distribution of area, production and productivity of pepper for the

period 1970- 197 1 to 1999-2000 is presented in Table 4.5. In 1970-7 1, Icerala
cultivated pepper in an area of 117.54 thousand hectares and accounted for
25.03 thousand tonnes of production. Kerala's acreage of pepper remained
more or less the same throughout the seventies. ICarnataka's share both in
cultivation and production was stable throughout the eighties. The union
territory of Pondiclieny contributed marginally to the Indian kitty of pepper.
One of the noteworthy point of nineties is that Andainan and Nicobar islands
has also emerged as a pepper producing region. It can also be mentioned that
some of the North Eastern states have also started pepper cultivation on an
experimental basis, but its contribution is not to an amount that call be
accoul~ted for. However, it can be observed that the highest acreagc and
production of pepper is accounted to the state of Icerala during the period of
our study.
The area under major crops of Kerala from 1960-6 1 to 1998-1999 is
presented in Table 4.6. In 1960-61, Kerala had a gross cropped area to the
tune of 2,348.86 thousand hectares, out of which paddy occ~lpied the dominant
position with 33.16 per cent. Ainong spices, pepper got the highest acreage of
99.75 thousand hectares with 4.2 per cent. Tremendous increase can be cited
in almost all the non-food crops froin 1970-71 onwards. However, it can be
observed that other than coconut and rubber, pepper recorded the highest
percentage increase in acreage during the period of our study.

Coinpoiu~d growth rate of area of pepper cultivatioil in I<erala is 2.5 per
cent (Table 4.9) for the year 1970-71 to 1999-2000. Post reform compound
growth rate of pepper cultivation (1 . I per cent) is less than the pre-reforin
coinpound growth rate (1.6 per cent) and is found to be statistically
insignificant.
The estimated equation to exainine the impact of economic reforin on
area of pepper cultivation in Kerala is presented below.
Pepper cultivation in ICerala has increased by 0.00697 per cent per
alznum. The duminy coefficient reveals that due to economic reforins acreage
of pepper cultivation in Kerala has changed positively.
Table 4.5 also shows the productivity trend of Indian states. During the
70's India's productivity turned to be in the range of 200-250 kgihectare.
Throughout the decade the highest productivity was registered by Pondicherry.
This can be cited for its small area of cultivation. Kerala's productivity
remained in between 200-260 kgihectare. After Pondicherry, the next highest
productivity was earmarked by the state of Karnataka. During the nineties
Indian productivity remained more or less above 300 ltgihectare. Kerala kept

the second rank with a good margin from Karnataka. It can be concluded that
Pondicherry maintained a triple fold productivity of India and Kerala has
recorded as the second highest productive region during the period of our
study.
Cornpound growth rate of pepper production in Kerala is 4.0 per cent
for the pooled period (Table 4.9). Besides, the post reforin compound growth
rate of pepper production (2.2 per cent) is less than the pre-reforn period (3.0
per cent). Coinpound growth rate of pepper yield in Icerala is 1.4 per cent, 1.2
per cent and 1.4 per cent during pooled, pre-reform and post-reform period
respectively (Table 4.9).
The estiinated multiple regression equation to identify the iinpact of
ecolio~nic reform on pepper production ill Icerala is presented below.
The results of estiinated regression equation reveals that there is 0.0125
per cent increase in area of pepper production in Kerala per year. Besides, the
estimated coefficients reveals that ecolloinic reforms has failed to lnalte any
significant impact on pepper production in Kerala. The reason can be cited as
follows. During the last decade there was an increase in the international price
of cocoa. Lured by this high price, Kerala farmers have shifted to cocoa

cultivation at the cost of some perennial crops. This lead to over production of
cocoa. It ultimately resulted in reducing the price below the cost of production.
This forced the Kerala fanners to revert to the earlier crops. Such a bitter
experience may be the reason for non-response of Kerala fanners to pepper
production.
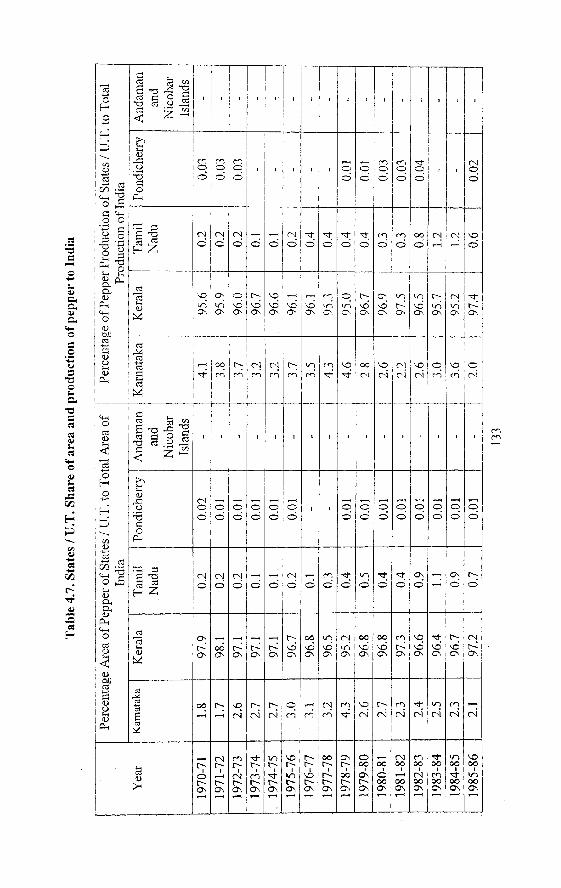
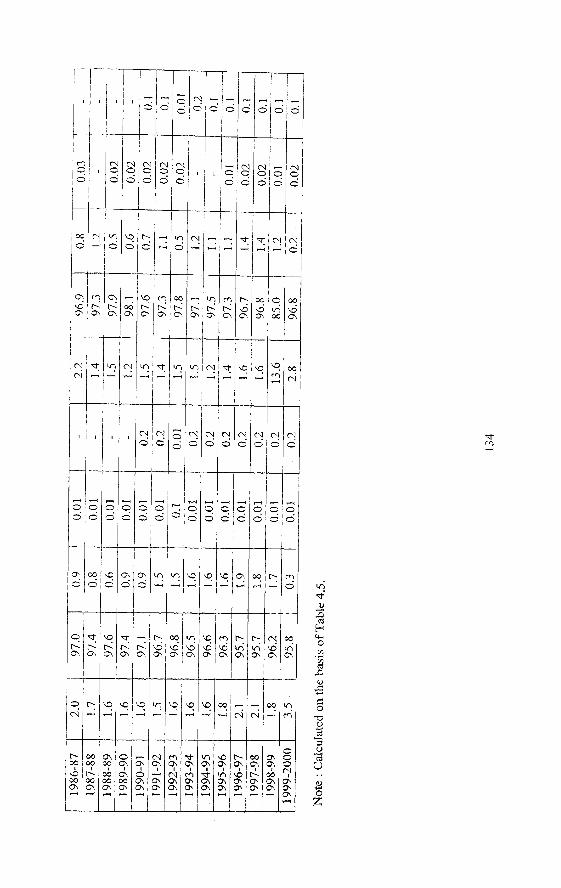
On the whole, it can be observed that Icerala contributed 95 to 98 per
cent of India's cultivation and 85 to 98 per cent of India's pepper production
(Table 4.7). Thus, Kerala has a near inonopoly over pepper cultivation and
production over other Indian states.
(iv) Trends in District wise Area, Production and Yield of Pepper
Pepper cultivation can be seen throughout the length and breadth of the
state. The reason is that pepper can be cultivated as a mixed crop, either in
cocoiiut garden, in cardainoin plantation, in arecanut garden or can be grown
with jackfruit or mango tree. Pepper plant is susceptible to the various climatic
conditions of the statc. Hence, it can be considered as a more general crop than
any other spices of the state. Table 4.8 gives a district wise profile of area,
production and yield of pepper for the period 198 1-82 to 1998- 1999.
ICannur district has accounted for one-fourth acreage in 198 1-82. The
districts of Kottayam, Kozhiliode and Idukki are also dominant in pepper
cultivation. On the production front, ICannur topped the list followed by
Kozhikode, Wynad, Quilon and Idukki districts. The lowest productivity was
earmarked by Palghat district during 198 1 - 1982.
113
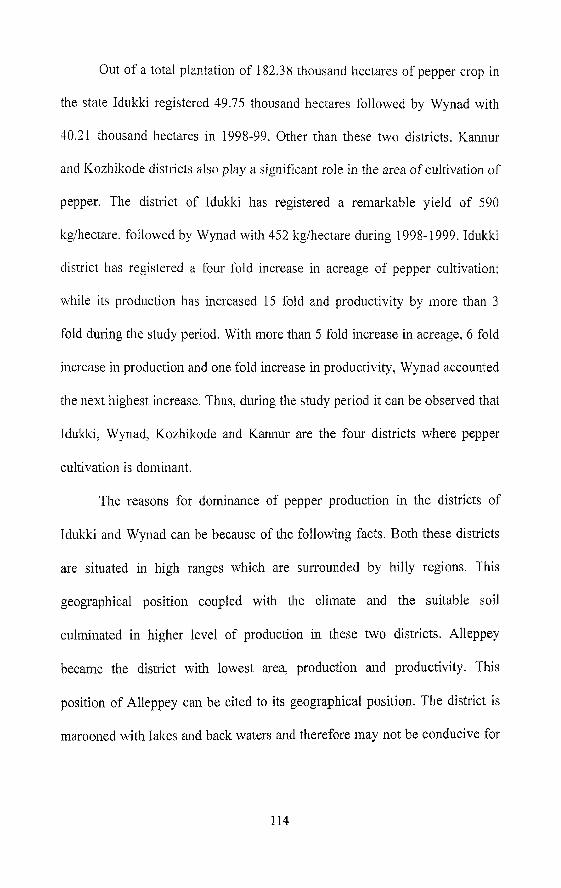
Out of a total plantation of 182.38 thousand hectares of pepper crop in
the state Idukki registered 49.75 thousand hectares followed by Wynad with
40.21 thousand hectares in 1998-99. Other than these two districts, Kannur
and Kozhiltode districts also play a significant role in the area of cultivation of
pepper. The district of Idukki has registered a remarkable yield of 590
kglhectare, followed by Wynad with 452 lcglhectare during 1998- 1999. Idulclci
district has registered a four fold increase in acreage of pepper cultivation:
while its production has increased 15 fold and productivity by inore than 3
fold during the study period. With inore than 5 fold increase in acreage, 6 fold
increase in production and one fold increase in productivity, Wynad accounted
the next highest increase. Thus, during the study period it can be observed that
Idullti, Wynad, Kozhiltode and Kannur are the four districts where pepper
cultivation is dominant.
The reasons for dominance of pepper production in the districts of
Iduklci and Wynad can be because of the following facts. Both these districts
are situated in high ranges which are surrounded by hilly regions. This
geographical positioil coupled with the climate and the suitable soil
culminated in higher level of production in these two districts. Alleppey
became the district with lowest area, production and productivity. This
position of Alleppey can be cited to its geographical position. The district is
inaroolled with lakes and back waters and therefore may not be conducive for
pepper plantation. However, all districts of Kerala have its ow11 share to be
contributed in the state kitty of pepper production.
We have already observed that Idukki, Wynad, 1.ozhiltode and I<annur
are the doinillant pepper producing districts of Kerala. On the above
background, the inajor pepper assenlbling inarkets of the state such as
Alleppey, ICozhikode, Icochi and Tellicherry were selected for the study.
Alleppey market is the nearest assembling centre to the soutl~ern districts of
Kerala. Wynad is the secoiid highly pepper producing districi. I<ozhikode
market itself is a high pepper producing zone and is the nearest assembling
centre to the district of Wynad. Tellicherry ~llarket is the assembling centre of
pepper to the northern districts of Kerala. These four asseinbling centres of
Icerala after collecting pepper from their respective regions transport the
product to the terminal marlcet of Kochi. And Kochi market became the centre
of international trade.
In the above context, it is worth noting the functioning of these
marltets. Farmers used to sell tlieir products to local traders throughout the
length and breadth of the state. Then these traders transport their products to
wholesalers. '111e wholesalers ill turn sell the products to the nearest pepper
assembling markets. In suc11 a trading system it will be interestiilg to know
about the price behaviour of these assembling marltets.

(v) Trends in Price of Pepper Assembling Markets of Kerala
To analyse the price trend, inonthly wholesale price of pepper for the
period April 1974 to March 2003 were considered. Graphical representation of
price trend of Alleppey, Kochi, Kozhikode and Tellicherry assembling
markets were shown in Figure 4.1.
It can be observed that prices of all these four assembling lnarltets
inoved in a steady direction till April 1985. Between April 1986 and April
1996 there were some upward movements. During 1996-1 997, price of some
inarlcet has drifted froin other inarlcets. A steep rise in the montlily wholesale
price can be observed in April 1997 which has sustained till April 2000. This
increase can be cited due to the following reasons. Dwring this period there
was a fall in production of some of the major pepper producing countries such
as Brazil and Indonesia. Indonesian vines were severely affected by pests and
diseases. Hence, the reduction in quantum of production benefited the Indian
fariners through increased prices. 011 the whole, it can be deduced that
inonthly wholesale price of all these four iliarkets were moved synchronously
during the period of our study.
The results of multiple linear regression analysis to identify the impact
of econoinic reforin on inonthly wholesale price of selected pepper marltets of
Kerala are presented below.


Note : Parentheses shows 't' value.
*shows significant at 1 per cent level.
*%shows significant at 5 per cent level.
* * *shows significant at 10 per cent level.
AL - Alleppey Marltet, KO = Kochi Marlcet, KZ = Kozhilcode Market
and TL = 'l'ellichewy Marlcet
It can be observed that the value of ranges in between 0.75 and
0.81. All the F-statistics are found to be statistically significant. The trend
coefficients ranges in between 0.0032 and 0.0037. There isn't n~uch variations
in the trend coefficients of all the marltets, which implies that prices of these
inarkets have inoved in the same direction and tlze level of increase in prices in
all the selected niarlcets are more or less the same. Even though the intercept
coefficients are negative, all the slope coefficients are found to be positive and
statistically significant. It implies that econoinic reform is able to make a
positive influence on the monthly wholesale price of pepper in all the major
pepper assembling inarkets of Kerala. This positive influence of econoinic
reforin on selected inarlcet prices of ICerala is due to the fact that there is
greater transparency in dissemination of inarlcet information and
coinpetitiveness ainong the sellers and buyers.

Concluding Remarks
From early settleinelit onwards. spices were known to hulnan beings.
Out of the total Indian exports 1.24 per cent was contributed by the spices
sector. Anlong spices, pepper got a predoininant role in India. Pepper earns a
foreign exchange to about 40 per cent in spices export. In the world area and
production of pepper, fifty per cent of the area cultivated beloilgs to India and
its contribution in world production of pepper is above 25 per cent.
Other major pepper producers in the world are Indonesia, Brazil,
Malaysia, Vietnaln and China. Minor contributions are also shared by Sri
Lanka, Thailand, Madagascar and Mexico. On productivity front Brazil,
Malaysia and Indonesia are far ahead of India. This is because of the
coininercial cropping pattern followed by these countries. Indian productivity
is low because of the use of low yielding vines, existence of senile and
unproductive vines, mixed cropping pattern, loss due to diseases and natural
calamities.
However, on an average, India contributed 30 per cent towards world
export of pepper. Similarly Indonesia, Brazil and Malaysia also have
contributed significantly towards world pepper export.
Ainong the Indian states, Kerala has a near monopoly over pepper with
95 to 98 per cent of the area and 85 to 98 per cent of production. Karnataka,
Tamil Nadu, Pondicherry and Andaman and Nicobar Islands are some other
regions from where pepper is produced. On productivity front Pondicheny

had a triple fold productivity of the country and can be accounted for its small
acreage. Second highest productivity is registered by Kerala during the period
of our study.
All the geographical regions of the state are blessed with pepper
production. The state is cultivating pepper mainly as a mixed crop. Though all
the districts contributed towards state's production Idukki, Wynad. Kozhikode
and Kannur are the dominant districts. The geographical position of Idukki
and Wynad districts (high range area) are so conducive for pepper cultivation .
Kozhikode and Kannur are producing world cIass pepper. The Iowest
contribution of Alleppey is because of the fact that, the district is marooned
with lakes and backwaters.
It can be concluded that post-reform colnpound growth rate of pepper
yield and export froin India are greater than the pre-reform growth rate.
Whereas, the pre-reforin compound growth rate of area and production of
pepper in India and area, production and yield of pepper in Kerala are greater
than the post-reforin growth rate. Multiple linear regression result shows that
econoinic reforin is not able to inake any significant impact on area and
production of pepper in India and pepper production in Kerala. This non-
response of economic reforins on pepper production may be due to the
following factors. Pepper is considered only as a secondary crop. The area of
pepper directly depends on the area of the main crop which is used as the
stead. If the area of the main crop is influenced by economic reform, the area

of pepper will also be influenced indirectly. Similarly, farmers used to make
changes in perennial crop acreage only if they are able to observe a steady
iinprove~nent in the price of the product.
However, pepper cultivation in ICerala has been slightly affected due to
econolnic reform. Silnilarly economic reforin has positively affected the
monthly wholesale price of all the selected pepper assembling markets of
Kerala. With econoinic reforms and trade liberalisation there is greater
dissemination of inarltet information which ultimately lead to co~npetitiveness
among econoinic agents.

Table 4.1. Trends in Share of Pepper in Spices Export from India
Spices Export Pepper Export Pepper Export as Year
(Rs. Crores) % of Spices
(Rs. Crores' ~ x p o r t (value)
1960-6 1 16.39 8.49 5 1.8 1961-62 17.52 8.07 -- 46.1 1962-63 13.37 6.57 49.1

Sources: Government of India, Arecanut and Spices Database 2002, Directorate of Arecanut and Spices Development, Department of Agriculture and Co-operation, Ministry of Agriculture, Calicut, Icerala.
Government of India, Spice Statistics, Fourth Edition, Spices Board, Ministry of Commerce, Cochin, Icerala.
Government of India, Statistical Abstract, Central Statistical Organisation, New Delhi.


Cou
ntry
P
Y
A
P Y
A
P
YA
P
YA
P
Y
-- --
Indi
a 10
7.35
22
.71
212
109.
40
18.2
2 16
7 12
5.12
34
.00
272
132.
81
31.3
4 23
6 14
9.93
48
.09
327
Indo
nesi
a 79
.00
39.5
6 50
1 8
0.0
01
41
.24
51
5 80
.00
32.0
0 40
0 80
.00
37.0
0 46
2 80
.00
36.0
0 45
0
Mal
aysi
a 11
.36
23.4
0 20
60
10.5
1 1
16.5
6 15
75
5.04
16
.00
3173
5.
30
15.5
0 29
25
7.70
14
.00
1818
---
-.
Bra
zil
26.4
2 29
.26
1107
20
.45
35.3
8 17
30
19.0
0 30
.50
1605
16
.00
25.3
0 15
81
19.0
0 27
.00
1421
S
ri L
anka
I
5.31
1.
51
/ 284
5.
51
2.59
'4
70
6.
38
2.68
42
0 16
.90
1.88
27
2 17
.60
2.51
1
14
2
Mad
gasc
ar
6.10
2.
39
1 392
6.
12
2.61
42
6 6.
20
2.80
45
2 6.
20
2.80
45
2 6.
20
3.00
48
4 T
otal
(inc
1udi
ng
othe
rs)
Cou
ntry
Indi
a
237.
10
124.
67
1992
-93
1988
-89
A
189.
39
98.0
0 10
.00
A
16
8.2
6
526
523
1989
-90
Mal
aysi
a
P Y
J
642
P 43
.42
A
17
1.4
95
5.1
9
47.0
0 In
done
sia
62.0
0 1 6
33 '
233.
66
---
50.7
6
449
( 95
.05
; 61
.00
1 990
-9 1
Y
258
100.
00
89.8
7 26
.00
, 27
.50
l________l_______P
--
1991
-92
26
81
P
2600
78
6 10
001
35.0
0 -
123.
66
A
184.
20
Y
276
Y
490
50.0
0
A
313
520
627
500
118.
00 1
53.0
0
P
33.0
0 B
razi
l 50
.00
2.85
3.
38
234.
58
1050
8.
80
6.50
36
7.1 1
3.26
3.
38
204.
55
529
3010
P 52
.01
173.
431
47.9
5
30.0
0 50
.00
1100
--
370
1 520
55
7
-.
Y
282
Sri L
anka
M
adga
scar
1000
244.
25
10.0
0 30
.00
I__&
218
520
537
22.8
0 31
.00
2756
30.0
0 45
1 53
8 54
8
30.0
0
-
8.60
6.
50
374.
12
7.63
1 3
.44
125.
99
10.3
0
31.5
0 22
80
9.13
6.
50
362.
77
6.30
2434
8.35
6.
47
340.
57
1.99
3.
38
194.
74
3.50
17
6.57
T
otal
(inc
1udi
ng
516
11.3
0
322.
19
11.2
5 27
.50
3.50
(
194
258.
98
31.0
0
3.38
19
0.45
52
2 52
0
121.
40
469
289.
32
141.
48
501


Table 4.3. India's percentage share to world acreage and production of pepper
Year
1973-74 1974-75 1975-76 1976-77 1977-78
200 1-02 2002-03
India's percentage share to world
acreage 61.5 60.1 58.4 57.1 53.2
23.4 19.9
India's percentage share to world production
26.9 24.0 21.6 21.1 18.4
1978-79 1979-80 1980-8 1 1981-82
Note : Calculated on the basis of Table 4.2.
47.7 53.9 52.1 51.5
16.8 21.9 21.3 20.4

Tab
le 4
.4.
Tre
nd
s in
Cou
ntr
ywis
e E
xpor
t of
Pep
per
(Qua
ntit
y in
'000
ton
nes)
Cou
ntry
Indi
a
1976
19
73
Qty
20.5
24.2
37.9
20.0
0.
01
3.9
106.
5
Qty
.
31.6
1974
19
75
Qty
. (%
'Q
ty.
(%
(%
shar
e)
19.2
22.7
35.6
18.8
0.00
9 3.
7
100
1977
lild
ones
ia
125.
5
(%
shar
e)
32.0
2
6.3
Qty
.
24.6
Mal
aysi
a
Bra
zil
16.5
34.1
19.3
1978
(%
shar
e)
23.3
24.1
13.8
shar
e)
0.1
3.8
100
Qty
.
15.7
15.2
31.4
17.8
25.8
24.4
14
.0
shar
e)
(%
shar
e)
12.8
30.2
29.8
24
.4
1.0
1.8
100
30.9
28.9
17.1
0.
6
3.7
105.
8
1979
0.1
3.5
92.2
Qty
20.8
25
.0
37.4
Sri
Lan
ka
Mad
agas
car
15
.71
17
.5
30
.21
33
.6
(%
shar
e)
18.6
22.3
33
.4
1980
29.2
27
.3
16.2
0
.6
3.5
100
15.2
0.3
2.2
26.2
Qty
26.3
29
.7
31.5
1981
29.3
37
.0
36.6
30
.4
1.2
2.2
122.
7
16.9
0.3
2.4
0.5
3.2
25.2
0.
9 2.
6 11
1.9
(Oh
shar
e)
21.3
24.1
25
.6
Qty
20.6
34.0
28
.6
24.2
100
0.5
3.2
Tot
al
19
8.7
(%
shar
e)
15.2
25
.1
21.2
46.9
2.
1
3.0
13
5.2
100
18
9.9
34.7
1.
5
2.2
100
25.9
0.
48
2.5
100
22.5
0.8
2.3
100
32.0
0.
6
3.1
123.
2

Sou
rces
: Gov
ernm
ent o
f In
dia,
Coc
oa A
reac
anut
and
spyG
Sta
tist
ics,
197
0-1 9
83,
1989
-1 99
3
Cou
ntry
Indi
a In
done
sia
Inte
rnat
iona
l Pep
per
Com
mun
ity,
Pep
per
Sta
tist
ical
Yea
r B
ook
1986
, 199
5/19
96, a
nd V
ario
us
Issu
es.
1987
19
88
1989
(%
shar
e)
28.7
Q~Y.
43.0
1
1990
19
91
1992
30.0
0
36.7
Qw
34.4
8
42.1
4
Qty
.
28.8
9 47
.68
Qty
.
19.6
6 49
.67
Q~Y.
36.1
9
(%)
shar
e 25
.4
31.1
(%
shar
e)
20.6
34
.1
(Oh
shar
e)
13.0
32.8
Qty
.
22.6
8
61.4
4 25
.6
(%
shar
e)
15.8
42.9
4
1.5
1
1 32
.9

Tab
le 4
.5. T
rend
s in
Sta
tew
ise
Are
a, P
rodu
ctio
n an
d P
rodu
ctiv
ity
of P
eppe
r
(Are
a in
'000
hec
tare
s; P
rodu
ctio
n in
'000
tom
es, y
ield
kg/
ha)
Sta
tes
Kam
atak
a
I
Pon
dich
eny
] 0.
03
1 0.
01
1 33
3 1
0.01
T
otal
1 11
9.96
1 26
.16
1 2
1s
I 11
8.63
0.01
26.1
6
1970
-71
A 2.1
6
Kem
la
, 11
7.54
T
amiI
Nad
u 1
0.23
I
1
1000
1 0.
01
] 0.
01
221
1 11
9.80
1
26.1
9
25.0
, 21
3
0.05
1
217
1971
-72
P 1.07
A
IP
2.
05
1 1.
00
Y
495
216
2.00
1972
-73
116.
34 1
25 1
0 ,
216
, 11
6.34
0.23
1 0.
05
1 21
7 1
0.25
1973
-74
1000
/ 0.
01
219
1 12
1.72
Y
488
25.1
5
0.05
AI
P
3.2
8 1
0.91
118.
25 1
27.7
5 0
1% 1
0 04
- -
-
0.01
12
1.92
I
28.7
0 1
236
Y
306
A 3.20
Y
277
235
372
118.
41
0 18
1974
-75
P 0.98
27
.23
1 23
0 1
108.
25
24.5
8 227
0 n4
1
23
7
1 n
77
I
n n
i 1
12
5
A 3.32
1975
-76
".-,
- 0.
01
28.1
8 (
231
1 11
1.93
P 1
Y
0.91
1
274
A
-.--
25.5
7
P
. "4
228 Y
3.40
/
0.94
27
6


Tab
le 4
.6. A
rea
unde
r m
ajor
cro
ps in
Ker
ala
('00
0 he
ctar
es)
Not
e: F
igur
es in
par
enth
eses
show
s per
cent
age
to g
ross
cro
pped
are
a.
Sour
ces:
Gov
ernm
ent o
f K
eral
a, S
tati
stic
s for
pla
nnin
g, D
irec
tora
te o
f E
cono
mic
s an
d S
tati
stic
s, T
l~ir
uvan
mth
apur
am, A
ug.
2001
G
over
nmen
t of
Ker
ala,
Agr
icul
tura
l S
tati
stic
s of
Ker
ala
1992
-93;
Eco
llor
nic
Rev
iew
and
Agr
icul
tura
l Abs
trac
t of K
eral
a.
Pil
lai.
P.P,
Ker
ala
Eco
nom
y - F
our
Dec
ades
of
Dev
elop
men
t.
Tab
le 4
.7. S
tate
s / U
.T. S
hare
of
area
and
pro
duct
ion
of p
eppe
r to
Ind
ia
Perc
enta
ge A
rea
of P
eppe
r te
s / U
.7'.
to T
otal
1984
-85
1985
-86
133
2.3
1 96
.7
2.1
97.2
0.
9 0.
7 0.
01
0.01
3.
6
2.0
95.2
97.4
1.
2
0.6
0.02

Tab
le 4
.8. T
ren
ds
in D
istr
ict
wis
e A
rea,
Pro
duct
ion
and
Yie
id o
f P
eppe
r in
Ker
aia
(A: A
rea
'000
ha.
, P: P
rodu
ctio
n '0
00 t
onne
s, Y
: Yie
ld K
g pe
r ha
.)
Dis
tric
ts
Th
iru
van
anth
apu
rm,
1981
-82
1985
-86
PY
A
A
PY
A
Qui
lon
9.80
1988
-89
P
IY
5.
38
2.78
8.
22
6.32
1.
58
P at
hmam
thit
ta
All
eppe
y t
4.82
- 1
.73
3.92
7.
87
4.88
2.
02
285
1.94
---
2.16
0.
41
199 1
-92
235
342
259
A
4.43
2.
39
1.71
0.
23
310
354
108
1992
-93
8.16
5.
12
1.95
0.80
7.
89
P
0.97
309
PY
A
304
350
114
P
2.53
1,
81
0.21
205
2.98
1 3
78
4.68
3.
64
- 20
1
1.57
0.
95
Y
233
4.16
32
3 21
4 0.
97
5.06
1.52
0.
65
326
178


Table 4.9. Compound Growth Rate of Various Indicators of Pepper ----
Illdicators
Export of pepper (quantity) from India
Export of pepper (value) from India
Area of pepper in India
Production of pepper in liidia
Yield of pepper in India
Area of pepper in Kerala
Production of pepper in Kerala
Yield of pepper in Kerala I I
Note : * Shows significant at one ** Shows significant at five per cent.
Pooled Period
1.9 (6.362)*
11.9 (1 8.918)*
3.2 (9.185)*
4.7 (10.990)'k
1.6 (3.667)*
2.5 (8.066)*
4.0 (8.649)"
1.4 (5.43 1)*
per cent
Pre-reform Period
1.9 (4.880)" -
11.8 (1 3.973)*
2.5 (3.875)*
3.9 (3.483)"
2.0 (2.126)""
1.6 (2.934)*
3 .O (3.403)*
1.4 (2.692)"
Post-reform Period
6.4 (1.761)
36.4 (1 1.447)"
1.7 (1.284)
3.7 (4.195)*
3.7 (3.202)'"
1.1 (0.935)
2.2 (2.390)**
1.2 (1 -368)
