in master of science
TRANSCRIPT

A LABORATORY ANALYSIS OF PERMEABILITY
OF TYPICAL CEMENT MIXTURES USED IN THE PERMIAN BASIN
by
VIRAJ V .DESHMUKH, B.E.
A THESIS
IN
PETROLEUM ENGINEERING
Submitted to the Graduate Faculty Of Texas Tech University in
Partial Fulfillment of The Requirements for
The Degree of
MASTER OF SCIENCE
IN
PETROLEUM ENGINEERING
Approved
Shameem Siddiqui Chairperson of the Committee
Lloyd Heinze
Co-Chair of the Committee
Malgorzata Ziaja
Accepted
John Borrelli Dean of the Graduate School
August, 2007

Texas Tech University, Viraj Deshmukh, August 2007
ii
ACKNOWLEDGEMENTS
My journey at Texas Tech has been a long and enjoyable one. This thesis in
association with BJ Services is the icing on the cake of my Masters program here.
Firstly I want to thank Dr. Lloyd Heinze who was instrumental in sending me
to the BJ Services lab in Odessa, which was the starting point for this thesis.
A special thanks also to Mr. Henry Lopez and Mr. Dean Olsen of BJ Services,
who treated me great during my training, gave me ideas for this project, and also helped
me immensely in conducting the whole research.
Also this thesis would not be possible without the help of Dr. Shameem
Siddiqui, the instructor of the Core Lab at Texas Tech who guided me during this period.
I also want to give credit to Abiodun Amao, Joe Mcinerney & James from the Geology
Department.
Last but not the least, my family has played an important role in me coming to
Texas Tech, and without their unconditional support I would not be here today.

Texas Tech University, Viraj Deshmukh, August 2007
iii
TABLE OF CONTENTS ACKNOWLEDGEMENTS…………………………………………………………….…ii ABSTRACT……………………………………………………………………………….v LIST OF TABLES………………………………………………………………………..vi LIST OF FIGURES……………………………………………………………………...vii LIST OF ABBREVIATIONS…………………………………………………………….ix CHAPTER I. INTRODUCTION…………………………………………………………………...12 1.1 Project Objectives……………………………………………………………….12 II. LITERATURE REVIEW…………………………………………………………….14 2.1 Cement Permeability Measurement: A Background…………………………….14 2.1.1 The Humble Oil Study…………………………………………………….14
2.1.2 Halliburton Study………………………………………………………….17
2.1.3 Other related studies…………………………………...……….....……....18
2.2 The Traditional Sulfate Problem on Cement…………………….….…………...19 2.2.1 The process of sulfate attack………………………………………………20 2.3 Cements Used in the Permian Basin……………………………….………....….22 III. EXPERIMENTS & METHODOLOGY…………………………….….…….……..25 3.1 Equipment Selection…………………………………………….…...…….……25 3.2 Testing Principles………………………………….……………....…….………31 3.2.1 Darcy’s Law……………………………………………………………….31 3.2.2 Klinkenberg Effect………………………………………………………...32

Texas Tech University, Viraj Deshmukh, August 2007
iv
3.3 Experiment Details………………………………….……………..……………34 IV. EXPERIMENTAL RESULTS……………………………………………………...37 4.1 Test Results…………………………………………………………….…….....37 V. ANALYSIS AND COMPARISON OF RESULTS…………....………...................72 5.1 Comparing Neat Vs Pozzolan Cement Permeability………………….….……..73 5.2 Influence of Sulfate Percentage in Mixing Water on Cement Permeability.........80 VI. CONCLUSIONS ……………………………….…………………………..………84 VII. RECOMMENDATIONS………………………….….……………………………85 BIBLIOGRAPHY………………………………..………………………………………86 APPENDIX………………………………………………………………………………88 A Cement Slurry Mixing Sheets……………..……………….………………………89

Texas Tech University, Viraj Deshmukh, August 2007
v
ABSTRACT
In the Petroleum Industry today, downhole cement plays an important role
during drilling & production operations. It is responsible for lending strength to the
casing for future production, it helps in preventing collapse of the formation, as well as
restricts fluid movement between permeable zones.
This downhole cement however, has different problems in the field from
inadequate compressive strength, early setting of slurry etc. But of all these problems,
sulfate attack on downhole cement is probably the biggest one facing the industry today.
Another problem in using different cement slurries has been the traditional lack of
research for cement permeability, which has the biggest influence on the degree of this
sulfate attack.
Thus Texas Tech University and BJ Services have thus carried out a new study
in my thesis, where we have studied and analyzed how sulfates in water react with the
dry cement initially by measuring this initial permeability. Thus a study has also been
carried out in measuring cement permeability of typical cement slurries used in the
Permian Basin, something not yet documented and recorded officially before. This will
give us a better understanding of cement properties for future reference.

Texas Tech University, Viraj Deshmukh, August 2007
vi
LIST OF TABLES 4.1 Observations and Results for Sample No 27861…………………………………….38 4.2 Observations and Results for Sample No 27862…………………………………….40 4.3 Observations and Results for Sample No 27865…………………………………….42 4.4 Observations and Results for Sample No 27866…………………………………….44 4.5 Observations and Results for Sample No 27877…………………………………….46 4.6 Observations and Results for Sample No 27878…………………………………….48 4.7 Observations and Results for Sample No 27884…………………………………….50 4.8 Observations and Results for Sample No 27885…………………………………….52 4.9 Observations and Results for Sample No 27907…………………………………….54 4.10 Observations and Results for Sample No 27908…………………………………...56 4.11 Observations and Results for Sample No 27939…………………………………...58 4.12 Observations and Results for Sample No 27940…………………………………...60 4.13 Observations and Results for Sample No 27950…………………………………...62 4.14 Observations and Results for Sample No 27951…………………………………...64 4.15 Observations and Results for Sample No 27953…………………………………...66 4.16 Observations and Results for Sample No 27952…………………………………...68 5.1 Summary of Cement Permeability for all the samples………………………………72

Texas Tech University, Viraj Deshmukh, August 2007
vii
LIST OF FIGURES 2.1 Permeameter Setup for B.E. Morgan Study on Cements…………………………….16 3.1 Gas Permeameter Set-up in the Core Lab at Texas Tech……………………………26 3.2 Nitrogen Cylinders used in the Experiment………………………………………….27 3.3 Ziploc Bags used to Ship the Cement Plugs…………………………………………28 3.4 Oven Used to Heat Cement Plugs……………………………………………………28 3.5 Set of Cement Plugs numbered before Experiment………………………………….29 3.6 Schematic for Gas Permeameter……………………………………………………..30 3.7 Typical Klinkenberg Correction Graph for a Normal Core………………………….33 4.1 Klinkenberg Correction Graph for Sample No 27861……………………………….39 4.2 Klinkenberg Correction Graph for Sample No 27862……………………………….41 4.3 Klinkenberg Correction Graph for Sample No 27865……………………………….43 4.4 Klinkenberg Correction Graph for Sample No 27866……………………………….45 4.5 Klinkenberg Correction Graph for Sample No 27877……………………………….47 4.6 Klinkenberg Correction Graph for Sample No 27878……………………………….49 4.7 Klinkenberg Correction Graph for Sample No 27884……………………………….51 4.8 Klinkenberg Correction Graph for Sample No 27885……………………………….53 4.9 Klinkenberg Correction Graph for Sample No 27907……………………………….55 4.10 Klinkenberg Correction Graph for Sample No 27908……………………………...57 4.11 Klinkenberg Correction Graph for Sample No 27939……………………………...59 4.12 Klinkenberg Correction Graph for Sample No 27940……………………………...61 4.13 Klinkenberg Correction Graph for Sample No 27950………………….…………..63

Texas Tech University, Viraj Deshmukh, August 2007
viii
4.14 Klinkenberg Correction Graph for Sample No 27951……….……………………..65 4.15 Klinkenberg Correction Graph for Sample No 27953……………..……………….67 4.16 Klinkenberg Correction Graph for Sample No 27952………...………..…….…….69 5.1 Graph of Neat vs. Pozzolan Mixed Cement Permeability…………….……………..73 5.2 Graph of Cemex Distilled Neat vs. Pozzolan Cement………………….……………75 5.3 Graph of Lehigh Distilled Neat vs. Pozzolan Cement…………………….…………75 5.4 Graph of Cemex 1000mg/l Neat vs. Pozzolan Cement……………………..……….76 5.5 Graph of Lehigh 1000mg/l Neat vs. Pozzolan Cement……………………..……….76 5.6 Graph of Cemex 2000 mg/l Neat vs. Pozzolan Cement…………………….……….77 5.7 Graph of Lehigh 2000 mg/l Neat vs. Pozzolan Cement…………………….……….77 5.8 Graph of Lehigh 4000 mg/l Neat vs. Pozzolan Cement…………………….……….78 5.9 Graph of Cemex 4000 mg/l Neat vs. Pozzolan Cement……………………….…….78 5.10 Graph Comparing Cement Perm for Cemex Neat with Diff Mix Waters…….……81 5.11 Graph Comparing Cement Perm for Lehigh Neat with Diff Mix Waters……….…81 5.12 Graph Comparing Cement Perm for Cemex 50:50:10 with Diff Mix Waters..….…82 5.13 Graph Comparing Cement Perm for Lehigh 50:50:10 with Diff Mix Waters…...…82 5.14 Overall Graph for the 4 Cement Types with Different Mixing Waters………...…..83

Texas Tech University, Viraj Deshmukh, August 2007
ix
LIST OF ABBREVIATIONS
API- American Petroleum Institute
ASTM- American Society for Testing Materials
atm- Atmosphere
C- Centigrade
C3A- Calcium Trialuminate
CaO- Calcium Oxide
cc/s- Cubic centimeter per second
cm- centimeter
cm2 –Square Centimeter
cP- centipoise
Diam- Diameter
dP- Pressure difference
F- Fahrenheit
ft- Feet

Texas Tech University, Viraj Deshmukh, August 2007
x
Hg- Mercury
Kl - Liquid Permeability
Kg- Gas Permeability
Leng- Length
m- Meter
mD- millidarcy
mg/l- milligram/Liter
MgO- Magnesium Oxide
N2- Nitrogen
Pavg-Average Pressure
Pdown- Pressure Downstream
Pres- Pressure
psi- Pound per Square Inch
Pup- Pressure Upstream

Texas Tech University, Viraj Deshmukh, August 2007
xi
q- Flow rate
t- Time
Temp- Temperature
Visc- Viscosity
vs. – versus

Texas Tech University, Viraj Deshmukh, August 2007
12
CHAPTER I
INTRODUCTION
Sulfates are a big form of contaminant for downhole cements in the oil
industry today. These sulfates, usually present in water in the form on Calcium or Sodium
sulfate compounds, are notorious in reacting with the cement through a process of
reactions to form ettringite, which is known to cause expansion and cracking of the
cement. The remedy for this is often an expensive process of squeeze cementing. Thus
the object of this thesis is to probe the possible negative effects of the ettringite formed in
the cement. However, it must be noted that ettringite is of two types: primary and
secondary. In this thesis we will only investigate possible effects of primary ettringite
formation on the cement performance.
Thus it would be interesting to see if the cement permeability corresponds
directly to the amount of sulfate present in its mixing water, since primary ettringite may
be responsible for causing reactions that expand the cement and increase its permeability.
That apart, cement permeability as such has rarely ever been studied or
recorded. The simple reason for this is most often, the absence of the different equipment
necessary in measuring this permeability, due to the very low permeability values that
cement exhibits. Hence this thesis utilizes the infrastructure present in the Petroleum
Engineering department at Texas Tech University to try to measure and record the
cement permeability of different cement slurries used in the Permian Basin mixed with
different waters.
1.1 Project Objectives
1] To collect a set of typical cement slurry samples used in the Permian Basin by BJ
Services and measure the cement permeability for all these samples.

Texas Tech University, Viraj Deshmukh, August 2007
13
2] To carry this out by setting up a modified Digital Gas Permeameter having a high
pressure rating, so as to be able to measure very low cement permeability by the use of
high pressure differentials across the cement samples.
3] To analyze the results of these test samples for their cement permeability and analyze
if there exists a relation of the cement permeability to-
a) sulfate content in the mixing water.
b) cement slurry type.
4] On the basis of the analysis, suggest to BJ Services the appropriate cement slurry
mixture to be used depending on the type of formation water existing for the particular
well.
5] To put on record the permeability of the typical cement slurries used by BJ Services in
the Permian Basin for their future use and reference.
6] To also set into place a study which can be continued in the future for analyzing the
effect of sulfates during the later part of the cement i.e. six months from the set date. This
will be done by placing the cement plugs used in this study in sulfate water over the six
month period. These plugs can then be tested for permeability at the end of the six
months, and then compared to the present permeability as recorded in my thesis, to note
if a change in permeability takes place over that time.
7] To give a better understanding for future research on the complex nature of cement.
The method to go about investigating the above problem seen in industry will
be conducted over a period of two months. It would involve testing various typical
cement slurries used in the Permian Basin by BJ Services
However the key to investigating the variation in cement permeability of the
different slurries will be the use of four different kinds of mixing water to prepare the
different cements. Thus this study utilizes distilled water and three other samples
containing different strengths of sulfate from 1000 mg/l up to 4000 mg/l for mixing of the
cements.

Texas Tech University, Viraj Deshmukh, August 2007
14
CHAPTER II
LITERATURE REVIEW
2.1 Cement Permeability Measurement: A Background
Cement by nature is extremely tight. Thus conventionally the measurement of
such tight cement permeability has not been widely documented or carried out. The
cement permeability however is not constant, and is variable on the composition of the
cement slurry. Thus in today’s industry a number of different combinations for cement
slurries are used. They include pozzolan, cement with expansion additives etc. BJ
Services typically uses a fixed set of cement slurries in the Permian Basin depending on
variations of depth and temperatures in the well.
However amongst a few of the studies carried out relating to cement
permeability measurement were carried out by B.E Morgan of Humble Oil Company as
far back as 1952 as well as by John Goode of Halliburton. However these studies merely
mentioned procedures on measuring cement permeability, without really documenting the
data for a particular set of cement slurries.
2.1.1 The Humble Oil Study
In The BE Morgan study, several variations in test procedure were tried. In
some cases the mold was greased with light grease, while in other cases no grease was
used. Permeability tests were run directly on the set cement in the mold. The cement
sample was then removed with a hydraulic punch. It was then placed in a rubber cylinder
which was tightly fitted in a steel cylinder. The permeability of the cement sample as then
once again measured. Several set cement plugs were dried at 105°C for 24 hours. Their
permeability to air was then measured.

Texas Tech University, Viraj Deshmukh, August 2007
15
Typically same values for water permeability were obtained with the cement
specimen for the ungreased mold as with the cement plug in the rubber holder. These
results indicated that permeability values obtained by casting cement specimens in
ungreased molds were reproducible, that was no leakage of water around the cement
specimen under the conditions used, and that the result represented he true wet
permeability of the set cement.
Higher and inconsistent values were obtained when the mold was greased.
Values obtained for air permeability were much higher than water permeability as
expected, due to the alteration of the set cement by drying.7
The setup for this study was as seen below in Figure 2.1:

Texas Tech University, Viraj Deshmukh, August 2007
Figure 2.1 Permeameter Setup for B.E. Morgan Study on Cements7
Thus the Humble Oil study did conclude that air permeability is higher than
water permeability for the cement, but a detailed record for all the cement specimens was
not done in this study.
16

Texas Tech University, Viraj Deshmukh, August 2007
17
2.1.2 Halliburton Study
The Halliburton study is summarized as follows:
Procedure
The two instruments used for obtaining permeability data were the air
permeameter and the liquid permeameter. Both instruments used a Hassler sleeve-type
arrangement, with a liquid such as water providing pressure on the outside of the rubber
sleeve to seal the specimen in the cell, and gas or liquid inside of the sleeve to achieve a
pressure differential across the specimen for measurement of flow rates, The principal
difference in these instruments was the amount of pressure for which they were designed,
the air instrument utilizing much higher pressures than the liquid apparatus,
Gas permeability tests were made on eight different cementing compositions
cured at atmospheric pressure and temperatures of 80°, 100°, 120° and 140°F for periods
of 7 and 28 days. Water permeability was determined on 10 different cementing
compositions cured at temperatures of 80°, 100°, 120° and 140°F for periods of 1, 7 and
28 days. These tests were conducted at a pressure of 60 psi.
The conclusions for this study were summarized as follows:
1. Water permeability determinations on oilwell cementing compositions were more
reliable than gas permeability, due to the difficulty in obtaining good representative
samples for gas flow measurements,
2. The permeability of cementing compositions decreased with age and temperature, with
the exception of the compositions containing moderate amounts of bentonite.
3. In most of the cements tested, the permeability were so low after seven days’ curing
that there was little to choose among them.4

Texas Tech University, Viraj Deshmukh, August 2007
18
Thus this study felt that in choosing a cementing composition for gas-storage
wells, permeability did not appear to be a major factor at low temperatures. This is
because most cementing compositions have no measurable permeability after reasonable
periods of time. The study believed that consideration should more satisfactorily be given
to other properties of cements, particularly the fluid properties such as low fluid flow,
flow characteristics and slurry weight, and to the employment of good cementing
practices in achieving a successful completion.
2.1.3 Other related studies
Another view on cement permeability was also revealed during this thesis
through personal communication with Scott Jennings and Jack Lynn of Saudi Aramco
Company. They have been following for many years a method of testing undried cement,
using the curing water itself to measure the cement permeability. Thus they measured the
wet permeability of the cement samples, unlike the dry permeability measured in this
study.
The test procedure for this wet permeability was summarized by Saudi
Aramco as follows-
“The pump was run in "constant pressure" mode. In this operating mode the pump will
maintain a constant set pressure against a sample face to +/- 0.5% of total span. At the
operating pressure of the test (2500 psig) this is equivalent to +/- 12.5 psig. The test oven
set at 250 °F. The original test specifications called for the temperature to be 290 °F, but
the rubber boots used for confining stress were found to be unstable at this temperature.
The confining stress for the test was 5000 psig, and the pore pressure (back pressure)
was set at 500 psig. Net pressure delivered by the pump was set at 2500 psig, making
the effective differential pressure (dP) 2000 psig. For some selected samples dP was set
to 4000 psig due to low permeability. A burette was attached to the down stream line of
the back pressure regulator to accurately measure the expected low flow volumes. The

Texas Tech University, Viraj Deshmukh, August 2007
19
accuracy of the burette was +/- .001 cc. The times were kept by digital timer and were
accurate to .01 minutes / 24 hours.
Once the test was complete, the samples were removed from the core holder and placed
under their mixing fluid. The measurements were divided into two parts. The first is
termed the "initial perm" which is the permeability measured after the first 6 hours of
flow. The "final perm" is measured at the stabilization point, which varied from 2 to 6
days for the samples”5
Thus this study was very interesting from the point of view of wet permeability measured
for the cement, and the equipment modifications that were done for this.
Some other related work has also been done over the years on both cement
permeability measurement as well as study of sulfates on concrete, but these studies are
more related to the civil engineering field. However as part of the literature review it
would be worth mentioning some of the tests carried out by the American Society for
Testing Materials or ASTM include the following-
ASTM C1202 Rapid Chloride Permeability Test for Electrical Conductivity ASTM C1012-04- Standard Test method for Length change of Hydraulic Cement
Mortars Exposed to a Sulfate Solution
2.2 The Traditional Sulfate Problem on Cement
Ettringite is a crystalline mineral. It is basically formed due to the reaction
between sulfates, calcium aluminates and water. The aluminates are in the form of
calcium trialuminate (C3A). This calcium trialuminate is one of the four primary
compounds that make up Portland cement. Sulfates are present in the gypsum. This
gypsum is added to the clinker during the grinding process, to slow the hydration of

Texas Tech University, Viraj Deshmukh, August 2007
20
aluminates and to prevent the cement from sudden setting. Sulfates may also be present
in the clinker from the raw materials which are used to make the clinker. The formation
of the primary ettringite occurs just after water has been added to the cement, but before
the concrete reaches the initial set.
External sulfate attack, however, results from the chemical reactions which
take place when cement is exposed to penetrating external sulfate ions present in the
downhole water. Thus sulfate attack is primarily caused by two chemical reactions:
1) the formation of gypsum by the combination of sulfate and calcium ions, and
2) the formation of ettringite through the combination of sulfate ions and hydrated
calcium aluminate.
In both the cases, the formation of the reaction product causes an increase in volume due
to expansion.
Thus sulfate attack is a degradation mechanism of cement. Since it is capable
of such a negative impact on the cement like cracking, lots of research and studies have
taken place to analyze this process, especially in the Civil Engineering field.
Thus based on all the above, API has come up with a classification for oil well
cements that is similar to the one by ASTM and other European codes. Thus API
differentiates oil well cements into three groups, ordinary, moderate and high sulfate
resistance, depending on their chemical composition.
2.2.1 The process of sulfate attack
Ettringite is the common name for hydrated calcium trisulfoaluminate
(C3S.C3A.H32). This is a crystalline meta-stable hydration product of Portland cement
which occurs during the first 24 hours of hydration of the cement. The tricalcium
aluminate (3CaO.Al2O3), also referred as C3A, reacts with gypsum (Ca S04.2H2O), to
form primary ettringite. The reaction for this is as follows-

Texas Tech University, Viraj Deshmukh, August 2007
21
3CaO.Al2O3 + 3 (CaSO4.2H2O) ---------> Ca 6[Al (OH) 6]2. (SO4)3.26H2O
As cement gets more and more hydrated the amount of gypsum decreases and
part of the ettringite is transformed into calcium monosulfo-aluminate hydrate. This
reaction is as follows:
Ca 6[Al (OH) 6]2(SO4)3.26H2O + 2 (CaO.Al2O3) + 4H2O ---------->
3 (3CaO.Al2O3.CaSO4.12H2O)
This reaction also depends on factors such as the pore solution alkalinity, the
water to cement ratio (w/c) and the environment temperature. It also of course is hugely
dependant on the amount of calcium trialuminate present in the cement. Thus the amount
of calcium trialuminate varies based on the grade or the brand of the cement.
Further as the hydrated cement is placed in an environment containing high
sulfate concentrations, as is true in certain formations, the calcium monosulfo-aluminate
hydrate and the calcium hydroxide present in the cement paste react with the sulfate ions
coming from the environment to form the secondary or delayed ettringite
3CaO.Al2O3.CaSO4.12H2O + 2(CaSO4.2H2O) + 16H2O ----------->
3CaO.Al2O3.3CaSO4.32H2O
The ettringite formed from the above equation is a big molecule containing 32
water molecules. Therefore, the formation of ettringite involves considerable expansion
and weight growth. As the reaction takes place, the expansive product (mainly ettringite)
will start filling the cement paste pores and once these are complete, will start building up

Texas Tech University, Viraj Deshmukh, August 2007
22
internal pressure that causes cement cracking and strength loss. This phenomenon is
known as sulfate attack.6
2.3 Cements Used in the Permian Basin
In oilwell cements different classes of cement are used from Class A to Class J depending
on the depth & downhole temperature.
This can be summarized as follows-
Classes of cement Nine API classes: Class A
• Depth surface – 6000 ft (1830 m)
• No special properties
• Similar to ASTM C 150, Type I
Class B
• Depth surface – 6000 ft (1830 m)
• Moderate to high sulfate resistance
• Similar to ASTM C 150 Types II
Class C
• Depth surface – 6000 ft (1830 m)
• High early strength
• Moderate to high sulfate resistance
• Similar to ASTM C 150 Types III

Texas Tech University, Viraj Deshmukh, August 2007
23
Class D
• Depth from 6000 ft – 10,000 ft (1830 m - 3050 m)
• Moderate and high sulfate resistance
• Moderately high pressure and temperature
Class E
• Depth from 10,000 ft – 14,000 ft (3050 m - 4270 m)
• Moderate and high sulfate resistance
• High pressure and temperature
Class F
• Depth from 10,000 ft – 16,000 ft (3050 m - 4270 m)
• Moderate to high sulfate resistance
• Extremely high pressure and temperature
Class G
• Depth surface – 8000 ft (2440 m), as basic cement, fine
• Can be used with accelerators and retarders for other specifications
• Moderate to high sulfate resistance
• No addition other than calcium sulfate or water
Class H
• Depth surface – 8000 ft (2440 m), as basic cement, course
• Can be used with accelerators and retarders for other specifications
• Moderate to high sulfate resistance
• No addition other than calcium sulfate or water
Class J
• Depth 12,000 – 16,000 ft (3660 m - 4880 m)
• Extremely high pressure and temperature

Texas Tech University, Viraj Deshmukh, August 2007
24
• Can be used with accelerators and retarders for other specifications
• Moderate to high sulfate resistance
• No addition other than calcium sulfate or water
Of all these cement classes, BJ Services most widely uses the Class C & Class
H cements in their wells in the Permian Basin. Of these two, we have studied their Class
H cement for different slurry types.
Also we have used two different Class H companies, Cemex & Lehigh. While
Cemex H cement contains 3% calcium trialuminate, Lehigh H cement contains 0%
calcium trialuminate. Two other additives to the cement slurries often used are bentonite
and pozzolan.
Pozzolana is the chemical used to prepare pozzolan. It is also known as
pozzolanic ash and it is a fine volcanic ash. Thus pozzolan is a vitreous siliceous
material. This pozzolan goes on to react with calcium hydroxide and this forms calcium
silicates. Other cementitious compounds are also formed from the reaction of pozzolan
with the calcium hydroxide depending on the exact type of pozzolan used.
The pozzolan used in the industry today, is prepared by mixing either natural
or industrial pozzolan with Portland Cement. The pozzolanic reaction may be slower than
the rest of the reactions which occur during cement hydration, and thus the short-term
strength of concrete made with pozzolans may not be as high as concrete made with
purely cementitious materials.
The advantages of pozzolan are that in addition to underwater use, the
pozzolana's high alkalinity makes it especially resistant to common forms of corrosion
from sulfates. Once it fully hardens the Pozzolan mixed cement may be stronger than
Portland cement. This is because it has a lower porosity making it more resistant to water
absorption and also to spalling. Pozzolan is also added to Portland cement to increase its
long term strength and other material properties of Portland cement.3

Texas Tech University, Viraj Deshmukh, August 2007
25
CHAPTER III
EXPERIMENTS & METHODOLOGY
3.1 Equipment Selection
The setting up of the modified permeameter was one of the essential
highlights of this thesis. It is well seen from the literature review, especially on
permeability measurements of permeability of cores, even normal cores can sometimes
be difficult to measure.
This is true in cases of tight cores, like limestones which can have a
permeability value as low as 1mD.
In the case of cement this is even more significant. Cement is basically very
tight, & hence has extremely low permeability. Thus we need to use certain modifications
from the certain conventional setup for measuring permeability of sandstone of limestone
in the measurement of cement.
As far as the equipment is concerned the Advanced Core lab at Texas Tech University’s
Petroleum Engineering department has the following-
1] Ruska Permeameter
2] Texaco Permeameter
3] Klinkenberg Permeameter
Of these the Klinkenberg Permeameter has a Hassler core Holder of rating of
2000 psi. Thus since large pressures were expected in this experiment it was preferred
over the Texaco Permeameter which has a lower pressure rating of 1000 psi.

Texas Tech University, Viraj Deshmukh, August 2007
The nylon piping used in the gas permeameter equipment also has a pressure
rating upto 1000 psi. The regulator used could operate in a range from 40-100psi.
Also the gas flow was provided by use of nitrogen cylinders for the
experiments. Helium was an option, but was not considered necessary as nitrogen was
able to necessitate flow through all the cores tested in this thesis. The major modification
here was setting up of the appropriate pressure gauge for conducting all of the above
tests. Hence for the normal setup the pressure differentials achieved during the tests are
usually from 2 to 10 psi. However cement being so tight a pressure gauge with much
higher pressure rating was utilized. This gauge had a maximum pressure reading of 200
psi with increments of 10 psi. Most of the readings were carried out between 40 to 100
psi, & thus this pressure gauge with maximum pressure rating of 200 psi was sufficient.
Attached below in Figure 3.1 and 3.2 are some of the pictures of the Digital
Permeameter set-up in the Advanced Core laboratory.
Figure 3.1 Gas Permeameter Set-up in the Core Lab at Texas Tech
26

Texas Tech University, Viraj Deshmukh, August 2007
Figure 3.2 Nitrogen Cylinders used in the Experiment
During the study the cores were dispatched from BJ Services in zip lock bags and then
dried in the oven as shown below in Figure 3.3, 3.4 and 3.5.
27

Texas Tech University, Viraj Deshmukh, August 2007
Figure 3.3 Ziploc Bags used to Ship the Cement Plugs
Fig 3.4 Oven Used to Heat Cement Plugs
28

Texas Tech University, Viraj Deshmukh, August 2007
Figure 3.5 Set of Cement Plugs numbered before Experiment
29
Texas Tech University, Viraj Deshmukh, August 2007
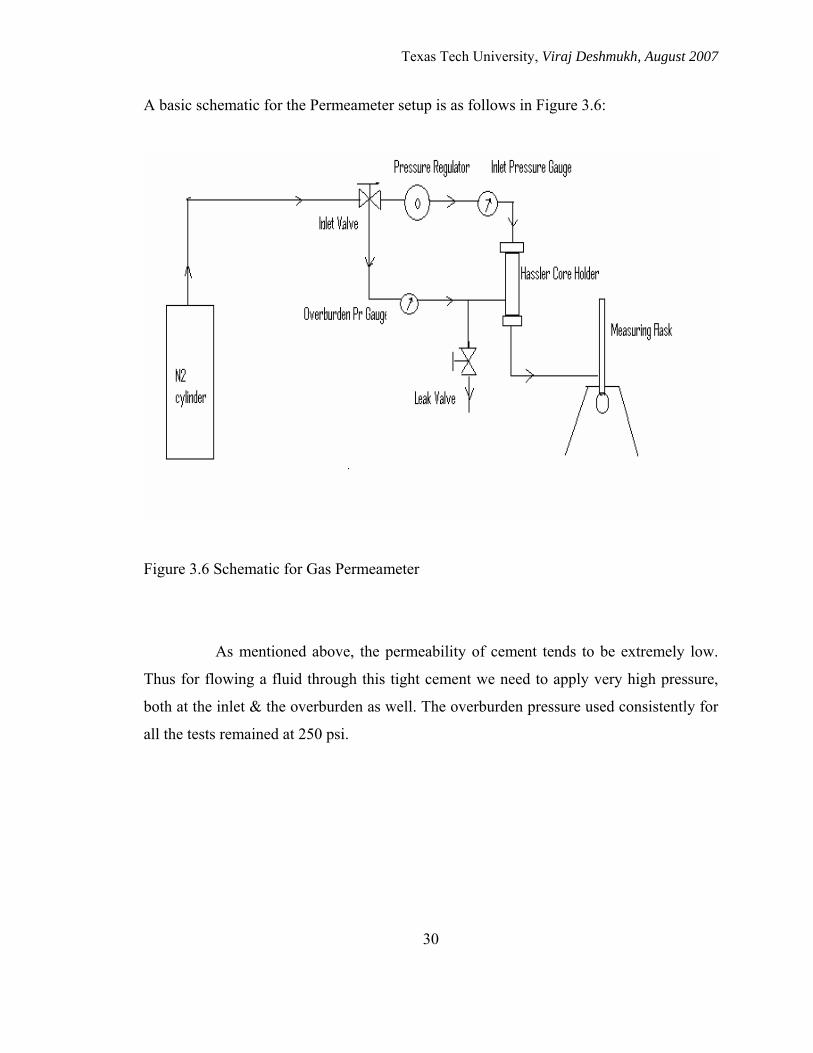
A basic schematic for the Permeameter setup is as follows in Figure 3.6:
Figure 3.6 Schematic for Gas Permeameter
As mentioned above, the permeability of cement tends to be extremely low.
Thus for flowing a fluid through this tight cement we need to apply very high pressure,
both at the inlet & the overburden as well. The overburden pressure used consistently for
all the tests remained at 250 psi.
30

Texas Tech University, Viraj Deshmukh, August 2007
3.2 Testing Principles
3.2.1 Darcy’s Law The basic law for this thesis revolves around the very important yet basic law
in the petroleum industry, Darcy’s Law. Darcy’s Law is the basic law relating the flow of
a fluid through a permeable medium in terms of flow rate.
Darcy's Law was brought about by Henry Darcy, who derived an equation to
relate flow of a fluid through a medium as a function of :
length
cross sectional area
pressure difference
viscosity of fluid
permeability of medium
The equation for this is as follows:
PALqk g Δ
=μ
Where,
Q- flow rate in cc/sec
μ- viscosity in cP
L- length in cm
A- area in cm2
∆P- pressure difference in atm
All of the above gives us the gas permeability value in Darcy.
Thus to measure the gas permeability for this study, the above equation was used.
31
Texas Tech University, Viraj Deshmukh, August 2007
However we need to measure the absolute permeability, not merely the gas
permeability, for which we use the Klinkenberg Effect principle.3
3.2.2 Klinkenberg Effect
Permeability is the ability for a fluid to flow through a given medium. It thus
predicts fluid flow downhole at different depths depending on the formation.
Permeability of rocks can have a wide range widely from for various rock type and depth
condition.
Some sedimentary rocks show high permeability, while limestones show
lower permeability. Permeability is also influenced by cracks and fractures in the
formation. It is however difficult to predict permeability from other physical properties,
such as porosity.
Permeability does not depend on pore fluid, therefore permeability measured
by gas should be the same with that measure by water. However, it was found that
permeability to gas was higher than that to water. These problems were related to the
pore pressure dependence on gas permeability
of Klinkenberg effect (Klinkenberg, 1941).
Thus in 1941 Klinkenberg discovered that permeability to gas is relatively
higher than that to water, and he interpreted this phenomena as “slip flow” between gas
molecules and solid walls. He stated that gas molecules collide each other and to pore-
walls during traveling through the pore medium. Therefore this additional flux due to the
gas flow at the wall surface, which is called “slip flow”, causes an increased flow rate.
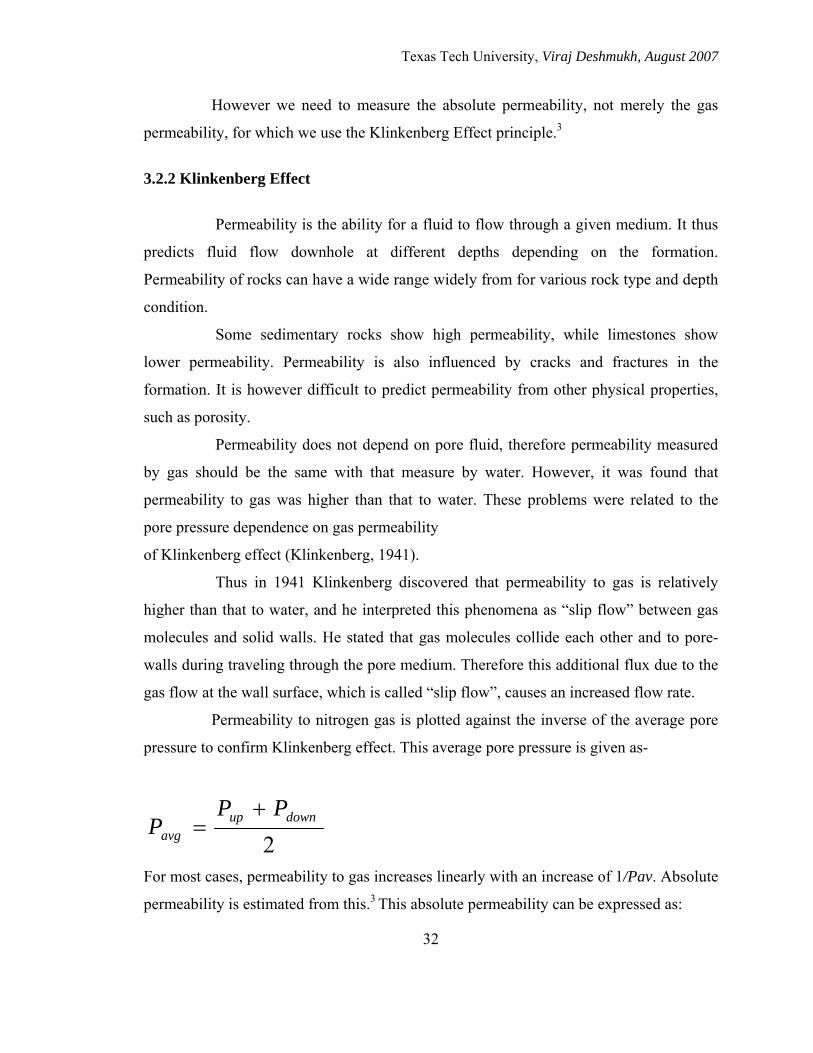
Permeability to nitrogen gas is plotted against the inverse of the average pore
pressure to confirm Klinkenberg effect. This average pore pressure is given as-
2downup
avg
PPP
+=
For most cases, permeability to gas increases linearly with an increase of 1/Pav. Absolute
permeability is estimated from this.3 This absolute permeability can be expressed as:
32

Texas Tech University, Viraj Deshmukh, August 2007
)/1/( pbkk gl +=
An example for the Klinkenberg Effect can be seen from the plot in Figure 3.7 for a
normal core:
Kg
0.014
0.012
0.010
0.008
0.006
0.004
0.002
0.000
y = 0.007x + 0.007 R2 = 0.9272
0 0.1 0.3 0.4 0.5 0.6 0.7 0.8 0.2
1/Pavg
Figure 3.7 Typical Klinkenberg Correction Graph for a Normal Core
33

Texas Tech University, Viraj Deshmukh, August 2007
34
3.3 Experiment Details
The object of this thesis is to measure the cement permeability of different
cement plugs sent by BJ Services to Texas Tech. The experiments conducted for the
purpose of this thesis were carried out over a period of a month & a half.
The starting point of the procedure involved preparing the cement different
slurries decided upon BJ & Texas Tech. Thus a summary of the different samples tested
were in the following order:
SET 1:
Cemex H Neat with distilled water
Lehigh H Neat with distilled water
Cemex 50 + Pozzolan 50 + Bentonite 10 + 5% Salt with distilled water
Lehigh 50 + Pozzolan 50 + Bentonite 10 + 5% Salt with distilled water
SET 2:
Cemex H Neat with 1000mg/l sulfates
Lehigh H Neat with 1000mg/ l sulfates
Cemex 50 + Pozzolan 50 + Bentonite 10 + 5% Salt with 1000mg/ l sulfates
Lehigh 50 + Pozzolan 50 + Bentonite 10 + 5% Salt with 1000mg/ l sulfates
SET 3:
Cemex H Neat with 2000mg/ l sulfates
Lehigh H Neat with 2000mg/ l sulfates
Cemex 50 + Pozzolan 50 + Bentonite 10 + 5% Salt with 2000mg/ l sulfates
Lehigh 50 + Pozzolan 50 + Bentonite 10 + 5% Salt with 2000mg/ l sulfates

Texas Tech University, Viraj Deshmukh, August 2007
35
SET 4-
Cemex H Neat with 4000mg/ l sulfates
Lehigh H Neat with 4000mg/ l sulfates
Cemex 50 + Pozzolan 50 + Bentonite 10 + 5% Salt with 4000mg/ l sulfates
Lehigh 50 + Pozzolan 50 + Bentonite 10 + 5% Salt with 4000mg/ l sulfates
Thus 16 cement samples were tested as is seen from above. The selection of the 16
cement mixtures was based on the following parameters-
1] Two types of H Cements used:
Cemex & Lehigh are just two different classes of H
cement. Of these Cemex has a known presence of calcium trialuminate known to react
with sulfates of 3%. Lehigh cement on the other hand has a total absence of calcium
trialuminate. Thus it would be interesting to see how these two classes compare as far as
cement permeability is concerned for the different mixing waters.
2] Two types of cement slurries used:
In the Permian Basin very often two basic cement
combinations are most commonly used. The first one is prepared by mixing the cement
neat. The other method included adding pozzolan to the cement with a ratio of 50:50:10
for the cement, pozzolan and bentonite respectively. A description of pozzolan and it’s
properties has been done in the literature review section.
3] Four types of mixing waters used:
Since this study wanted to also investigate how sulfates
in mixing water may influence cement permeability for the above cement combinations,
four different mixing waters were used. This started with distilled water upto a maximum

Texas Tech University, Viraj Deshmukh, August 2007
36
of 4000 mg/l sulfate presence in the water. In the field however, the average strength of
sulfates in downhole waters is seen to be around 2000 mg/l.
Thus these different samples were prepared by BJ Services under the guidance
of Mr. Dean Olsen at the regional BJ services lab at Odessa. The UVA was used to cure
the cement & the cement consistometer was used to measure thickening time. The work
sheets for this are provided in the Appendix of this thesis. Once prepared & tested at the
BJ Lab, these samples were sent to Texas Tech, where they were drilled & chipped off to
an appropriate plug size.
The method for drying the cement neat plugs was consistently kept at a period
of heating in the oven for 24 hours and at a temperature of 45°C. However it must be
noted, that for the pozzolan mixed cement plugs drying the plugs in the oven had to be
replaced by merely drying the plugs under atmospheric conditions for a period of 12
hours instead. The reason for this was that the pozzolan mixed plugs tended to crack
easily when they were dried in the oven.
Finally the samples were then inserted in the Hassler Core Holder of the
Digital Gas Permeameter & the tests were then run on it to calculate cement permeability.
The Core laboratory was consistently kept at a temperature of 23°C.

Texas Tech University, Viraj Deshmukh, August 2007
37
CHAPTER IV
EXPERIMENTAL RESULTS
The experimental observations and results of gas permeability for all the
sixteen cement samples can be seen below from Table 4.1 to Table 4.16. The absolute
permeability values are then obtained from the Klinkenberg Correction plots from Figure
4.1 to Figure 4.16 for the samples.
4.1 Test Results
Texas Tech University, Viraj Deshmukh, August 2007
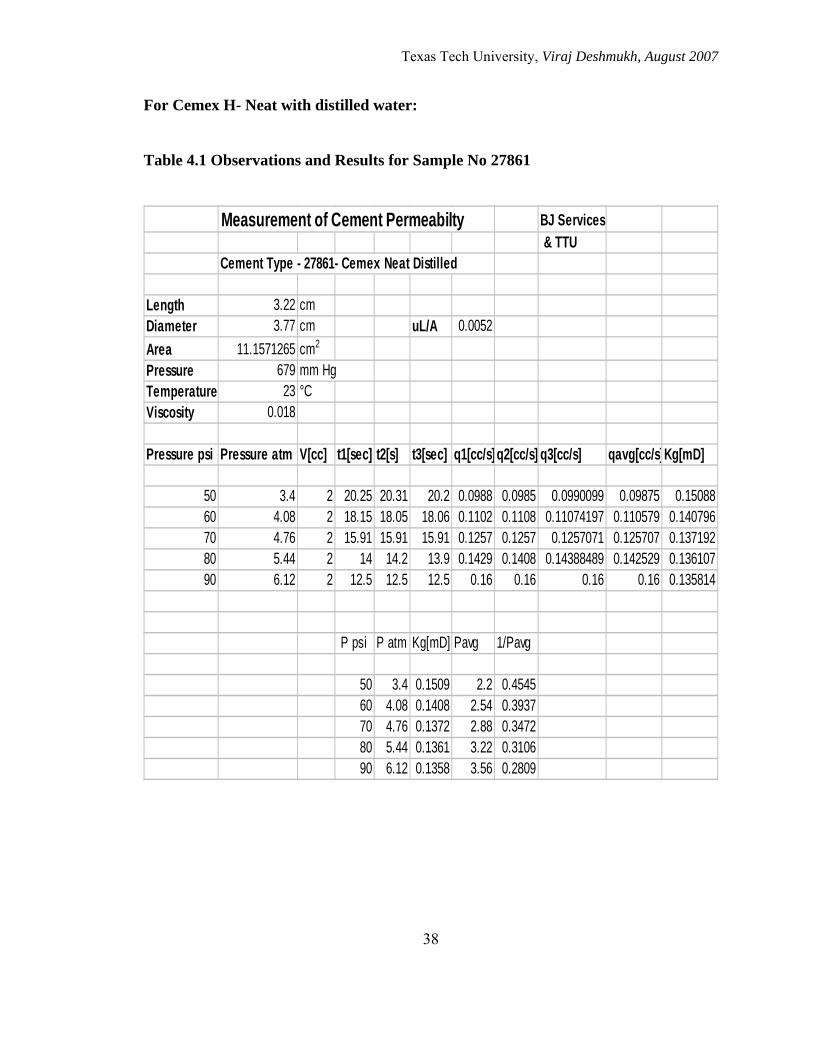
For Cemex H- Neat with distilled water: Table 4.1 Observations and Results for Sample No 27861
Measurement of Cement Permeabilty BJ Services & TTU
Cement Type - 27861- Cemex Neat Distilled
Length 3.22 cmDiameter 3.77 cm uL/A 0.0052Area 11.1571265 cm2
Pressure 679 mm HgTemperature 23 °CViscosity 0.018
Pressure psi Pressure atm V[cc] t1[sec] t2[s] t3[sec] q1[cc/s]q2[cc/s] q3[cc/s] qavg[cc/s]Kg[mD]
50 3.4 2 20.25 20.31 20.2 0.0988 0.0985 0.0990099 0.09875 0.1508860 4.08 2 18.15 18.05 18.06 0.1102 0.1108 0.11074197 0.110579 0.14079670 4.76 2 15.91 15.91 15.91 0.1257 0.1257 0.1257071 0.125707 0.13719280 5.44 2 14 14.2 13.9 0.1429 0.1408 0.14388489 0.142529 0.13610790 6.12 2 12.5 12.5 12.5 0.16 0.16 0.16 0.16 0.135814
P psi P atm Kg[mD] Pavg 1/Pavg
50 3.4 0.1509 2.2 0.454560 4.08 0.1408 2.54 0.393770 4.76 0.1372 2.88 0.347280 5.44 0.1361 3.22 0.310690 6.12 0.1358 3.56 0.2809
38

Texas Tech University, Viraj Deshmukh, August 2007
Cemex Neat Distilled y = 0.0035x + 0.1297R2 = 0.7604
0
0.02
0.04
0.06
0.08
0.1
0.12
0.14
0.16
0.28 0.31 0.35 0.39 0.451/Pavg
Gas
Per
mea
bilit
y
Figure 4.1 Klinkenberg Correction Graph for Sample No 27861 Absolute Permeability of Cemex Neat Cement with Distilled Water = 0.1297 mD
39

Texas Tech University, Viraj Deshmukh, August 2007
For Lehigh H- Neat with distilled water: Table 4.2 Observations and Results for Sample No 27862
Measurement of Cement Permeabilty BJ Services & TTU
Cement Type - 27862- Lehigh Neat Distilled
Length 3.68 cmDiameter 3.73 cm uL/A 0.006065Area 10.9216265 cm2
Pressure 680 mm HgTemperature 23 °CViscosity 0.018
Pressure psi Pressure atm V[cc] t1[s] t2[s] t3[s] q1[cc/s] q2[cc/s] q3[cc/s] qavg[cc/s]Kg[mD]
50 3.4 2 19.8 19.7 19.7 0.100908 0.1014199 0.10147133 0.101266 0.18064260 4.08 2 17.3 17.5 17.5 0.115407 0.1142204 0.11415525 0.114594 0.17034770 4.76 2 15.6 15.6 15.6 0.128205 0.1282051 0.12820513 0.128205 0.16335580 5.44 2 13.9 13.9 13.7 0.1443 0.1443001 0.1459854 0.144862 0.16150690 6.12 2 12.3 12.3 12.3 0.162602 0.1626016 0.16260163 0.162602 0.161141
P psiP atmKg[mD] Pavg 1/Pavg
50 3.4 0.180642 2.2 0.4545454560 4.08 0.170347 2.54 0.3937007970 4.76 0.163355 2.88 0.3472222280 5.44 0.161506 3.22 0.3105590190 6.12 0.161141 3.56 0.28089888
40

Texas Tech University, Viraj Deshmukh, August 2007
Lehigh Neat Distilled y = 0.0048x + 0.153R2 = 0.8344
0
0.02
0.04
0.06
0.08
0.1
0.12
0.14
0.16
0.18
0.2
0.454545 0.393701 0.347222 0.310559 0.2808991/Pavg
Gas
Per
mea
bilit
y
Figure 4.2 Klinkenberg Correction Graph for Sample No 27862 Absolute Permeability of Lehigh Neat Cement with Distilled Water = 0.153 mD
41

Texas Tech University, Viraj Deshmukh, August 2007
For Cemex 50 + Pozzalan 50 + Bentonite 10 + 5% Salt with distilled water: Table 4.3 Observations and Results for Sample No 27865
Measurement of Cement Permeability BJ Services & TTU
Cement Type - 27865- Cemex 50:50:10 Distilled
Length 4.04 cmDiameter 3.72 cm uL/A 0.00669Area 10.863144 cm2
Pressure 690 mm HgTemp 23 °CViscosity 0.018
Pressure psi Pressure atm V[cc] t1[sec] t2[sec] t3[sec] q1[cc/s] q2[cc/s] q3[cc/s] qavg[cc/s]Kg[mD]
50 3.4 0.1 1.9 1.9 1.86 0.05263 0.052632 0.05376344 0.053009 0.10436860 4.08 0.1 1.76 1.76 1.81 0.05682 0.056818 0.05524862 0.056295 0.09236570 4.76 0.1 1.61 1.61 1.61 0.06211 0.062112 0.0621118 0.062112 0.08735180 5.44 0.1 1.48 1.48 1.46 0.06757 0.067568 0.06849315 0.067876 0.08352590 6.12 0.1 1.32 1.32 1.32 0.07576 0.075758 0.07575758 0.075758 0.082865
P psi P atm Kg[mD] Pavg 1/Pavg
50 3.4 0.1044 2.2 0.45454560 4.08 0.0924 2.54 0.39370170 4.76 0.0874 2.88 0.34722280 5.44 0.0835 3.22 0.31055990 6.12 0.0829 3.56 0.280899
42

Texas Tech University, Viraj Deshmukh, August 2007
Cemex 50:50:10 Distilledy = 0.0052x + 0.0745
R2 = 0.862
0
0.02
0.04
0.06
0.08
0.1
0.12
0.28 0.31 0.35 0.39 0.451/Pavg
Gas
Per
mea
bilit
y
Figure 4.3 Klinkenberg Correction Graph for Sample No 27865 Absolute Permeability of Cemex 50:50:10 Cement with Distilled Water = 0.0745 mD
43

Texas Tech University, Viraj Deshmukh, August 2007
For Lehigh 50 + Pozzalan 50 + Bentonite 10 + 5% Salt with distilled water: Table 4.4 Observations and Results for Sample No 27866
Measurement of Cement Permeability BJ Services & TTU
Cement Type - 27866- Lehigh 50:50:10 Distilled
Leng 3.75 cmDiam 3.7 cm uL/A 0.00628Area 10.74665 cm2
Pres 680 mm HgTemp 23.1 °CVisc 0.018
Pressure psi Pressure atm V[cc] t1[sec] t2[sec] t3[sec] q1[cc/s] q2[cc/s] q3[cc/s] qavg[cc/s] Kg[mD]
50 3.4 0.1 2.14 2.14 2.14 0.04673 0.04673 0.0467 0.04672897 0.08632560 4.08 0.1 1.92 1.92 1.9 0.05208 0.05208 0.0526 0.05226608 0.08046270 4.76 0.1 1.76 1.76 1.76 0.05682 0.05682 0.0568 0.05681818 0.07497480 5.44 0.1 1.63 1.63 1.64 0.06135 0.06135 0.061 0.061225 0.0706990 6.12 0.1 1.51 1.49 1.49 0.06623 0.06711 0.0671 0.06681778 0.068576
P psi P atm Kg[mD]Pavg 1/Pavg
50 3.4 0.086 2.2 0.4545560 4.08 0.08 2.54 0.393770 4.76 0.075 2.88 0.3472280 5.44 0.071 3.22 0.3105690 6.12 0.069 3.56 0.2809
44

Texas Tech University, Viraj Deshmukh, August 2007
Lehigh 50:50:10 Distilled y = 0.0045x + 0.0626R2 = 0.9728
0
0.02
0.04
0.06
0.08
0.1
0.28 0.31 0.35 0.39 0.45
1/Pavg
Gas
Per
mea
bilit
y
Figure 4.4 Klinkenberg Correction Graph for Sample No 27866 Absolute Permeability of Lehigh 50:50:10 Cement with Distilled Water = 0.0626 mD
45

Texas Tech University, Viraj Deshmukh, August 2007
For Cemex H- Neat with 1000mg/l sulfates: Table 4.5 Observations and Results for Sample No 27877
Measurement of Cement Permeabilty BJ Services & TTU
Cement Type - 27877- Cemex Neat 1000mg/L
Length 4.3 cmDiameter 3.745 cm uL/A 0.00703Area 11.00964463 cm2
Pressure 683 mm HgTemp 23 °CViscosity 0.018
Pressure psi Pressure atm V[cc] t1[sec] t2[sec] t3[sec] q1[cc/s] q2[cc/s] q3[cc/s] qavg[cc/s]Kg[mD]
50 3.4 2 20 20.22 19.5 0.1 0.09891 0.1025641 0.100492 0.20778860 4.08 2 16.3 17.2 17.1 0.122699 0.11628 0.11695906 0.118646 0.20443770 4.76 2 14.5 14.75 14.5 0.137931 0.13559 0.13793103 0.137152 0.20256480 5.44 2 12.9 12.8 12.7 0.155039 0.15625 0.15748031 0.156256 0.20193390 6.12 2 11.4 11.5 11.3 0.175439 0.17391 0.17699115 0.175448 0.201541
P psi P atm Kg[mD] Pavg 1/Pavg
50 3.4 0.208 2.2 0.4545560 4.08 0.204 2.54 0.393770 4.76 0.203 2.88 0.3472280 5.44 0.202 3.22 0.3105690 6.12 0.202 3.56 0.2809
46

Texas Tech University, Viraj Deshmukh, August 2007
Cemex Neat 1000 mg/l y = 0.0015x + 0.1992R2 = 0.8547
0
0.05
0.1
0.15
0.2
0.25
0.28 0.31 0.35 0.39 0.451/Pavg
Gas
Per
mea
bilit
y
Figure 4.5 Klinkenberg Correction Graph for Sample No 27877 Absolute Permeability of Cemex Neat Cement with 1000mg/l Water = 0.1992 mD
47

Texas Tech University, Viraj Deshmukh, August 2007
For Lehigh H- Neat with 1000mg/l sulfates: Table 4.6 Observations and Results for Sample No 27878
Measurement of Cement Permeability BJ Services & TTU
Cement Type - 27878- Lehigh Neat 1000mg/L
Length 4 cmDiameter 3.735 cm uL/A 0.0066Area 10.95092663 cm2
Pressure 687 mm HgTemp 23 °CViscosity 0.018
Pressure psi Pressure atm V[cc] t1[sec] t2[sec] t3[sec] q1[cc/s]q2[cc/s] q3[cc/s] qavg[cc/s]Kg[mD]
50 3.4 2 19.4 19.1 19.1 0.1031 0.1047 0.10471204 0.104172 0.20144460 4.08 2 17.6 17.5 17.4 0.1136 0.1143 0.11494253 0.114288 0.18417270 4.76 2 16.5 16.5 16.5 0.1212 0.1212 0.12121212 0.121212 0.16742580 5.44 2 14.5 14.6 14.5 0.1379 0.137 0.13793103 0.137616 0.16632390 6.12 2 13 12.85 13.01 0.1538 0.1556 0.1537279 0.154405 0.165879
P psi P atm Kg[mD] Pavg 1/Pavg
50 3.4 0.20144 2.2 0.454560 4.08 0.18417 2.54 0.393770 4.76 0.16743 2.88 0.347280 5.44 0.16632 3.22 0.310690 6.12 0.16588 3.56 0.2809
48

Texas Tech University, Viraj Deshmukh, August 2007
Lehigh Neat 1000mg/l y = 0.0089x + 0.1504
R2 = 0.8093
0
0.05
0.1
0.15
0.2
0.25
0.28 0.31 0.35 0.39 0.45
1/Pavg
Gas
Per
mea
bilit
y
Figure 4.6 Klinkenberg Correction Graph for Sample No 27878 Absolute Permeability of Lehigh Neat with 1000mg/l Water = 0.1504 mD
49

Texas Tech University, Viraj Deshmukh, August 2007
For Cemex 50 + Pozzalan 50 + Bentonite 10 + 5% Salt with 1000mg/l sulfates: Table 4.7 Observations and Results for Sample No 27884
Measurement of Cement Permeability BJ Services & TTU
Cement Type - 27884- Cemex 50:50:10 1000mg/L
Length 3.51 cmDiameter 3.7 cm uL/A 0.0059Area 10.747 cm2
Pressure 684 mm HgTemp 23 CViscosity 0.018
Pressure psPressureV[cc] t1[sec] t2[sec] t3[sec] q1[cc/s]q2[cc/s] q3[cc/s] qavg[cc/s]Kg[mD]
50 3.4 0.1 1.7 1.7 1.72 0.0588 0.05882 0.05813953 0.058596 0.10131960 4.08 0.1 1.59 1.59 1.59 0.0629 0.06289 0.06289308 0.062893 0.09062570 4.76 0.1 1.39 1.39 1.36 0.0719 0.07194 0.07352941 0.072471 0.08950980 5.44 0.1 1.22 1.22 1.22 0.082 0.08197 0.08196721 0.081967 0.08858290 6.12 0.1 1.09 1.1 1.09 0.0917 0.09091 0.09174312 0.091465 0.087864
P psi P atm Kg[mD] Pavg 1/Pavg
50 3.4 0.1013 2.2 0.4545560 4.08 0.0906 2.54 0.393770 4.76 0.0895 2.88 0.3472280 5.44 0.0886 3.22 0.3105690 6.12 0.0879 3.56 0.2809
50

Texas Tech University, Viraj Deshmukh, August 2007
Cemex 50:50:10 1000 mg/ly = 0.0029x + 0.0829
R2 = 0.6824
0
0.02
0.04
0.06
0.08
0.1
0.12
0.28 0.31 0.35 0.39 0.451/Pavg
Gas
Per
mea
bilit
y
Figure 4.7 Klinkenberg Correction Graph for Sample No 27884 Absolute Permeability of Cemex 50:50:10 with 1000 mg/l Water = 0.0829 mD
51

Texas Tech University, Viraj Deshmukh, August 2007
For Lehigh 50 + Pozzalan 50 + Bentonite 10 + 5% Salt with 1000mg/l sulfates: Table 4.8 Observations and Results for Sample No 27885
Measurement of Cement Permeability BJ Services & TTU
Cement Type - 27885- Lehigh 50:50:10 1000mg/L
Length 3.5 cmDiameter 3.7 cm uL/A 0.00586Area 10.74665 cm2
Pressure 684 mm HgTemp 23 °CViscosity 0.018
Pressure psi Pressure atm V[cc] t1[sec] t2[sec] t3[sec] q1[cc/s] q2[cc/s] q3[cc/s] qavg[cc/s] Kg[mD]
50 3.4 0.1 1.79 1.79 1.78 0.05587 0.0559 0.0562 0.05597054 0.09650560 4.08 0.1 1.54 1.58 1.58 0.06494 0.0633 0.0633 0.06383911 0.09172670 4.76 0.1 1.45 1.44 1.41 0.06897 0.0694 0.0709 0.06977732 0.08593680 5.44 0.1 1.22 1.28 1.28 0.08197 0.0781 0.0781 0.07940574 0.0855790 6.12 0.1 1.16 1.13 1.13 0.08621 0.0885 0.0885 0.08773268 0.084038
P psi P atm Kg[mD] Pavg 1/Pavg
50 3.4 0.0965 2.2 0.454560 4.08 0.0917 2.54 0.393770 4.76 0.0859 2.88 0.347280 5.44 0.0856 3.22 0.310690 6.12 0.084 3.56 0.2809
52

Texas Tech University, Viraj Deshmukh, August 2007
Lehigh 50:50:10 1000mg/Ly = 0.0031x + 0.0794
R2 = 0.8849
0
0.02
0.04
0.06
0.08
0.1
0.12
0.28 0.31 0.35 0.39 0.45
1/Pavg
Gas
Per
mea
bilit
y
Figure 4.8 Klinkenberg Correction Graph for Sample No 27885 Absolute Permeability of Lehigh 50:50:10 1000mg/l = 0.0794mD
53

Texas Tech University, Viraj Deshmukh, August 2007
For Cemex H- Neat with 2000mg/l sulfates: Table 4.9 Observations and Results for Sample No 27907
Measurement of Cement Permeability BJ Services & TTU
Cement Type - 27907- Cemex Neat 2000mg/L
Length 4.34 cmDiameter 3.75 cm uL/A 0.00708Area 11.0390625 cm2
Pressure 684 mm HgTemp 23 °CViscosity 0.018
Pressure psi Pressure atm V[cc] t1[sec] t2[sec] t3[sec] q1[cc/s] q2[cc/s] q3[cc/s] qavg[cc/s] Kg[mD]
50 3.4 2 26.05 26.05 25.9 0.07678 0.0768 0.0772 0.07692365 0.16010760 4.08 2 23.33 23.33 23.22 0.08573 0.0857 0.0861 0.0858619 0.14892670 4.76 2 22 22 22 0.09091 0.0909 0.0909 0.09090909 0.13515480 5.44 2 19.82 19.82 19.8 0.10091 0.1009 0.101 0.10094215 0.13131290 6.12 2 17.6 17.9 17.9 0.11364 0.1117 0.1117 0.11236668 0.129932
P psi P atm Kg[mD] Pavg 1/Pavg
50 3.4 0.1601 2.2 0.454560 4.08 0.1489 2.54 0.393770 4.76 0.1352 2.88 0.347280 5.44 0.1313 3.22 0.310690 6.12 0.1299 3.56 0.2809
54

Texas Tech University, Viraj Deshmukh, August 2007
Cemex Neat 2000 mg/l y = 0.0078x + 0.1177R2 = 0.896
0
0.02
0.04
0.06
0.08
0.1
0.12
0.14
0.16
0.18
0.28 0.31 0.35 0.39 0.45
1/Pavg
Gas
Per
mea
bilit
y
Figure 4.9 Klinkenberg Correction Graph for Sample No 27907 Absolute Permeability of Cemex Neat Cement with 2000 mg/l Water = 0.1177 mD
55
Texas Tech University, Viraj Deshmukh, August 2007
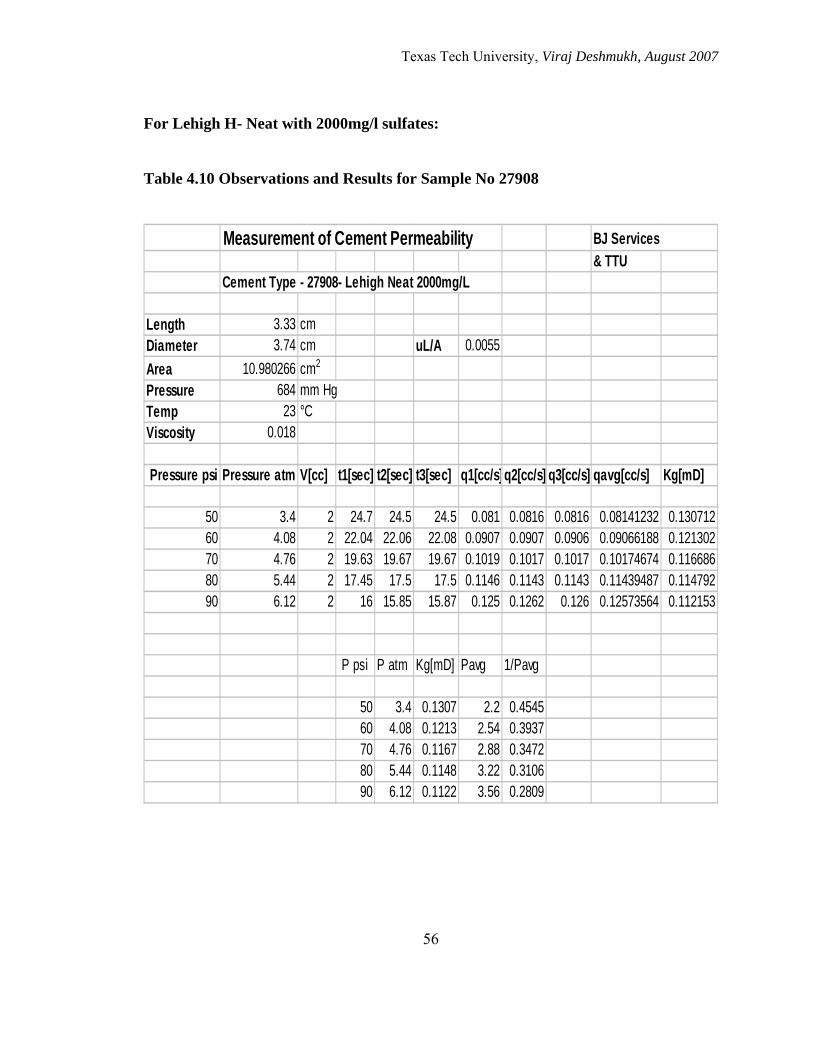
For Lehigh H- Neat with 2000mg/l sulfates: Table 4.10 Observations and Results for Sample No 27908
Measurement of Cement Permeability BJ Services & TTU
Cement Type - 27908- Lehigh Neat 2000mg/L
Length 3.33 cmDiameter 3.74 cm uL/A 0.0055Area 10.980266 cm2
Pressure 684 mm HgTemp 23 °CViscosity 0.018
Pressure psi Pressure atm V[cc] t1[sec] t2[sec] t3[sec] q1[cc/s]q2[cc/s] q3[cc/s] qavg[cc/s] Kg[mD]
50 3.4 2 24.7 24.5 24.5 0.081 0.0816 0.0816 0.08141232 0.13071260 4.08 2 22.04 22.06 22.08 0.0907 0.0907 0.0906 0.09066188 0.12130270 4.76 2 19.63 19.67 19.67 0.1019 0.1017 0.1017 0.10174674 0.11668680 5.44 2 17.45 17.5 17.5 0.1146 0.1143 0.1143 0.11439487 0.11479290 6.12 2 16 15.85 15.87 0.125 0.1262 0.126 0.12573564 0.112153
P psi P atm Kg[mD] Pavg 1/Pavg
50 3.4 0.1307 2.2 0.454560 4.08 0.1213 2.54 0.393770 4.76 0.1167 2.88 0.347280 5.44 0.1148 3.22 0.310690 6.12 0.1122 3.56 0.2809
56

Texas Tech University, Viraj Deshmukh, August 2007
Lehigh Neat 2000 mg/l y = 0.0044x + 0.106R2 = 0.8964
0
0.02
0.04
0.06
0.08
0.1
0.12
0.14
0.28 0.31 0.35 0.39 0.451/Pavg
Gas
Per
mea
bilit
y
Figure 4.10 Klinkenberg Correction Graph for Sample No 27908 Absolute Permeability of Lehigh Neat Cement with 2000 mg/l Water = 0.106mD
57

Texas Tech University, Viraj Deshmukh, August 2007
For Cemex 50 + Pozzalan 50 + Bentonite 10 + 5% Salt with 2000mg/l sulfates: Table 4.11 Observations and Results for Sample No 27939
Measurement of Cement Permeability BJ Services & TTU
Cement Type - 27939- Cemex 50:50:10 2000mg/L
Leng 4.11 cmDiam 3.67 cm uL/A 0.007Area 10.5730865 cm2
Pres 684 mm HgTemp 23 °CVisc 0.018
Pressure psi Pressure atm V[cc] t1[sec] t2[sec] t3[sec] q1[cc/s] q2[cc/s] q3[cc/s] qavg[cc/s] Kg[mD]
50 3.4 0.1 1.98 2.05 2.06 0.05051 0.04878 0.0485 0.04927641 0.10140860 4.08 0.1 1.82 1.78 1.76 0.05495 0.05618 0.0568 0.055981 0.09600570 4.76 0.1 1.59 1.59 1.59 0.06289 0.06289 0.0629 0.06289308 0.0924580 5.44 0.1 1.39 1.42 1.43 0.07194 0.07042 0.0699 0.07076502 0.09101990 6.12 0.1 1.27 1.27 1.27 0.07874 0.07874 0.0787 0.07874016 0.090024
P psi P atm Kg[mD] Pavg 1/Pavg
50 3.4 0.101 2.2 0.4545560 4.08 0.096 2.54 0.393770 4.76 0.092 2.88 0.3472280 5.44 0.091 3.22 0.3105690 6.12 0.09 3.56 0.2809
58

Texas Tech University, Viraj Deshmukh, August 2007
Cemex 50:50:10 2000 mg/l y = 0.0028x + 0.0859R2 = 0.8974
0
0.02
0.04
0.06
0.08
0.1
0.12
0.28 0.31 0.35 0.39 0.45
1/Pavg
Gas
Per
mea
bilit
y
Figure 4.11 Klinkenberg Correction Graph for Sample No 27939 Absolute Permeability of Cemex 50:50:10 with 2000 mg/l Water = 0.0859 mD
59

Texas Tech University, Viraj Deshmukh, August 2007
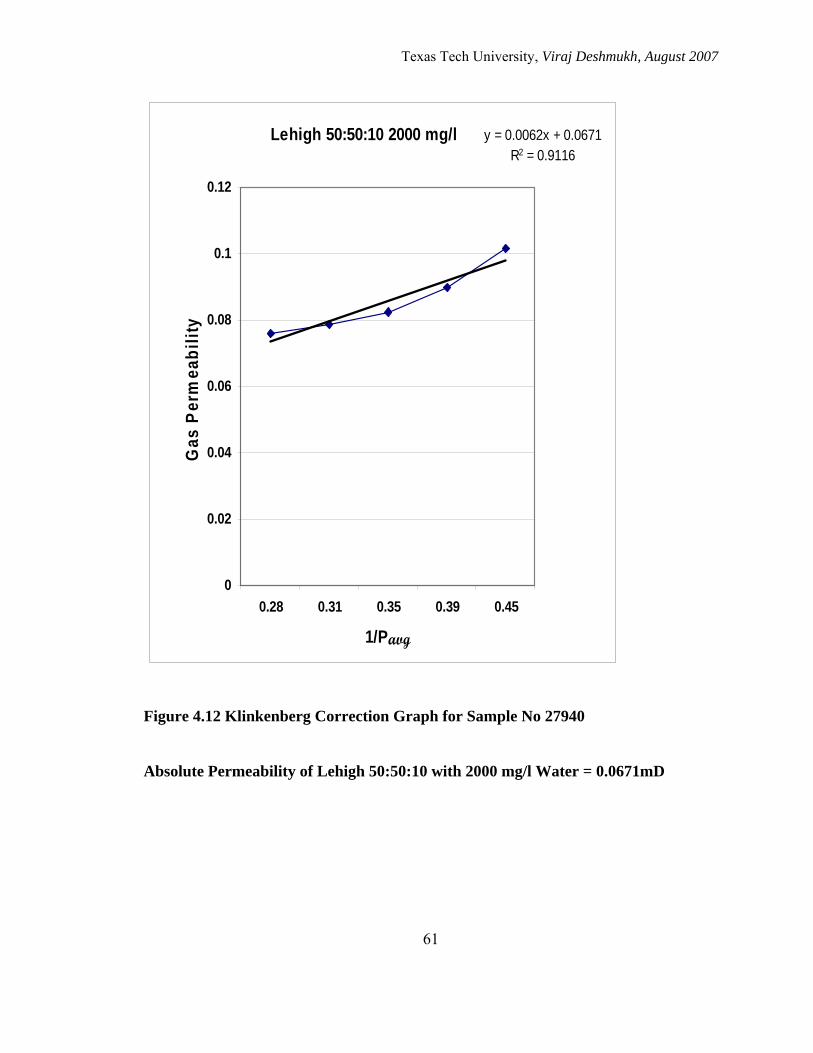
For Lehigh 50 + Pozzalan 50 + Bentonite 10 + 5% Salt with 2000mg/l sulfates: Table 4.12 Observations and Results for Sample No 27940
Measurement of Cement Permeability BJ Services & TTU
Cement Type - 27940- Lehigh 50:50:10 with 2000 mg/L Water
Length 4.17 cmDiameter 3.7 cm uL/A 0.00698Area 10.747 cm2
Pressure 678 mm HgTemp 23 °CViscosity 0.018
Pressure pPressureV[cc] t1[sec]t2[sec] t3[sec] q1[cc/s] q2[cc/s] q3[cc/s] qavg[cc/s]Kg[mD]
50 3.4 0.1 2.04 2.05 1.98 0.04902 0.0488 0.0505 0.049435 0.1015527160 4.08 0.1 1.92 1.91 1.9 0.05208 0.0524 0.0526 0.052357 0.0896292770 4.76 0.1 1.77 1.79 1.79 0.0565 0.0559 0.0559 0.056076 0.0822826380 5.44 0.1 1.63 1.63 1.63 0.06135 0.0613 0.0613 0.06135 0.0787678490 6.12 0.1 1.5 1.5 1.5 0.06667 0.0667 0.0667 0.066667 0.0760839
P psi P atm Kg[mD] Pavg 1/Pavg
50 3.4 0.1016 2.2 0.454560 4.08 0.0896 2.54 0.393770 4.76 0.0823 2.88 0.347280 5.44 0.0788 3.22 0.310690 6.12 0.0761 3.56 0.2809
60
Texas Tech University, Viraj Deshmukh, August 2007
Lehigh 50:50:10 2000 mg/l y = 0.0062x + 0.0671R2 = 0.9116
0
0.02
0.04
0.06
0.08
0.1
0.12
0.28 0.31 0.35 0.39 0.45
1/Pavg
Gas
Per
mea
bilit
y
Figure 4.12 Klinkenberg Correction Graph for Sample No 27940 Absolute Permeability of Lehigh 50:50:10 with 2000 mg/l Water = 0.0671mD
61

Texas Tech University, Viraj Deshmukh, August 2007
For Cemex H- Neat with 4000mg/l sulfates: Table 4.13 Observations and Results for Sample No 27950
Measurement of Cement Permeability BJ Services & TTU
Cement Type - 27950- Cemex Neat 4000mg/L
Length 3.7 cmDiameter 3.74 cm uL/A 0.00607Area 10.980266 cm2
Pressure 682 mm HgTemp 23 °CViscosity 0.018
Pressure psi Pressure atm V[cc] t1[sec] t2[sec] t3[sec] q1[cc/s] q2[cc/s] q3[cc/s] qavg[cc/s] Kg[mD]
50 3.4 2 25.6 25.6 25.6 0.07813 0.0781 0.0781 0.078125 0.1393710260 4.08 2 22.41 22.41 22.5 0.08925 0.0892 0.0889 0.08912688 0.1324981870 4.76 2 19.6 19.6 19.6 0.10204 0.102 0.102 0.10204082 0.1300254480 5.44 2 17.15 17.17 17.2 0.11662 0.1165 0.1163 0.11645979 0.1298489690 6.12 2 15.52 15.65 15.65 0.12887 0.1278 0.1278 0.12815234 0.12700959
P psi P atm Kg[mD] Pavg 1/Pavg
50 3.4 0.1394 2.2 0.454560 4.08 0.1325 2.54 0.393770 4.76 0.13 2.88 0.347280 5.44 0.1298 3.22 0.310690 6.12 0.127 3.56 0.2809
62

Texas Tech University, Viraj Deshmukh, August 2007
Cemex Neat 4000 mg/l y = 0.0027x + 0.1235R2 = 0.8543
0
0.02
0.04
0.06
0.08
0.1
0.12
0.14
0.16
0.28 0.31 0.35 0.39 0.45
1/Pavg
Gas
Per
mea
bilit
y
Figure 4.13 Klinkenberg Correction Graph for Sample No 27950 Absolute Permeability of Cemex Neat Cement with 4000 mg/l Water = 0.1235 mD
63

Texas Tech University, Viraj Deshmukh, August 2007
For Lehigh H- Neat with 4000mg/l sulfates: Table 4.14 Observations and Results for Sample No 27951
Measurement of Cement Permeability BJ Services & TTU
Cement Type - 27951- Lehigh Neat 4000mg/L
Length 3.73 cmDiameter 3.74 cm uL/A 0.00611Area 10.980266 cm2
Pressure 682 mm HgTemp 23 °CViscosity 0.018
Pressure psi Pressue atm V[cc] t1[sec] t2[sec] t3[sec] q1[cc/s] q2[cc/s] q3[cc/s] qavg[cc/s]Kg[mD]
50 3.4 2 28.2 28.2 28.2 0.07092 0.0709 0.0709 0.070922 0.1275470660 4.08 2 26.5 26.5 26.6 0.07547 0.0755 0.0752 0.075377 0.1129660370 4.76 2 24.1 23.95 23.94 0.08299 0.0835 0.0835 0.083346 0.1070642980 5.44 2 22 22.1 22.1 0.09091 0.0905 0.0905 0.090635 0.1018743490 6.12 2 19.6 19.9 19.9 0.10204 0.1005 0.1005 0.101015 0.10092625
P psi P atm Kg[mD] Pavg 1/Pavg
50 3.4 0.1275 2.2 0.454560 4.08 0.113 2.54 0.393770 4.76 0.1071 2.88 0.347280 5.44 0.1019 3.22 0.310690 6.12 0.1009 3.56 0.2809
64

Texas Tech University, Viraj Deshmukh, August 2007
Lehigh Neat 4000 mg/l y = 0.0064x + 0.0908R2 = 0.8738
0
0.02
0.04
0.06
0.08
0.1
0.12
0.14
0.28 0.31 0.35 0.39 0.45
1/Pavg
Gas
Per
mea
bilit
y
Figure 4.14 Klinkenberg Correction Graph for Sample No 27951 Absolute Permeability of Lehigh Neat Cement with 4000mg/l Water = 0.0908 mD
65

Texas Tech University, Viraj Deshmukh, August 2007
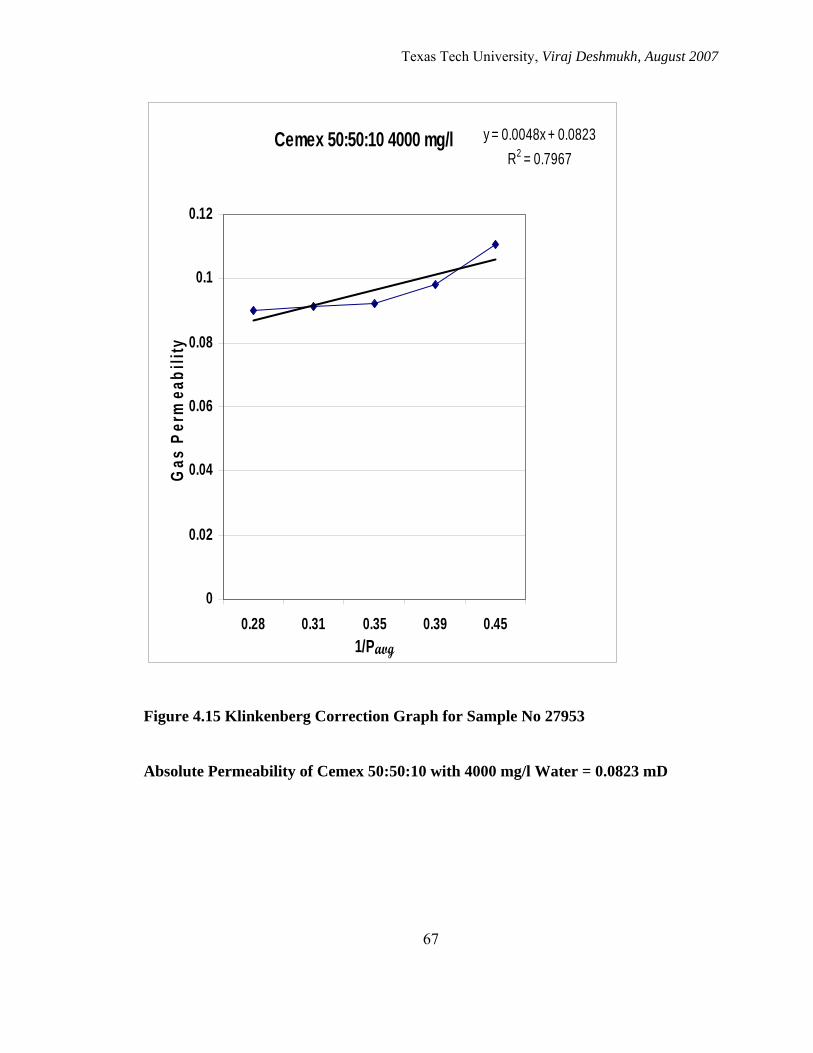
For Cemex 50 + Pozzalan 50 + Bentonite 10 + 5% Salt with 4000mg/l sulfates: Table 4.15 Observations and Results for Sample No 27953
Measurement of Cement Permeability BJ Services & TTU
Cement Type - 27953- Cemex 50:50:10 4000mg/L
Length 4.04 cmDiameter 3.85 cm uL/A 0.00625Area 11.6356625 cm2
Pressure 684 mm HgTemp 23 °CViscosity 0.018
Pressure psi Pressure atm V[cc] t1[sec] t2[sec] t3[sec] q1[cc/s] q2[cc/s] q3[cc/s] qavg[cc/s]Kg[mD]
50 3.4 0.1 1.66 1.66 1.67 0.06024 0.0602 0.0599 0.060121 0.11051164160 4.08 0.1 1.56 1.56 1.56 0.0641 0.0641 0.0641 0.064103 0.09819242770 4.76 0.1 1.44 1.42 1.41 0.06944 0.0704 0.0709 0.070263 0.09225340880 5.44 0.1 1.27 1.28 1.22 0.07874 0.0781 0.082 0.079611 0.09146096790 6.12 0.1 1.15 1.14 1.11 0.08696 0.0877 0.0901 0.088255 0.090126425
P psi P atm Kg[mD] Pavg 1/Pavg
50 3.4 0.1105 2.2 0.454560 4.08 0.0982 2.54 0.393770 4.76 0.0923 2.88 0.347280 5.44 0.0915 3.22 0.310690 6.12 0.0901 3.56 0.2809
66
Texas Tech University, Viraj Deshmukh, August 2007
Cemex 50:50:10 4000 mg/l y = 0.0048x + 0.0823R2 = 0.7967
0
0.02
0.04
0.06
0.08
0.1
0.12
0.28 0.31 0.35 0.39 0.451/Pavg
Gas
Per
mea
bilit
y
Figure 4.15 Klinkenberg Correction Graph for Sample No 27953 Absolute Permeability of Cemex 50:50:10 with 4000 mg/l Water = 0.0823 mD
67

Texas Tech University, Viraj Deshmukh, August 2007
For Lehigh 50 + Pozzalan 50 + Bentonite 10 + 5% Salt with 4000mg/l sulfates: Table 4.16 Observations and Results for Sample No 27952
Measurement of Cement Permeability BJ Services & TTU
Cement Type - 27952- Lehigh 50:50:10 4000mg/L
Length 4 cmDiameter 3.68 cm uL/A 0.00677Area 10.630784 cm2
Pressure 682 mm HgTemp 23 °CViscosity 0.018
Pressure psi Pressure atm V[cc] t1[sec] t2[sec] t3[sec] q1[cc/s] q2[cc/s] q3[cc/s] qavg[cc/s]Kg[mD]
50 3.4 0.1 1.69 1.69 1.67 0.05917 0.0592 0.0599 0.059408 0.1183400760 4.08 0.1 1.54 1.54 1.54 0.06494 0.0649 0.0649 0.064935 0.1077919570 4.76 0.1 1.36 1.4 1.36 0.07353 0.0714 0.0735 0.072829 0.103625280 5.44 0.1 1.2 1.2 1.22 0.08333 0.0833 0.082 0.082878 0.1031828190 6.12 0.1 1.08 1.07 1.08 0.09259 0.0935 0.0926 0.092881 0.10278811
P psi P atm Kg[mD] Pavg 1/Pavg
50 3.4 0.1183 2.2 0.454560 4.08 0.1078 2.54 0.393770 4.76 0.1036 2.88 0.347280 5.44 0.1032 3.22 0.310690 6.12 0.1028 3.56 0.2809
68

Texas Tech University, Viraj Deshmukh, August 2007
Lehigh 50:50:10 4000 mg/ly = 0.0036x + 0.0964
R2 = 0.738
0
0.02
0.04
0.06
0.08
0.1
0.12
0.14
0.28 0.31 0.35 0.39 0.451/Pavg
Gas
Per
mea
bilit
y
Figure 4.16 Klinkenberg Correction Graph for Sample No 27952 Absolute Permeability of Lehigh 50:50:10 with 4000mg/l Water = 0.0964 mD
69
Texas Tech University, Viraj Deshmukh, August 2007
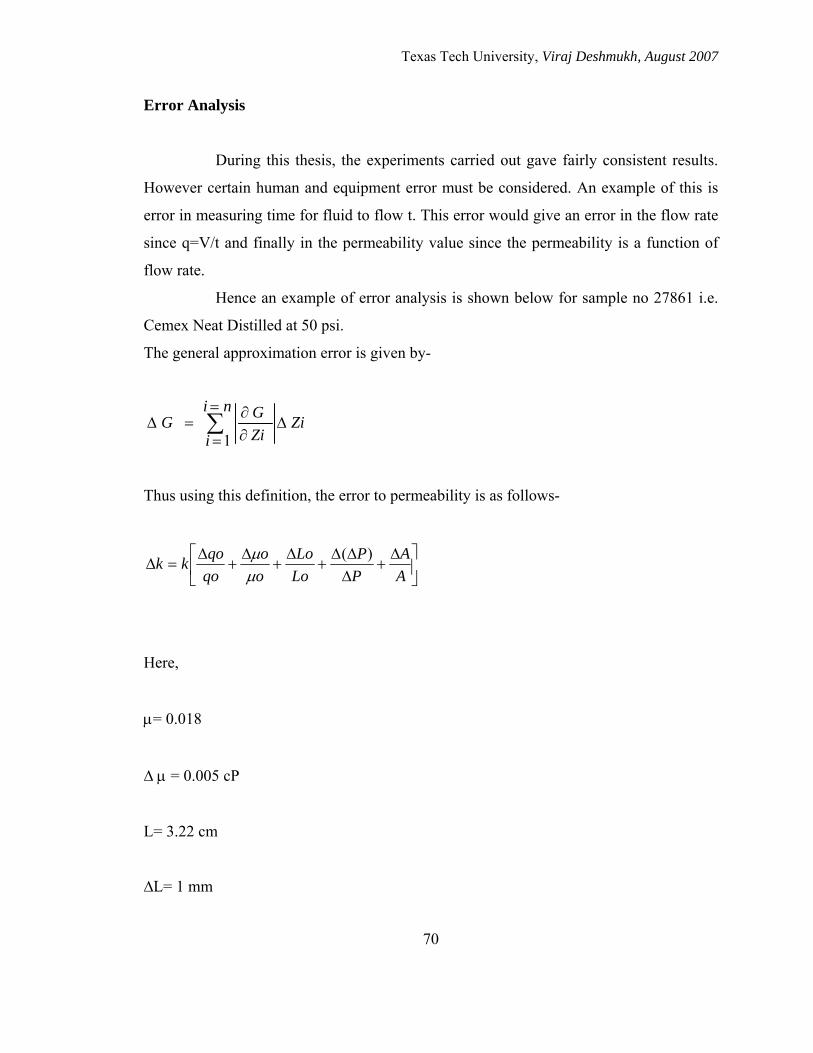
Error Analysis
During this thesis, the experiments carried out gave fairly consistent results.
However certain human and equipment error must be considered. An example of this is
error in measuring time for fluid to flow t. This error would give an error in the flow rate
since q=V/t and finally in the permeability value since the permeability is a function of
flow rate.
Hence an example of error analysis is shown below for sample no 27861 i.e.
Cemex Neat Distilled at 50 psi.
The general approximation error is given by-
∑=
=Δ
∂∂
=Δni
iZi
ZiGG
1
Thus using this definition, the error to permeability is as follows-
⎥⎦
⎤⎢⎣
⎡ Δ+
ΔΔΔ
+Δ
+Δ
+Δ
=ΔAA
PP
LoLo
oo
qoqokk )(
μμ
Here,
μ= 0.018
∆ μ = 0.005 cP
L= 3.22 cm
∆L= 1 mm
70

Texas Tech University, Viraj Deshmukh, August 2007
71
D = 3.77 cm
∆D= 1 mm, ∆A= 0.295
∆ (∆P) = 0.15 atm
Qο= 0.09875 cc/sec
∆T= 0.2 sec, ∆Q= 0.0097
k= 0.1297 mD [calculated]
Hence the possible error for the experiment setup can be given as-
∆k= 0.0179

Texas Tech University, Viraj Deshmukh, August 2007
CHAPTER V
ANALYSIS AND COMPARISON OF RESULTS
The summary for the cement permeability based on the mixing waters and the slurry
combination is as shown in Table 5.1:
Table 5.1 Summary of Cement Permeability for all the samples
Cement Type Absolute Permeability
Cemex Neat Distilled 0.1297 mD
Cemex Neat 1000 0.1992 mD
Cemex Neat 2000 0.1177 mD
Cemex Neat 4000 0.1235 mD
Lehigh Neat Distilled 0.153 mD
Lehigh Neat 1000 0.1504 mD
Lehigh Neat 2000 0.106 mD
Lehigh Neat 4000 0.0908 mD
Cemex 50:50:10 Distilled 0.0745 mD
Cemex 50:50:10 1000 0.0829 mD
Cemex 50:50:10 2000 0.0859 mD
Cemex 50:50:10 4000 0.0823 mD
Lehigh 50:50:10 Distilled 0.0626 mD
Lehigh 50:50:10 1000 0.0794 mD
Lehigh 50:50:10 2000 0.0671 mD
Lehigh 50:50:10 4000 0.0964 mD
72
Texas Tech University, Viraj Deshmukh, August 2007
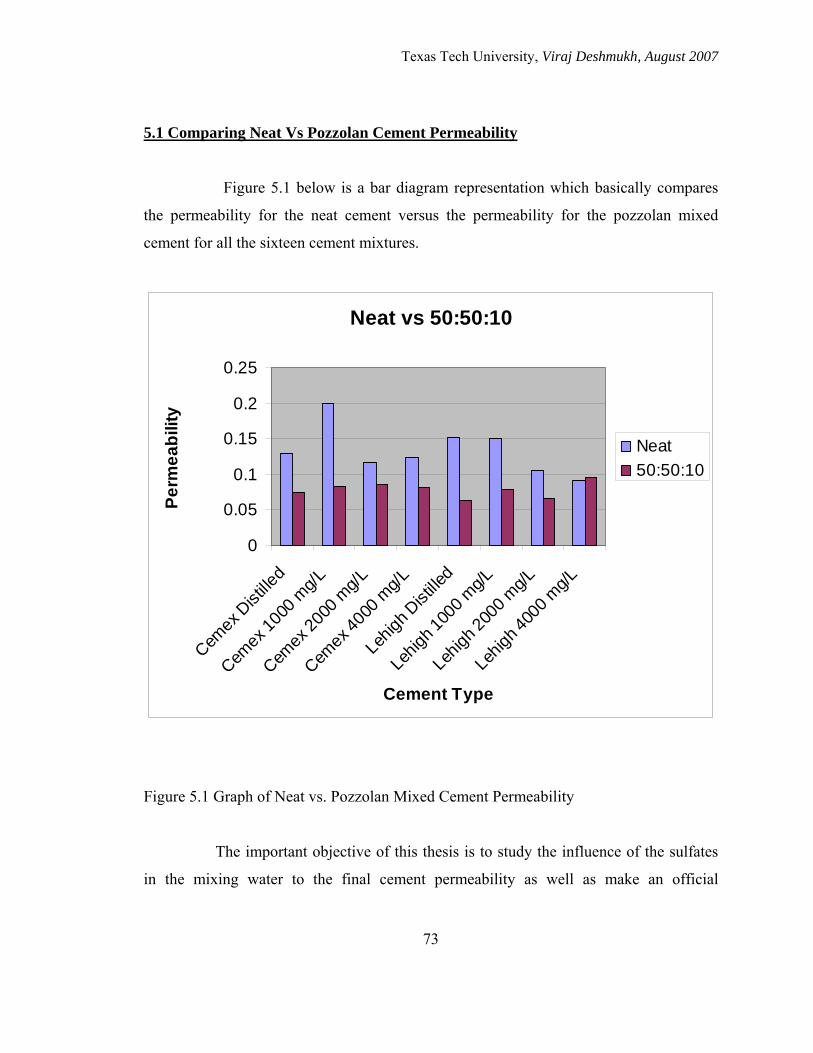
5.1 Comparing Neat Vs Pozzolan Cement Permeability
Figure 5.1 below is a bar diagram representation which basically compares
the permeability for the neat cement versus the permeability for the pozzolan mixed
cement for all the sixteen cement mixtures.
Neat vs 50:50:10
0
0.05
0.1
0.15
0.2
0.25
Cemex
Dist
illed
Cemex
1000
mg/L
Cemex
2000
mg/L
Cemex
4000
mg/L
Lehig
h Dist
illed
Lehig
h 100
0 mg/L
Lehig
h 200
0 mg/L
Lehig
h 400
0 mg/L
Cement Type
Perm
eabi
lity
Neat50:50:10
Figure 5.1 Graph of Neat vs. Pozzolan Mixed Cement Permeability
The important objective of this thesis is to study the influence of the sulfates
in the mixing water to the final cement permeability as well as make an official
73

Texas Tech University, Viraj Deshmukh, August 2007
74
documentation of the different cement permeability of cement mixtures used by BJ
Services in the Permian Basin.
Thus before looking into the influence of sulfates, we first study the influence
of the different components used to prepare the slurry on final permeability of the set
cement.
Hence as mentioned in the Literature Review the two important slurry types
used in the Permian Basin involve the slurries made of the neat cement itself i.e. cement
prepared just by mixing water to the dry cement. The other commonly used slurry type is
the Pozzolan cement. This cement has a proportion of 50:50:10 of the cement, the
chemical pozzolan and bentonite respectively.
What the above chart indicates to us about the basic two slurry types for the
different mixing waters used is that the cement slurry prepared by using pozzolan have a
relatively lower range of permeability than the neat cement samples.
Thus this chart clearly illustrates to us the fact that the pozzolan mixed
cements will always have a lower permeability value for the same mixing water as
compared to their neat counterparts. Thus these pozzolan mixed cements with lower
permeability values will quite understandably show higher resistance to sulfate attack
from downhole waters as compared to the resistance showed by the neat cement slurries.
The above can be confirmed from the fact that the pozzolan mixed cement permeability is
lower for not just one or two, but for all the different mixing waters tested in the
laboratory.
Thus we can once again emphasize this difference between the neat and the
pozzolan mixed cements by seeing the individual charts for cement permeability for all
the different mixing waters as shown from Figure 5.2 to Figure 5.9:

Texas Tech University, Viraj Deshmukh, August 2007
Cemex Distilled
0.1297
0.0745
0
0.02
0.04
0.06
0.08
0.1
0.12
0.14
Cemex Neat Distilled Cemex 50:50:10 Distilled
Perm
eabi
lity
Figure 5.2 Graph of Cemex Distilled Neat vs. Pozzolan Cement
Lehigh Distilled
0.153
0.0626
0
0.02
0.04
0.06
0.08
0.1
0.12
0.14
0.16
0.18
Lehigh Neat Distilled Lehigh 50:50:10 Distilled
Perm
eabi
lity
Figure 5.3 Graph of Lehigh Distilled Neat vs. Pozzolan Cement 75

Texas Tech University, Viraj Deshmukh, August 2007
Cemex 1000 mg/l
0.1992
0.0829
0
0.05
0.1
0.15
0.2
0.25
Cemex Neat 1000 mg/l Cemex 50:50:10 1000 mg/l
Perm
eabi
lity
Figure 5.4 Graph of Cemex 1000mg/l Neat vs. Pozzolan Cement
Lehigh 1000 mg/l
0.1504
0.0794
0
0.02
0.04
0.06
0.08
0.1
0.12
0.14
0.16
Lehigh Neat 1000 mg/l Lehigh 50:50:10 1000 mg/l
Per
mea
bilit
y
Figure 5.5 Graph of Lehigh 1000mg/l Neat vs. Pozzolan Cement 76

Texas Tech University, Viraj Deshmukh, August 2007
Cemex 2000 mg/l
0.1177
0.0859
0
0.02
0.04
0.06
0.08
0.1
0.12
0.14
Cemex Neat 2000 mg/l Cemex 50:50:10 2000 mg/l
Perm
eaib
ility
Figure 5.6 Graph of Cemex 2000 mg/l Neat vs. Pozzolan Cement
Lehigh 2000 mg/l
0.106
0.0671
0
0.02
0.04
0.06
0.08
0.1
0.12
Lehigh Neat 2000 mg/l Lehigh 50:50:10 2000 mg/l
Per
mea
bilit
y
Figure 5.7 Graph of Lehigh 2000 mg/l Neat vs. Pozzolan Cement 77

Texas Tech University, Viraj Deshmukh, August 2007
Lehigh 4000 mg/l
0.09080.0964
0
0.02
0.04
0.06
0.08
0.1
0.12
Lehigh Neat 4000 mg/l Lehigh 50:50:10 4000 mg/l
Per
mea
bilit
y
Figure 5.8 Graph of Lehigh 4000 mg/l Neat vs. Pozzolan Cement
Cemex 4000 mg/l
0.1235
0.0823
0
0.02
0.04
0.06
0.08
0.1
0.12
0.14
Cemex Neat 4000 mg/l Cemex 50:50:10 4000 mg/l
Perm
eabi
lity
Figure 5.9 Graph of Cemex 4000 mg/l Neat vs. Pozzolan Cement
78

Texas Tech University, Viraj Deshmukh, August 2007
79
Thus based on all of the above findings and results it is clear that as far as
choosing the cement slurry itself is concerned irrespective of the mixing water used, in
cases where there is expected to be high sulfate presence in the downhole water, it would
be far more recommended to use the pozzolan cement slurries instead of the neat cement
slurries. Thus pozzolan gives cement advantages such as making it more light etc, and its
permeability is low, while neat cements have higher permeability and hence should be
avoided in high sulfate water formations, because of the damage that is possible to the
cement and ultimately the casing because of this higher permeability.

Texas Tech University, Viraj Deshmukh, August 2007
80
5.2 Influence of Sulfate Percentage in Mixing Water on Cement Permeability
An important aspect of this thesis was to study the influence of sulfate present
in mixing water on the cement permeability. Thus although it is commonly known that
secondary ettringite which forms in the cement over a long period [over few years] does
damage and crack the cement, the role of primary ettringite [formed as soon as the
cement is set] has not been confirmed to damage the cement like the secondary ettringite
does. Thus we look at the charts for the four different cement mixtures i.e. Cemex Neat,
Cemex 50:50:10, Lehigh Neat, Lehigh 50:50:10 with the different mixing waters used, to
come to a conclusion on the role of the sulfates/primary ettringite on the initial
permeability of the cement, before the secondary ettringite has formed within the cement.
This is represented in Figures 5.10 to Figure 5.13.

Texas Tech University, Viraj Deshmukh, August 2007
Cemex Neat
Cemex Neat
0.1297
0.1992
0.1177
0.153
0
0.05
0.1
0.15
0.2
0.25
Distilled Water 1000 mg/L SulfateWater
2000 mg/L SulfateWater
4000 mg/L SulfateWater
Sulfates in Mixing Water
Perm
eabi
lity
Figure 5.10 Graph Comparing Cement Perm for Cemex Neat with Diff Mix Waters
Lehigh Neat
Lehigh Neat
0.153 0.1504
0.1060.0908
0
0.05
0.1
0.15
0.2
0.25
Lehigh NeatDistilled
Lehigh Neat 1000mg/L
Lehigh Neat 2000mg/l
Lehigh Neat 4000mg/L
Sulfates in Mixing Water
Per
mea
bilit
y
Fig 5.11 Graph Comparing Cement Perm for Lehigh Neat with Diff Mix Waters
81

Texas Tech University, Viraj Deshmukh, August 2007
Cemex 50:50:10
Cemex 50:50:10
0.0745 0.0829 0.0859 0.0823
0
0.05
0.1
0.15
0.2
0.25
Cemex 50:50:10Distilled
Cemex 50:50:101000 mg/L
Cemex 50:50:102000 mg/L
Cemex 50:50:104000 mg/L
Sulfates in Mixing Water
Perm
eabi
lity
Fig 5.12 Graph Comparing Cement Perm for Cemex 50:50:10 with Diff Mix Waters
Lehigh 50:50:10
Lehigh 50:50:10
0.06260.0794
0.0671
0.0964
0
0.05
0.1
0.15
0.2
0.25
Lehigh 50:50:10Distilled
Lehigh 50:50:101000 mg/l
Lehigh 50:50:102000 mg/L
Lehigh 50:50:104000 mg/L
Sulfates in Mixing Water
Per
mea
bilit
y
Fig 5.13 Graph Comparing Cement Perm for Lehigh 50:50:10 with Diff Mix Waters
82

Texas Tech University, Viraj Deshmukh, August 2007
Summary of Results Indicating that Primary Ettringite does not influence Permeability The above four results are summarized below in Figure 5.14:
Permeability vs Mixing water
0
0.05
0.1
0.15
0.2
0.25
Cemex Neat Lehigh Neat Cemex50:50:10
Lehigh50:50:10
Cement Type
Perm
eabi
lity Distilled Watert
1000 mg/L
2000 mg/L
4000 mg/L
Fig 5.14 Overall Graph for the 4 Cement Types with Different Mixing Waters
83

Texas Tech University, Viraj Deshmukh, August 2007
84
CHAPTER VI
CONCLUSIONS
From the above the analysis of results can be summarized as follows:
1] Cement mixed neat shows higher permeability values the cements mixed with
pozzolan.
2] The sulfates present in the mixing water for preparing the cement does not affect the
cement permeability during the initial life of the cement.
Thus based on the above analysis, since one of the objectives of this thesis was
to investigate and make appropriate recommendations for BJ Services for their operations
in the Permian Basin the conclusion for this study can be based as follows:
1] In the Permian Basin BJ Services faces problems in some wells downhole of sulfates
in downhole water attacking and corroding the cement and later on the casing. However
this study shows quite clearly that using mixing water with a lower amount of sulfate in it
will not solve this problem. Thus this also implies on a general level, that initial cement
permeability is not affected by the formation of primary ettringite. However the role of
secondary ettringite which is known to form more than 120 days of cement setting, still
needs to be investigated.
2] The analysis also shows us quite clearly, that neat cement mixtures invariably tend to
show higher permeability than the pozzolan mixed cement mixtures. Thus the
recommendation for BJ Services must be to try and use pozzolan mixed cements,
especially in situations where high sulfate presence in downhole water is expected. Thus
using pozzolan mixed cements in such situations, may lead to higher resistance to sulfate
attack from these downhole waters.

Texas Tech University, Viraj Deshmukh, August 2007
85
CHAPTER VII
RECOMMENDATIONS
Based on the results obtained and the conclusions derived from this study,
certain recommendations for future study have been made. These recommendations are
not limited to just the work done in this thesis, but using this thesis as a base for further
research in other types of study on cement.
1] The role of primary ettringite was found to be insignificant as far as cement
permeability is concerned. However of great interest for future study, would be to test
these same samples around 6 months down the line. I recommend soaking all the cement
plugs tested in this study in sulfate water for this period. Thus it can be expected that the
sulfate in the water would react with the cement and go on to form secondary ettringite
within the cement, a process which is typically known to occur after 120 days of the
original cement setting. Cement Permeability if then measured again after formation of
the secondary ettringite, might then show any existing co relation between cement
permeability to the cement mixture/mixing water, due to formation of secondary
ettringite.
2] Another aspect that can be studied is the role of other cement additives in its
permeability value. Thus since this study limited cement slurry mixtures to only pozzolan
and bentonite mixing, it is recommended to prepare future samples with chemicals such
as expansion additives like MgO or CaO. This would be useful to see whether these
expansion additives also make any significant difference to the cement permeability.
3] Also apart from permeability the above study could also be expanded to measuring
properties such as porosity or expansion of the cement, to give a better understanding of
cement which will help predict downhole cement behavior.
Texas Tech University, Viraj Deshmukh, August 2007
86
BIBLIOGRAPHY
1. Backe, K.R., O.B. Lile, S.K. Lyomov, H. Elvebakk, P. Skalle. “Characterizing Curing
Cement Slurries by Permeability, Tensile Strength and Shrinkage.” In SPE Western
Regional Meeting, 25-27 June 1997, Long Beach, California.
2. Collepardi, M.Civil Engineering Faculty, Leonardo Da Vinci, Polytechnic Milan,
Italy. “A State-of-the-Art-Review on Delayed Ettringite Attack on Concrete.”
www.encosrl.it/enco%20srl%20ITA/servizi/pdf/degrado/67.pdf (accessed May 15,
2007).
3. “Darcy’s Law, Klinkenberg Effect and Pozzolan.” www.Wikepedia.org (accessed June
28, 2007).
4. Goode, John M. Halliburton Co. “Gas and Water Permeability Data for Some
Common Oilwell Cements.” In SPE Production Research Symposium,
April 12-13, 1962, Tulsa, Oklahoma.
5. Lynn Jack, Jennings Scott, Saudi Aramco. Personal Communication. 2007.
6. Morales Marcela, Morris Walter, A. Marcelo, Robles Jorge, Bianchi
Gustavo. "Improving the Sulfate Resistance Performance of API cement Class A upon
Appropriate Slurry Design." Presented at the SPE Latin American and Caribbean
Petroleum Conference, 27-30 April 2003, Port-of-Spain, Trinidad, West Indies.

Texas Tech University, Viraj Deshmukh, August 2007
87
7. Morgan B.E., G.K. Dumbauld, Humble Oil & Refining Co. “Measurement of the
Permeability of Set Cement." Petroleum Transactions AIME, Technical Note 120. Vol
195, 1952.
8. Rabia H. “Oilwell Drilling Engineering: Principles and Practice” Grahman and
Trotman, 1985, London.
9. Roscoe C.Clark Jr., Stanolind Oil and Gas Company. “Influence of Different Types
of Formation Waters on Disintegration of Cements.” Petroleum Transactions,
Technical Note 59. Vol 189, 1950.
10. Sanyal S.K., R.M. Pirnie III, G.O Chen, S.S. Mardsen, Stanford University. “A Novel
Liquid Permeameter for Measuring Very Low Permeability.” In SPE 45th Annual Fall
Meeting, Houston, Texas, Oct 4-7, 1970.
11. Tanikawa W. and Shimamoto T. “Klinkenberg effect for gas permeability and
its comparison to water permeability for porous sedimentary rocks.” Hydrology and
Earth System Sciences Discussions, 3, 1315-1338, 2006.

Texas Tech University, Viraj Deshmukh, August 2007
88
APPENDIX

Texas Tech University, Viraj Deshmukh, August 2007
CEMEX NEAT DISTILLED
89

Texas Tech University, Viraj Deshmukh, August 2007
90

Texas Tech University, Viraj Deshmukh, August 2007
LEHIGH NEAT DISTILLED
91

Texas Tech University, Viraj Deshmukh, August 2007
92

Texas Tech University, Viraj Deshmukh, August 2007
CEMEX 50:50:10 DISTILLED
93

Texas Tech University, Viraj Deshmukh, August 2007
94

Texas Tech University, Viraj Deshmukh, August 2007
LEHIGH 50:50:10 DISTILLED
95

Texas Tech University, Viraj Deshmukh, August 2007
96
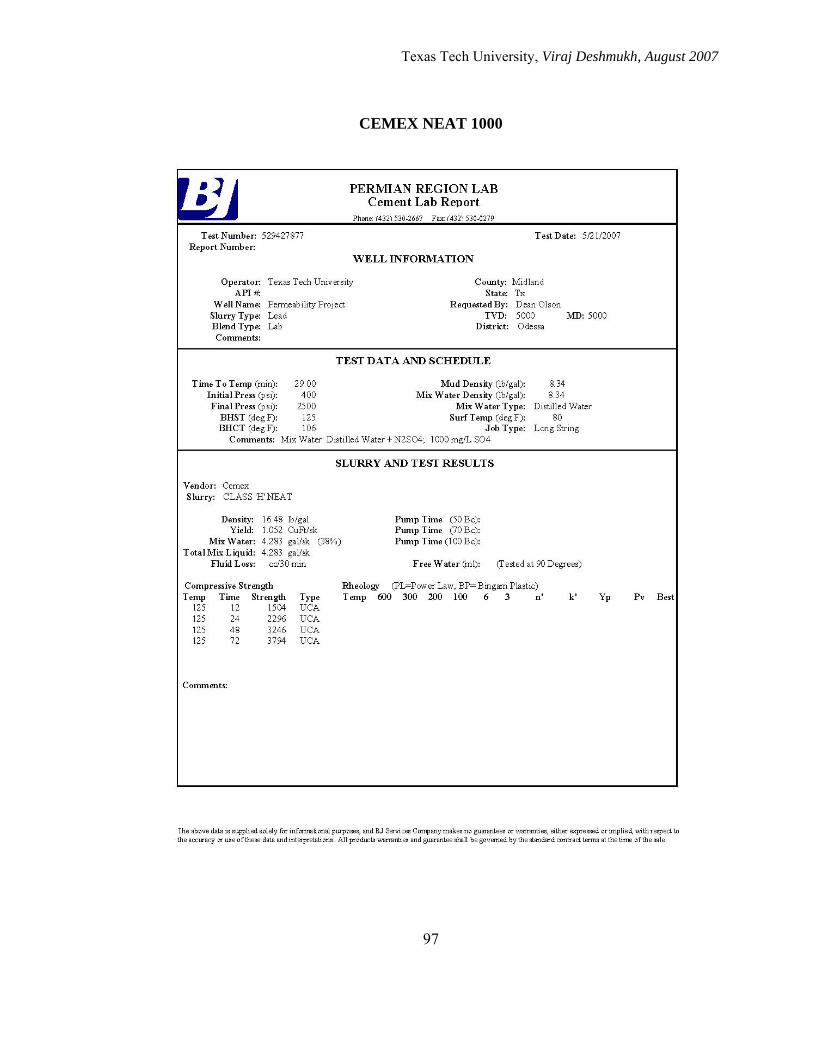
Texas Tech University, Viraj Deshmukh, August 2007
CEMEX NEAT 1000
97

Texas Tech University, Viraj Deshmukh, August 2007
98

Texas Tech University, Viraj Deshmukh, August 2007
LEHIGH NEAT 1000
99

Texas Tech University, Viraj Deshmukh, August 2007
100

Texas Tech University, Viraj Deshmukh, August 2007
CEMEX 50:50:10 1000
101

Texas Tech University, Viraj Deshmukh, August 2007
102

Texas Tech University, Viraj Deshmukh, August 2007
LEHIGH 50:50:10 1000
103

Texas Tech University, Viraj Deshmukh, August 2007
104

Texas Tech University, Viraj Deshmukh, August 2007
CEMEX NEAT 2000
105

Texas Tech University, Viraj Deshmukh, August 2007
106

Texas Tech University, Viraj Deshmukh, August 2007
LEHIGH NEAT 2000
107

Texas Tech University, Viraj Deshmukh, August 2007
108

Texas Tech University, Viraj Deshmukh, August 2007
CEMEX 50:50:10 2000
109

Texas Tech University, Viraj Deshmukh, August 2007
110

Texas Tech University, Viraj Deshmukh, August 2007
LEHIGH 50:50:10 2000
111

Texas Tech University, Viraj Deshmukh, August 2007
112

Texas Tech University, Viraj Deshmukh, August 2007
CEMEX NEAT 4000
113
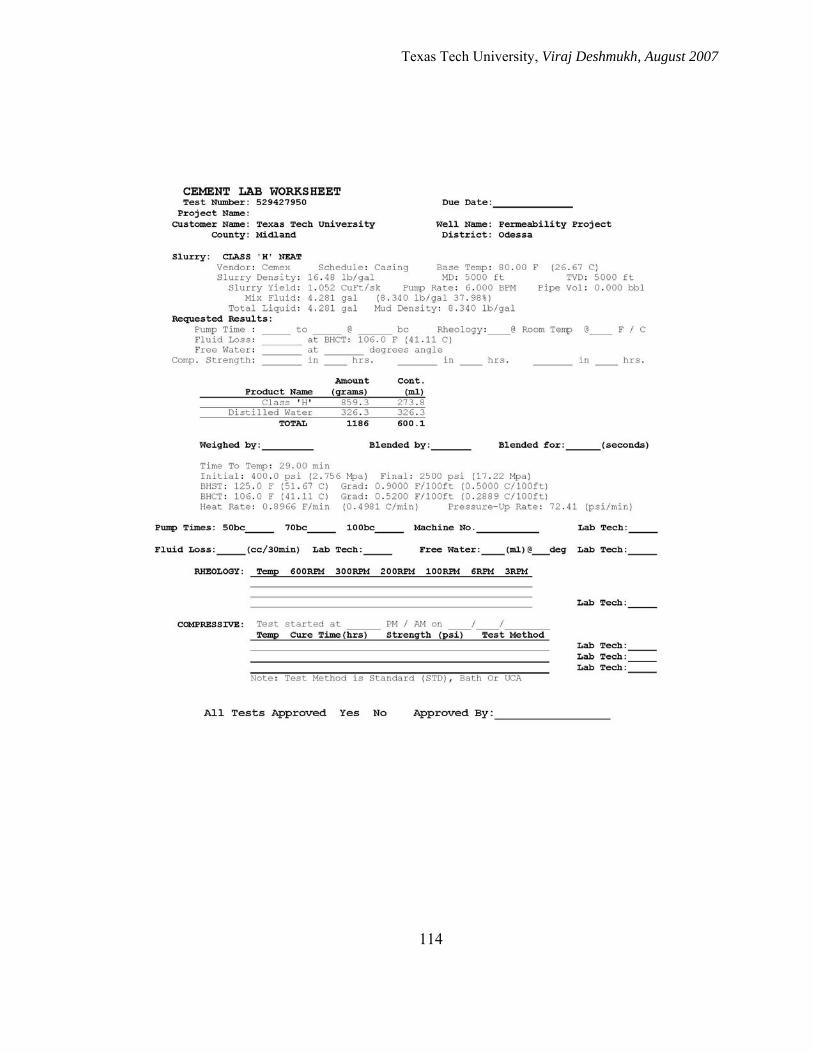
Texas Tech University, Viraj Deshmukh, August 2007
114

Texas Tech University, Viraj Deshmukh, August 2007
LEHIGH NEAT 4000
115

Texas Tech University, Viraj Deshmukh, August 2007
116

Texas Tech University, Viraj Deshmukh, August 2007
CEMEX 50:50:10 4000
117

Texas Tech University, Viraj Deshmukh, August 2007
118

Texas Tech University, Viraj Deshmukh, August 2007
LEHIGH 50:50:10 4000
119

Texas Tech University, Viraj Deshmukh, August 2007
120

PERMISSION TO COPY
In presenting this thesis in partial fulfillment of the requirements for a
master’s degree at Texas Tech University or Texas Tech University Health Sciences
Center, I agree that the Library and my major department shall make it freely available
for research purposes. Permission to copy this thesis for scholarly purposes may be
granted by the Director of the Library or my major professor. It is understood that any
copying or publication of this thesis for financial gain shall not be allowed without my
further written permission and that any user may be liable for copyright infringement.
Agree (Permission is granted.) Viraj Vishwas Deshmukh Student Signature Date 27th July 2007 Disagree (Permission is not granted.) Student Signature Date