in energy management –2021”
TRANSCRIPT
National Award for “Excellence in Energy Management – 2021”
Kirloskar Oil Engines Ltd., Kagal-Kolhapur
Presented by:Mr. NN Kulkarni-Corporate Energy ManagerMr. VM Deshpande-Sr. GM, Maintenance & UtilitiesMr. SP Parab-AGM, Utilities
2
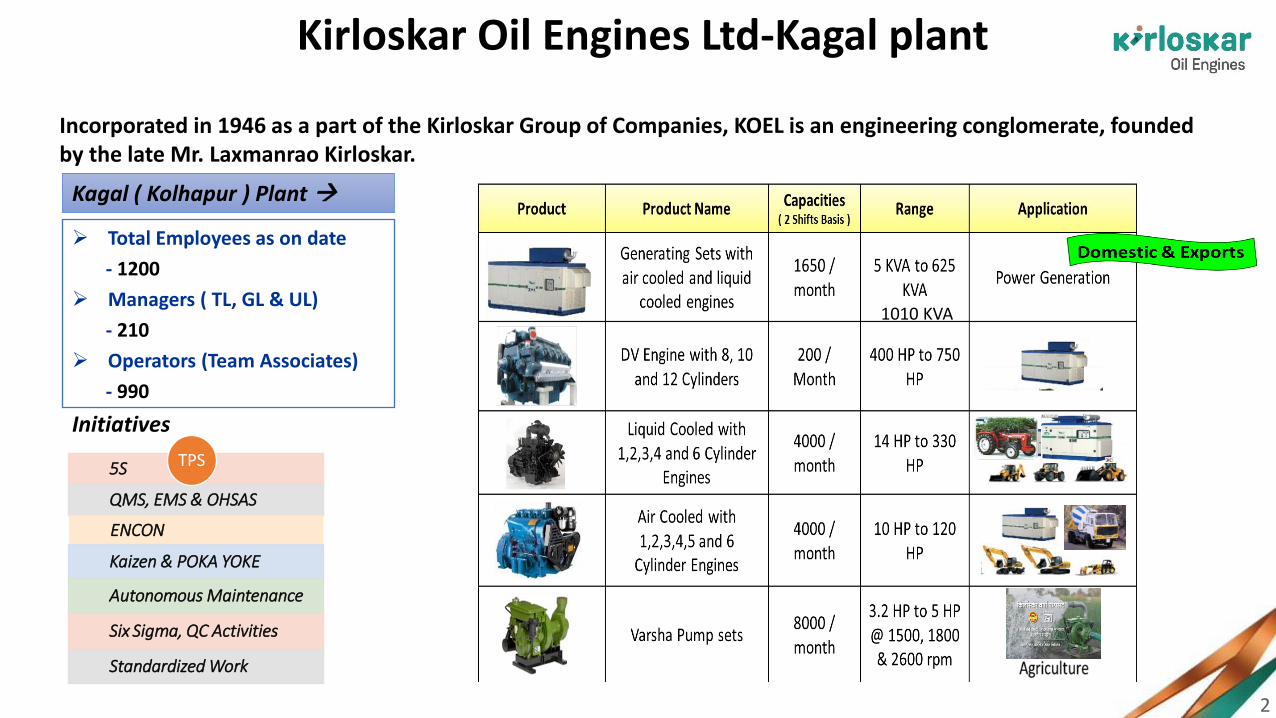
Kirloskar Oil Engines Ltd-Kagal plant
➢ Total Employees as on date
- 1200
➢ Managers ( TL, GL & UL)
- 210
➢ Operators (Team Associates)
- 990
Initiatives
5S
QMS, EMS & OHSAS
ENCON
Kaizen & POKA YOKE
Autonomous Maintenance
Six Sigma, QC Activities
Standardized Work
TPS
Kagal ( Kolhapur ) Plant →
Incorporated in 1946 as a part of the Kirloskar Group of Companies, KOEL is an engineering conglomerate, founded by the late Mr. Laxmanrao Kirloskar.
1010 KVA

3
Content of the Presentation
Company profile
Impact of COVID-19
Specific Energy Consumption (Last 3 years 2018-21)
Information of Competitors, National and Global Benchmarks
Energy Saving Projects implemented in last 3 years
Innovative projects implemented
Utilization of Renewable energy sources
Waste utilization and Management
GHG Inventorisation
Green Supply Chain Management
Team Work, Employee involvement and monitoring
Implementation of ISO 50001, IGBC and Green Co rating
Learning from CII energy award 2020 or any other award
4
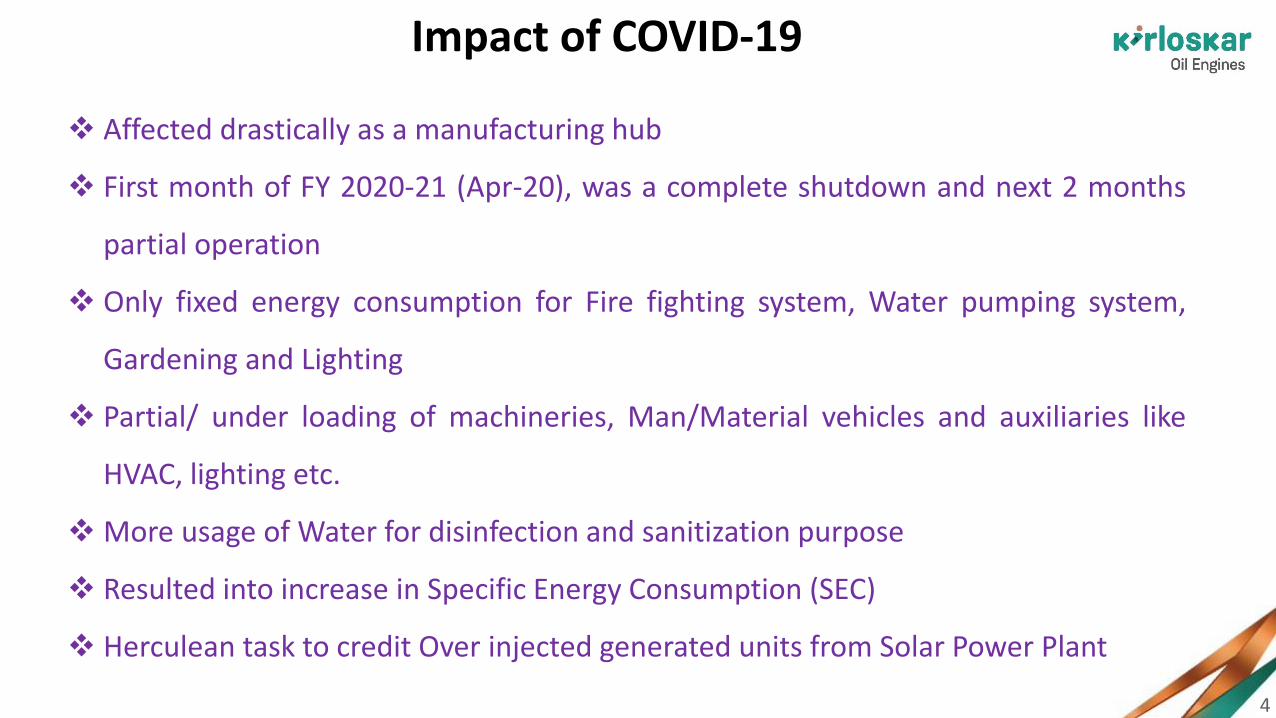
Impact of COVID-19
❖ Affected drastically as a manufacturing hub
❖ First month of FY 2020-21 (Apr-20), was a complete shutdown and next 2 months
partial operation
❖ Only fixed energy consumption for Fire fighting system, Water pumping system,
Gardening and Lighting
❖ Partial/ under loading of machineries, Man/Material vehicles and auxiliaries like
HVAC, lighting etc.
❖More usage of Water for disinfection and sanitization purpose
❖ Resulted into increase in Specific Energy Consumption (SEC)
❖ Herculean task to credit Over injected generated units from Solar Power Plant

5
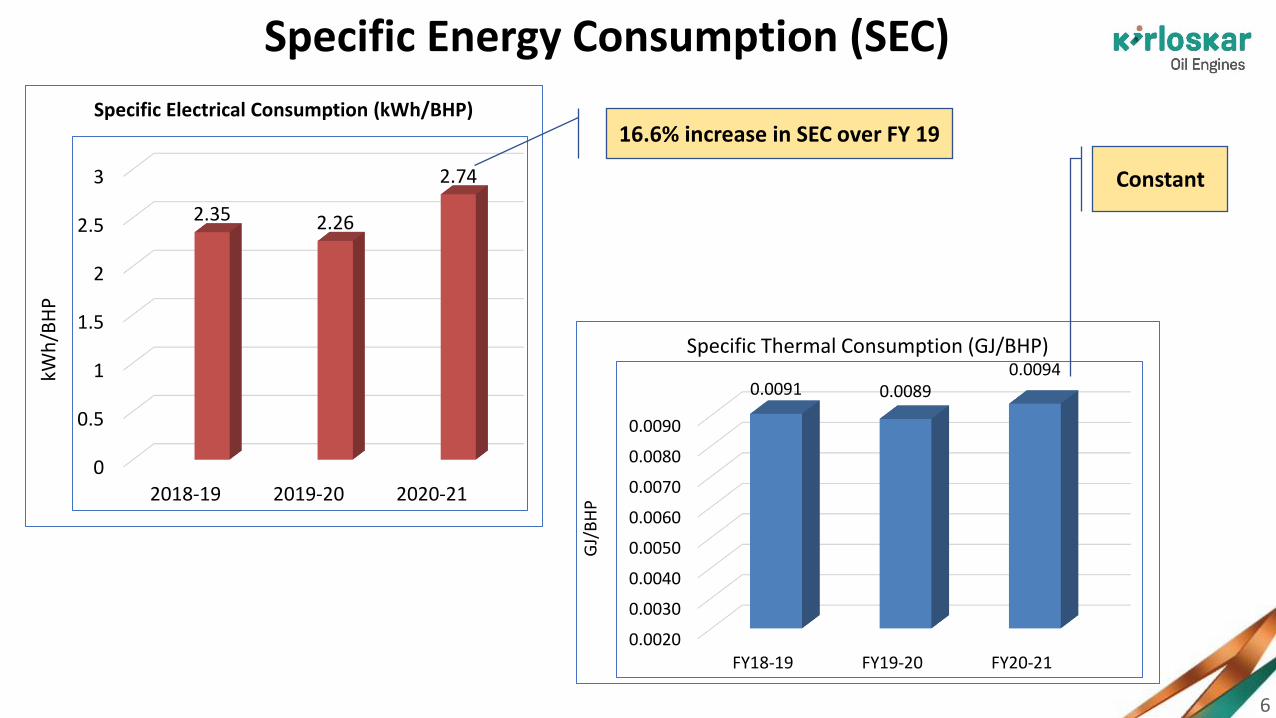
Consumption Vs Production
YearVariable consumption
in kWhProduction in
BHPkWh/BHP
FY18-19 16846287 7172622 2.35
FY19-20 14410478 6365615 2.26
FY20-21 14712926 5372482 2.74
YearThermal
Consumption GJProduction in
BHPGJ/BHP
FY18-19 64920 7172622 0.0091
FY19-20 56570 6365615 0.0089
FY20-21 50405 5372482 0.0094
ELECTRICAL
THERMAL
6
Specific Energy Consumption (SEC)
0
0.5
1
1.5
2
2.5
3
2018-19 2019-20 2020-21
2.35 2.26
2.74
kWh
/BH
P
Specific Electrical Consumption (kWh/BHP)16.6% increase in SEC over FY 19
0.0020
0.0030
0.0040
0.0050
0.0060
0.0070
0.0080
0.0090
FY18-19 FY19-20 FY20-21
0.0091 0.00890.0094
GJ/
BH
P
Specific Thermal Consumption (GJ/BHP)
Constant

7
Reasons for change in Specific Energy Consumption (SEC)
❖ Partial/ under loading of machineries, Man/Material vehicles and auxiliaries like HVAC, lighting
etc. for initial 3 months of FY 2020-21 due to COVID-19 pandemic
❖ Only fixed energy consumption for Fire fighting system, Water pumping system, Gardening and
Lighting for initial 3 months of FY 2020-21 due to COVID-19 pandemic
❖ Individual component loading instead of batch loading due to marketing/peer pressure
❖ Customer demand for prolonged testing of Engine and Genset
❖ Proto type engine assembly and testing
❖ Breakdowns

8
Benchmarking-SEC
0
50
100
150
MNC competitor(80 HP to 280 HP)
Kagal(20 HP to 150 HP)
Energy consumption per engine(ATPP)
11795.9
kWh
/En
gin
e
Energy consumption per engine (ATPP)
0
1
2
3
4
5
KOEL Pune KOEL Kagal(Past best)
Kagal(FY 1920)
Kagal(FY 2021)
Specific energy consumption, kWh/BHP (Internal)
4.01
2.012.26
2.74
kWh
/BH
P
SPECIF IC ENERGY CONSUMPTION, KWH/BHP ( INTERNAL)
0
200
400
600
800
Cummins Caterpillar KOEL, Kagal
Specific energy consumption, kWh/million $ of revenue (International)0 0
713
523
238.7
kWh
/Mn
$
Specific energy consumption, kWh/million $ of revenue (International)
Best at International and National
level

9
Target SEC and Roadmap to achieve SEC
Sr. No
Specific Energy Consumption
Present Status (kWh/BHP) Short term target for specific Energy Consumption reduction
Long term target for specific Energy Consumption reduction
FY 16 FY 17 FY 18 FY 19 FY 20 FY 21 FY 22 FY23
1 Specific Energy Consumption 3.25 2.68 2.462.39
(3% Reduction)
2.32(3% Reduction)
2.20(3%
Reduction)
2.10(5%
Reduction)
2.00(5%
Reduction)
Involvement of People
Initiated
Advanced EMS for Data Analysis
Installed
Data Analysis and prioritization
Initiated
Adoption of new technologies, Implementation of renewable projects
Implementation
ISO 50001 EnMSCertification, GreenCo Up gradation
Initiated
Certified Lead Auditor -EnMS
• Santosh Parab• Nitin Kulkarni

10
List of major ENCON projects planned in FY 2021-22
Name of the projectUnits
saving In lakh kWh
Fuel saving lakh Kcal
Cost saving in Rs. Crs
Investment in Rs.Crs
Replacement of LPG at 11 tank process through waste heat recovery from Engine testing - 19660 0.84 1
Installation of wind turbines 0.5 MW capacity- - 0.7 1
Expansion of 5.5 MW Solar Power plant by another 2.68 MW- - 3 12
Installation of lighpipes in assembly area0.86 - 0.2 32.7
Adoption of 100CFM compressor for low air flow requirement during offs 0.5 - 0.05 0.1
Arresting compressed air leakages2 - 0.2 0.2
11
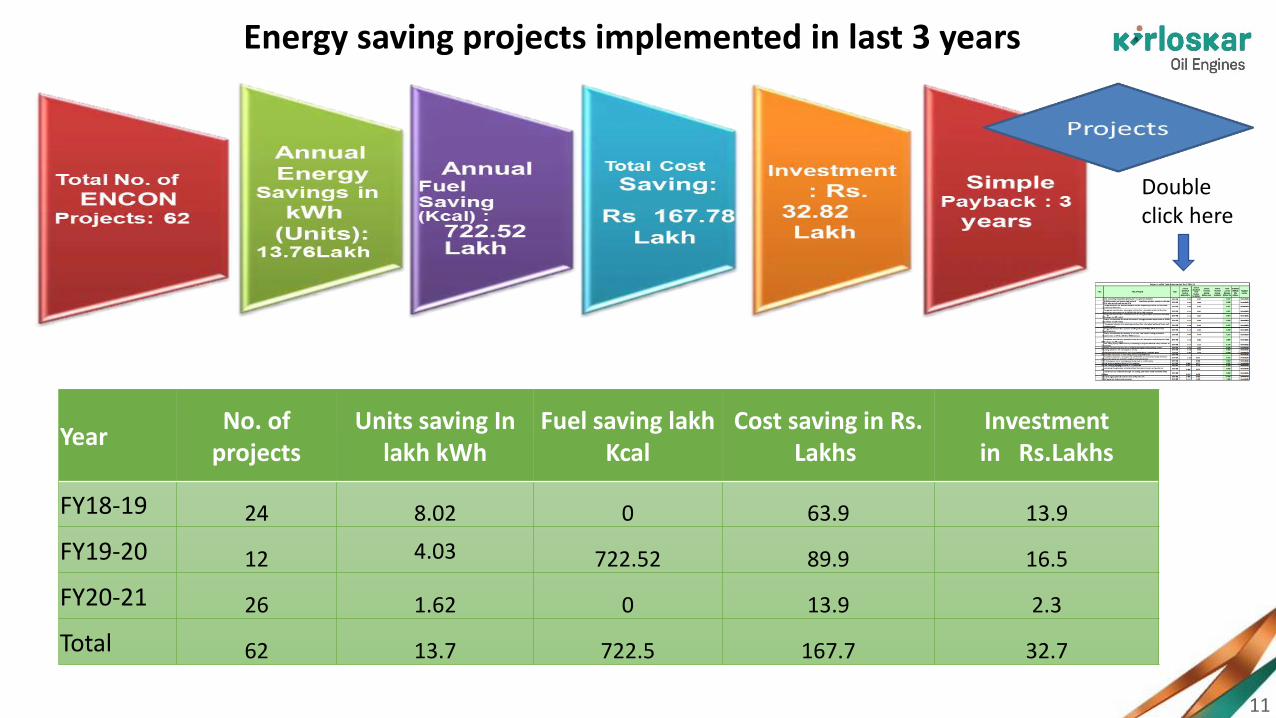
Energy saving projects implemented in last 3 years
Double click here
YearNo. of
projectsUnits saving In
lakh kWhFuel saving lakh
KcalCost saving in Rs.
LakhsInvestment in Rs.Lakhs
FY18-19 24 8.02 0 63.9 13.9
FY19-20 12 4.03 722.52 89.9 16.5
FY20-21 26 1.62 0 13.9 2.3
Total 62 13.7 722.5 167.7 32.7
12
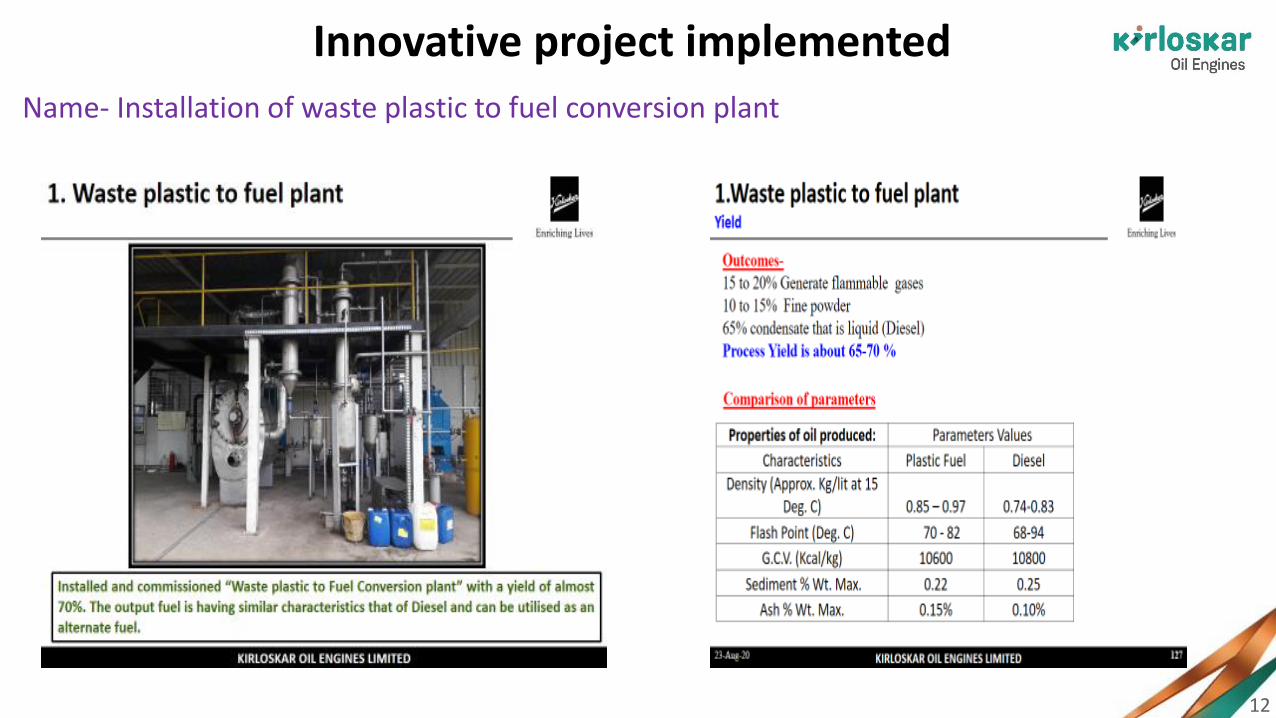
Innovative project implemented
Name- Installation of waste plastic to fuel conversion plant
13
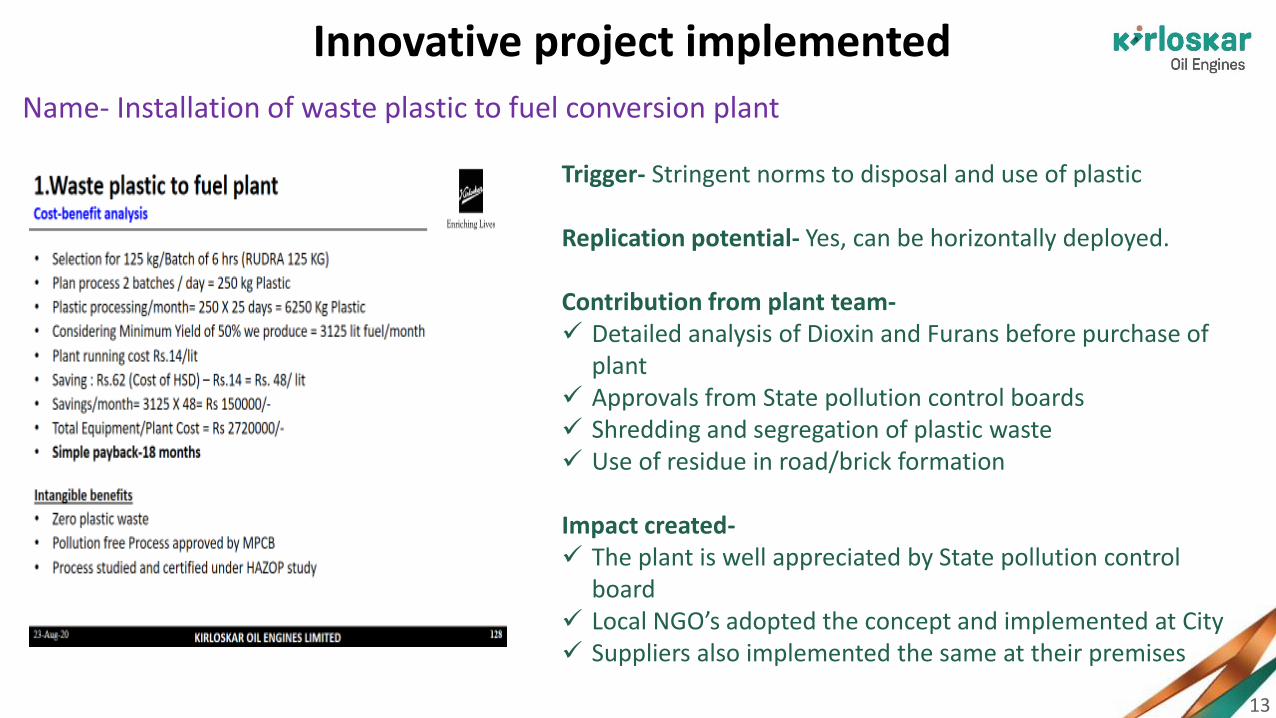
Innovative project implemented
Name- Installation of waste plastic to fuel conversion plant
Trigger- Stringent norms to disposal and use of plastic
Replication potential- Yes, can be horizontally deployed.
Contribution from plant team-✓ Detailed analysis of Dioxin and Furans before purchase of
plant ✓ Approvals from State pollution control boards✓ Shredding and segregation of plastic waste✓ Use of residue in road/brick formation
Impact created-✓ The plant is well appreciated by State pollution control
board✓ Local NGO’s adopted the concept and implemented at City✓ Suppliers also implemented the same at their premises

14
A - Fixed Axis Solar PV – 3.8 MWp
B – Single Axis Tracking Solar PV- 0.45 MWp
C- Roof Top Mounted Solar PV- 1.25 MWp
D- Admin Building Roof Top Mounted Solar PV- 0.082 MWp
E – Solar Parabola Steam Generator – 350 Kg/Day
F – 1 KW Solar Lighting and15 KW Solar Pumping
System
G – Biogas Plant and Biogas Generator– 30 Cum / Day15 KVA Generator
H – Solar Hot water System for Paint Booth – 1500 LPD
LAKE
KUND
Main Plant 2
FGL-588.40
FFL- 588.80
Main Plant 1
FGL-588.40
FFL- 588.80
H
M.S.E.B Plot
A
BC
EF
D D
G
Utilization of Renewable Energy ResourcesOnsite Installations at Kagal premises

15
Utilization of Renewable Energy Resources

16
Roadmap to Maximize share of Renewable Energy

17
Onsite generation –✓ 5.5MWp Captive Solar Power Plant✓ Biogas Plant and Biogas Generator, capacity 30 Cum / Day and with 15KVA generator✓ Solar Hot water System for Paint Booth, capacity 1500 LPD✓ Solar Parabola Steam Generator, capacity 350 Kg/Day✓ 1 KW Solar Lighting and✓ 15 KW Solar Pumping System✓ Upcoming 2.68MWp Captive Solar Power Plant
Investment made, capacity addition and power generation in last three years ( FY 2018-21) –
100% of above capacity is used at Kagal plant
Utilization of Renewable Energy Resources
Year Capacity addition, MW Investment made, Rs.Crs.
2018-19 5.5 232019-20 0.016 12020-21 2.68 122021-22 0.5 1
18
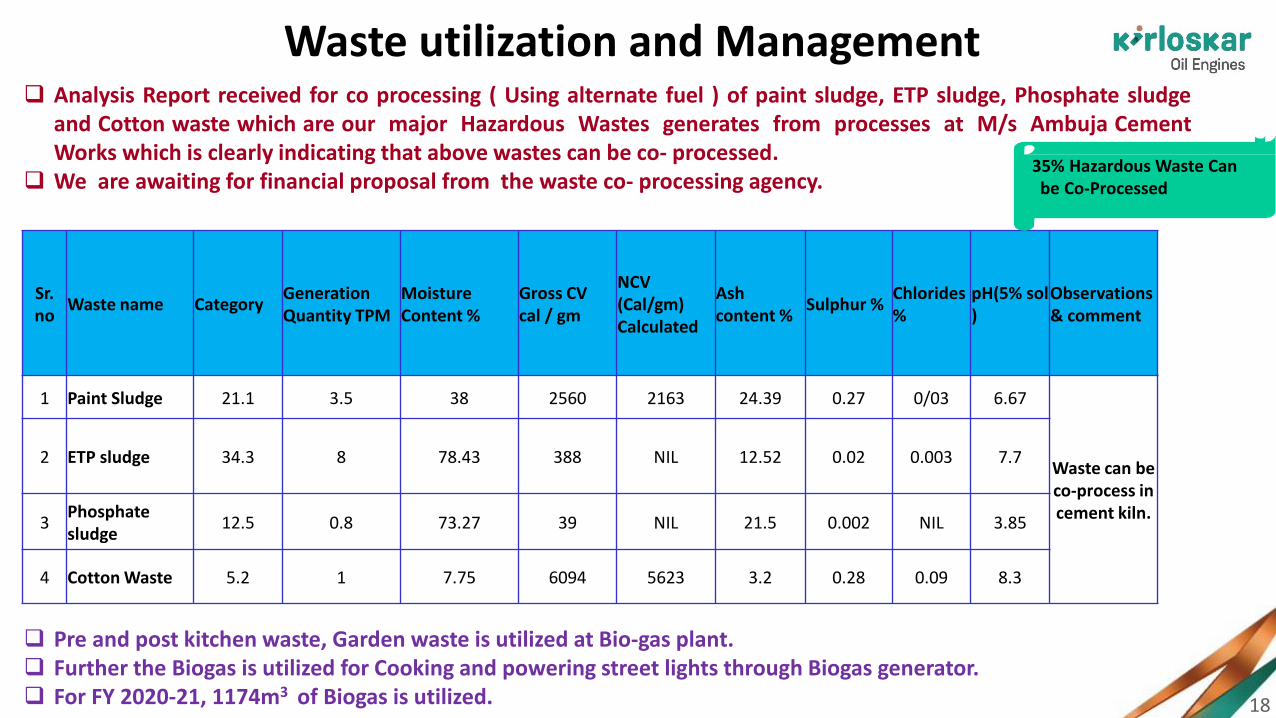
Waste utilization and Management❑ Analysis Report received for co processing ( Using alternate fuel ) of paint sludge, ETP sludge, Phosphate sludge
and Cotton waste which are our major Hazardous Wastes generates from processes at M/s Ambuja CementWorks which is clearly indicating that above wastes can be co- processed.
❑ We are awaiting for financial proposal from the waste co- processing agency.
Sr. no
Waste name CategoryGeneration Quantity TPM
Moisture Content %
Gross CV cal / gm
NCV (Cal/gm) Calculated
Ash content %
Sulphur %Chlorides%
pH(5% sol )
Observations & comment
1 Paint Sludge 21.1 3.5 38 2560 2163 24.39 0.27 0/03 6.67
Waste can be co-process in cement kiln.
2 ETP sludge 34.3 8 78.43 388 NIL 12.52 0.02 0.003 7.7
3Phosphate sludge
12.5 0.8 73.27 39 NIL 21.5 0.002 NIL 3.85
4 Cotton Waste 5.2 1 7.75 6094 5623 3.2 0.28 0.09 8.3
35% Hazardous Waste Canbe Co-Processed
❑ Pre and post kitchen waste, Garden waste is utilized at Bio-gas plant.❑ Further the Biogas is utilized for Cooking and powering street lights through Biogas generator.❑ For FY 2020-21, 1174m3 of Biogas is utilized.
19
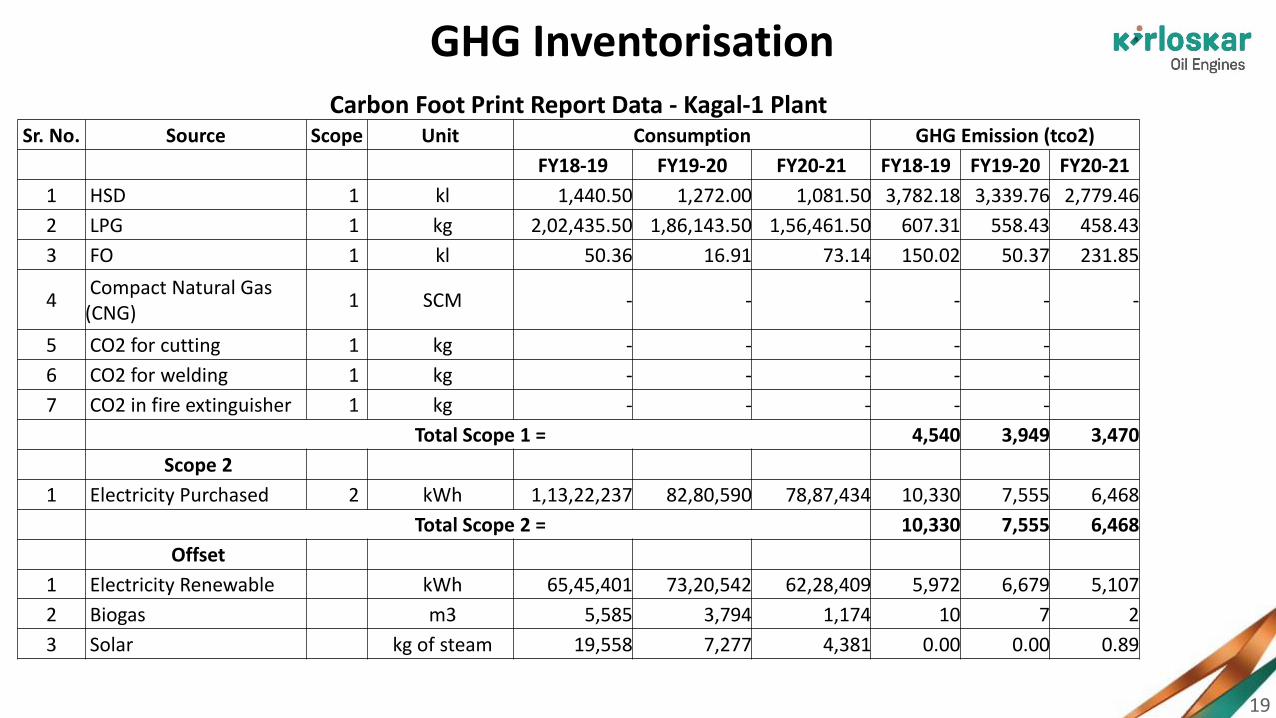
GHG InventorisationCarbon Foot Print Report Data - Kagal-1 Plant
Sr. No. Source Scope Unit Consumption GHG Emission (tco2)
FY18-19 FY19-20 FY20-21 FY18-19 FY19-20 FY20-21
1 HSD 1 kl 1,440.50 1,272.00 1,081.50 3,782.18 3,339.76 2,779.46
2 LPG 1 kg 2,02,435.50 1,86,143.50 1,56,461.50 607.31 558.43 458.43
3 FO 1 kl 50.36 16.91 73.14 150.02 50.37 231.85
4Compact Natural Gas (CNG)
1 SCM - - - - - -
5 CO2 for cutting 1 kg - - - - -
6 CO2 for welding 1 kg - - - - -
7 CO2 in fire extinguisher 1 kg - - - - -
Total Scope 1 = 4,540 3,949 3,470
Scope 2
1 Electricity Purchased 2 kWh 1,13,22,237 82,80,590 78,87,434 10,330 7,555 6,468
Total Scope 2 = 10,330 7,555 6,468
Offset
1 Electricity Renewable kWh 65,45,401 73,20,542 62,28,409 5,972 6,679 5,107
2 Biogas m3 5,585 3,794 1,174 10 7 2
3 Solar kg of steam 19,558 7,277 4,381 0.00 0.00 0.89
20
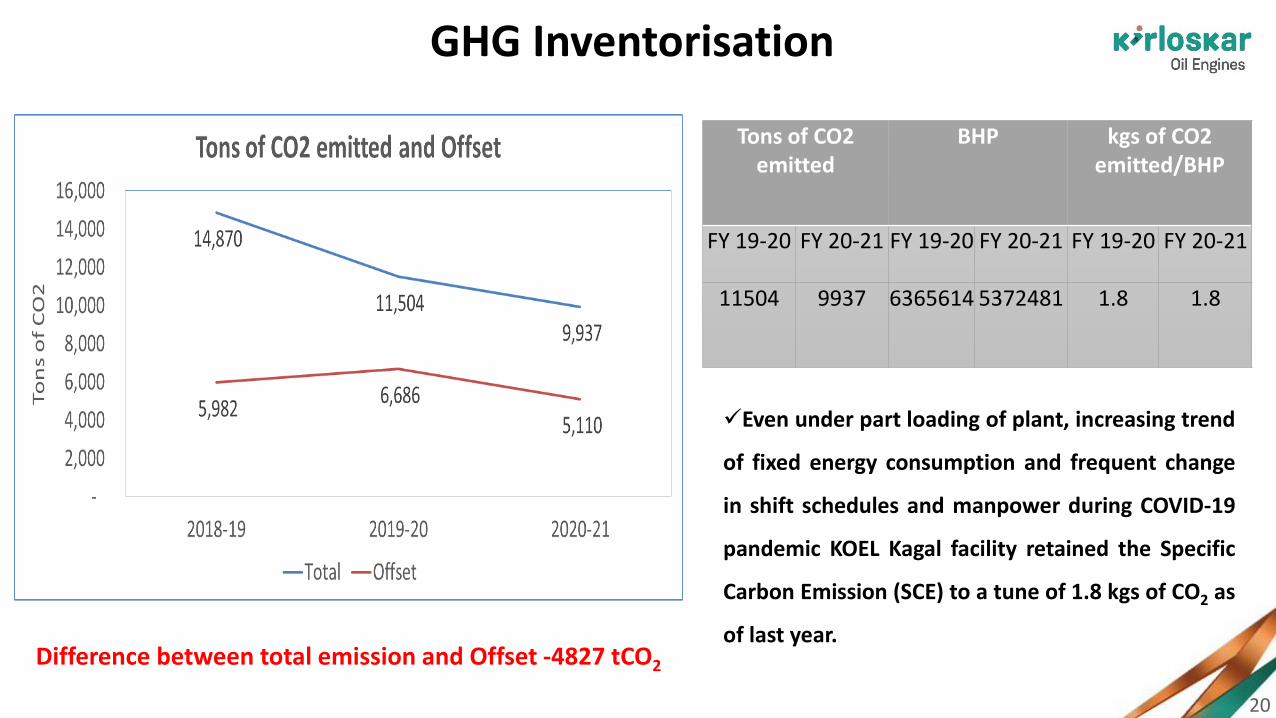
GHG Inventorisation
Tons of CO2 emitted
BHP kgs of CO2 emitted/BHP
FY 19-20 FY 20-21 FY 19-20 FY 20-21 FY 19-20 FY 20-21
11504 9937 6365614 5372481 1.8 1.8
✓Even under part loading of plant, increasing trend
of fixed energy consumption and frequent change
in shift schedules and manpower during COVID-19
pandemic KOEL Kagal facility retained the Specific
Carbon Emission (SCE) to a tune of 1.8 kgs of CO2 as
of last year.Difference between total emission and Offset -4827 tCO2

21
Roadmap – Carbon NeutralityKOEL, Kagal certified as “Carbon Neutral” for FY 2018-19 and in process for FY 2019-20.KOEL Planned to become “Net zero Carbon emission” and roadmap has been laid as below-

22
Green supply chain managementSupply Chain Policy Activities at Supplier End
580600620640
Before After
63
5
61
0
K K Foundry
Furnace Energy Units / ton
0
5
Before After
1
2.5
Jadhav Industry
Saving in Rs. Lac
1200
1300
1400
Before After
13
50
12
50
Sound Casting
Plant Units…
23
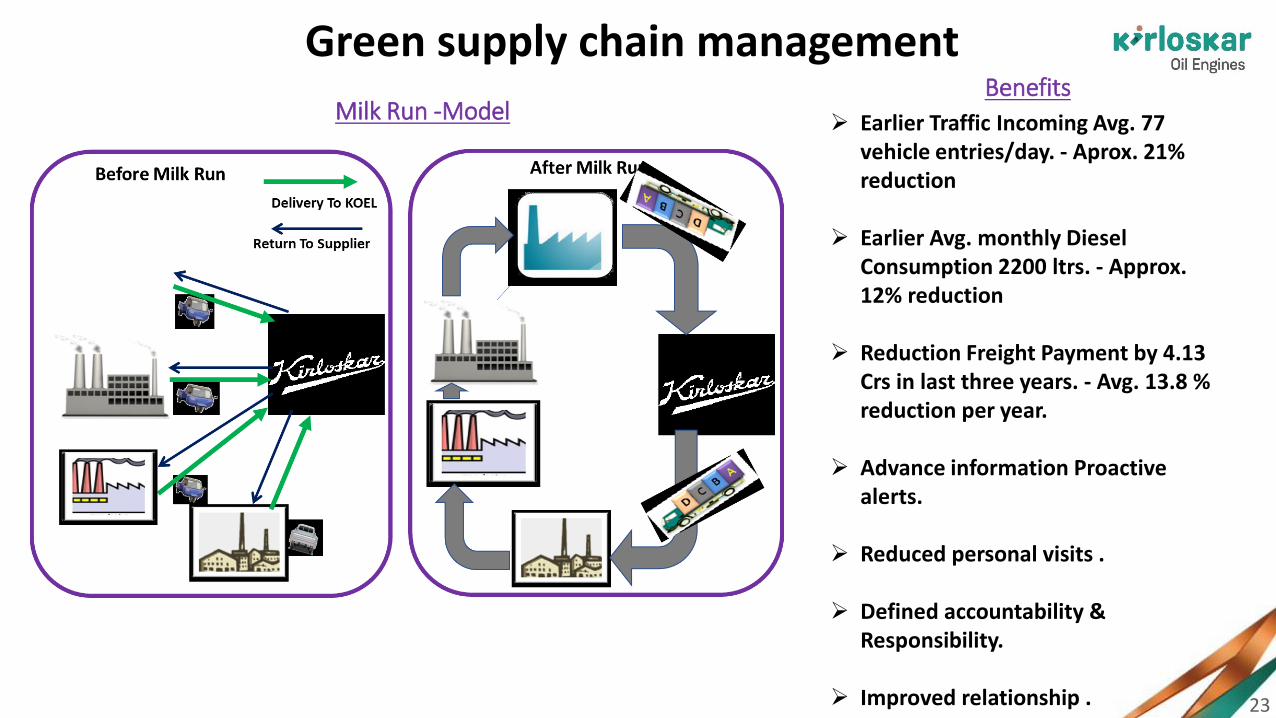
Green supply chain managementBenefits
➢ Earlier Traffic Incoming Avg. 77 vehicle entries/day. - Aprox. 21% reduction
➢ Earlier Avg. monthly Diesel Consumption 2200 ltrs. - Approx. 12% reduction
➢ Reduction Freight Payment by 4.13 Crs in last three years. - Avg. 13.8 % reduction per year.
➢ Advance information Proactive alerts.
➢ Reduced personal visits .
➢ Defined accountability & Responsibility.
➢ Improved relationship .
Milk Run -Model

24
Teamwork, Employee involvement and monitoring
25
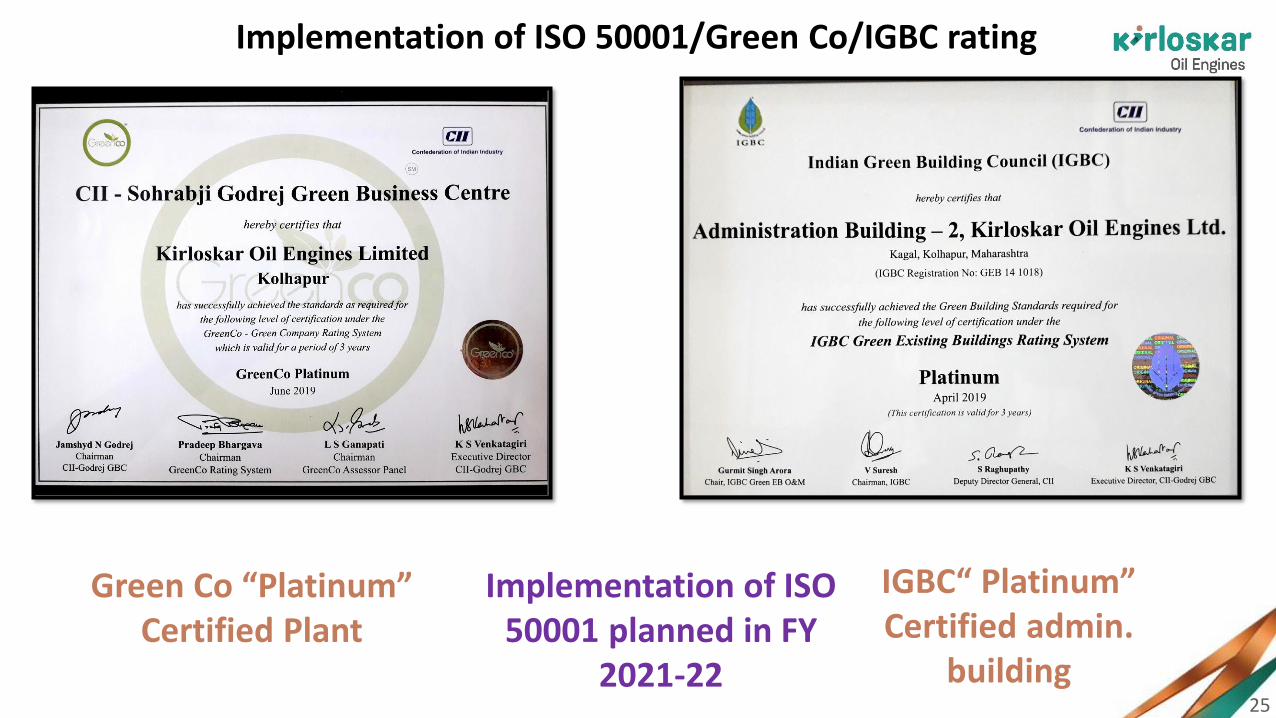
Implementation of ISO 50001/Green Co/IGBC rating
Green Co “Platinum” Certified Plant
IGBC“ Platinum” Certified admin.
building
Implementation of ISO 50001 planned in FY
2021-22

26
Learning from CII Energy Award 2020 or any other award program
▪ Adoption of new energy efficient technologies-✓Vaayu✓Axial blowers and fans✓Heat pump✓Solar Light pipe✓Optimization in TAKT time
▪ Horizontal deployment of best practices
▪ Green CO and IGBC certification
▪ National and International benchmarks
▪ SWOT analysis of Organization
27
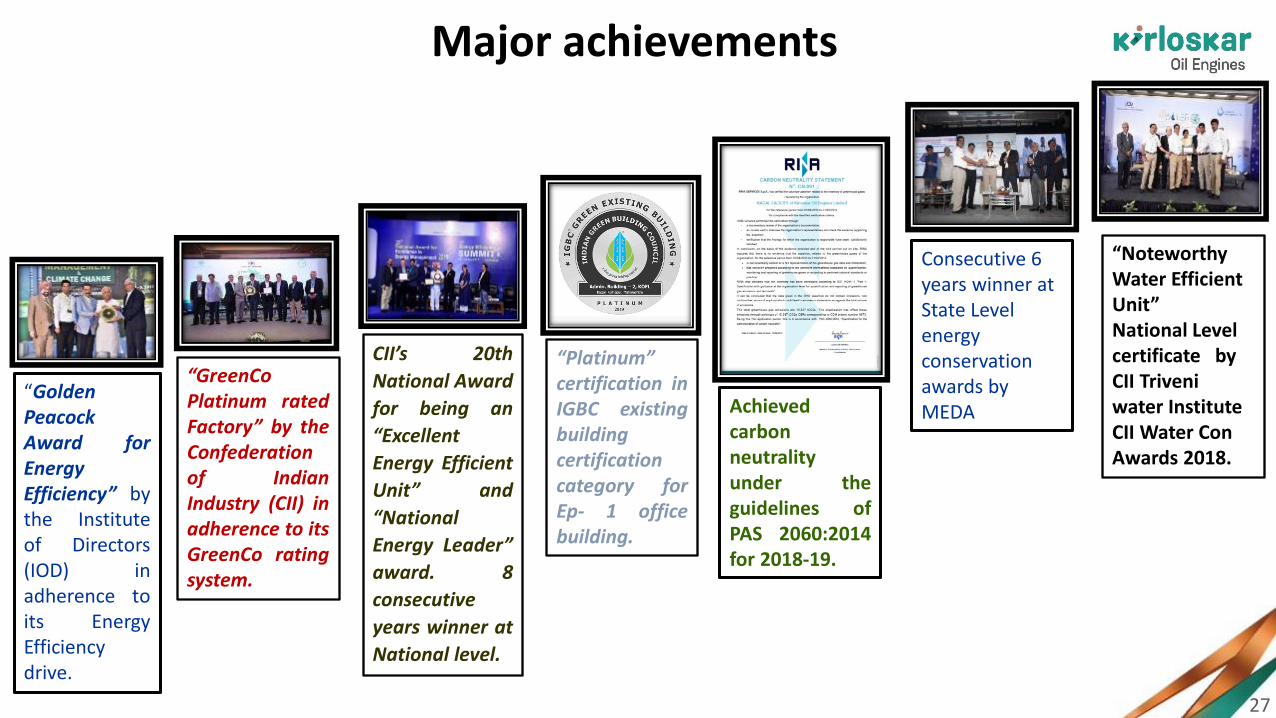
Major achievements
“GoldenPeacockAward forEnergyEfficiency” bythe Instituteof Directors(IOD) inadherence toits EnergyEfficiencydrive.
“GreenCoPlatinum ratedFactory” by theConfederationof IndianIndustry (CII) inadherence to itsGreenCo ratingsystem.
CII’s 20th
National Award
for being an
“Excellent
Energy Efficient
Unit” and
“National
Energy Leader”
award. 8
consecutive
years winner at
National level.
“Platinum”certification inIGBC existingbuildingcertificationcategory forEp- 1 officebuilding.
Achievedcarbonneutralityunder theguidelines ofPAS 2060:2014for 2018-19.
“Noteworthy Water Efficient Unit” National Level certificate by CII Triveniwater Institute CII Water Con Awards 2018.
Consecutive 6 years winner at State Level energy conservation awards by MEDA

28
Thank You
• Presented by:
• Mr. NN Kulkarni-Corporate Energy Manager
• Mr. VM Deshpande-Sr. GM, Maintenance & Utilities
• Mr. SP Parab-AGM, Utilities
https://koel.kirloskar.com