in depth ib draft 04 30 13 - utah legislaturele.utah.gov/interim/2013/pdf/00001946.pdf · by...
TRANSCRIPT

UTAH STATE LEGISLATURE 2013 INTERIM
OFFICE OF THE LEGISLATIVE FISCAL ANALYST i MAY 9, 2013, 10:15 AM
LFA LEGISLATIVE FISCAL ANALYST
FIVE YEAR PROJECTIONS
EXECUTIVEAPPROPRIATIONSCOMMITTEESTAFF:THOMASYOUNG,PH.D.,ANDREAWILKO,PH.D.,ANGELAJ.OH,&STEVENALLRED I S SUE BR I E F
EXECUTIVESUMMARY
Thisstudypresentsafiveyearoutlookofcashinflow,cashoutflow,financialobligations,anddebtservicecommitmentsoftheStateofUtahbaseduponamethodologyproposedbytheGovernmentalAccountingStandardsBoard(GASB).Itisintendedtoprovidelegislatorswithusefulinformationtomakelongtermrevenueandexpendituredecisions,whilesimultaneouslytestingtoseeifGASB’sguidelinesarepracticable.ThestudyconcludesthattheGeneralandEducationFundsareonsustainabletrajectoriesandthatUtahisontargettomeetlong‐termfinancialobligationslikedebtserviceandretirement.Itfindsthatprojectedtransportationoutlaylevelsarenotsustainableoverthefiveyearperiodgivenassociatedincomeprojections.Thestudynotesthatthesinglelargestcomponentofcashinflow–federalgrantsandaid–iscurrentlyatriskduetofederaldeficitreduction.Finally,thestudycomparesGASB’sproposedmethodologytoobservedexperienceinFY2013andrecommendsusingtheGASBmethodologyonlywhendonesoinconjunctionwithUtah’sexistingconsensusprocesses.
Fund Type / Area
Education Fund General Fund Transportation
Budget Position
Cash Inflow
Cash Outflow
Budget Position
Cash Inflow
Cash Outflow
Budget Position
Cash Inflow
Cash Outflow
-10B
0B
10B
20B
30B
40B
50B
Am
ount 1
7,8
57
,85
6,0
00
18
,47
7,7
53
,00
0
61
9,8
97
,00
0
36
,98
6,4
70
,00
0
37
,32
6,4
16
,00
0
33
9,9
46
,00
0
15
,97
7,5
93
,00
0
11
,07
0,0
61
,00
0
-4,9
07
,53
2,0
00
Five Year Budget Position ProjectionFY 13 - FY 17
Area
Budget Position
Cash Inflow
Cash Outflow
Source: LFA

MAY 9, 2013, 10:15 AM ii OFFICE OF THE LEGISLATIVE FISCAL ANALYST
I N ‐DE P T H BUDG E T R E V I EW
Theprojectionscontainedinthisstudyarebaseduponhistoricalexperienceadjustedforknownfactors,suchasearmarkadjustmentsortaxpolicychanges.Onthecashinflowsideofthebalancesheet,best‐fitmodelsfor14broadrevenuesourcecategoriesdepositedintofivefundswereforecast.Thecashoutflowportionincludedbest‐fitprojectionsforninebroadexpenditurecategories.Themajorcashoutflowareasincludepubliceducation,humanservices,healthandenvironmentalquality,highereducation,andallothergovernmentalexpenditures.HistoricaltrendmodelsindicatethatcashinflowassociatedwiththeGeneralFundandEducationFundwillbemorethanenoughtocoveranticipatedcashoutflow,withanestimatedGeneralFundbudgetpositionattheendofFY2017of+$340.0millionon$37.0billionincashoutflowandanestimatedEducationFundbudgetpositionattheendofFY2017of+$620.0millionon$17.9billionincashoutflow.Theoppositeholdstruefortransportationrelatedexpenditures,withthecumulativeprojectedshortfallfromFY2012toFY2017of$4.9billiononprojectedcumulativecashoutflowof$16.0billion.Thismayberelatedtohigherlevelsofdebtfinancedinvestmentoverthepastfiveyears.ArecentredefinitionoftheTransportationInvestmentFundasacapitalprojectfundmaychangethetreatmentoftransportationexpendituresunderGASBproposedguidelines.Ifcurrenttrendsandlegislativepracticeshold,UtahshouldalsobeontracktopayourconstitutionallyrequireddebtobligationsandotherfinancialobligationssuchasretirementandOtherPost‐EmploymentBenefits(OPEB).Utah’sConstitutionrequiresrepaymentofbondedindebtednessasafirstpriority.TheLegislaturehasreflectedthisinitsbudgetrulesandfullyfundsdebtserviceasapractice.LegislatorsconsistentlycommittomeetingretirementandOPEBobligationsbyfullyfundingannualrequiredcontributionsandpayrollrates.Further,theLegislatureisregularlyreformingretirementandOPEBbenefitplanstoreducefutureobligations.UnderGASB’spreliminaryview,statesmustalsoexamineandcommentonanyfinancialinterdependencies.Federalcontracts,grantsandaidareUtah’ssinglelargestcashinflowdefinedinthisstudy.Thiscashinflowisatrisknotonlyduetoknownpolicieslikesequestrationandthedebtceilings,butwilldiminishasthefederalgovernmentreducesitsdeficitinthelongrun.ThisreportrecognizesanddisclosestheriskassociatedwithfederalinterdependencyinComponent5.GASB’sproposedguidelineslimittheinputstoaprojectionmodel.Bydesign,theGASBmethodologydoesnotallowforchangingeconomicindicatorsnordoesitreflectpolicymakerdiscretion.Thus,theresultsofthismethodologywilldifferfromthoseofUtah’sexistingconsensusforecastandbudgetingprocesses.ComparingourinterpretationoftheGASBguidelinestoactualresultsfromtheFY2013GeneralSessionshowstheGASBmodeltoslightlyunder‐estimatecashinflowandslightlyover‐estimatecashoutflow.Assuch,thisreportrecommendsusingGASB’smethodologyonlywhendonesoinconcertwithUtah’sestablishedprocessessothatthedifferencescanbefullyknown,understood,andexplained.

OFFICE OF THE LEGISLATIVE FISCAL ANALYST iii MAY 9, 2013, 10:15 AM
I N ‐DE P T H BUDG E T R E V I EW
TableofContents
EXECUTIVESUMMARY................................................................................................................................................I
INTRODUCTION.........................................................................................................................................................1
RECOMMENDATIONS.................................................................................................................................................1
BACKGROUND............................................................................................................................................................1
GOVERNMENTALACCOUNTINGSTANDARDSBOARD(GASB)................................................................................2
COMPONENTSOFFISCALSUSTAINABILITY...............................................................................................................2
PURPOSEOFGASBPROPOSEDGUIDELINES............................................................................................................2
DEFINITIONS.............................................................................................................................................................3
GASB’SPROPOSEDMETHODOLOGYFORFINANCIALPROJECTION.........................................................................3
METHODOLOGY.........................................................................................................................................................4
COMPONENT1:PROJECTIONSOFCASHINFLOWS....................................................................................................4
GENERALFUNDCASHINFLOW................................................................................................................................................................7 GENERALFUNDKNOWNCAUSESOFFLUCTUATION........................................................................................................................7
GENERALFUNDRESTRICTEDCASHINFLOW......................................................................................................................................10 GENERALFUNDRESTRICTEDKNOWNCAUSESOFFLUCTUATIONS............................................................................................10
EDUCATIONFUNDCASHINFLOW.........................................................................................................................................................11 EDUCATIONFUNDKNOWNCAUSESOFFLUCTUATIONS...............................................................................................................11
TRANSPORTATIONFUNDCASHINFLOW.............................................................................................................................................14 TRANSPORTATIONFUNDKNOWNCAUSESOFFLUCTUATIONS...................................................................................................14
TRANSPORTATIONINVESTMENTFUNDCASHINFLOW.....................................................................................................................17 TRANSPORTATIONINVESTMENTFUNDKNOWNCAUSESOFFLUCTUATIONS...........................................................................17
ALCOHOLICBEVERAGECONTROL’SENTERPRISEFUNDCASHINFLOW..........................................................................................19 DABCKNOWNCAUSESOFFLUCTUATIONS...................................................................................................................................19
COMPONENT2:PROJECTIONSOFMAJORAREACASHOUTFLOWS......................................................................20
GENERALFUNDCASHOUTFLOW.........................................................................................................................................................20
HUMANSERVICESCASHOUTFLOW......................................................................................................................................................21 HUMANSERVICESKNOWNCAUSESOFFLUCTUATIONS...............................................................................................................22
HEALTHANDENVIRONMENTALQUALITYCASHOUTFLOW.............................................................................................................24 HEALTHANDENVIRONMENTALQUALITYKNOWNCAUSESOFFLUCTUATIONS.......................................................................24
HIGHEREDUCATIONCASHOUTFLOW.................................................................................................................................................26 HIGHEREDUCATIONKNOWNCAUSESOFFLUCTUATIONS...........................................................................................................26
PUBLICEDUCATIONCASHOUTFLOW..................................................................................................................................................28 PUBLICEDUCATIONKNOWNCAUSESOFFLUCTUATIONS............................................................................................................28
TRANSPORTATIONCASHOUTFLOW.....................................................................................................................................................30 TRANSPORTATIONKNOWNCAUSESOFFLUCTUATIONS..............................................................................................................30
DEPARTMENTOFALCOHOLICBEVERAGECONTROLCASHOUTFLOW............................................................................................33
ALLOTHERGOVERNMENTCASHOUTFLOW.......................................................................................................................................34

MAY 9, 2013, 10:15 AM iv OFFICE OF THE LEGISLATIVE FISCAL ANALYST
I N ‐DE P T H BUDG E T R E V I EW
GASBMODELSVERSUSCURRENTPROJECTIONSOFREVENUE...........................................................................35
GENERALFUNDREVENUE.....................................................................................................................................................................35
EDUCATIONFUNDREVENUE.................................................................................................................................................................36
TRANSPORTATIONFUNDREVENUE.....................................................................................................................................................39
TRANSPORTATIONINVESTMENTFUNDREVENUE.............................................................................................................................41
DABCREVENUE.....................................................................................................................................................................................43
GASBMODELSVERSUSCURRENTPROJECTIONSOFEXPENDITURES..................................................................45
HUMANSERVICESEXPENDITURES.......................................................................................................................................................45
HEALTHANDENVIRONMENTALQUALITYEXPENDITURES...............................................................................................................48
HIGHEREDUCATIONEXPENDITURES...................................................................................................................................................50
PUBLICEDUCATIONEXPENDITURES....................................................................................................................................................52
TRANSPORTATIONEXPENDITURES.......................................................................................................................................................54
TRANSPORTATIONINVESTMENTEXPENDITURES..............................................................................................................................56
DABCEXPENDITURES...........................................................................................................................................................................58
ALLOTHERGOVERNMENTALEXPENDITURES....................................................................................................................................60
COMPONENT3:TOTALFINANCIALOBLIGATIONS................................................................................................62
COMPONENT4:DEBTSERVICE.............................................................................................................................65
COMPONENT5:GOVERNMENTALINTERDEPENDENCE.........................................................................................67
ECONOMICANDDEMOGRAPHICFACTORSIMPACTINGFUTURESTATERESOURCES...........................................71
CAUTIONARYNOTICEPROPOSEDBYGASB.........................................................................................................72
DATACOLLECTION.................................................................................................................................................73
FORECASTINGISSUES.............................................................................................................................................77
CONCLUSION...........................................................................................................................................................78

OFFICE OF THE LEGISLATIVE FISCAL ANALYST 1 MAY 9, 2013, 10:15 AM
I N ‐DE P T H BUDG E T R E V I EW
INTRODUCTION
Thefive‐yearbudgetprojectionthatfollowsservesatwofoldpurpose:
1) TotesttheviabilityofGASB’sproposalonEconomicConditionReporting:FinancialProjections;and
2) ToassesstheeconomicsustainabilityofUtah’scurrentrevenueandexpendituretrends.
Toaccomplishthesetwoobjectives,weusedbest‐fitmodelsappliedonlytohistoricalexperienceandknownfactorstoprojectthetrendinrevenuesandexpenditures.ThemodelingemployedeitherStatisticalAnalysisSoftware(SAS)orForecastProanalysissoftware.DuetothelimitationsimposedbytheproposedGASBmethodology,weexcludedprojectedeconomicindicatorsfromtheanalysis.
Thetrendapproachledtothefollowingconclusions:
1) OverthecomingfiveyearsUtahisonasustainabletrajectorywhencomparingthetrendrevenuesagainstthetrendexpendituresforallexpenditurestypesexcepttransportation;
2) UtahisalsoonasustainabletrajectorywithrespecttodebtpaymentandotherfinancialobligationsincludingretirementandOPEBaslongascurrenttrendscontinue;and
3) Onlyusingtrenddatacreatessomesignificantshortcomingsintheforecastresults.Inparticular,thepoliticalwilloftheoversightbodyisnottakenintoconsideration.Additionally,theoveralleconomicwellbeingoftheStateanddiversificationoftheState’seconomyarenotconsideredundertheproposedGASBmethodology.
RECOMMENDATIONS
PresumingtheStateisrequiredtouseGASB’sproposedmethodology,werecommendthatitbeusedincombinationwiththeState’sconsensusrevenueprocessinordertoassessthelimitationsofone‐factortrendmodelingandtoaddresspotentialconcernsinthebudgetingprocess.
Wealsorecommendallowingsufficientleadtimetoproduceareport.Datafortheyear‐endisusuallynotavailableuntillateSeptember.IncludingthedataintheState’sComprehensiveAnnualFinancialReport(CAFR)coulddelaythepublicationofthereport.
BACKGROUND
JointRule3‐2‐502statesthat,“eachyear,theExecutiveAppropriationsCommitteeshallselectastateagency,institution,orprogramtobethesubjectofanin‐depthbudgetreview.”BecauseUtahisknownforearlyadoptionofgoodfinancialpractices,duringtheMay15,2012ExecutiveAppropriationsCommitteemeeting,theLegislativeFiscalAnalyst(LFA)recommendedafive‐yearfiscalsustainabilityreviewtohelplegislatorsassessUtah’seconomiccondition.
Thisin‐depthbudgetreviewismeanttoprovidelegislatorswithusefulinformationinplanninglongtermrevenueandexpendituredecisions,whilesimultaneouslytestingtoseeifGASB’sguidelinesarepracticable.Thein‐depthbudgetreviewprimarilyfocusesontheGeneral,Education,Transportation,andTransportationInvestmentfunds.
BecauseofitsimpactontheGeneralFund,theDepartmentofAlcoholicBeverageControl’sEnterpriseFundhasalsobeenincludedintheanalysis.

MAY 9, 2013, 10:15 AM 2 OFFICE OF THE LEGISLATIVE FISCAL ANALYST
I N ‐DE P T H BUDG E T R E V I EW
GOVERNMENTALACCOUNTINGSTANDARDSBOARD(GASB)
TheGovernmentalAccountingStandardsBoard(GASB)isanindependentorganizationthatestablishesandimprovesstandardsofaccountingandfinancialreportingforstateandlocalgovernmentsintheUnitedStates.GASBwasestablishedin1984byagreementoftheFinancialAccountingFoundation(FAF)and10nationalassociationsofstateandlocalgovernmentofficials.GASBisrecognizedbygovernments,theaccountingindustry,andthecapitalmarketsastheofficialsourceofgenerallyacceptedaccountingprinciples(GAAP)forstateandlocalgovernments.
GASBisnotagovernmententity;instead,itisanoperatingcomponentoftheFAF,whichisaprivatesectornot‐for‐profitentity.Itsstandardsarenotfederallawsorregulationsandtheorganizationdoesnothaveenforcementauthority.CompliancewithGASB’sstandards,however,isenforcedthroughthelawsofsomeindividualstatesandthroughtheauditprocess,whenauditorsrenderopinionsonthefairnessoffinancialstatementpresentationsinconformitywithGAAP1.
COMPONENTSOFFISCALSUSTAINABILITY
Fiscalsustainabilityistheabilityandwillingnessofagovernmentalentitytohonorcurrentservicecommitmentsandfinancialobligationswithouttransferringpresentobligationstofutureperiods.Fiscalsustainabilityistheforwardlookingaspectofeconomiccondition.Inthisreport,thecomponentsoffiscalsustainabilitywillbepresentedfortheGeneralFund,EducationFund,TransportationFund,TransportationInvestmentFund,andDepartmentofAlcoholicBeverageControl’sEnterpriseFund.
FivecomponentsoffiscalsustainabilityarebeingconsideredbyGASBforinclusionintheCAFR.Theyare:
Projectionsofthetotalcashinflowsandmajorindividualinflowsofresourcesinbothpercenttermsandtotaldollaramounts.
Projectionsofthetotalcashoutflowsandmajoroutflowsofresourcesbyfunctioninbothpercenttermsandtotaldollaramounts.
Projectionsofmajorindividualfinancialobligationsandtotalfinancialobligationsincludingbonds,pensions,OPEB,andlong‐termcontracts.
Projectionsofannualdebtservicerequirements.
Narrativediscussionofmajorintergovernmentalserviceinterdependenciesandthenatureofthoseserviceinterdependencies.
IfGASBproceedswiththisproposal,Utahwouldberequiredtocomplybecause,bystatute(UCA63A‐3‐204(1)(a)andUCA51‐5‐4),UtahadoptsGAAP.
ThesectionsbelowwilldetailthebackgroundandrationaleforincludingeachofthesecomponentsandwillelaborateonwhatthedatashowsforUtah.
PURPOSEOFGASBPROPOSEDGUIDELINES
Recenteconomicconditionssuchasjoblosses,creditmarketproblems,theailingconstructionsector,andreducedconsumerspendinghaveincreasedriskanduncertaintyintheprivateandpublicsector.Asvariousgovernmentalentitiesarenotimmunefromfinancialstress,thereisaneedtoeducatethepublicsectoronfiscalstrengthsandweaknessesthatcontributetotheeconomicsustainabilityoflocalgovernments,states,andthefederalgovernment.
1Source:www.gasb.org“FactsAboutGASB.”

OFFICE OF THE LEGISLATIVE FISCAL ANALYST 3 MAY 9, 2013, 10:15 AM
I N ‐DE P T H BUDG E T R E V I EW
Governmentspendingandgovernmentdeficitsgenerallyincreaseduringeconomicdownturnsduetoaddeddemandsbyeconomicallydisadvantagedpopulationsanddecliningrevenues.Whileeconomicdeclinesareunpleasant,theyforcegovernmentalentitiestofindefficiencieswithintheirrespectiveorganizations.
Thegoalofafive‐yearprojectionistoprospectivelyassessagovernmentalentity’sfinancialviability.ThisreportaimstomeetGASB’sgoalsbyaddressingthefivecomponentsoffiscalsustainability,providingfinancialprojectionsthroughFY2017,andbyincludingnarrativediscussionsrelatedtoeach.
DEFINITIONS
ThefollowingtermsaredefinedbyGASBandareusedfrequentlythroughoutthisreport.2
Accrualaccounting:recordingalltransactionsinthebookswhentheyoccur,evenifnocashchangeshands.
Cashbasisaccounting:recordingalltransactionsinthebookswhencashactuallychangeshands,meaningwhencashpaymentisreceivedbytheentityfromcustomersorpaidoutbytheentityforpurchasesorotherservices.
Economiccondition:acompositeoffinancialposition,fiscalcapacityandservicecapacity.Economicconditionismeanttoembodyacomprehensiveassessmentoffinancialhealth.
Financialposition:thestatusofagovernment’sassets,deferredoutflows,liabilities,deferredinflows,andnetposition,asofapointintime.
Fiscalcapacity:agovernmentalentity’sabilitytomeetfinancialobligationsastheycomedueonanongoingbasis.
Fiscalsustainability:theabilityandwillingnessofagovernmentalentitytohonorcurrentservicecommitmentsandfinancialobligationswithouttransferringpresentobligationstofutureperiods.Fiscalsustainabilityistheforwardlookingaspectofeconomiccondition.
Intergovernmentalserviceinterdependency:whenonegovernmentalentityprovidesaserviceonbehalfofanothergovernmentalentityortogetherwithoneormoregovernmentalentities.
Majorcategory:anindividualinflow,outflow,andfinancialobligationthatrepresentsatleast10percentoftotalinflows,outflows,andfinancialobligationsforallactivitiesofthattype.Allcashoutflowsforcapitaloutlaysandcapital‐relatedcashinflowsfrombondproceeds,capitalgrants,orothercashinflowsrestrictedorcommittedtocapitaloutlaysareconsideredmajor.
Resourceinterdependency:cashinflowsfromonegovernmentalentitytoanothergovernmentalentity.
Servicecapacity:agovernmentalentity’sabilitytomeetserviceobligationsonanongoingbasis.
Vulnerability:theextenttowhichanentityisfiscallydependentuponfundingsourcesoutsideitscontrol.GASB’SPROPOSEDMETHODOLOGYFORFINANCIALPROJECTION
GASBrecommendsusingaforecastbasedoncurrentlaws,regulations,andrulessuchthatthefollowingcriteriaaremet3:
Forecastsshouldusecurrentpolicyandadjusttheforecastonlyforknownchangesthatareeffectiveinfutureperiods.
2Source:GovernmentalAccountingStandardsSeries:PreliminaryViews3Source:GovernmentalAccountingStandardsSeries:PreliminaryViews

MAY 9, 2013, 10:15 AM 4 OFFICE OF THE LEGISLATIVE FISCAL ANALYST
I N ‐DE P T H BUDG E T R E V I EW
Forecastsshouldbeinformedbyhistoricalinformationandadjustedforknowneventsorconditionsthataffectfutureperiods.
Projectionsshouldextendatleastfiveyearsbeyondthereportingperiod.
Projectionsofcashinflowsandoutflowsshouldbebasedonacashbasis4asdefinedbyGASB.
ProjectionsoffinancialobligationsshouldbemadeonanaccrualbasisasdefinedbyGASB.
STUDYMETHODOLOGY
EmployingtheGASBmethodologydetailedabove,dataweretakenfromtheUtah’sComprehensiveAnnualFinancialReport.Thestatisticalmethodologywaslimitedtoknownvariables;meaningonlyhistoricalexperienceisincludedinconstructingtheprojection,withadjustmentstakenonlyforknownlegislativechanges.ThemethodologyutilizedSASorForecastProtimeseriesprojectionsoftwaredependinguponthesoftware’sabilitytominimizehistoricalerrors.Inalmostallcases,someformofanautoregressivemodelfitthehistoricalexperiencethebest,andthereforewaschosenastheforecastmodel.
Wecontrolledforsomeongoingandone‐timepolicychangesthataffectedtheforecast.Thepolicychangesincludeadjustmentstothesalestaxonunpreparedfood,cigaretteandtobaccotaxrateincreases,incometaxratereductions,earmarkingchanges,andARRAfunding.
COMPONENT1:PROJECTIONSOFCASHINFLOWS
Cashinflowsallowgovernmentalentitiestoassesstheincomesideoftheirbalancesheet.Thesourceandmixoftherevenuearenecessaryforanevaluationofvolatility.Tothisend,GASBrequiresabreakoutofcashinflowsbetweenmajorandnon‐majorsources.Majorsourcesofcashinflowsareforecastforanyspecificcomponentthatis10.0percent5oftherevenueorgreater.Anythingbelow10.0percentofthetotalisreportedintheaggregate.Numbersarepresentedinbothabsolutetermsandasapercentoftotalinflows.
Datashouldbeusedtoassessagovernment’srelianceononesourceofrevenuetotheexclusionofothers.Usingtheinformationrelatedtothesourcesandmixofrevenue,userswillbeabletodrawtheirownconclusionsrelatedtoagovernments’sustainability.GASBalsorequiresanarrativediscussionontheknowncausesoffluctuationsinmajorindividualcashinflowsandthepotentialimpacttheymayhaveongovernmentalsustainability.
Weevaluatedthiscashinflowrequirementforfivefunds:GeneralFund(andGeneralFundRestricted),EducationFund,TransportationFund,TransportationInvestmentFund,andtheDepartmentofAlcoholicBeverageControl’sEnterpriseFund.
Asabroadoverviewofthecashinflowsection,Figure1showscashinflowbyrevenuesourceacrossfunds,whileFigure2showscashinflowbyfund.Onthewhole,FederalFunds6representthelargestsourceofstategovernmentrevenue,followedbytheindividualincometax,andsalestax.Theoverallimportanceofagivenrevenuesourcevariesbyfund,with,forinstance,salestaxrepresentingthelargestsourceofrevenuetotheGeneralFundortheTransportationInvestmentFund,whilemotorfueltaxrepresentingthelargestsourceofrevenuetotheTransportationFund.
4Forpurposesofthisreport,afivedayaccrualadjustmentisconsideredcashbasis.5GASBisunclearastotheyearinwhichthe10percentruleapplies.Thisstudyassumesthe10percentruleappliestothemostrecentfiscalyear(FY2012)unlessotherwisestated.6Inadditiontothe$2.6billioninFederalFundsreportedhere,thestatewidefederalfundsaudit(OMBCircularA‐133)anddepartmentspecificrevenueincludesanadditionalamountofabout$4.2billioninexpendituresforsuchitemsasfederalloanstostudentsathighereducationinstitutions,unemploymentinsurance,andothers.

OFFICE OF THE LEGISLATIVE FISCAL ANALYST 5 MAY 9, 2013, 10:15 AM
I N ‐DE P T H BUDG E T R E V I EW
Figure1‐CashInflowbyRevenueSource(AllSources)

MAY 9, 2013, 10:15 AM 6 OFFICE OF THE LEGISLATIVE FISCAL ANALYST
I N ‐DE P T H BUDG E T R E V I EW
Figure2‐CashInflowbyFund(StateSources)
Fund Type Type
0M 500M 1000M 1500M 2000M 2500M 3000M
Amount
DABC DABC Receipts
Education Fund Individual Income Tax
Corporate Income Tax
All Other Education Fund
Education Fund Restricted
Federal Contracts and Grants
All Other Department Specific Revenue
General Fund Sales Tax
All Other General Fund
General Fund Restricted
Federal Contracts and Grants
All Other General Fund Restricted
Higher Education Collections
Departmental Collections
Transportation Fund
Motor Fuel Tax
Special Fuel Tax
All Other Transportation Fund Revenue
Transportation Fund Restricted
Federal Contracts and Grants
Departmental Collections
All Other Department Specific Revenue
Sales and Aviation Fuel Taxes
Transportation Investment Fund
Sales Tax
Motor Vehicle Registration Fees
All Other TIF Revenue
326,100,000
30,880,000
272,355,000
2,478,638,000
80,118,000
544,833,000
408,864,000
1,582,530,000
421,125,000
624,958,000
670,549,000
2,550,694,000
79,168,000
104,099,000
252,954,000
74,283,000
94,141,000
89,122,000
454,343,000
69,606,000
71,706,000
269,313,000
On-Book Cash Inflow by Fund (FY 2012)
Fund Type
DABC
Education Fund
Education Fund Restricted
General Fund
General Fund Restricted
Transportation Fund
Transportation Fund Restricted
Transportation Investment Fund

OFFICE OF THE LEGISLATIVE FISCAL ANALYST 7 MAY 9, 2013, 10:15 AM
I N ‐DE P T H BUDG E T R E V I EW
GENERALFUNDCASHINFLOW
Approximately79.5percentoftotalGeneralFundcashinflowstemmedfromsalestaxinFY2012,withtheremaining20.5percentcomingfrominsurancetaxes,severancestaxes,cigaretteandtobaccotaxes,andothermiscellaneoussources.LookingatGeneralFundcashinflowfromFY1999forward,salestaxrevenuehasdeclinedasapercentoftotalinflow;goingfrom88.4percentinFY1999to79.5percentinFY2012(Figure3).Amongthereasonsforthisarelegislativeadjustmentstobudgetingprioritiesthroughsalestaxearmarking,taxincreasesordecreasesonvarioussources,andshiftingofpurchasingdecisionsawayfromitemssubjecttosalestax.
Theongoingandone‐timechangesfortheGeneralFundincludethecigaretteandtobaccotaxincrease,decreasesintheState’staxonunpreparedfood,andadjustmentsduetoongoing,one‐timesalestaxearmarkadjustments,andfiscalnotebills.
Overall,themodelsproducetotalgrowthof$362.8millionfromFY2013toFY2017(Figure4),oranaverageannualgrowthrateof3.4percent.Mostoftheprojectedgrowthisinthesalestax,accountingfor$273.4million,withanaverageannualgrowthrateof3.2percent;theremainingamount,$89.3millionstemsfromallothersources,withananticipatedaverageannualgrowthrateof4.0percent.
GENERALFUNDKNOWNCAUSESOFFLUCTUATION
ChangesinthenumberoftaxabletransactionsduetoeconomicforcessuchasconsumerconfidenceandemploymentarethelargestfactorsinGeneralFundrevenuefluctuations.Inadditiontoeconomics‐driventaxabletransactions,changesinprices(inflationordeflation),legislativeadjustmentstosalestaxratesandtaxablebases,andprioritizationthroughearmarksalsocontributetothevolatilityofthesalestax.
Thelargestnon‐economicorpolicyrelatedchangetoGeneralFundrevenue,butnotoverallsalestaxrevenue,implementedoverthepastfewyearshasbeenbudgetprioritizationthroughearmarkingofsalestax.Overthepast14yearssalestaxearmarkshaveincreasedfromabout$9.0millionoftotalrevenue(0.7percent)to$332.0million(17.3percent)inFY2012.
AnewearmarkbeginsinFY2013,stemmingfromS.B.229ofthe2011VetoOverrideSession,whichallocates30.0percentoftotalsalestaxgrowthfromFY2011toanygivenfiscalyearthereaftertotheTransportationInvestmentFund,uptoamaximumof17.0percentoftotalsales,whichrepresentsanestimateoftotaltaxablesalesduetotheautomobileindustry.Totalearmarksareanticipatedtorepresentapproximately22.0percentofprojectedFY2013GeneralFundrevenue,or$473.0million.

MAY 9, 2013, 10:15 AM 8 OFFICE OF THE LEGISLATIVE FISCAL ANALYST
I N ‐DE P T H BUDG E T R E V I EW
Figure3‐ComponentsofGeneralFundCashInflow
0%
10%
20%
30%
40%
50%
60%
70%
80%
90%
100%
1999 2000 2001 2002 2003 2004 2005 2006 2007 2008 2009 2010 2011 2012
PercentofTotalGeneralFundCashInflow
Sales&UseTax AllOtherGeneralFund

OFFICE OF THE LEGISLATIVE FISCAL ANALYST 9 MAY 9, 2013, 10:15 AM
I N ‐DE P T H BUDG E T R E V I EW
Figure4‐GeneralFundCashInflow(Thousands)
0
200,000
400,000
600,000
800,000
1,000,000
1,200,000
1,400,000
1,600,000
1,800,000
2,000,0001999
2000
2001
2002
2003
2004
2005
2006
2007
2008
2009
2010
2011
2012
2013
2014
2015
2016
2017
GeneralFundCashInflowProjections
Sales&UseTax AllOtherGeneralFund
Sales&UseTaxProjection AllOtherGeneralFundProjection

MAY 9, 2013, 10:15 AM 10 OFFICE OF THE LEGISLATIVE FISCAL ANALYST
I N ‐DE P T H BUDG E T R E V I EW
GENERALFUNDRESTRICTEDCASHINFLOW
InadditiontothefreerevenueportionoftheGeneralFund,GASBrequiresaprojectionofcashinflowfromGeneralFundRestrictedsources,whichincludeFederalcontractsandgrants,departmentalcollections(feesandotherservices),highereducationcollections,andallotherGeneralFundrevenue.Amodeledhistoricaltrendprojectionofthesesourcesisgiven(Figure5).Overall,themodelsproduce$1.2billioningrowthoverthecomingfiveyears,with$727.0millionofthatbeingFederalcontractsandgrants,followedby$274.0millioninallotherGeneralFundRestrictedcashinflow,$108.0millionfromhighereducationcollections,and$50.0millionindepartmentalcollections.ThecashinflowprojectionsrelatedtoFederalcontractsandgrantsisproducedbaseduponhistoricalexperience,butmaybeoverstatedgivencurrentfederalbudgetconditions.Theprojectionisleftas‐isbecausewedonotknowhowthefederalgovernmentwillbalanceitsbudgetinthecomingfivefiscalyears.Itappearsslowerfederalexpendituregrowthascomparedtohistoricalexperienceisthemostlikelyoutcomeovertheperiodoftheforecast.
GENERALFUNDRESTRICTEDKNOWNCAUSESOFFLUCTUATIONS
Asshown(Figure5),thelargestinfluencerofoverallGeneralFundRestrictedrevenuechangeisthebusinesscycle,withjumpsinfederalfundsinFY2009andFY2010andlargerthanexpectedincreasesinhighereducationcollections(tuitionincreases),amongotherchanges.
Figure5‐GeneralFundRestrictedCashInflowProjections(Thousands)
0
500,000
1,000,000
1,500,000
2,000,000
2,500,000
3,000,000
3,500,000
1999
2000
2001
2002
2003
2004
2005
2006
2007
2008
2009
2010
2011
2012
2013
2014
2015
2016
2017
GeneralFundRestrictedCashInflowProjections
FederalContracts&Grants FederalContracts&GrantsProjection
DepartmentalCollections DepartmentalCollectionsProjection
HigherEducationCollections HigherEducationCollectionsProjection
AllOtherGeneralFundRestricted AllOtherGeneralFundRestrictedProjection

OFFICE OF THE LEGISLATIVE FISCAL ANALYST 11 MAY 9, 2013, 10:15 AM
I N ‐DE P T H BUDG E T R E V I EW
EDUCATIONFUNDCASHINFLOW
Approximately89.1percentoftotalEducationFundcashinflowstemmedfromincometaxinFY2012,followedbycorporateincometaxat9.8percent7,andtheremaining1.1percentcomingfromothermiscellaneoussources.InlookingatEducationFundcashinflowfromFY1999forward,incometaxrevenuehasgrownasapercentoftotalinflow,goingfrom88.0percentinFY1999to89.1percentinFY2012(Figure6).Incometaxhasrepresentedasmuchas91.9percentoftotalrevenue(FY2002)toaslowas84.9percent(FY2006).ThelowyearofFY2006waslargelyduetocorporateincometaxexpandingrapidlyduringthepeakofthebusinesscycle.
Themodelswereadjustedformajortaxchanges,suchastheincometaxratesgoingtoaflatfivepercenttaxfromthetiered7.0percenttaxrate.
Overall,themodelsproducetotalgrowthof$577.6millionfromFY2012toFY2017(Figure7),oranaverageannualgrowthrateof3.9percent.Mostoftheprojectedgrowthisintheincometax,accountingfor$441.3million,withanaverageannualgrowthrateof3.4percent;corporateincometaxrepresentsthenextlargestgrowthcomponentat$130.9million,foranaverageannualgrowthrateof8.5percent;theremainingamountof$5.4millionstemsfromallothersources,withananticipatedaverageannualgrowthrateof5.7percent.
EDUCATIONFUNDKNOWNCAUSESOFFLUCTUATIONS
FluctuationsinEducationFundrevenuearelargelytheresultofthreefactors:1)changesineconomicconditions(accountingforatleast80.0percentofthevolatilityinrecentyears);2)changesintheEconomicDevelopmentIncentivesauthorizedoverthepastseveralyears;and3)legislativechanges(suchasreducingtheincometaxburden).Includedintheincentivesare:theEconomicDevelopmentTaxIncrementFinancingIncentiveTaxCredits,theMotionPictureIncentiveCredit,theRenewableEnergyIncentive,andtheResearchandDevelopmentIncentive.Undermostoftheseincentivesacompanyisrebatedbackaportiontothefullamountofthetaxestheymayhavepaidforaperiodofupto20years.
7Corporateincometaxisprojectedseparatelyeventhroughincertainyearsthe10percentGASBthresholdrequirementisnotmet.

MAY 9, 2013, 10:15 AM 12 OFFICE OF THE LEGISLATIVE FISCAL ANALYST
I N ‐DE P T H BUDG E T R E V I EW
Figure6‐ComponentsofEducationFundCashInflow
0%
10%
20%
30%
40%
50%
60%
70%
80%
90%
100%
1999 2000 2001 2002 2003 2004 2005 2006 2007 2008 2009 2010 2011 2012
PercentofTotalEducationFundCashInflow
IndividualIncomeTax CorporateTax AllOtherEducationFund

OFFICE OF THE LEGISLATIVE FISCAL ANALYST 13 MAY 9, 2013, 10:15 AM
I N ‐DE P T H BUDG E T R E V I EW
Figure7‐EducationFundCashInflowProjections(Thousands)
0
500,000
1,000,000
1,500,000
2,000,000
2,500,000
3,000,000
3,500,0001999
2000
2001
2002
2003
2004
2005
2006
2007
2008
2009
2010
2011
2012
2013
2014
2015
2016
2017
EducationFundCashInflowProjections
IndividualIncomeTax CorporateTax
AllOtherEducationFund IndividualIncomeTaxProjection
CorporateTaxProjection AllOtherEducationFundProjection

MAY 9, 2013, 10:15 AM 14 OFFICE OF THE LEGISLATIVE FISCAL ANALYST
I N ‐DE P T H BUDG E T R E V I EW
TRANSPORTATIONFUNDCASHINFLOW
Approximately58.0percentoftotalTransportationFundcashinflowstemmedfrommotorfueltaxinFY2012,followedbyspecialfueltaxesat23.9percent,andtheremaining18.1percentcomingfromothermiscellaneoussources.InlookingatTransportationFundcashinflowfromFY1999forward,motorfueltaxrevenuehasdeclinedasapercentoftotalinflow,goingfrom63.0percentinFY1999to58.0percentinFY2012(Figure8).Theslowdeclinehasbeenfairlysteadythroughouttheprior14years,althoughthemostrecentfiscalyearexperiencedanincreaseinmotorfueltax’sshareoftotalrevenue,from57.8percentto58.0percent.
Overall,themodelsproducetotalgrowthof$40.3millionfromFY2012toFY2017(Figure9),oranaverageannualgrowthrateof1.8percent.Theprojectedgrowthisspreadout,with$7.3millionanticipatedfromthemotorfueltax(0.6percentaverageannualgrowth),$18.9millionfromspecialfueltaxes(3.4percentaverageannualgrowth),and$14.0million(3.3percentaverageannualgrowth)fromallothersources.
TRANSPORTATIONFUNDKNOWNCAUSESOFFLUCTUATIONS
Besidestheeconomy,fluctuationinTransportationFundrevenuegrowthstemfromchangesintheairlineandtruckingindustry’sdemandforfuelsubjecttothespecialfueltaxandapotentiallong‐termshiftbyconsumerstowardsmorefuelefficientvehicles,whichreducesdemandforfuelsubjecttothemotorfueltaxmorethanitincreasesthenumberofmilesdriven.Inadditiontofuelefficiencyandindustrydemandforcertainfueltypes,anotherfactorinfluencingTransportationFundcashinflowarethingsthataffectregistrationfees,suchaseconomicgrowthandpopulationchanges.

OFFICE OF THE LEGISLATIVE FISCAL ANALYST 15 MAY 9, 2013, 10:15 AM
I N ‐DE P T H BUDG E T R E V I EW
Figure8‐ComponentsofTransportationFundCashInflow
0%
10%
20%
30%
40%
50%
60%
70%
80%
90%
100%
1999 2000 2001 2002 2003 2004 2005 2006 2007 2008 2009 2010 2011 2012
PercentofTotalTransportationFundCashInflow
MotorFuelTax SpecialFuelTax AllOtherTransportationFundRevenue

MAY 9, 2013, 10:15 AM 16 OFFICE OF THE LEGISLATIVE FISCAL ANALYST
I N ‐DE P T H BUDG E T R E V I EW
Figure9‐TransportationFundCashInflowProjections(Thousands)
0
50,000
100,000
150,000
200,000
250,000
300,000
1999
2000
2001
2002
2003
2004
2005
2006
2007
2008
2009
2010
2011
2012
2013
2014
2015
2016
2017
TransportationFundCashInflowProjections
MotorFuelTax
SpecialFuelTax
AllOtherTransportationFundRevenue
MotorFuelTaxProjection
SpecialFuelTaxProjection
AllOtherTransportationFundRevenueProjection

OFFICE OF THE LEGISLATIVE FISCAL ANALYST 17 MAY 9, 2013, 10:15 AM
I N ‐DE P T H BUDG E T R E V I EW
TRANSPORTATIONINVESTMENTFUNDCASHINFLOW
InadditiontogeneralTransportationFund,GASBrequiresaprojectionofcashinflowfromTransportationFundRestrictedsources,whichincludeearmarkedsalestax,vehicleregistrationfees,andallotherTransportationRestrictedFundrevenue.Anhistoricaltrendprojectionofthesesourcesisgiven(Figure10).Overall,themodelsproduce$181.0millioningrowthoverthecomingfiveyears,with$176.2millionofthatbeingearmarkedsalestaxrevenue,followedby$19.2millioninallotherTransportationFundRestrictedcashinflow,and$4.7millioninearmarkedvehicleregistrationfees.ThejumpinsalestaxrevenuefromFY2011toFY2012isduetoareinstatementofaoneyearreductioninthe8.3percentoftotalsalestaxcollectionsearmark.ThediagonalgrowthfromFY2013forwardstemsfromS.B.229TransportationFundingRevisionsofthe2011VetoOverrideSession,whichprioritizes30percentofsalestaxgrowthoverthe2011basetotheTransportationInvestmentFund.Therestofthevolatilityistheresultofbudgetingpractices.Inthe2009GeneralSession,H.B.139increasedthecarregistrationfeesbyaround$20.0pervehicle8,thusthebumpinmotorvehicleregistrationfeesfrom2009to2010.OnAllOtherTIFrevenue,whichistheCriticalHighwayNeedsFund,salestaxearmarkswereadjustedeachyear,suchasthe$90.0millionfixedearmarkbeingreducedto$55.0millioninFY2012.
TRANSPORTATIONINVESTMENTFUNDKNOWNCAUSESOFFLUCTUATIONS
ThesamefactorsaffectingTransportationFundrevenuefluctuationsaffectTransportationInvestmentFundcashinflow.Additionally,threepolicychangesareresponsiblefortherestofthelargefluctuations,whichare:1)areductioninthe8.3percentearmarkto1.9percentinFY2011;2)anincreaseinthecostofregisteringavehiclebyabout$20.0pervehicle,implementedinFY2010;3)anewshiftingofsalestaxrevenuefromtheGeneralFundtotheTransportationInvestmentFund(FY2013forward,S.B.229ofthe2011VetoOverrideSession);and4)adjustmentstotheCriticalHighwaysNeedsFund.
8The$20pervehiclefeeincreaseappliedtomostvehiclesdriven;adifferentfeeincreasestructurewasimposedonheavytrucksbaseduponweight.

MAY 9, 2013, 10:15 AM 18 OFFICE OF THE LEGISLATIVE FISCAL ANALYST
I N ‐DE P T H BUDG E T R E V I EW
Figure10‐TransportationInvestmentFundCashInflowProjections(Thousands)
0
100,000
200,000
300,000
400,000
500,000
600,000
2006 2007 2008 2009 2010 2011 2012 2013 2014 2015 2016 2017
TransportationInvestmentFundCashInflowProjections
Salestax SalestaxprojectionMotorVehicleRegistrationFees MotorVehicleRegistrationFeesProjectionAllOtherTIFRevenue AllOtherTIFRevenueProjection
Note: The drop in sales tax in FY 2011 is due to a decline in the 8.3% earmark to 1.93% for FY 2011 only; the increases and decreases in the "All Other TIF Revenue" is due to budgeting changes made to the Critical Highway Needs Fund; the diagonal growth in sales tax for FY 2013 onward is due to SB 129 of the 2011 Veto Override Session, which prioritizes 30% of sales tax growth to the TIF

OFFICE OF THE LEGISLATIVE FISCAL ANALYST 19 MAY 9, 2013, 10:15 AM
I N ‐DE P T H BUDG E T R E V I EW
ALCOHOLICBEVERAGECONTROL’SENTERPRISEFUNDCASHINFLOW
Inadditiontothemajorstatefunds,thisreportincludestheDepartmentofAlcoholicBeverageControl(DABC)asanexampleofprojectingtheState’sbusinessactivities.Thefittedhistoricaltrendprojectionisgiven(Figure11).Onthewhole,DABC’stotalcashinflowisanticipatedtogrowby$68.0millionoverthenextfiveyears,or21.0percent.
DABCKNOWNCAUSESOFFLUCTUATIONS
ReceiptsfromDABC’sbusinessactivitiesareaffectedbyaforementionedeconomicfactors,suchasacontinualshiftinthepopulationmixfromnon‐alcoholicdrinkerstoalcoholicdrinkersandpopulationgrowthfromnetmigration.
Figure11‐DABCCashInflowProjections(Thousands)
0
50,000
100,000
150,000
200,000
250,000
300,000
350,000
400,000
450,000
2000
2001
2002
2003
2004
2005
2006
2007
2008
2009
2010
2011
2012
2013
2014
2015
2016
2017
DABCCashInflowProjections
Receipts ReceiptsProjections

MAY 9, 2013, 10:15 AM 20 OFFICE OF THE LEGISLATIVE FISCAL ANALYST
I N ‐DE P T H BUDG E T R E V I EW
COMPONENT2:PROJECTIONSOFMAJORAREACASHOUTFLOWS
Cashoutflowsrepresentagovernment’scostsofoperation.Projectionsofcashoutflowsinformusersoflikelyfuturecommitments.Similartocashinflows,cashoutflowslessthan10.0percentarereportedintheaggregate.Majorcashoutflowsarereportedbyprogramorfunction.Numbersarepresentedinabsolutetermsandasapercentoftotaloutflows.TheDepartmentofFinanceusescashflowaccounting.Asaresultwedonotaccountforexpendituresbyfundtype.Thismeansthatwecannotforeachbudgetareashowhoweachwoulddobyfundtype.Forthisreasontheoutflowspresentedinthisreportincludeallfundingsources.Incuttingacrossallexpendituretypes,PublicEducationisthehighestcostarea,followedbyHealthandEnvironmentalQuality,HigherEducation,AllOtherGovernmentalcosts,andTransportation(Figure12).
Figure12‐CashOutflowbyExpenditureArea
GENERALFUNDCASHOUTFLOW
Thefollowingrepresentshowfundinghasbeenallocatedfrom1999‐2012inareasmostlycoveredbyGeneralFundrevenue(Figure13).Asisindicated,costsassociatedwithHealthandEnvironmentalQualityhaveseenthelargestincreasefromtheGeneralFund,growingfrom30.7percentinFY1999to37.2percentinFY2012.ThelargestdeclinersareHumanServices,goingfrom14.9percentinFY1999to10.1percentinFY2012andAllOtherGovernment,decliningfrom23.1percentinFY1999to20.2percentinFY2012.

OFFICE OF THE LEGISLATIVE FISCAL ANALYST 21 MAY 9, 2013, 10:15 AM
I N ‐DE P T H BUDG E T R E V I EW
Figure13–PercentofTotalGeneralFundExpendituresbyMajorExpenditureArea,1999‐2012
HUMANSERVICESCASHOUTFLOW
TheDepartmentofHumanServicesembodiesservicesinvolvingindividualswithdisabilities,childwelfare,substanceabuseandmentalhealthtreatment,childsupportcollections,andprogramsassociatedwiththeelderly.CashoutflowsassociatedwithHumanServicesreachedamaximumasapercentoftotalGeneralFundexpendituresinFY2000,afterwhichcostshavedeclinedrelativetotheotherexpendituretypeswithintheGeneralFund,withtheFY2012figureforHumanServicesat10.1percent.CostsassociatedwithHumanServicesbasedonthehistoricaltrendGASBrequirementsindicateanadditional$134.0inexpendituresfromFY2013toFY2017,oranaverageof$27.0millionperyear.CashoutflowsfromactivitiesclassifiedasHumanServicesfollowthebusinesscycle,withthemostrecentbusinesscycleassociatedsavingsof$56.0million.
1999 2000 2001 2002 2003 2004 2005 2006 2007 2008 2009 2010 2011 2012
All Other Government 23.1% 23.1% 22.9% 22.2% 20.8% 20.3% 19.9% 20.6% 22.0% 22.5% 22.0% 20.9% 20.4% 20.2%
Employment and Family Services 9.8% 8.8% 8.3% 8.4% 9.2% 9.2% 9.1% 8.4% 8.0% 7.8% 8.9% 11.2% 11.4% 11.2%
Higher Education ‐ All 21.6% 21.5% 21.8% 22.6% 22.2% 21.3% 21.5% 21.2% 21.5% 22.0% 20.8% 20.7% 21.1% 21.4%
Health and Environmental Quality 30.7% 31.1% 32.2% 32.8% 34.4% 36.3% 36.8% 37.7% 36.2% 35.4% 36.3% 36.2% 36.7% 37.2%
Human Services 14.9% 15.5% 14.7% 13.9% 13.5% 13.0% 12.6% 12.2% 12.3% 12.2% 11.9% 11.0% 10.4% 10.1%
0%
10%
20%
30%
40%
50%
60%
70%
80%
90%
100%
Percent of Total General Fund Expenditures by Major Expenditure Area

MAY 9, 2013, 10:15 AM 22 OFFICE OF THE LEGISLATIVE FISCAL ANALYST
I N ‐DE P T H BUDG E T R E V I EW
HUMANSERVICESKNOWNCAUSESOFFLUCTUATIONS
Historically,fundingfortheDepartmentofHumanServiceshasbeendrivenbythefollowingfactors:1)changesinrulesguidingfederalfundingparticipation;2)economicpressuresonUtah’sgovernmentoperations;and3)highprioritysocialissues.
SeveralofthemajoreconomicpressuresonoperationsoftheDepartmentofHumanServiceshaveincludedtworecessionsoverthepastdecadeandthepressureforcost‐of‐livingincreasesforthevariousprovidergroupsdeliveringservices.TheDepartmentofHumanServiceshasgonethroughseveralroundsofprogramreductionsfromFY2002throughFY2003andfromFY2009throughFY2011.
Additionally,theDepartmentofHumanServiceshasexperiencedpressurefromprovidersforcost‐of‐livingincreasesincludingmeetingthestatutoryrequirementsofmaintaininglargegroupsettingfacilitiessuchastheUtahStateHospitalandtheUtahStateDevelopmentalCenter.
ChangesinrulesguidingfederalfundingparticipationhavehadamajorimpactontheDepartment’sneedforadditionalstatefunding.TheDepartmentofHumanServiceshaseitheradaptedorrequiredadditionalstatefundingbecauseofthelossoffederalrevenueduetofederalpolicychanges,mandatedactionsrequiredwhenacceptingfederalfunds,orchangesintheState’srateoftheFederalMedicalAssistancePercentage(FMAP).
Whenrevenuesareavailable,theDepartmentofHumanServiceshasreceivedfundingforitemssuchasTheDrugOffenderReformAct(DORA),supportservicesforindividualswithdisabilities,mentalhealthtreatment,subsidizedmealsforseniorsandsupportforlow‐incomeseniorsremainingintheirownhomes,substanceabusetreatment,andchildabuseandneglectissues.
TheprojectionsforcashoutflowsclassifiedasHumanServicesaregiven(Figure14).

OFFICE OF THE LEGISLATIVE FISCAL ANALYST 23 MAY 9, 2013, 10:15 AM
I N ‐DE P T H BUDG E T R E V I EW
Figure14‐HumanServicesCashOutflowProjections(Thousands)
0
100,000
200,000
300,000
400,000
500,000
600,000
700,000
800,000
900,000
1999
2000
2001
2002
2003
2004
2005
2006
2007
2008
2009
2010
2011
2012
2013
2014
2015
2016
2017
HumanServicesCashOutflowProjections
HumanServices HumanServicesProjection HumanServicesAppropriated
See DetailView

MAY 9, 2013, 10:15 AM 24 OFFICE OF THE LEGISLATIVE FISCAL ANALYST
I N ‐DE P T H BUDG E T R E V I EW
HEALTHANDENVIRONMENTALQUALITYCASHOUTFLOW
CostsassociatedwithHealthandEnvironmentalQualityhaveconsistentlygrownfromalowinFY1999of30.7percenttoahighof37.2percent.TotalcostsinFY2012amountedto$2.4billion,anincreaseof$1.4billionfromthe$963.0millionofcostsincurredinFY1999.Thelargestportionofthe7.0percentaverageannualgrowthratestemsfromcostsassociatedwithMedicaid.Onthehistoricaltrendprojection,thetrendindicatesadditionalcostsfromFY2013toFY2017of$644.0million,orabout$129.0millioneachyear.HEALTHANDENVIRONMENTALQUALITYKNOWNCAUSESOFFLUCTUATIONS
ThemissionoftheUtahDepartmentofHealthistoprotectthepublic’shealthbypreventingavoidableillness,injury,disability,andprematuredeath;assuringaccesstoaffordable,qualityhealthcare;andpromotinghealthylifestyles.
Historically,fundingfortheUtahDepartmentofHealthhasbeendrivenbythefollowingfactors:1)expansionsinwhichpeopleareeligible;2)morepeoplearebecomingeligible;and3)increasingcostofhealthcare.
TheforecastislargelybasedoncontinualcostsassociatedwithsuchprogramsasMedicaidandenvironmentalquality.Theforecastdoesnotcaptureanyexpendituresavingsfromimprovementintheeconomy.
Therearetwosourcesofexpansionsforeligibility:mandatorychangesfromthefederalgovernmentandoptionalexpansionschosenbytheState.Therehavebeenfivefederallymandatedexpansionsandninestateoptionalexpansions(includingsigningupfortheMedicaidprogram)from1966tothepresent.
OnemaincriterionforreceivingMedicaidisaclient'sincome;whenpeoplelosetheirjobs,thedemandforMedicaidincreases.TheannualgrowthratefromFY2009throughFY2011was14.3percentcomparedtonegative0.4percentaverageannualgrowthrateforthethreeprecedingyears.
Theaverageannualgrowthinmedicalinflationforthelast10yearshasbeen3.1percent.Additionally,MedicaidhassomefederalandstatelawsthatrequireadditionalincreasesforcertaincostsintheMedicaidprogram.ForFY2013,theagencyanticipatescostincreasesof$5.0millionGeneralFund.
Thesefactorswillcontinuetoimpactfuturecostincreases.Additionally,changesinincentiveforpeopletosignupforMedicaidareexpectedtoimpactfuturecostaswellaschangesinmandatorycoverage.OutsideofMedicaid,theLegislatureoftenprovidesincreasestotheBabyWatch/EarlyInterventionprogram.Thisprogramalsomustserveallclientswhoqualify.
TheprojectionsforcashoutflowsclassifiedasHealthandEnvironmentalQualityaregiven(Figure15).

OFFICE OF THE LEGISLATIVE FISCAL ANALYST 25 MAY 9, 2013, 10:15 AM
I N ‐DE P T H BUDG E T R E V I EW
Figure15‐HealthandEnvironmentalQualityCashOutflowProjections(Thousands)
0
500,000
1,000,000
1,500,000
2,000,000
2,500,000
3,000,000
3,500,000
1999
2000
2001
2002
2003
2004
2005
2006
2007
2008
2009
2010
2011
2012
2013
2014
2015
2016
2017
HealthandEnvironmentalQualityCashOutflowProjections
HealthandEnvironmentalQuality HealthandEnvironmentalQualityProjection

MAY 9, 2013, 10:15 AM 26 OFFICE OF THE LEGISLATIVE FISCAL ANALYST
I N ‐DE P T H BUDG E T R E V I EW
HIGHEREDUCATIONCASHOUTFLOW
CashoutflowsconnectedwithprovidingHigherEducationserviceshavebeengenerallyflatfromFY1999toFY2012asapercentoftotalGeneralFundcashoutflow,goingfrom21.6percentto21.4percent.CostsassociatedwithHigherEducationreachedahighof22.6percentininFY2002,fallingtoalowof20.7percentinFY2010.SincetheFY2010low,cashoutflowshaveincreased,standingat21.4percentattheendofFY2012.Overall,cashoutflowconnectedwithHigherEducationisanticipated,baseduponGASB’shistoricaltrendmethodology,togrowby$277.0millionfromFY2012toFY2017,oranaverageannualincreaseofabout$55.0million.Incontrasttotheprojectedaverageannualincreaseof$55.0million,costsgrewbyanaverageof$50.0millioneachyearfromFY1999toFY2012.HIGHEREDUCATIONKNOWNCAUSESOFFLUCTUATIONS
TheUtahSystemofHigherEducation(USHE)iscomprisedofnineinstitutionsofhigherlearning.USHEpromotesresearch,aswellaseconomic,academic,cultural,andothersocialprogramsforthecitizensofUtah.
Historically,fundingforhighereducationhasbeendrivenbythefollowingfactors:1)studentenrollmentfigures;2)operationsandmaintenance(O&M)fornewfacilities;and3)fundingforscholarships.
Theprojectionsreflectavirtualstraight‐linedmodelbaseduponthehistoricalexperiencethathighereducationcontinuallyincreasesoperatingcostswitheitherincreasedstatefundingorincreasedfees(tuition).
Severalyearsago,theStateBoardofRegentswouldprojectenrollmentfigures,andthenrequestfundingbasedonthoseestimates.Morerecently,thisshiftedtotheenrollmentthatwasactuallyseenoncampusesduringthepreviousyear.Thiswaschangedtoreflectamoreaccurateandrealisticstudentfull‐timeequivalent(FTE)number.However,fortheinstitutions,whenthisfundingwasapproved,itwasaftertheinitialenrollmentincreasehadoccurred.
Overthepastseveralyears,increasesinfundingforhighereducationincludedtheO&Mforstate‐fundedandnon‐statefundedfacilities.However,sinceFY2008,fundingforO&Mfornon‐statefundedfacilitieshasnotbeenapproved.Forstate‐fundedfacilities,thisfundinghasbeennear$2.0millioneachyear.
Inrecentyears,fundingforscholarships,mainlytheRegents’ScholarshipandtheNewCenturyScholarship,hasbeenanincreasingpartofthehighereducationbudgets.FundingfortheEngineeringInitiativehasbeensignificantsinceitsinceptioninFY2001.Atotalof$11.5millionisintheInitiative’songoingbase.Anadditional$9.7millionhasbeenappropriatedinone‐timefunds.
SinceFY2008,whenbudgetshavebeenreduced,someoftheabove‐mentionedfundingwasnecessarilyeliminated.Thingsthattraditionallywerefunded,suchasenrollmentgrowth,werenotfunded.Thiswasduringatimewhenstudentenrollmentwasincreasingatasignificantrate.
Lastyear,S.B.97,“MissionBasedFunding”wasapproved,whichmovedtoemphasizeeachinstitution’smission,whichinsomecasesisenrollmentgrowthandinothersisnot.Thispastsessionsawanappropriationof$4.0millionforMissionBasedFunding,whichinstitutionsareusingtoenhanceparticipation,completion,andeconomicdevelopment.
Lookingforward,theGovernorhasadoptedagoalofhaving66.0percentoftheadultpopulationwithapost‐secondarydegreeorcertificatebytheyear2020.However,uptothispoint,therehasbeennodiscussionofcostsassociatedwiththisgoal.
TheprojectionsforcashoutflowsclassifiedasHigherEducationaregiven(Figure16).

OFFICE OF THE LEGISLATIVE FISCAL ANALYST 27 MAY 9, 2013, 10:15 AM
I N ‐DE P T H BUDG E T R E V I EW
Figure16‐HigherEducationCashOutflowProjections(Thousands)
0
200,000
400,000
600,000
800,000
1,000,000
1,200,000
1,400,000
1,600,000
1,800,000
1999
2000
2001
2002
2003
2004
2005
2006
2007
2008
2009
2010
2011
2012
2013
2014
2015
2016
2017
HigherEducationCashOutflowProjections
HigherEducation HigherEducationProjection

MAY 9, 2013, 10:15 AM 28 OFFICE OF THE LEGISLATIVE FISCAL ANALYST
I N ‐DE P T H BUDG E T R E V I EW
PUBLICEDUCATIONCASHOUTFLOW
CashoutflowassociatedwithPublicEducationhasgrownbyabout$1.2billionfromFY1999toFY2012,representinganaverageannualincreaseofabout$89.0million,oranaverageannualgrowthrateofapproximately3.8percent.Theprojectedaverageannualgrowthratecomesoutat4.1percent,representingtotalcostincreasefromFY2013toFY2017of$641.0million,orabout$128.0millionannually.PUBLICEDUCATIONKNOWNCAUSESOFFLUCTUATIONS
PubliceducationintheStateisconcernedwithUtah'spublicschools,includingpre‐kindergarten,kindergarten,generaleducation,specialeducation,careerandtechnicaleducation,charterschools,andstatewideadministration.
Historically,fundingforpubliceducationhasbeendrivenbythefollowingfactors:1)studentenrollmentgrowth;and2)localpropertytaxrevenues.
GASB‐basedpubliceducationcashoutflowisbasedonthehistoricalexperienceofcontinuedcostincreases,specificallytheboomyearsof2004to2008.
EnrollmentinUtah’spublicschoolshasincreasedannuallysincebeforeFY2000andisprojectedtocontinueincreasingatabout2.0percenteachyearfortheforeseeablefuture.FundingincreasedenrollmentsinthepubliceducationsystemrepresentsoneoftheprimarychallengesfacingtheLegislatureeachyear.
Utahusesafundingconceptknownas“prior‐yearplusgrowth”whenfundingpublicschools.Schooldistrictsandcharterschools,knownasLocalEducationAgencies(LEAs),receivebasefundingasdeterminedbytheirprior‐yearenrollment(definedinstatuteasAverageDailyMembership).AgrowthfactoristhenappliedforLEAswithayear‐over‐yearincreaseinstudentenrollment.Growthfactorisdeterminedbycomparingtheprioryearfall‐enrollmenttothecurrent‐yearfallenrollment.LEAswithdecliningenrollmentareheldharmlessfromfundingreductioninthefirstyearofenrollmentdecline.
StudentenrollmentfiguresareconvertedintoWeightedPupilUnits(WPUs)usingformulasdefinedinstatute.InestablishingtheFY2013budget,anestimatedenrollmentof600,224generated782,017WPUs.Eachyear,theLegislaturesetsadollarvalueprovidedforeachWPU.SinceFY2012,theLegislaturehasestablishedtwoWPUValues.TheBaseWPUValueissetat$2,842inFY2013with685,076WPUsqualifyingforthisamount.TheAdd‐onWPUValueissetat$2,607inFY2013with96,941WPUsqualifyingforthisamount.
LEAsgenerateWPUsbasedonvariousdemographicorprogrammaticvariablesdefinedinstatute.Forexample,onestudentinaveragedailyattendanceequalsoneWPU.Astudentenrolledinhalf‐daykindergartenisvaluedat0.55ofaWPU.Studentsthatreceivespecialeducationservicesmaygenerateupto2.53WPUs.InadditiontoWPUfunding,LEAsmayreceiveadditionalfundingbasedontheirparticipationincategoricalprogramsfundedbytheLegislature.
InFY2013,nearly$2.2billionwasdistributedtoLEAsthroughWPUprogramsandanadditional$866.0millionwasdistributedthroughcategoricalprograms.
Localpropertytaxrevenuesplayauniqueroleinstatefundingforpubliceducation.InorderforaschooldistricttoreceivestateWPUfunding,thedistrictmustimposeabasicpropertytaxrateonpropertieswithinthedistrict.ThisBasicRateisthesameforallschooldistrictsandsetatthestateleveltogenerateacertainamountofrevenuestatewideasprovidedinstatute.InFY2013,theBasicRateisestimatedat.001665togenerate$289.0million.TherevenuegeneratedbyeachschooldistrictthroughtheBasicRate

OFFICE OF THE LEGISLATIVE FISCAL ANALYST 29 MAY 9, 2013, 10:15 AM
I N ‐DE P T H BUDG E T R E V I EW
isappliedtothecostofthedistrict’sWPUs.Theremainingbalanceiscoveredwithstaterevenues.Charterschoolsdonothavetheabilitytotax.Asaresult,charterschoolWPUsareentirelystatefunded.
Inthebudgetingprocesseachyear,aninformalgroupcalledtheCommonDataCommittee(CDC)convenestoprojectstudentenrollmentanddistrictpropertyvaluesforthecomingyear.TheCDCincludesrepresentativesfromtheUtahStateOfficeofEducation,Governor’sOfficeofPlanningandBudget,theLegislativeFiscalAnalyst,andtheUtahStateTaxCommission.TheconsensusenrollmentandpropertyvalueprojectionsdevelopedbytheCDCareusedtoestimateWPUsanddeterminethelevelofstatefundingrequired.
TheprojectionsforcashoutflowsclassifiedasPublicEducationaregiven(Figure17).
Figure17‐PublicEducationCashOutflowProjections(Thousands)
0
500,000
1,000,000
1,500,000
2,000,000
2,500,000
3,000,000
3,500,000
4,000,000
4,500,000
1999
2000
2001
2002
2003
2004
2005
2006
2007
2008
2009
2010
2011
2012
2013
2014
2015
2016
2017
PublicEducationCashOutflowProjections
PublicEducation PublicEducationProjections

MAY 9, 2013, 10:15 AM 30 OFFICE OF THE LEGISLATIVE FISCAL ANALYST
I N ‐DE P T H BUDG E T R E V I EW
TRANSPORTATIONCASHOUTFLOW
CashoutflowassociatedwithTransportationhavegrownby$577.0millionfromFY1999toFY2012,anaverageannualincreaseof$41.0million,oranaverageannualgrowthrateof5.5percent.GASB‐informedprojectioncomesoutatanaverageannualgrowthrateof5.4percent,oratotalcashoutflowincreaseof$404.0millionfromFY2012toFY2017.TRANSPORTATIONKNOWNCAUSESOFFLUCTUATIONS
DepartmentofTransportation(DOT)aimstopreserveinfrastructure,optimizemobilityandimprovesafetythroughouttheState.
Historically,fundingfortransportationhasbeendrivenbythefollowingfactors:1)populationgrowth;and2)higherpercapitauseofthehighwayinfrastructuresystem.
Between1990and2010,Utah’spopulationincreasedby60.0percentandthenumberofvehiclemilestraveledincreasedby82.0percent,buthighwaycapacityincreasedbyonly6.0percent.Projectionsshowthatby2015,travelwillincreaseby85.0to90.0percent,populationby70.0to80.0percent,andnewhighwaycapacityby7.0percent.Populationgrowthandhigherpercapitasystemusehavecreateddemandforincreasedcapacity.
TheLegislaturehashelpedmitigatesomeoftheincreaseddemandsbyprovidingfundingforhighwaycapacityprojectsoverthepast15years.ThoseprogramsincludetheCentennialHighwayProgram(41projects),theCriticalHighwayNeedsProgram(41projects),andtheTransportationInvestmentFund(3majorprojectstodate).TheongoingfundingsourcesthatenabledDOTtobuildtheseprojectsremaininplacetoaddressfuturecapacityprojects.
Increasedinfrastructuresystemusehasputastrainonscarceresourcestopreserveandextendthelifeofroadsandbridges.DOTestimatesthatanadditional$80.0millionperyearwillbenecessarytomaintainthecurrentmaintenancestandardofUtahhighways.
AnotherissueaffectingrevenueavailableintheTransportationFundistherelationshipofhighwaymilestraveledtotheefficiencyofvehiclesonthehighway.Whilemilestraveledoverthe15yearperiod,from1990to2010increasedby82.0percent,theincreaseintheTransportationFundaveragedlessthan3.0percentannualgrowth.ThispresentsachallengeforrevenueavailableforpreservationandcapacityneedsforUtahhighwayinfrastructure.
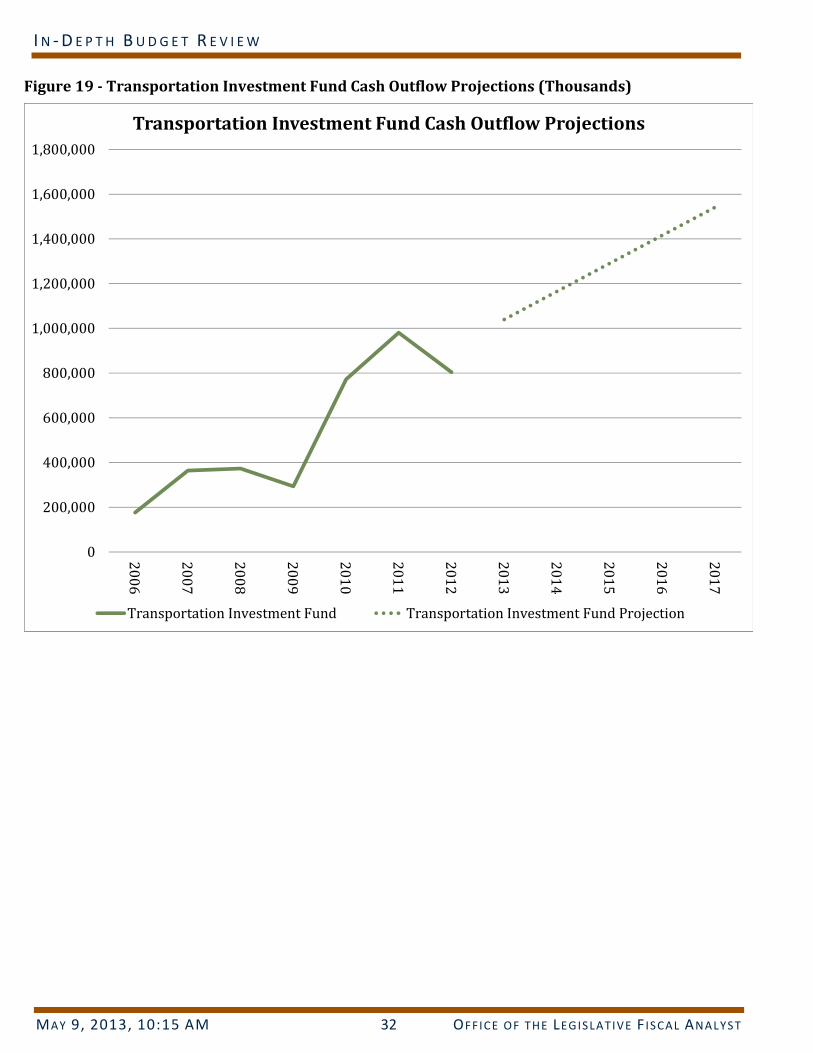
TheprojectionsforcashoutflowsclassifiedasTransportationaregiven(Figure18andFigure19).

OFFICE OF THE LEGISLATIVE FISCAL ANALYST 31 MAY 9, 2013, 10:15 AM
I N ‐DE P T H BUDG E T R E V I EW
Figure18‐TransportationFundCashOutflowProjections(Thousands)
0
200,000
400,000
600,000
800,000
1,000,000
1,200,000
1,400,000
1,600,000
1999
2000
2001
2002
2003
2004
2005
2006
2007
2008
2009
2010
2011
2012
2013
2014
2015
2016
2017
TransportationCashOutflowProjections
Transportation TransportationProjection
MAY 9, 2013, 10:15 AM 32 OFFICE OF THE LEGISLATIVE FISCAL ANALYST
I N ‐DE P T H BUDG E T R E V I EW
Figure19‐TransportationInvestmentFundCashOutflowProjections(Thousands)
0
200,000
400,000
600,000
800,000
1,000,000
1,200,000
1,400,000
1,600,000
1,800,000
2006
2007
2008
2009
2010
2011
2012
2013
2014
2015
2016
2017
TransportationInvestmentFundCashOutflowProjections
TransportationInvestmentFund TransportationInvestmentFundProjection

OFFICE OF THE LEGISLATIVE FISCAL ANALYST 33 MAY 9, 2013, 10:15 AM
I N ‐DE P T H BUDG E T R E V I EW
DEPARTMENTOFALCOHOLICBEVERAGECONTROLCASHOUTFLOW
Theprojectionforcashoutflowsincurredbythestate’sDABCbusinessisgiven(Figure20).Thelargestcomponentofcashoutflowcoversthecostsofgoodssold(i.e.PaymentstoSuppliers/Claims/Grants),followedbythecashtransferredtooverprogramswithinstategovernment(salestax,schoollunchtax,publicsafety),andemployeecosts/allothercosts.CashoutflowassociatedwithDABC’sbusinessactivityisanticipatedtogrowby$54.0million,oranaverageannualgrowthrateof3.3percent.Theprojected3.3percentgrowthrateisabout2.6percentbelowthehistoricalgrowthratefromFY1999toFY2012of5.9percent.
Figure20‐DABCCashOutflowProjection(Thousands)
0
50,000
100,000
150,000
200,000
250,000
2000
2001
2002
2003
2004
2005
2006
2007
2008
2009
2010
2011
2012
2013
2014
2015
2016
2017
DABCCashOutflowProjection
PaymentstoSuppliers/Claims/Grants
PaymentstoSuppliers/Claims/GrantsProjection
PaymentsofSales,SchoolLunch,andPremiumTaxes
PaymentsofSales,SchoolLunch,andPremiumTaxesProjection
DABC,Employeecosts,allother
DABC,Employeecosts,allotherProjection

MAY 9, 2013, 10:15 AM 34 OFFICE OF THE LEGISLATIVE FISCAL ANALYST
I N ‐DE P T H BUDG E T R E V I EW
ALLOTHERGOVERNMENTCASHOUTFLOW
TheprojectionsforcashoutflowsclassifiedasAllOtherGovernmentaregiven(Figure21).TheprojectedcashoutflowgrowthfromFY2012toFY2017comesoutat$269.0million,oranaverageannualincreaseof3.2percent.
Theprojectedgrowthrateisabout1.1percentbelowthehistoricalaverageannualgrowthrateof4.3percentfromFY1999toFY2012.
Figure21‐AllOtherGovernmentCashOutflowProjections(Thousands)
0
200,000
400,000
600,000
800,000
1,000,000
1,200,000
1,400,000
1,600,000
1,800,000
1999
2000
2001
2002
2003
2004
2005
2006
2007
2008
2009
2010
2011
2012
2013
2014
2015
2016
2017
AllOtherGovernmentCashOutflowProjections
AllOtherGovernment AllOtherGovernmentProjection

OFFICE OF THE LEGISLATIVE FISCAL ANALYST 35 MAY 9, 2013, 10:15 AM
I N ‐DE P T H BUDG E T R E V I EW
GASBMODELSVERSUSCURRENTPROJECTIONSOFREVENUE
TotesttheaccuracyofGASBguidelines,wecomparedtheseforecaststoactionstakenduringthe2013GeneralSession.Ineverycase,therearedifferencesbetweentheadoptedforecastsandGASBforecastsforFY2013andFY2014,thedetailsofwhicharediscussedherefortheGeneralFund,EducationFund,TransportationFund,andDepartmentofAlcoholicBeverageControl.ThedifferencesarelikelyduetoGASB’srelianceontrenddataratherthanconsideringtheimpactsofeconomicindicators.
GENERALFUNDREVENUE
FortheGeneralFund,GASB’ssalestaxprojectionforFY2013isabout$31.8millionbelowthecurrentconsensusforecast,whileGASB’sFY2014salesforecastisabout$19.5millionbelowthecurrentconsensussalestaxforecast.
OnallothersourcestotheGeneralFund,GASB’sFY2013forecastisabout$29.2millionbelowthecurrentconsensusforecast,andGASB’sFY2014forecastisabout$24.4millionbelowthecurrentconsensusforecast(Figure22andFigure23).Thecombineddifferenceis$61.1millioninFY2013and$43.9millioninFY2014.Inbothcases,GASB’sforecastisbelowthecurrentforecast.
Figure22‐DifferencesbetweenGeneralFundGASB/CurrentConsensusForecasts(Thousands)
0
200,000
400,000
600,000
800,000
1,000,000
1,200,000
1,400,000
1,600,000
1,800,000
2,000,000
1999
2000
2001
2002
2003
2004
2005
2006
2007
2008
2009
2010
2011
2012
2013
2014
2015
2016
2017
GeneralFundCashInflowProjections
Sales&UseTax AllOtherGeneralFund
Sales&UseTaxProjection AllOtherGeneralFundProjection
Sales&UseTaxAdopted AllOtherGeneralFundAdopted
See Detail View

MAY 9, 2013, 10:15 AM 36 OFFICE OF THE LEGISLATIVE FISCAL ANALYST
I N ‐DE P T H BUDG E T R E V I EW
Figure23–DetailView:DifferencesbetweenGeneralFundGASB/CurrentConsensusForecasts(Thousands)
EDUCATIONFUNDREVENUE
IncontrasttotheGeneralFundforecasts,GASBmodelsproducehigherEducationFundforecastsoverallforthetwolargestsources:individualincometaxandcorporateincometax.TheFY2013individualincometaxdifferenceis$27.9millionandtheFY2013corporateincometaxdifferenceis$15.3million.TheforecastsforFY2014differby$85.3millionforindividualincometaxand$86.9millionforcorporateincometax.ThecurrentforecastforallothersourcesishigherthanGASB’sforecast,withthecurrentconsensusforecastforallothersourcesbeing$16.5millionhigherinFY2013and$6.7millionhigherinFY2014.TheoveralldifferencebetweenGASBmodelsandthecurrentconsensusforecastsis$26.8millioninFY2013and$165.5millioninFY2014(Figure24andFigure25).

OFFICE OF THE LEGISLATIVE FISCAL ANALYST 37 MAY 9, 2013, 10:15 AM
I N ‐DE P T H BUDG E T R E V I EW
Figure24‐DifferencesbetweentheEducationFundGASB/CurrentConsensusForecasts(Thousands)
0
500,000
1,000,000
1,500,000
2,000,000
2,500,000
3,000,000
3,500,0001999
2000
2001
2002
2003
2004
2005
2006
2007
2008
2009
2010
2011
2012
2013
2014
2015
2016
2017
EducationFundCashInflowProjections
IndividualIncomeTax CorporateTax
AllOtherEducationFund IndividualIncomeTaxProjection
CorporateTaxProjection AllOtherEducationFundProjection
IndividualIncomeTaxAdopted CorporateTaxAdopted
AllOtherEducationFundAdopted
See Detail View

MAY 9, 2013, 10:15 AM 38 OFFICE OF THE LEGISLATIVE FISCAL ANALYST
I N ‐DE P T H BUDG E T R E V I EW
Figure25‐DetailView:DifferencesbetweentheEducationFundGASB/CurrentConsensusForecasts(Thousands)
Fiscal Year / Type / Projection Type
2013
All
Oth
er
Edu
catio
n
Fun
d
Cor
pora
te
Inco
me
Tax
Indi
vidu
al
Inco
me
Tax
2014
All
Oth
er
Edu
catio
n
Fun
d
Cor
pora
te
Inco
me
Tax
Indi
vidu
al
Inco
me
Tax
Ado
pted
GA
SB
Ado
pted
GA
SB
Ado
pted
GA
SB
Ado
pted
GA
SB
Ado
pted
GA
SB
Ado
pted
GA
SB
01
23
Am
ount
21,0
20
37,4
79 327,
928
312,
600
2,68
0,07
5
2,65
2,15
6
22,2
59
28,9
50 372,
371
285,
450
2,83
4,23
0
2,74
8,95
0
Detail View: Education Fund Differences
Projection Type
Adopted
GASB
Sources: LFA

OFFICE OF THE LEGISLATIVE FISCAL ANALYST 39 MAY 9, 2013, 10:15 AM
I N ‐DE P T H BUDG E T R E V I EW
TRANSPORTATIONFUNDREVENUE
OntheTransportationFund,threesourcesareprojected:motorfueltax,specialfueltax,andallothersources.InFY2013andFY2014andforallthreesources,GASB’sforecastsarehigherthanthecurrentconsensus.GASB’sforecastformotorfueltaxis$3.0millionhigherinFY2013and$0.9millionhigherinFY2014;GASB’sforecastforspecialfueltaxis$10.1millionhigherinFY2013and$16.1millioninFY2014;andGASB’sforecastforallothersourcesis$3.0millionhigherinFY2013and$3.8millionhigherinFY2014(Figure26andFigure27).Insummingallsources,GASB’sforecastis$16.0millionhigherinFY2013and$20.8millionhigherinFY2014.
Figure26‐DifferencesbetweentheTransportationFundGASB/CurrentConsensusForecasts(Thousands)
0
50,000
100,000
150,000
200,000
250,000
300,000
1999
2000
2001
2002
2003
2004
2005
2006
2007
2008
2009
2010
2011
2012
2013
2014
2015
2016
2017
TransportationFundCashInflowProjections
Motor Fuel Tax Special Fuel Tax
All Other Transportation Fund Revenue Motor Fuel Tax Projection
Special Fuel Tax Projection All Other Transportation Fund Revenue Projection
Motor Fuel Tax Adopted Special Fuel Tax Adopted
All Other Transportation Fund Adopted
See Detail View

MAY 9, 2013, 10:15 AM 40 OFFICE OF THE LEGISLATIVE FISCAL ANALYST
I N ‐DE P T H BUDG E T R E V I EW
Figure27–DetailView:DifferencesbetweentheTransportationFundGASB/CurrentConsensusForecasts(Thousands)
Fiscal Year / Type / Projection Type
2013
All
Oth
er
Tra
nspo
rtat
ion
F
und
Rev
enue
Mot
or F
uel
Tax
Spe
cial
Fue
l T
ax
2014
All
Oth
er
Tra
nspo
rtat
ion
F
und
Rev
enue
Mot
or F
uel
Tax
Spe
cial
Fue
l T
ax
Ado
pted
GA
SB
Ado
pted
GA
SB
Ado
pted
GA
SB
Ado
pted
GA
SB
Ado
pted
GA
SB
Ado
pted
GA
SB
0K
50K
100K
150K
200K
250K
300K
Am
ount
85,2
86
82,3
00
253,
670
250,
700
109,
569
99,5
00
87,4
14
83,5
94
255,
325
254,
400
115,
552
99,5
00
Detail View: Transportation Fund Differences
Projection Type
Adopted
GASB
Sources: LFA

OFFICE OF THE LEGISLATIVE FISCAL ANALYST 41 MAY 9, 2013, 10:15 AM
I N ‐DE P T H BUDG E T R E V I EW
TRANSPORTATIONINVESTMENTFUNDREVENUE
OntheTransportationInvestmentFund,threesourcesareprojected:salestax,motorvehicleregistrationfees,andallothersources.GASB’sforecastforsalestaxis$22.0millionbelowinFY2013and$13.6millionlowerinFY2014;GASB’sforecastformotorvehicleregistrationfeesis$0.7millionlowerinFY2013and$1.5millioninFY2014;andGASB’sforecastforallothersourcesis$33.0millionhigherinFY2013and$38.0millionhigherinFY2014(Figure28andFigure29).Insummingallsources,GASB’sforecastis$10.3millionhigherinFY2013and$22.9millionhigherinFY2014.
Figure28–DifferencebetweentheTransportationInvestmentFundGASB/CurrentConsensusForecasts(Thousands)
0
100,000
200,000
300,000
400,000
500,000
600,000
2006 2007 2008 2009 2010 2011 2012 2013 2014 2015 2016 2017
TransportationInvestmentFundCashInflowProjections
Salestax SalestaxprojectionMotorVehicleRegistrationFees MotorVehicleRegistrationFeesProjectionAllOtherTIFRevenue AllOtherTIFRevenueProjectionSalestaxadopted MotorVehicleRegistrationFeesAdoptedAllOtherTIFRevenueAdopted
See Detail View
Note: The drop in sales tax in FY 2011 is due to a decline in the 8.3% earmark to 1.93% for FY 2011 only; the increases and decreases in the "All Other TIF Revenue" is due to budgeting changes made to the Critical Highway Needs Fund; the diagonal growth in sales tax for FY 2013 onward is due to SB 129 of the 2011 Veto Override Session, which prioritizes 30% of sales tax growth to the TIF

MAY 9, 2013, 10:15 AM 42 OFFICE OF THE LEGISLATIVE FISCAL ANALYST
I N ‐DE P T H BUDG E T R E V I EW
Figure29‐DetailView:DifferencebetweentheTransportationInvestmentFundGASB/CurrentConsensusForecasts(Thousands)
Fiscal Year / Type / Projection Type
2013
All
Oth
er T
IF
Rev
enue
Mot
or V
ehic
le
Reg
istr
atio
n
Fee
s
Sal
es T
ax
2014
All
Oth
er T
IF
Rev
enue
Mot
or V
ehic
le
Reg
istr
atio
n
Fee
s
Sal
es T
ax
Ado
pted
GA
SB
Ado
pted
GA
SB
Ado
pted
GA
SB
Ado
pted
GA
SB
Ado
pted
GA
SB
Ado
pted
GA
SB
0K
100K
200K
300K
400K
Am
ount
138,
704
105,
733
72,8
57
73,5
70
351,
572
373,
531
144,
069
106,
156
74,0
27
75,4
83
395,
633
409,
240
Detail View: Transportation Investment Fund (thousands)
Projection Type
Adopted
GASB
Sources: LFA

OFFICE OF THE LEGISLATIVE FISCAL ANALYST 43 MAY 9, 2013, 10:15 AM
I N ‐DE P T H BUDG E T R E V I EW
DABCREVENUE
OnrevenuefromDABCbusinessactivities,theadoptedreceiptsfigureis$1.8millionbelowtheFY2013GASBforecastand$2.6millionbelowtheFY2014GASBforecastasshown(Figure30andFigure31).
Figure30–DifferencebetweentheDABCCashInflowGASB/CurrentConsensusForecasts(Thousands)
0
50,000
100,000
150,000
200,000
250,000
300,000
350,000
400,000
450,000
2000
2001
2002
2003
2004
2005
2006
2007
2008
2009
2010
2011
2012
2013
2014
2015
2016
2017
DABCCashInflowProjections
Receipts ReceiptsProjections DABCReceiptsAdopted
See Detail View

MAY 9, 2013, 10:15 AM 44 OFFICE OF THE LEGISLATIVE FISCAL ANALYST
I N ‐DE P T H BUDG E T R E V I EW
Figure31‐DetailView:DifferencebetweenDABCCashInflowGASB/CurrentConsensusForecasts(Thousands)
Fiscal Year / Type / Projection Type
2013
Rec
eipt
s
2014
Rec
eipt
s
Adopted GASB Adopted GASB
0K
50K
100K
150K
200K
250K
300K
350K
400K
Am
ount
336,715347,277 349,655
371,586
Detail View: DABC Cash Inflow
Projection Type
Adopted
GASB
Sources: LFA

OFFICE OF THE LEGISLATIVE FISCAL ANALYST 45 MAY 9, 2013, 10:15 AM
I N ‐DE P T H BUDG E T R E V I EW
GASBMODELSVERSUSCURRENTPROJECTIONSOFEXPENDITURES
ThedifferencesbetweenprojectionsofexpendituresbasedonGASBrequirementsandadoptedexpendituresarepresentedherefortheHumanServices,HealthandEnvironmentalQuality,HigherEducation,PublicEducation,Transportation,TransportationInvestment,AllOtherGovernmental,andDABCcashoutflows.ActualappropriationswerelowerthanGASB’smodelforecast.TheselowerappropriationscanbeattributedtotheLegislature’srequirementforabalancedbudgetanditsfocusonsustainablegrowthrates.
HUMANSERVICESEXPENDITURES
TheHumanServices,GASB’sprojectionforFY2013isabout$14.0millionabovethe2013GeneralSessionappropriationof$706.0million,whileGASB’sFY2014forecastisabout$24.0millionabovethecurrentFY2013$712.0millionappropriation.ThedifferenceinFigures32and33betweenHumanServicesAppropriated(Adopted)andHumanServicesProjection(GASB)providesagraphicviewoftheunderlyingfactorsinthetrendline:1)theHumanServicestrendlineinFigure32consistsofthethreemajorfactorsdiscussedintheearlierexpendituresection,2)theHumanServicesProjectionlinereflectsthecompositehistoryofthethreemajorfactors,and3)theHumanServicesAppropriatedreflectsthepreviousstatement“whenrevenuesareavailable,theDepartmentofHumanServiceshasreceivedfunding”for“highprioritysocialissues.”TheHumanServicesAppropriatedlinesimplyreflectstheappropriationinayearduringthelongtermrevenuecyclewhenrevenueisgrowingatasmallerincrease.ThesmallerappropriationsimplyreflectsthattheLegislatureappropriatedlessbecauseofthatyearlysmallerincreasethanthelongtermtrendwouldsuggestforanygivenyear.ThesectionsthatfollowforHealthandEnvironmentalQuality,HigherEducation,PublicEducation,TransportationandDABCfollowthissameapproach.

MAY 9, 2013, 10:15 AM 46 OFFICE OF THE LEGISLATIVE FISCAL ANALYST
I N ‐DE P T H BUDG E T R E V I EW
Figure32‐DifferencesbetweentheHumanServicesGASB/CurrentConsensusForecasts(Thousands)
0
100,000
200,000
300,000
400,000
500,000
600,000
700,000
800,000
900,000
1999
2000
2001
2002
2003
2004
2005
2006
2007
2008
2009
2010
2011
2012
2013
2014
2015
2016
2017
HumanServicesCashOutflowProjections
HumanServices HumanServicesProjection HumanServicesAppropriated
See DetailView

OFFICE OF THE LEGISLATIVE FISCAL ANALYST 47 MAY 9, 2013, 10:15 AM
I N ‐DE P T H BUDG E T R E V I EW
Figure33–DetailView:DifferencesbetweentheHumanServicesGASB/CurrentConsensusForecasts(Thousands)
Fiscal Year / Type / Projection Type
2013 2014
Adopted GASB Adopted GASB
0K
100K
200K
300K
400K
500K
600K
700K
800K
719,758706,137
736,193711,797
Detail View: Human Services Cash Outflow,Differences
Projection Type
Adopted
GASB
Sources: LFA

MAY 9, 2013, 10:15 AM 48 OFFICE OF THE LEGISLATIVE FISCAL ANALYST
I N ‐DE P T H BUDG E T R E V I EW
HEALTHANDENVIRONMENTALQUALITYEXPENDITURES
TheHealthandEnvironmentalQuality,GASB’sprojectionforFY2013isabout$20.0millionabovethe2013GeneralSessionappropriationof$2.6billion,whileGASB’sFY2014forecastisabout$26.0millionabovethecurrentappropriationof$2.7billion(Figure34andFigure35).
Figure34–DifferencesbetweentheHealthandEnvironmentalQualityCashOutflowGASB/CurrentConsensusForecasts(Thousands)
0
500,000
1,000,000
1,500,000
2,000,000
2,500,000
3,000,000
3,500,000
1999
2000
2001
2002
2003
2004
2005
2006
2007
2008
2009
2010
2011
2012
2013
2014
2015
2016
2017
HealthandEnvironmentalQualityCashOutflowProjections
HealthandEnvironmentalQuality
HealthandEnvironmentalQualityProjection
HealthandEnvironmentalQualityAppropriated

OFFICE OF THE LEGISLATIVE FISCAL ANALYST 49 MAY 9, 2013, 10:15 AM
I N ‐DE P T H BUDG E T R E V I EW
Figure35–DetailView:DifferencesbetweentheHealthandEnvironmentalQualityCashOutflowGASB/CurrentConsensusForecasts(Thousands)

MAY 9, 2013, 10:15 AM 50 OFFICE OF THE LEGISLATIVE FISCAL ANALYST
I N ‐DE P T H BUDG E T R E V I EW
HIGHEREDUCATIONEXPENDITURES
TheHigherEducation,GASB’sprojectionforFY2013isabout$46.0millionabovethe2013GeneralSessionappropriationof$1.4billion,whileGASB’sFY2014forecastisabout$19.0millionabovethecurrentappropriationof$1.5billion(Figure36andFigure37).
Figure36‐DifferencesbetweentheHigherEducationGASB/CurrentConsensusForecasts(Thousands)
0
200,000
400,000
600,000
800,000
1,000,000
1,200,000
1,400,000
1,600,000
1,800,000
1999
2000
2001
2002
2003
2004
2005
2006
2007
2008
2009
2010
2011
2012
2013
2014
2015
2016
2017
HigherEducationCashOutflowProjections
HigherEducation HigherEducationProjection HigherEducationAppropriated
See Detail View

OFFICE OF THE LEGISLATIVE FISCAL ANALYST 51 MAY 9, 2013, 10:15 AM
I N ‐DE P T H BUDG E T R E V I EW
Figure37‐DetailView:DifferencesbetweentheHigherEducationGASB/CurrentConsensusForecasts(Thousands)
Fiscal Year / Type / Projection Type
2013
Hig
her
Edu
catio
n
2014
Hig
her
Edu
catio
n
Adopted GASB Adopted GASB
0K
200K
400K
600K
800K
1000K
1200K
1400K
1600K
Am
ount
1,443,6671,397,898
1,497,7381,478,582
Detail View: Higher Education Cash OutflowDifferences
Projection Type
Adopted
GASB
Sources: LFA

MAY 9, 2013, 10:15 AM 52 OFFICE OF THE LEGISLATIVE FISCAL ANALYST
I N ‐DE P T H BUDG E T R E V I EW
PUBLICEDUCATIONEXPENDITURES
GASB‐basedPublicEducationprojectionsareabout$102.9millioninFY2013and$221.0millioninFY2014higherthantheadoptedPublicEducationappropriations9.Althoughactualcostsarelowerthanexpected,theadoptedcostsincludea2.0percentincreaseintheWPUvalueandcontinuedfundingofstudentenrollmentonanaveragecostbasis(Figure38andFigure39).
Figure38‐DifferencesbetweenthePublicEducationGASB/CurrentConsensusForecasts(Thousands)
9Intheappropriationsprocess,localrevenueisincluded,representingabout$600millioninFY2014.LocalrevenueisnotincludedintheCAFR.
0
500,000
1,000,000
1,500,000
2,000,000
2,500,000
3,000,000
3,500,000
4,000,000
4,500,000
1999
2000
2001
2002
2003
2004
2005
2006
2007
2008
2009
2010
2011
2012
2013
2014
2015
2016
2017
PublicEducationCashOutflowProjections
PublicEducation PublicEducationProjections PublicEducationAppropriations

OFFICE OF THE LEGISLATIVE FISCAL ANALYST 53 MAY 9, 2013, 10:15 AM
I N ‐DE P T H BUDG E T R E V I EW
Figure39–DetailView:DifferencesbetweenthePublicEducationGASB/CurrentConsensusForecasts(Thousands)
Fiscal Year / Type / Projection Type
2013
Pub
lic
Edu
catio
n
2014
Pub
lic
Edu
catio
n
Adopted GASB Adopted GASB
0K
500K
1000K
1500K
2000K
2500K
3000K
3500K
Am
ount
3,208,4123,149,869
3,451,897
3,266,414
Detail View: Public Education Cash Outflow
Projection Type
Adopted
GASB
Sources: LFA

MAY 9, 2013, 10:15 AM 54 OFFICE OF THE LEGISLATIVE FISCAL ANALYST
I N ‐DE P T H BUDG E T R E V I EW
TRANSPORTATIONEXPENDITURES
AdoptedtransportationexpenditurescomparedtoprojectionsbaseduponGASB’srequirementsareabout$561.9millionaboveinFY2013andabout$58.3millionbelowinFY2014(Figure40andFigure41).
Figure40‐DifferencesbetweentheTransportationFundRelatedTransportationCashOutflowGASB/CurrentConsensusForecasts(Thousands)
0
200,000
400,000
600,000
800,000
1,000,000
1,200,000
1,400,000
1,600,000
1,800,000
2,000,000
1999
2000
2001
2002
2003
2004
2005
2006
2007
2008
2009
2010
2011
2012
2013
2014
2015
2016
2017
TransportationCashOutflowProjections
Transportation TransportationProjection TransportationAdopted
See Detail View

OFFICE OF THE LEGISLATIVE FISCAL ANALYST 55 MAY 9, 2013, 10:15 AM
I N ‐DE P T H BUDG E T R E V I EW
Figure41–DetailView:DifferencesbetweentheTransportationFundRelatedTransportationCashOutflowGASB/CurrentConsensusForecasts(Thousands)

MAY 9, 2013, 10:15 AM 56 OFFICE OF THE LEGISLATIVE FISCAL ANALYST
I N ‐DE P T H BUDG E T R E V I EW
TRANSPORTATIONINVESTMENTEXPENDITURES
TheforecastsbaseduponGASB’sproposedmethodologyareabout$292.6millioninFY2013and$610.1millioninFY2014abovetheadoptedfigures(Figure42andFigure43).Thedifferenceisduetotheeffectbondinghasontheforecastmethodology.
Figure42‐DifferencesbetweentheTransportationInvestmentFundCashOutflowGASB/CurrentConsensusForecasts(Thousands)
0
200,000
400,000
600,000
800,000
1,000,000
1,200,000
1,400,000
1,600,000
1,800,000
2006
2007
2008
2009
2010
2011
2012
2013
2014
2015
2016
2017
TransportationInvestmentFundCashOutflowProjections
TransportationInvestmentFund TransportationInvestmentFundProjection
TransportationInvestmentFundAdopted

OFFICE OF THE LEGISLATIVE FISCAL ANALYST 57 MAY 9, 2013, 10:15 AM
I N ‐DE P T H BUDG E T R E V I EW
Figure43–DetailView:DifferencesbetweentheTransportationInvestmentFundCashOutflowGASB/CurrentConsensusForecasts(Thousands)
Fiscal Year / Type / Projection Type
2013 2014
Adopted GASB Adopted GASB
0K
200K
400K
600K
800K
1000K
1200K
1400K
1,255,944
747,000
1,315,324
555,000
Detail View: Transportation Investment FundCash Outflow
Projection Type
Adopted
GASB
Sources: LFA

MAY 9, 2013, 10:15 AM 58 OFFICE OF THE LEGISLATIVE FISCAL ANALYST
I N ‐DE P T H BUDG E T R E V I EW
DABCEXPENDITURES
Overall,theprojectionbasedonGASBcriteriais$3.4millionbelowinFY2013and$4.6millionaboveinFY2014whencomparedagainstthecurrentadoptedfigures(Figure44andFigure45).
Figure44‐DifferencesbetweentheDABCCashOutflowGASB/CurrentConsensusForecasts(Thousands)
0
50,000
100,000
150,000
200,000
250,000
2000
2001
2002
2003
2004
2005
2006
2007
2008
2009
2010
2011
2012
2013
2014
2015
2016
2017
DABCCashOutflowProjection
PaymentstoSuppliers/Claims/GrantsPaymentstoSuppliers/Claims/GrantsProjectionPaymentsofSales,SchoolLunch,andPremiumTaxesPaymentsofSales,SchoolLunch,andPremiumTaxesProjectionDABC,Employeecosts,allotherDABC,Employeecosts,allotherProjectionDABC,PaymentstoSuppliers/Claims/GrantsAdoptedDABC,PaymentsofSales,SchoolLunch,andPremiumTaxesAdoptedDABC,Employeecosts,allotherAdopted

OFFICE OF THE LEGISLATIVE FISCAL ANALYST 59 MAY 9, 2013, 10:15 AM
I N ‐DE P T H BUDG E T R E V I EW
Figure45–DetailView:DifferencesbetweentheDABCCashOutflowGASB/CurrentConsensusForecasts(Thousands)
Fiscal Year / Type / Projection Type
2013E
mpl
oyee
co
sts,
all
othe
r
Pay
men
ts o
f S
ales
, Sch
ool
Lunc
h, a
nd
Pre
miu
m
Tax
es
Pay
men
ts to
S
uppl
iers
/Cla
im
s/G
rant
s
2014
Em
ploy
ee
cost
s, a
ll ot
her
Pay
men
ts o
f S
ales
, Sch
ool
Lunc
h, a
nd
Pre
miu
m
Tax
es
Pay
men
ts to
S
uppl
iers
/Cla
im
s/G
rant
s
Ado
pted
GA
SB
Ado
pted
GA
SB
Ado
pted
GA
SB
Ado
pted
GA
SB
Ado
pted
GA
SB
Ado
pted
GA
SB
0K
50K
100K
150K
200K
Am
ount
21,1
16
19,2
20
51,1
46
56,4
67
183,
833
176,
972
21,9
66
21,8
47
53,6
19
60,4
20
191,
423
189,
360
Detail View: DABC Cash Outflow
Projection Type
Adopted
GASB
Sources: LFA

MAY 9, 2013, 10:15 AM 60 OFFICE OF THE LEGISLATIVE FISCAL ANALYST
I N ‐DE P T H BUDG E T R E V I EW
ALLOTHERGOVERNMENTALEXPENDITURES
TheforecastsbaseduponGASB’sproposedmethodologyareabout$57.0millionbelowinFY2013and$35.0millionaboveinFY2014theadoptedfigures(Figure46andFigure47).
Figure46‐DifferencesbetweentheAllOtherGovernmentCashOutflowGASB/CurrentConsensusForecasts(Thousands)
0
200,000
400,000
600,000
800,000
1,000,000
1,200,000
1,400,000
1,600,000
1,800,000
1999
2000
2001
2002
2003
2004
2005
2006
2007
2008
2009
2010
2011
2012
2013
2014
2015
2016
2017
AllOtherGovernmentCashOutflowProjections
AllOtherGovernment AllOtherGovernmentProjection
AllOtherGovernmentAppropriated
See Detail View

OFFICE OF THE LEGISLATIVE FISCAL ANALYST 61 MAY 9, 2013, 10:15 AM
I N ‐DE P T H BUDG E T R E V I EW
Figure47–DetailView:DifferencesbetweentheAllOtherGovernmentCashOutflowGASB/CurrentConsensusForecasts

MAY 9, 2013, 10:15 AM 62 OFFICE OF THE LEGISLATIVE FISCAL ANALYST
I N ‐DE P T H BUDG E T R E V I EW
COMPONENT3:TOTALFINANCIALOBLIGATIONS
GASBarguesthatlongrunforecastsofpotentialdebtobligationssuchaspensions,OPEB,andotherlongtermcontractsarenecessaryinordertomeasureagovernmentalentity’sabilitytoachieveintergenerationalequity.Projectionsofthesefinancialobligationshelpusersassessthegovernment’sabilitytopayforitsdebtandotherfinancialobligationsovertime.
Anarrativediscussionoftheobligationsidentifyingtheknowncausesoffluctuationscanassistusersinunderstandingthelongrunviabilityofthegovernmentalentity.Theinformationwillbeparticularlyhelpfulinshowingthoseinstanceswhereannualpaymentsmadeforobligationsdonotmeettheactualcostoftheobligations.
PensionsandOPEB
ProjectionsoffinancialobligationssuchasunfundedpensionliabilitiesandOPEBreflectthefinancialimpactofpastdecisionsandhelpusersidentifyfutureliabilitiesandassessthegovernment’sabilitytomeettheseobligations.
Utah’sStateEmployees’OPEBplanisadministeredthroughtheStatePostRetirementBenefitsTrustFund.Theassetsofthetrustarededicatedtoprovidingcoveragetoeligibleemployees.OverthepasttwoyearstheStatehasexperiencedadecreaseintheaccruedliabilityofthefundduetothreefactors:1)fullyfundingtheAnnualRequiredContributionoverthelasttwofiscalyears;2)changesinbenefitprovisionsthatshiftedincreasesinhealthcarecoststoemployeesandretirees;and3)theStateEmployees’planisaclosedplan(onlystateemployeesentitledtoreceivebenefitsandhiredbeforeJanuary1,2006areeligible).
UtahrecognizeditsOPEBliabilityin2005andtookactiontostopitsgrowth.H.B.213,2005GeneralSession,“UnusedSickLeaveatRetirementAmendments,”closedmoststateemployees’(excludingelectedofficialsandemployeesoftheStateBoardofEducationhiredbeforeJuly1,2012)optiontoaccumulatesickleaveandexchangeitforpost‐retirementstate‐paidmedicalinsurance(thiswasknownas“ProgramI”sickleave).SubsequentactionsdescribedonthefollowingpagealsoclosedtheoptionsforelectedofficialsandemployeesoftheStateBoardofEducation.TheState’sAnnualRequiredContribution(ARC)toamortizeitsOPEBliabilityover25yearsiscurrently$37.6million,downfromahighof$53.5millionin2006.Thistrendisexpectedtocontinueovertheperiodoftheforecast,throughFY2017.Thefollowingtables(Table1andTable2)showthehistorybehindtheOPEBProgram.
Table1‐UtahEmployees’OPEBPlanLiability,Assets,andRequiredContributions
UnfundedActuarial Actuarial Actuarial AnnualAccrued Value Accued Funded Required
Year Liability ofAssets Liability Ratio Contribution*2006 669,617,000 ‐ 669,617,000 0% 53,491,0002008 446,601,300 53,851,100 392,750,200 12% 43,819,0002010 481,392,500 106,604,700 374,787,800 22% 37,593,600
*InitialEstimate
UtahEmployees'OPEBPlan

OFFICE OF THE LEGISLATIVE FISCAL ANALYST 63 MAY 9, 2013, 10:15 AM
I N ‐DE P T H BUDG E T R E V I EW
Table2‐StateEmployeeOPEBPlanScheduleofEmployerContributions
InadditiontoH.B.213,theLegislaturehastakenstepstolimitfutureretirementliabilityasfollows:
S.B.43,2010GeneralSession,“Post‐RetirementEmploymentAmendments”repealedarequirementthatacoveredemployerwhohiresorrehiresaretireecontributetoaqualifieddefinedcontributionplan(e.g.a401k)forthatemployeethesamepercentageofsalarythattheemployerwouldotherwisepaytothedefinedbenefitsretirementsystem.
S.B.63,2010GeneralSession,“NewPublicEmployees’TierIIContributoryRetirementAct”createdforemployeeshiredonorafterJuly1,2011alowercosthybridsysteminwhichdefinedcontributionsplayalargerrole.Thestatewillusesavingsfromthenewsystemtomaintainthecurrentretirementsystemforexistingemployees.ThebillalsoclosedtheUtahGovernors’andLegislators’retirementplan:newofficialswhotakeofficeafterJuly1,2011areonlyeligibletoparticipateinthestate’sdefinedcontributionplan,andarenoteligibleforpost‐retirementMedicaresupplementalcoverage.
S.B.156,2012GeneralSession,“ElectedOfficialRetirementBenefitsAmendments”eliminatedthethree‐yearwindowpost‐retirementhealthinsuranceplanforlegislatorsandgovernors,includingtheirspouses,whobeginelectedserviceforthefirsttimeafterJanuary1,2012.
H.B.194,2013GeneralSession,“StateEmployeeBenefitsAmendments”createdanewsickleaveprogram.AllsickleavehoursaccruedafterJanuary4,2014willhavenobenefitatretirementortermination.Thestatewillnowmatchaportionofabenefitedemployee’s401(k)contributionatanamounttobedeterminedlater.
InSeptember2012,theStateSchoolBoardeliminateditspost‐retirementhealthinsuranceincentiveplanforeducationemployeeshiredonorafterJuly1,2012.
StateEmployeeOPEBPlanScheduleofEmployerContributions
AnnualRequired PercentageYearEnded Contributions ContributedJune30,2007 50,433,000 101.37%June30,2008 53,491,000 98.71%June30,2009 53,491,000 100.00%June30,2010 43,819,000 100.00%June30,2011 43,819,000 100.00%June30,2012 37,594,000 115.16%

MAY 9, 2013, 10:15 AM 64 OFFICE OF THE LEGISLATIVE FISCAL ANALYST
I N ‐DE P T H BUDG E T R E V I EW
Priortotheeconomicdownturnof2008,theUtahRetirementsSystems’fundedratios(assetsdividedbyliabilities)wereconsistentlybetween91.0and95.0percent.Sincethedownturn,ratioshavebeenapproximatelyinthe80.0to85.0percentrange.URShasrequestedandreceivedrateincreasesfromtheLegislaturetohelpmakeupforsomeofthoselosses.Table3‐UtahRetirementSystemsStateandSchool
Anaccountingoftotalfinancialobligationisnecessaryfortheanalysisinordertoassessthepotentialliabilityofthestateforseverallongtermcontracts.Byincludingthetotalfinancialobligationsinthereportuserscanassesswhetherornotthestatehastheresourcestopayforlongtermcommitmentswithoutshiftingtheburdenforwardtofuturegenerations.Lookingatcurrentpoliciesandbudgetallocations,Utahappearstobeasustainablepathgoingforward.
UtahRetirementSystemsStateandSchool
UnfundedActuarial Actuarial ActuarialAccrued Value Accrued Funded
Year Liability ofAssets Liability Ratio
2007 14,192,132,000 13,418,901,000 773,231,000 95%2008 15,236,262,000 13,095,537,000 2,140,725,000 86%2009 16,082,824,000 13,703,112,000 2,379,712,000 85%2010 16,813,392,000 13,859,037,000 2,954,355,000 82%2011 17,694,698,000 13,819,201,000 3,875,497,000 78%2012 * 17,830,502,000 13,635,131,000 4,195,371,000 76%2013 * 18,673,344,000 14,568,544,000 4,104,800,000 78%2014 * 19,493,846,000 15,380,220,000 4,113,626,000 79%2015 * 20,289,551,000 16,056,193,000 4,233,358,000 79%2016 * 21,058,248,000 16,845,697,000 4,212,551,000 80%
*ProjectedValues

OFFICE OF THE LEGISLATIVE FISCAL ANALYST 65 MAY 9, 2013, 10:15 AM
I N ‐DE P T H BUDG E T R E V I EW
COMPONENT4:DEBTSERVICE
GASBrecommendsthatannualdebtservicepaymentsbeforecastinordertoassessagovernmentalentity’sabilitytomeettheannualpaymentsastheycomedue.Thisinformationcanthenbemeasuredagainstothercashoutflows.TheCAFRalreadyincludescurrentdebtservicecosts,theprojectionwouldrequirethatthesebeforecastforfiveyearsbeyondtheactualyear.Bothprincipalandinterestshouldbeincludedintheforecast.
Currentprojectionsdonotincludethecashoutflowsoffutureannualprincipalandinterestpaymentsofbondobligationsthathavebeenauthorized(butnotyetissued).Forthepurposesofthereportthefutureannualprincipalandinterestpaymentsonlyneedtobeincludedifitisexpectedthatthoseauthorizationswillbeissuedduringtheprojectionperiod.GASBarguesthatannualprojectionsofdebtservicewillprovideuserswithabasisforassessingthemagnitudeofdebtservicepaymentsincomparisontootherongoingcashoutflows.
OneoftheState’sprimarytoolstofinancelargecapitalprojectssuchashighwaysandbuildingsareGeneralObligation(GO)bonds.Eachyear,UtahappropriatesanamountsufficienttopayGOprincipal,interest,andfeesinordertoavoidlevyingastatepropertytax.Utahhasneverdefaultedonabondissuancenorresortedtoapropertytaxlevytopaydebtservice.DebtservicefortheStateisshownthroughFY2008throughFY2017forbondsthathavebeenissued.
Table4–DebtService
Utahcurrentlyhasfourbondsthathavebeenauthorizedbutnotyetissued:
CapitalFacilityProjects
o 2004AuthorizationHouseBill2:$1,623,400
o 2008AuthorizationSenateBill298:$42,500,000
HighwayProjects
o 2007AuthorizationHouseBill314:$1,165,200
o 2009AuthorizationHouseBill185:$313,318,200.
WhileGASBstatesthatfutureannualprincipalandinterestpaymentsneedtobeincludedifitisexpectedtheauthorizationswillbeissuedduringtheprojectionperiod,itisunclearwhentheunissuedbondsmay
Year Principal InterestFY2008 150,660,000 56,445,878FY2009 167,700,000 54,029,711FY2010 175,490,000 96,203,814FY2011 209,060,000 124,656,587FY2012 251,130,000 154,103,900FY2013 295,470,000 143,043,124FY2014 314,855,000 129,779,074FY2015 292,515,000 115,843,144FY2016 320,180,000 100,817,394FY2017 313,285,000 85,789,619
DebtService

MAY 9, 2013, 10:15 AM 66 OFFICE OF THE LEGISLATIVE FISCAL ANALYST
I N ‐DE P T H BUDG E T R E V I EW
beissued.AuthorizationisatthediscretionoftheLegislature.Duetotheuncertaintyofwhentheymaybeissued,wehavenotedtheminthisreportbuthavenotincludedtheminthedebtserviceschedule.

OFFICE OF THE LEGISLATIVE FISCAL ANALYST 67 MAY 9, 2013, 10:15 AM
I N ‐DE P T H BUDG E T R E V I EW
COMPONENT5:GOVERNMENTALINTERDEPENDENCE
Bydefinition,state‐federalprogramscreateapermanentfiscalinterdependencytyingthestateandfederalgovernmenttogetherinthelongrun.Duetothenatureofserviceinterdependencies,GASBhasdeterminedthatquantitativeprojectionswouldimposeunduecostforthepotentialbenefitandwouldnotprovideanymeaningfulfigures.Rather,GASBhasdeterminedthatthisinformationshouldbecompletelyinnarrativeform.GovernmentalinterdependenceinUtahisintheformofresourcedependenceratherthanserviceinterdependence.
Keymeasuresofintergovernmentalinterdependenceare10:
Directfederalrevenuetoastate.
Percentageoftotalstaterevenue(allsources).
Directfederalgrantstolocalgovernments,federalpurchasesfromstatebusinesses.
Federalpaymentstoindividuals(e.g.:wages,pensions,SocialSecurity,Medicare).
Totaldirectandindirectfederalflows.
Realgrossdomesticproduct(GDP)bystate.
TotalfederalflowsasapercentofstateGDP.
Fortheon‐booksaccountsandrevenuesourcescoveredbythisreport,duringFY2012,theStatereceived$3.5billionfromthefederalgovernment–30.7percentoftotalstaterevenuescoveredbythisreport.FundsflowingfromthefederalgovernmenttotheStatearesubjecttochangestofederallawsandappropriations.Basedonthereportedfinancialpositionofthefederalgovernment,includingdisclosuresconcerningfiscalsustainability,itisatleastreasonablypossiblethateventswilloccurintheneartermthatwillsignificantlyaffecttheflowsoffederalfundstotheState.Theseincludethefollowing:
SequestrationScenario
CoveredGrantsReductionfromFY2012(FullYear)(ThousandsofDollars)
AmountTypeofGrant
BoatingSafety (68) StateEmergencyManagementPerformanceGrants (333) StateStateHomelandSecurityGrantProgram (214) StateCrimeVictimsFund–Assistance (305) StateJusticeAssistanceGrants (123) StateJuvenileAccountabilityBlockGrant (22) StateJuvenileJusticeFormulaGrants (31) StateRes.SubstanceAbuseTreatment‐StatePrisoners (5) StateStateCriminalAlienAssistanceProgram (100) StateViolenceAgainstWomen (105) StateCoopStateResearchAnimalHealth/Disease (2) StateCoopStateResearchCoopForestry (19) StateCoopStateResearchHatchAct (174) StateExtensionServiceExpandFood&Nutrition (31) State10Source:USCensusBureau,“StateandLocalGovernmentFinanceSummaryReport”

MAY 9, 2013, 10:15 AM 68 OFFICE OF THE LEGISLATIVE FISCAL ANALYST
I N ‐DE P T H BUDG E T R E V I EW
ExtensionServicePestManagement (5) StateExtensionServiceRenewableResources (4) StateExtensionServiceSmithLever (128) StateForestService‐NationalForests (804) StateSpecialMilkProgram (6) StateSpecialtyCropBlockGrant (22) StateWIC‐SupplementalFeedingProgram (3,576) State21stCenturyCommunityLearningCenters (480) StateAdultEducationBasicGrant (212) StateAssistiveTechnologyStateGrantProgram (34) StateClientAssistanceStateGrants (9) StateCompEd(TitleI)‐LocalEducationAgencies (7,117) StateCompEd(TitleI)‐Migrant (146) StateCompEd(TitleI)‐StateSchoolImprovementGrants (260) StateCompEd(TitleI)‐StateAgencyNeglect&Delinq. (74) StateEducationForHomelessYouth (33) StateEnglishLiteracyandCivicsEducationStateGrants (30) StateIndependentLiving (24) StateLanguageAcquis.Grants (368) StateMathematicsandSciencePartnerships (88) StateProtection&AdvocacyIndividualRts (13) StateRehab.Services‐BasicStateGrant (1,348) StateRuralandLow‐IncomeSchoolsProgram (5) StateServicesforOlderBlindIndividuals (17) StateSmall,RuralSchoolAchievementProgram (56) StateSpecialEducationBasicStateGrant (8,360) StateSpecialEducationInfants&Toddlers (414) StateSpecialEducationPreschoolGrants (267) StateStateGrantsforImprovingTeacherQuality (1,233) StateStateLibraryProgram (135) StateStateTestingFunds (416) StateSupportedEmploymentStateGrants (23) StateVocationalEducation‐BasicStateGrant (970) StateTEFAP‐EmergencyFoodAsst.Administration (19) StateAbandonedMineReclamationFund 1,448 StateFish&Wildlife‐FishRestoration (337) StateFish&Wildlife‐HunterSafety (50) StateFish&Wildlife‐WildlifeRestoration (207) StateHistoricPreservationFund (59) StateMineralsMgmt.Service:MineralLeasing (4,417) StateStateWildlifeGrants (53) StateSurfaceMiningReclamation (159) StateCommunityServiceEmployforOlderAmericans (223) StateDisabilityVeterans'OutreachProgram (72) StateEmploymentServiceStateGrants (543) StateLocalVeteransEmploymentRepresentativeProgram (2) State

OFFICE OF THE LEGISLATIVE FISCAL ANALYST 69 MAY 9, 2013, 10:15 AM
I N ‐DE P T H BUDG E T R E V I EW
UIStateAdministrationBaseAllocation (2,132) StateWorkforceInvestmentAct‐AdultTraining (325) StateWorkforceInvestmentAct‐DislocatedWorkers (476) StateWorkforceInvestmentAct‐YouthActivities (408) StateNatl.EndowmentfortheArts‐StatePrograms (55) StateStateEnergyProgram (22) StateWeatherizationAssistanceProgram (56) StateEPA‐CleanWaterSRFGrants (575) StateEPA‐DrinkingWaterSRFGrants (686) StateEPA‐HazardousWasteFinancialAssistance (57) StateEPA‐NonpointSource(Sec.319) (110) StateEPA‐PesticidesEnforcement (14) StateEPA‐PollutionControl(Sec.106) (136) StateEPA‐PublicWaterSystemSupervision (70) StateEPA‐StateandLocalAirQualityManagement (262) StateEPA‐UndergroundInjectionControl (12) StateCommunityDevelopmentBlockGrant‐Nonentitlement(States) (312) StateEmergencySolutionsGrants‐Nonentitlement(States) (84) StateHOMEInvestmentPartnerships‐Nonentitlement(States) (229) StateHousingOpportunitiesforPersonswithAIDS (39) StateAdministrationonAgingCongregateMeals (194) StateAdministrationonAgingHomeDeliveredMeals (98) StateAdministrationonAgingSupportServices (162) StateBatteredWomen'sShelters (86) StateCAPTAStateGrants (25) StateCDC‐ImmunizationGrants (437) StateCDC:StateandLocalCapacity (509) StateChafeeEducationandTrainingVouchers (24) StateChildCare&DevelopmentBlockGrant (2,083) StateChildWelfareServices (284) StateCommunityServicesBlockGrant (266) StateCommunity‐BasedChildAbusePrevention (32) StateConsolidatedHealthCenters 839 StateDev.Disabilities‐BasicSupport (52) StateDev.Disabilities‐Protection&Advoc. (29) StateFamilyCaregiver (68) StateHomelessMentalHealth(PATH) (40) StateHospitalPreparednessProgram (256) StateLowIncomeHomeEnergyAssistance (1,841) StateMaternal&ChildHealthBlockGrant (453) StateMentalHealthBlockGrant (258) StateNutritionServicesIncentiveProgram (105) StatePreventiveHealth‐‐RapePreventionandEducation (21) StatePreventiveHealthBlockGrant (55) StatePreventiveHealthServices (9) StatePromotingSafeandStableFamilies (158) State

MAY 9, 2013, 10:15 AM 70 OFFICE OF THE LEGISLATIVE FISCAL ANALYST
I N ‐DE P T H BUDG E T R E V I EW
ProtectionandAdvocacyforIndividualswithMentalIllness (33) StateRefugeeAssistanceCash&Medical (698) StateRefugeeAssistanceSocialServices (69) StateRefugeeTargetedAssistance 191 StateRyanWhite‐HIV/AIDSPartB (379) StateSocialServicesBlockGrant (1,010) StateSubstanceAbusePrevent.&TreatmentBlockGrant (1,299) StateVotingAccessforIndividualswithDisabilities‐P&A (5) StateVulnerableElderRightsProtectionActivities (10) StateTotal (48,983)MostofthefundingbetweenUtahandthefederalgovernmentisthroughresourcedependencewherethefederalgovernmentprovidesfundingforvariousstaterunprograms.Asaresult,theserevenuesareshowninthemajorcategorytablespresentedthroughoutthisreportandareforecastbasedonhistoricaltrends.
Evenifsequestrationdoesnotoccur,orispostponed,massivefederaldebtsuggeststhatatsomepointallstateswillhavetotakecutstofederalfunds.ToprepareforthisUtahisdoingthefollowing:
Engagingincontingencyplanningbyaccountingforallfederalfundsreceivedbyanagencyandidentifyingtheportionofagencybudgetsthatisfederalfunds.Additionally,agenciesaredevelopingaplanforfederalcutsatboth5.0percentand25.0percentlevels.
Agenciesarealsocataloguingfederalgrantssubjecttosequestrationintoacommondatabase.
LegislatorsandtheGovernorarelookingatpotentialincreasestotheRainyDayFundcapstocoverpotentialshortfallsduetochangesinfederalfunds.
TheLegislaturehasimplementedafederalfundreviewprocess.
TheLegislaturehaslimitedtheliabilityofagenciesforfederalfundsthroughintentlanguage.
BecauseofthesepoliciesUtahislikelytobeabletosustaincurrentexpendituretrends.Thenumbersshowninthisreportincludeonlytheamountsshowninthestatebudget.Thereisanadditional$3.2billion(FY2012)infederalsupportthatisnotbudgetedwhichcouldalsobeatriskincludingunemploymentinsurance,andgrantsinaidofcollegesanduniversities.

OFFICE OF THE LEGISLATIVE FISCAL ANALYST 71 MAY 9, 2013, 10:15 AM
I N ‐DE P T H BUDG E T R E V I EW
ECONOMICANDDEMOGRAPHICFACTORSIMPACTINGFUTURESTATERESOURCES
GASBconsideredrequiringgovernmentstoincludeinformationrelatedtodemographicsandeconomicindicatorsastheyareimportantindicatorsoftheviabilityofgovernmenteconomies.However,theyultimatelydecidednottoincludethemasnecessarycomponents.Wehaveprovidedareviewofthebroadlevelfactorsthatimpactstaterevenuesandexpenditurestohelpusersunderstandsomeofthefactorscontributingtooverallstateresourcewell‐being.
Economicforces:Businesseslocatedinthestatehavebecomemorediverseoverthepriortwodecades,withincreasingrelianceondemandforinformationtechnologyandprofessionalservices.Inadditiontotheeconomicdiversificationintotheaforementionedhighlycompetitiveindustries,productionwithinthestates’boundariesalsodependsheavilyonnaturalresources(naturalgas,oil,andothermining)andmanufacturingthandootherstates.Eachoftheseindustries,inadditiontotheothernotmentioned,isanticipatedtobeimportantabove‐averagedriversofeconomicgrowthinthecomingyears.
Demographicforces:Longtermprojectionsofthepopulationlevelanddiversity,whichaffectsthepopulation’sneedforservicesanditsabilitytocontributeresourcestothegovernment,wereidentifiedbyGASBasissuesusefulforfiscalsustainability.However,GASBdecidednottoincludethiscategoryasacomponentofinformationtobereportedduetothefacttheywantedthedatatoreflectabroaderoverallenvironment.
InspiteofGASB’schoicetonotincludedemographicsasacomponentofinformationwebelievethatatleastanarrativediscussionofitspotentialshouldbeincludedinananalysisoffutureresourcedemands.ForthatreasonwehaveincludedabriefdiscussionofpotentialdemographicissuesthatcouldimpactUtah’sfutureresourcedemand.
Utah’sracialandethniccompositionischanging,withsignificantgrowthoverthepastdecadeintheHispanicpopulation.Overthepast10years,thewhite,non‐Hispanic,populationhasdecreasedfrom85.0percentto80.0percent.Thiswillresultinchangingdemandforcertaingovernmentservicesparticularlythoserelatedtoeducation,health,andhumanservices.
Utah’s65andolderpopulationisexpectedtoincreasefromapproximately3.0percentto5.0percentthrough2020.Thisdemographicshiftcouldhaveastrongimpactonstateservicesasitmayleadtoadditionaldemandsforhealthcare,assistedliving,andotheragerelatedservices.

MAY 9, 2013, 10:15 AM 72 OFFICE OF THE LEGISLATIVE FISCAL ANALYST
I N ‐DE P T H BUDG E T R E V I EW
CAUTIONARYNOTICEPROPOSEDBYGASB
GASBrecommendsthatthefollowingnoticebeincludedwithanyprojectionrequiredunderthepreliminaryviewsreport:
“Thefinancialprojectionsthatfollowassumecurrentfiscalpolicieswouldbecontinued,withconsiderationofhistoricalinformationaswellasknowneventsandconditionsthataffecttheprojectionperiods.Thesefinancialprojectionsmaybeusedtoassesswhetherprojectedcashinflowswillbesufficienttosustainpublicservicesandtomeetfinancialobligationsastheycomedue.However,itisimportanttonotethatprojectionsofcashinflows,cashoutflows,andaccruedfinancialobligationsbasedoncurrentpolicydonotrepresentaforecastorapredictionofthemostlikelyoutcome.
Financialprojectionsmaybebaseduponassumptionsregardingchangesinsocial,economic,anddemographiceventsandconditionsthatareinherentlysubjecttouncertainties.Therefore,readersarecautionedthatactualfuturefinancialresultsofUtahmaybesignificantlydifferentfromthefinancialprojectionsreported.”11
11Source:GovernmentalAccountingStandardsSeries:PreliminaryViews

OFFICE OF THE LEGISLATIVE FISCAL ANALYST 73 MAY 9, 2013, 10:15 AM
I N ‐DE P T H BUDG E T R E V I EW
DATACOLLECTION
ThehistoricaldatausedintheforecaststemsfromtheCAFR–RequiredSupplementaryInformationBudgetaryComparisonScheduleactualbudgetfortheGeneralFund,EducationFund,TransportationFund,TransportationInvestmentFund,andtheDABC’senterprisefund.UnderthePreliminaryView,GASBwouldalsorequireaforecastforEnterpriseFundsbutthisforecastdoesnotincludetheminordertolimitthescopeofthereport.Thereportusesa14yearhistoryinordertocaptureareasonabletrendline.Forothersdoingsimilarreports,wewouldrecommendusingahistorythatgoesbackasfaraspossibletoallowforamoreaccurateforecastwhichtakesintoaccounteconomiccycles.Usingtheactualbudgetprovidesabasethattakesintoaccountspendingandtaxchangesimplementedinagivenfiscalyear.
Thecashinflowandoutflowsincludefivedayaccrualadjustments.ThefivedayswereconsideredcloseenoughtoactualcashinflowforagivenfiscalyearsothatnoadjustmentsweremadetotheCAFRfiguresinordertomakethenumbersactualcash.
TomeetthecriteriaproposedbyGASB,theforecastusedautoregressionsagainsthistoricaldataforbothrevenuesandexpenditures.Historicalchangestotaxrates,andearmarkswouldbeaccountedforbydefaultintheautoregressionintheyearsaftertheyoccur.Ongoingchangestoexpenditureswillalsobeaccountedforinthehistoricaldata.Therearenotanyrevenueorexpenditurechangesexpectedundercurrentstatutesfortheforecastperiod.
Theprojectionsofcashinflowsandoutflowsdonotincludethepotentialimpactfromthefederalhealthcarereformactorthefiscalcliff.Althoughbothareconsideredcurrentpolicy,theimpactsaredifficulttoassessatthistimeandwillbehighlydependentonrulesimplementedatthefederalgovernmentlevel.
TheautoregressionsshowthereisenoughGeneralFundcashinflowlesscashoutflowtocoveranticipatedexpendituresoverthecomingfiveyears(Figure48).Additionally,therewilllikelybemorethanenoughEducationFundcashinflowtocoveranticipatedexpendituresoverthefiveyearforecast(Figure49).
ReviewingtheTransportationFundautoregressions,itappearsthereisnotenoughtocoveranticipatedTransportationFundandTransportationInvestmentFundexpendituresoverthetimeframeconsidered(Figure50).
Notethatinyearswhencashinflowlesscashoutflowplusnettransfersislessthanzero,theStatedidnotactuallyendtheyearshortoncash,butratherusednon‐lapsingbalances,transfersfromtherainydayfunds,andotherrestrictedsourcesofrevenuetoachievetheConstitutionalrequirementofabalancedbudget.
GASBproposesincludinginformationforprimarygovernmentincludinggovernmentalactivitiesandbusiness‐typeactivitieswithnetsubtotalsfortheGeneralFund,othergovernmentalactivities,totalgovernmentalactivities,totalbusiness‐typeactivities,andanettotalfortheentireprimarygovernments.ForthepurposesofthisreportweonlyincludedforecastsrelatedtothebudgetsassociatedwiththeGeneralFund,EducationFund,TransportationFund,TransportationInvestmentFund,andtheDepartmentofAlcoholicBeverageControl’sEnterpriseFund.
Finally,itisimportanttonotethatprojectionsarebasedoncurrentpolicydonotnecessarilyrepresentaforecastorpredictionofthemostlikelyoutcome.

MAY 9, 2013, 10:15 AM 74 OFFICE OF THE LEGISLATIVE FISCAL ANALYST
I N ‐DE P T H BUDG E T R E V I EW
Figure48‐GeneralFundCashInflow‐CashOutflow+NetTransfers
‐400,000
‐300,000
‐200,000
‐100,000
0
100,000
200,000
300,000
1999
2000
2001
2002
2003
2004
2005
2006
2007
2008
2009
2010
2011
2012
2013
2014
2015
2016
2017
GeneralFundCashInflow‐CashOutflow+NetTransfers
GeneralFund GeneralFundProjection

OFFICE OF THE LEGISLATIVE FISCAL ANALYST 75 MAY 9, 2013, 10:15 AM
I N ‐DE P T H BUDG E T R E V I EW
Figure49‐EducationFundCashInflow‐CashOutflow+NetTransfers
‐500,000
‐400,000
‐300,000
‐200,000
‐100,000
0
100,000
200,000
300,000
400,000
500,000
600,000
1999
2000
2001
2002
2003
2004
2005
2006
2007
2008
2009
2010
2011
2012
2013
2014
2015
2016
2017
EducationFundCashInflow‐CashOutflow+NetTransfers
EducationFund EducationFundProjection

MAY 9, 2013, 10:15 AM 76 OFFICE OF THE LEGISLATIVE FISCAL ANALYST
I N ‐DE P T H BUDG E T R E V I EW
Figure50‐TransportationRelatedCashInflow‐CashOutflow+NetTransfers
‐1,500,000
‐1,000,000
‐500,000
0
500,000
1,000,000
1999
2000
2001
2002
2003
2004
2005
2006
2007
2008
2009
2010
2011
2012
2013
2014
2015
2016
2017
TransportationandTransportationInvestmentFundCashInflow‐CashOutflow+NetTransfers
TransportationFund TransportationFundProjection
TransportationInvestmentFund TransportationInvestmentFundProjection

OFFICE OF THE LEGISLATIVE FISCAL ANALYST 77 MAY 9, 2013, 10:15 AM
I N ‐DE P T H BUDG E T R E V I EW
FORECASTINGISSUES
Indevelopingthisforecast,wefacedseveralissuesthatwethinkGASBshouldconsiderbeforeissuingafinalreport.Thoseissuesaredetailedbelow.
Recentbudgetandrevenuehistoryisnotanindicationoflongtermtrends.Dependingontheeconomicsituation,univariateforecastsmayunderstateoroverstatelikelyrevenueandexpenditureconditionsforpurposesofthefiveyearforecast.Forinstance,presumingeconomicindicatorsarenotused,aunivariateforecastmayunderstatelongtermtrendsbecausebusinessesandtheeconomyasawholejustwentthroughtheworstrecessionsincetheGreatDepression.
TheproposedmethodologydoesnotaccountforlegislativewillorthefactthatUtahhasaconstitutionalrequirementforabalancedbudget.
Theproposedmethodologyignoresprojecteddemographictrendsandeconomicindicators.AsaresulttheforecastsusedinthebudgetprocesswillconflictwiththeforecastpresentedintheCAFR.
Theproposaltoexcludeprojectedeconomicindicatorsinpreferenceofonlyhistoricalinformationmakestheforecastunivariate.Withintheuniverseofunivariateforecastmodelsareautoregressiveintegratedmovingaverage(ARIMA),autoregressivemovingaverage(ARMA),Box‐Jenkins,autoregressiveconditionalheteroskedasticity(ARCHandGARCH),vectorautoregressivemodels,exponentialsmoothingmodels,rollingwindowsestimation,andmanyothervariations.Eachmodelproducesadifferentforecast.Wehavetheabilitytoevaluatetheperformanceofthedifferentmodelsagainsteachotherandcanchoosethemodelthatminimizestheerrorsorminimizessomeotherfactor,butthereisnorequirementtodoso.Becauseofthat,certainunivariatemodelscanbemanipulatedtoproduceresultsclosetowhatforecastswithprojectedeconomicindicatorswouldproduce.Werecommendfurtherguidanceonwhattypesofmodelscanbeusedwiththehistoricalinformation.
Theforecastsaresensitivetotheamountofhistoricalinformationandthestartingperiod.Wewouldrecommendsomeguidanceonhowmuchhistorymaybeusedandwhentheinitialyearfortheforecastshouldtakeplace.
Althoughunivariatemodelscancapturebusinesscycles,theygenerallydonot.
Timingmaybeaproblemsincethemostrecentyearactualsareneededbeforeaforecastcanoccur.
CAFRdatadoesnotbreakoutrevenuesourcesintoongoingandone‐time.Asaresult,one‐timerevenuewillgetbuiltintothetrend‐lineresultinginoverstatedrevenues.

MAY 9, 2013, 10:15 AM 78 OFFICE OF THE LEGISLATIVE FISCAL ANALYST
I N ‐DE P T H BUDG E T R E V I EW
CONCLUSION
Thisreviewservedatwo‐foldpurpose:
1) TestingthevalidityofGASB’sproposalonEconomicConditionReporting:FinancialProjections;and
2) AssessedtheeconomicsustainabilityoftheState’scurrentrevenueandexpendituretrends.
Wearrivedatthefollowingconclusions:
Utahisfiscallysustainable:Inusingone‐factortrendanalysesofrevenuesandexpenditures,wefoundthatUtahisfiscallysustainablethroughFY2017forallbutTransportationrelatedexpenditures.
Utahpaysitsdebtobligations:Usingcurrentpolicies,Utahsetsasidetheamountsnecessarytocoverbondedindebtedness.Furthermore,theLegislaturehasmadecommitmentstoreduceandcoverobligationsrelatedtootherfinancialindebtednessincludingretirementandOPEB.
LimitedapplicabilityoftheGASB‐basedforecasts:ThefinancialpositionoftheStateisaffectedbyseveralfactorsincludingeconomic,socialandfinancialfactors,butthemethodologyproposedbyGASBallowsonlythehistoricalfinancialfactorstobeconsidered,whichlimitstheapplicabilityoftheforecasts.
Recommendations
1. UseGASB‐basedforecastsinconjunctionwithconsensusrevenueprocess:IftheStateisrequiredtouseGASB’smethodologygoingforward,werecommendthatitbeusedinconjunctionwiththeState’sconsensusrevenueprocessinordertoevaluatethelimitationsofthetrendandtoaddresspotentialconcernsinthebudgetprocess.
2. Allowforsufficientleadtimeforforecastpublicationandcoordinationamongbranches:AnyfuturereportswillrequirecoordinatedeffortsbetweentheLegislativeandExecutivebranchesofgovernment.Werecommendallowingampleleadtimetocreateareport.Datafortheyear‐endisgenerallynotavailableuntillateSeptember.IncludingthedataintheCAFRasproposedbyGASBcoulddelaythepublicationofthereport.
Author’sNote
GASBhascurrentlyputthe5yearforecastprojectonhold.

Page 79
1234530313237383944474849
505354575863666778
798081828485868990919293969798
99100101102103104113114115116117118119120121122123124125126127130131132133134135136137138139140141142143144
A K L M N O P Q R S T U V W X Y Z AA AB AC AD
Revenues 1999 2000 2001 2002 2003 2004 2005 2006 2007 2008 2009 2010 2011 2012 Percent of 2013 2014 2015 2016 2017General Fund Revenue Actual Actual Actual Actual Actual Actual Actual Actual Actual Actual Actual Actual Actual Actual Total Forecast Forecast Forecast Forecast ForecastSales & Use Tax 1,316,404 1,369,637 1,431,427 1,441,318 1,443,974 1,501,938 1,634,522 1,806,265 1,857,813 1,739,384 1,547,475 1,402,671 1,601,399 1,582,530 79.5% 1,601,178 1,664,866 1,728,554 1,792,242 1,855,930All Other General Fund 172,141 248,102 238,882 197,371 257,349 254,888 256,095 324,990 371,613 354,200 320,900 310,907 372,654 408,864 20.5% 428,432 457,034 476,864 488,604 498,213
Total General Fund 1,488,545 1,617,739 1,670,309 1,638,689 1,701,323 1,756,826 1,890,617 2,131,255 2,229,426 2,093,584 1,868,375 1,713,578 1,974,053 1,991,394 100.0% 2,029,610 2,121,899 2,205,418 2,280,846 2,354,143
Department Specific Revenue (General Fund Restricted)Federal Contracts & Grants 1,099,711 1,133,188 1,219,218 1,342,706 1,479,673 1,698,050 1,774,132 1,850,706 1,807,128 1,905,370 2,268,666 2,663,603 2,665,632 2,550,694 59.8% 2,770,108 2,896,994 3,023,880 3,150,766 3,277,652Departmental Collections 171,995 183,551 199,768 211,932 198,334 222,916 258,928 278,380 292,803 329,535 325,953 324,300 358,794 421,125 9.9% 401,260 418,777 436,295 453,812 471,330Higher Education Collections 162,052 170,253 192,929 221,890 260,464 284,948 323,533 331,587 357,874 390,638 416,933 491,441 567,787 624,958 14.6% 630,300 648,293 673,288 702,158 733,171All Other General Fund Restricted 267,887 367,598 379,386 390,116 436,744 477,804 512,655 603,280 628,499 680,055 761,578 697,451 638,998 670,549 15.7% 773,487 843,969 882,592 894,921 944,562Total Department Sepcific Revenues 1,701,645 1,854,590 1,991,301 2,166,644 2,375,215 2,683,718 2,869,248 3,063,953 3,086,304 3,305,598 3,773,130 4,176,795 4,231,211 4,267,326 100.0% 4,575,155 4,808,033 5,016,055 5,201,657 5,426,715
Intrafund Eliminations ‐411,922 ‐444,043Total Revenue 3,190,190 3,060,407 3,217,567 3,805,333 4,076,538 4,440,544 4,759,865 5,195,208 5,315,730 5,399,182 5,641,505 5,890,373 6,205,264 6,258,720 100.0% 6,604,765 6,929,933 7,221,473 7,482,504 7,780,858
ExpendituresHuman Services (see note 2) 469,363 512,662 518,143 543,480 543,377 561,162 585,463 601,938 636,440 687,502 708,098 676,920 654,441 651,977 10.1% 719,758 736,193 752,628 769,062 785,497Corrections 155,315 175,803 183,890 183,359 177,170 187,656 193,613 203,959 225,998 247,883 253,312 232,748 236,018 242,238 3.7% 263,215 272,384 279,881 279,010 284,834Health and Environmental Quality 963,344 1,025,242 1,136,591 1,281,808 1,388,045 1,569,489 1,704,088 1,863,578 1,869,779 1,995,331 2,157,204 2,227,545 2,316,593 2,401,862 37.2% 2,579,960 2,696,331 2,812,702 2,929,073 3,045,443Higher Education ‐ All 677,158 708,496 770,140 883,298 895,583 922,340 997,446 1,048,345 1,107,171 1,239,017 1,233,599 1,271,256 1,331,131 1,382,473 21.4% 1,443,667 1,497,738 1,551,808 1,605,879 1,659,950Employment and Family Services 306,617 291,806 291,793 327,100 369,473 398,542 420,067 417,588 411,396 441,698 531,522 686,563 719,554 722,958 11.2% 738,401 760,931 787,849 817,487 848,809Community and Economic Development 74,280 76,135 85,060 87,940 91,056 89,312 86,631 82,710 105,185 127,423 143,899 171,235 151,664 137,924 2.1% 150,679 160,734 169,293 177,025 184,299All Other Government 725,029 763,343 808,383 867,493 841,081 877,540 923,549 1,017,082 1,136,564 1,270,425 1,308,423 1,285,986 1,289,199 1,304,265 20.2% 1,402,264 1,448,571 1,493,274 1,529,839 1,573,356Total Expenditures 3,141,511 3,301,549 3,525,050 3,903,179 4,037,559 4,329,073 4,630,613 4,948,531 5,161,350 5,633,973 5,938,846 6,148,270 6,310,918 6,463,535 6,884,051 7,139,763 7,398,261 7,651,340 7,913,055
Expenditure AdjustmentsHigher Education and Trust Appropriated Expend ‐479,197 ‐500,084 ‐533,604Intrafund Eliminations ‐364,179 ‐411,922 ‐444,043
Other Financing SourcesCapital Leases Acquisition 2,131 2,010 11,122Proceeds of General Obligation Bonds 15,650 0 1,602Transfers In, All 225,520 248,069 268,793 226,550 161,055 190,191 307,040 345,292 652,932 911,717 591,278 401,228 426,430 472,978 599,786 702,639 737,818 729,905 725,519Transfers Out, All ‐257,836 ‐265,429 ‐312,737 ‐334,242 ‐164,322 ‐215,571 ‐297,886 ‐388,197 ‐589,855 ‐873,826 ‐490,981 ‐159,213 ‐291,156 ‐224,165 ‐418,762 ‐428,259 ‐437,757 ‐447,255 ‐456,752Operating Transfers from Component Units 526Operating Transfers to Component Units ‐483,901 ‐503,641 ‐537,279Sales of Capital Assets 80 11,001 9 10Total Other Financing Sources ‐500,567 ‐521,001 ‐579,095 ‐107,692 ‐3,267 ‐25,380 9,154 ‐42,905 63,077 40,102 113,308 253,137 135,283 248,823 181,024 274,380 300,061 282,650 268,767
Revenue‐Expenditures+Transfers in+Transfers out 16,363 ‐258,502 ‐351,427 ‐205,538 35,712 86,091 138,406 203,772 217,457 ‐196,900 ‐197,044 ‐15,882 29,620 43,998 ‐98,262 64,550 123,274 113,814 136,571
CAFR Page # for each annual report pg. 84‐85 pg. 86‐87 pg. 96 pg. 100 pg. 106 pg. 106 pg. 108 pg. 112 pg. 115 pg. 118 pg. 124 pg. 128 pg. 128NotesNote 1: Sources: actual data setms from the Comprehensive Annual Financial Report, Division of Finance; projection and adopted data is from LFANotes 2: in 2002, the name was changed to "Human Services and Youth Corrections"
Expenditures, Revenue Sources Compared Against Appropriated for FY 2013 and FY 20141999 2000 2001 2002 2003 2004 2005 2006 2007 2008 2009 2010 2011 2012 2013 2014 2015 2016 2017
Human Services 469,363 512,662 518,143 543,480 543,377 561,162 585,463 601,938 636,440 687,502 708,098 676,920 654,441 651,977Health and Environmental Quality 963,344 1,025,242 1,136,591 1,281,808 1,388,045 1,569,489 1,704,088 1,863,578 1,869,779 1,995,331 2,157,204 2,227,545 2,316,593 2,401,862Higher Education 677,158 708,496 770,140 883,298 895,583 922,340 997,446 1,048,345 1,107,171 1,239,017 1,233,599 1,271,256 1,331,131 1,382,473Employment and Family Services 306,617 291,806 291,793 327,100 369,473 398,542 420,067 417,588 411,396 441,698 531,522 686,563 719,554 722,958All Other Government 725,029 763,343 808,383 867,493 841,081 877,540 923,549 1,017,082 1,136,564 1,270,425 1,308,423 1,285,986 1,289,199 1,304,265Human Services Projection 719,758 736,193 752,628 769,062 785,497Health and Environmental Quality Projection 2,579,960 2,696,331 2,812,702 2,929,073 3,045,443Higher Education Projection 1,443,667 1,497,738 1,551,808 1,605,879 1,659,950Employment and Family Services Projection 738,401 760,931 787,849 817,487 848,809All Other Government Projection 1,402,264 1,448,571 1,493,274 1,529,839 1,573,356Human Services Appropriated 706,137 711,797Health and Environmental Quality Appropriated 2,492,736 2,586,269Higher Education Appropriated 1,397,898 1,450,082All Other Government Appropriated 1,459,240 1,413,524
1999 2000 2001 2002 2003 2004 2005 2006 2007 2008 2009 2010 2011 2012 2013 2014 2015 2016 2017Federal Contracts & Grants 1,099,711 1,133,188 1,219,218 1,342,706 1,479,673 1,698,050 1,774,132 1,850,706 1,807,128 1,905,370 2,268,666 2,663,603 2,665,632 2,550,694Federal Contracts & Grants Projection 2,770,108 2,896,994 3,023,880 3,150,766 3,277,652Departmental Collections 171,995 183,551 199,768 211,932 198,334 222,916 258,928 278,380 292,803 329,535 325,953 324,300 358,794 421,125Departmental Collections Projection 401,260 418,777 436,295 453,812 471,330Higher Education Collections 162,052 170,253 192,929 221,890 260,464 284,948 323,533 331,587 357,874 390,638 416,933 491,441 567,787 624,958Higher Education Collections Projection 630,300 648,293 673,288 702,158 733,171All Other General Fund Restricted 267,887 367,598 379,386 390,116 436,744 477,804 512,655 603,280 628,499 680,055 761,578 697,451 638,998 670,549All Other General Fund Restricted Projection 773,487 843,969 882,592 894,921 944,562
Revenues ‐ Expenditures + Net Transfers 16,363 ‐258,502 ‐351,427 ‐205,538 35,712 86,091 138,406 203,772 217,457 ‐196,900 ‐197,044 ‐15,882 29,620 43,998Revenues ‐ Expenditures + Net Transfers Projection ‐98,262 64,550 123,274 113,814 136,571Cumulative, Revenues ‐ Expenditures + Net Transfers Projection ‐98,262 ‐33,712 89,562 203,376 339,946
Appendix A: General Fund Detail Table
Page 79

Page 80
12345611121314152425
2848495051
525355566162636465686971
72737475767778798081828384858687888990919293949596
A K L M N O P Q R S T U V W X Y Z AA AB AC AD
Revenues 1999 2000 2001 2002 2003 2004 2005 2006 2007 2008 2009 2010 2011 2012 Percent of 2013 2014 2015 2016 2017Education Fund & Uniform School Fund Revenue (se Actual Actual Actual Actual Actual Actual Actual Actual Actual Actual Actual Actual Actual Actual Total Forecast Forecast Forecast Forecast ForecastIndividual Income Tax 1,463,897 1,654,949 1,712,676 1,610,170 1,575,486 1,699,638 1,934,028 2,288,483 2,573,197 2,611,848 2,338,592 2,119,947 2,315,630 2,478,638 89.1% 2,680,075 2,834,230 2,902,965 2,911,569 2,919,921Corporate Tax 192,221 186,936 183,141 127,320 160,522 162,860 206,730 368,869 419,318 410,879 263,892 259,458 261,911 272,355 9.8% 327,928 372,371 405,957 410,935 403,297All Other Education Fund 6,836 2,420 8,990 15,204 13,349 19,292 20,711 37,546 0 0 0 32,824 34,691 30,880 1.1% 21,020 22,259 26,748 34,697 36,296Total Education Revenues 1,662,954 1,844,305 1,904,807 1,752,694 1,749,357 1,881,790 2,161,469 2,694,898 2,992,515 3,022,727 2,602,484 2,412,229 2,612,232 2,781,873 100.0% 3,029,023 3,228,860 3,335,670 3,357,201 3,359,514
Department Specific RevenueFederal Contracts & Grants 213,826 235,065 246,925 252,991 287,709 311,336 344,665 371,888 371,782 379,707 597,254 561,174 634,795 544,833 87.2% 623,196 655,298 687,401 719,504 751,607All Other Department Specific Revenue 52,456 59,484 45,085 30,507 30,625 31,585 33,498 39,106 91,041 105,670 107,044 75,275 76,410 80,118 12.8% 82,026 85,166 88,381 91,647 94,949Total Department Sepcific Revenues* 266,282 294,549 292,010 283,498 318,334 342,921 378,163 410,994 5,260 485,377 704,298 636,449 711,205 624,951 100.0% 705,222 740,465 775,782 811,151 846,555
Total EF & USF Revenue 1,929,236 2,138,854 2,196,817 2,036,192 2,067,691 2,224,711 2,539,632 3,105,892 3,460,598 3,508,104 3,306,782 3,048,678 3,323,437 3,406,824 3,734,245 3,969,325 4,111,453 4,168,352 4,206,069
ExpendituresPublic Education 1,787,439 1,835,103 1,965,608 2,005,507 1,986,271 2,044,374 2,177,845 2,331,806 2,557,149 2,971,564 3,048,561 2,939,144 3,035,227 3,028,720 3,208,412 3,451,897 3,580,921 3,767,086 3,849,541Education Support 2,998,524 0 0Leave/Postemployment Benefits 2,042 145 1,558Total Expenditures 1,789,481 1,835,248 1,967,166 2,005,507 1,986,271 2,044,374 2,177,845 2,331,806 2,557,149 2,971,564 3,048,561 2,939,144 3,035,227 3,028,720 3,208,412 3,451,897 3,580,921 3,767,086 3,849,541
Intrafund Eliminations ‐10,527 ‐10,941 ‐15,649
Other Financing SourcesCapital Leases/Contracts Issued 33Transfers In, All 8,800 9,952 11,480 126,279 1,565 2,110 2,980 6,215 2,201,901 2,369,808 2,227,988 8,664 7,261 7,646 3,305 1,565 ‐176 ‐1,916 ‐3,656Transfers Out, All ‐192,559 ‐211,994 ‐310,339 ‐189,388 ‐33,951 ‐122,725 ‐288,872 ‐290,073 ‐2,837,449 ‐3,285,656 ‐2,547,013 ‐322,038 ‐303,463 ‐309,696 ‐317,320 ‐329,773 ‐344,224 ‐355,792 ‐363,705Transfers In (USF, 2007 ‐ 2009 forward) 2,200,847 2,325,571 2,227,988Transfers Out (USF, 2007 ‐ 2009 forward) ‐50,107 ‐110,135 ‐55,265Operating Transfers to Component Units 0 ‐13
Total Other Financing Sources ‐183,759 ‐202,055 ‐298,859 ‐63,109 ‐32,386 ‐120,615 ‐285,892 ‐283,858 ‐635,548 ‐915,848 ‐319,025 ‐313,341 ‐296,202 ‐302,050 ‐314,015 ‐328,209 ‐344,399 ‐357,707 ‐367,361
Revenue‐Expenditures+Transfers in+Transfers out ‐54,531 90,623 ‐84,857 ‐32,424 49,034 59,722 75,895 490,228 267,901 ‐379,308 ‐60,804 ‐203,840 ‐7,992 76,054 211,818 189,219 186,133 43,559 ‐10,833
CAFR Page # for each annual report pg. 109 pg. 111 pg. 97 pg. 101 pg. 107 pg. 107 pg. 109 pg. 113 pg. 116 pg. 120 pg. 125 pg. 129 pg. 129NotesNote 1: in FY 2007, reporting changed from the Uniform School Fund to the Education Fund/USF*This includes General Revenues, Miscellaneous Other (USF) and Investment Income
Expenditures, Revenue Sources Compared Against Appropriated for FY 2013 and FY 20141999 2000 2001 2002 2003 2004 2005 2006 2007 2008 2009 2010 2011 2012 2013 2014 2015 2016 2017
Individual Income Tax 1,463,897 1,654,949 1,712,676 1,610,170 1,575,486 1,699,638 1,934,028 2,288,483 2,573,197 2,611,848 2,338,592 2,119,947 2,315,630 2,478,638Corporate Tax 192,221 186,936 183,141 127,320 160,522 162,860 206,730 368,869 419,318 410,879 263,892 259,458 261,911 272,355All Other Education Fund 6,836 2,420 8,990 15,204 13,349 19,292 20,711 37,546 0 0 0 32,824 34,691 30,880Individual Income Tax Projection 2,680,075 2,834,230 2,902,965 2,911,569 2,919,921
Corporate Tax Projection 327,928 372,371 405,957 410,935 403,297All Other Education Fund Projection 21,020 22,259 26,748 34,697 36,296Individual Income Tax Adopted 2,652,156 2,748,950Corporate Tax Adopted 312,600 285,450All Other Education Fund Adopted 37,479 28,950
1999 2000 2001 2002 2003 2004 2005 2006 2007 2008 2009 2010 2011 2012 2013 2014 2015 2016 2017Public Education 1,787,439 1,835,103 1,965,608 2,005,507 1,986,271 2,044,374 2,177,845 2,331,806 2,557,149 2,971,564 3,048,561 2,939,144 3,035,227 3,028,720Public Education Projections 3,208,412 3,451,897 3,580,921 3,767,086 3,849,541Public Education Appropriations 3,105,509 3,230,915
Revenues ‐ Expenditures + Net Transfers ‐54,531 90,623 ‐84,857 ‐32,424 49,034 59,722 75,895 490,228 267,901 ‐379,308 ‐60,804 ‐203,840 ‐7,992 76,054Revenues ‐ Expenditures + Net Transfers Projection 211,818 189,219 186,133 43,559 ‐10,833Cumulative, Revenues ‐ Expenditures + Net Transfers Projection 211,818 401,037 587,170 630,729 619,896
Appendix B: Education Fund Detail Table
Page 80

Page 81
1234567891011121314151617181920212223242526272829303132335051525354555657586162636465666768697071727374757677787980818283
A K L M N O P Q R S T U V W X Z AA AB AC AD
Revenues 1999 2000 2001 2002 2003 2004 2005 2006 2007 2008 2009 2010 2011 2012 2013 2014 2015 2016 2017Transportation Fund Revenue Actual Actual Actual Actual Actual Actual Actual Actual Actual Actual Actual Actual Actual Actual Forecast Forecast Forecast Forecast ForecastMotor Fuel Tax 224,691 237,574 229,410 237,925 236,639 239,925 241,484 240,432 254,676 250,669 235,481 243,295 252,501 252,954 253,670 255,325 256,979 258,634 260,289Special Fuel Tax 73,699 76,590 80,590 84,406 84,523 86,163 93,837 101,098 111,150 112,984 101,367 94,812 102,613 104,099 109,569 115,552 119,722 121,840 123,021All Other Transportation Fund Revenue (∑rows 8‐17) 58,470 64,953 64,463 62,847 65,396 65,040 69,967 76,670 78,938 82,638 86,127 73,631 81,946 79,168 85,286 87,414 89,492 91,333 93,176Licenses, Permits, and Fees (∑rows 8‐17)Motor Vehicle Registration Fees 24,886 25,848 25,935 27,378 28,359 29,390 30,690 32,579 34,293 35,366 34,917 33,447 35,110 35,686 37,065 38,265 39,354 40,375 41,353Proportional Registration Fees 10,627 12,203 11,554 11,665 11,838 11,830 12,122 13,040 14,772 14,202 14,114 14,617 14,746 15,408 15,631 15,974 16,318 16,662 17,006Temporary Permits 386 372 409 401 397 360 336 357 401 523 492 387 402 435 440 445 450 454 459Special Transportation Permits 5,756 5,678 5,911 5,831 6,112 5,962 6,612 7,351 7,823 8,189 8,235 8,753 9,616 9,872 9,835 10,178 10,520 10,863 11,206Highway Use Permits 7,166 8,123 7,473 8,000 7,944 8,148 8,421 8,588 8,090 7,574 12,520 8,297 11,120 10,107 10,541 10,669 10,969 11,173 11,430Drivers LicenseMotor Vehicle Control Fees 4,123 4,173 4,093 4,167 4,289 4,515 4,757 5,062 5,302 5,295 4,552 4,391 4,552 4,777 5,028 5,196 5,253 5,237 5,212Miscellaneous 1,689 1,605 1,881 1,610 1,721 1,852 1,895 1,928 1,625 2,208 2,094 2,152 2,212 2,282 2,274 2,322 2,370 2,419 2,467Investment Income 1,369 3,911 4,616 2,075 1,655 1,934 3,457 5,746 4,871 7,602 3,370 0 191 596 2,254 2,161 2,067 1,973 1,880Miscellaneous Other 2,468 3,040 2,591 1,720 3,081 1,049 1,677 2,019 1,761 1,679 5,833 1,587 3,997 5 2,219 2,205 2,191 2,177 2,163Total Unrestricted 356,860 379,117 374,463 385,178 386,558 391,128 405,288 418,200 444,764 446,291 422,975 411,738 437,060 436,221 448,525 458,292 466,194 471,806 476,485
Department Specific RevenueRestricted Sales Tax 17,859 18,315 18,886 31,235 34,348 31,882 35,438 35,551 35,322 152,393 122,281 65,640 68,632Sales and Aviation Fuel Taxes 74,283 75,158 78,148 81,137 84,127 87,116Federal Contracts & Grants 165,514 167,564 126,595 205,982 191,104 204,741 197,328 264,262 255,247 283,992 322,175 421,819 293,018 454,343 406,934 427,347 447,760 468,174 488,587Departmental Collections 33,815 39,658 43,480 44,055 41,947 45,583 46,225 50,190 54,670 67,876 64,688 81,332 82,592 89,122 89,863 92,206 95,372 98,961 102,768All Other Department Specific Revenue 47,742 37,984 49,250 54,061 38,683 49,287 55,783 71,176 84,961 127,789 157,930 127,244 143,339 94,141 145,718 154,094 162,471 170,847 179,223Aeronautics Fund 18,737 26,859 33,386 31,026 18,791 25,821 34,416 37,521 44,074 68,193 34,141 39,753 51,003 22,883 46,353 47,899 49,445 50,991 52,537Investment Income 383 645 1,082 582 732 1,135 1,048 1,548 1,598 5,373 5,761 769 469 42 2,372 2,486 2,601 2,716 2,830Restricted Taxes 7,859 ‐2,060 818Miscellaneous* 20,763 12,540 13,964 22,453 19,160 22,331 20,319 32,107 39,289 54,223 118,028 86,722 91,867 71,216 96,993 103,709 110,424 117,140 123,856OtherTotal Department Sepcific Revenues 264,930 263,521 238,211 335,333 306,082 331,493 334,774 421,179 430,200 632,050 667,074 696,035 587,581 711,889 717,674 751,795 786,740 822,108 857,694
Total Transportation Fund Revenues 621,790 642,638 612,674 720,511 692,640 722,621 740,062 839,379 874,964 1,078,341 1,090,049 1,107,773 1,024,641 1,148,110 1,166,199 1,210,087 1,252,933 1,293,915 1,334,180
Intrafund Eliminations ‐16,893 ‐18,855 ‐26,320ExpendituresTransportation 510,776 527,709 539,274 665,042 573,874 634,727 701,332 800,726 858,783 1,100,673 1,403,297 1,246,498 997,766 1,087,500 1,255,944 1,315,324 1,374,705 1,434,085 1,493,466Total Expenditures 510,776 527,709 539,274 665,042 573,874 634,727 701,332 800,726 858,783 1,100,673 1,403,297 1,246,498 997,766 1,087,500 1,255,944 1,315,324 1,374,705 1,434,085 1,493,466
Other Financing SourcesProceeds of Revenue Bonds/Contracts 1,688General Obligation Bonds Issued 45,400 70,083 427,917 39,500Premium (Discount) on Bonds Issued 6,600Sales of Capital Assets 6,747 8,058 6,157 8,016 14,607 12,276Transfers In 27,100 36,131 19,412 28,127 48,406 83,449 146,830 264,234 189,981 115,904 114,097 66,476 170,703 182,348 193,993 205,638 217,283Transfers Out ‐102,835 ‐86,520 ‐107,483 ‐107,902 ‐109,216 ‐120,824 ‐54,308 ‐131,245 ‐150,054 ‐138,550 ‐145,341 ‐148,965 ‐150,224 ‐155,345 ‐160,466 ‐165,587 ‐170,708
Revenue‐Expenditures+Transfers in+Transfers out 111,014 114,929 ‐2,335 5,080 30,695 8,119 ‐22,080 1,278 108,703 110,657 ‐273,321 ‐161,371 ‐4,369 ‐21,879 ‐69,266 ‐78,234 ‐88,244 ‐100,120 ‐112,711
CAFR Page # for each annual report pg. 113 pg. 113 pg. 115 pg. 98 pg. 102 pg. 108 pg. 108 pg. 110 pg. 115 pg. 117 pg. 121 pg. 126 pg. 130 pg. 130Notes*Forecast includes Investment Income
1999 2000 2001 2002 2003 2004 2005 2006 2007 2008 2009 2010 2011 2012 2013 2014 2015 2016 2017Motor Fuel Tax 224,691 237,574 229,410 237,925 236,639 239,925 241,484 240,432 254,676 250,669 235,481 243,295 252,501 252,954Special Fuel Tax 73,699 76,590 80,590 84,406 84,523 86,163 93,837 101,098 111,150 112,984 101,367 94,812 102,613 104,099All Other Transportation Fund Revenue (∑rows 8‐17) 58,470 64,953 64,463 62,847 65,396 65,040 69,967 76,670 78,938 82,638 86,127 73,631 81,946 79,168Motor Fuel Tax Projection 253,670 255,325 256,979 258,634 260,289Special Fuel Tax Projection 109,569 115,552 119,722 121,840 123,021All Other Transportation Fund Revenue Projection 85,286 87,414 89,492 91,333 93,176Motor Fuel Tax Adopted 250,700 255,325Special Fuel Tax Adopted 99,500 99,500All Other Transportation Fund Adopted 82,300 83,594
1999 2000 2001 2002 2003 2004 2005 2006 2007 2008 2009 2010 2011 2012 2013 2014 2015 2016 2017Transportation 510,776 527,709 539,274 665,042 573,874 634,727 701,332 800,726 858,783 1,100,673 1,403,297 1,246,498 997,766 1,087,500Transportation Projection 1,255,944 1,315,324 1,374,705 1,434,085 1,493,466Transportation Appropriated 1,817,891 1,257,000
Revenues ‐ Expenditures + Net Transfers 111,014 114,929 ‐2,335 5,080 30,695 8,119 ‐22,080 1,278 108,703 110,657 ‐273,321 ‐161,371 ‐4,369 ‐21,879Revenues ‐ Expenditures + Net Transfers Projection ‐69,266 ‐78,234 ‐88,244 ‐100,120 ‐112,711Cumulative, Revenues ‐ Expenditures + Net Transfers Projection ‐69,266 ‐147,500 ‐235,744 ‐335,864 ‐448,575
Appendix C: Transportation Fund Detail Table
Page 81

Page 82
12345817
1819202324252629303132
33343536373839404142434445464748495051525354
A R S T U V W X Y Z AA AB AC AD
Revenues 2006 2007 2008 2009 2010 2011 2012 Percent of 2013 2014 2015 2016 2017Transportation Investment Fund Revenue Actual Actual Actual Actual Actual Actual Actual Total Forecast Forecast Forecast Forecast ForecastSales Tax 65,851 201,907 177,321 157,050 145,012 29,391 269,313 66% 351,572 395,633 439,694 483,755 527,816Motor Vehicle Registration Fees 21,486 22,354 23,055 22,955 68,792 70,573 71,706 17% 72,857 74,027 75,215 76,423 77,650All Other TIF Revenue 8,199 26,415 15,035 2,149 105,413 104,446 69,606 17% 138,704 144,069 149,434 154,799 160,164
Total Revenues Transportation Investment Fund 95,536 250,676 215,411 182,154 319,217 204,410 410,625 100% 563,133 613,729 664,343 714,977 765,630
ExpendituresTransportation 176,300 363,982 373,222 293,498 771,720 980,628Capital Outlay 803,775 1,039,620 1,165,128 1,290,635 1,416,143 1,541,651Total Expenditures 176,300 363,982 373,222 293,498 771,720 980,628 803,775 1,039,620 1,165,128 1,290,635 1,416,143 1,541,651
Other Financing SourcesGeneral Obligation Bonds 865,400 992,000 563,060Premium on Bonds Issued 83,340Transfers In 196,832 263,684 438,833 131,977 77,117 78,417 82,634 104,194 104,194 104,194 104,194 104,194Transfers Out ‐156,393 ‐182,977 ‐209,058 ‐222,796 ‐239,479 ‐284,280 ‐299,497 ‐322,403 ‐346,058 ‐369,713 ‐393,368 ‐417,023Total Other Financing Sources 40,439 80,707 229,775 ‐90,819 703,038 786,137 429,537 ‐218,209 ‐241,864 ‐265,519 ‐289,174 ‐312,829
Revenue‐Expenditures+Transfers in+Transfers out 135,975 331,383 445,186 91,335 156,855 ‐1,453 ‐610,013 ‐694,696 ‐793,262 ‐891,811 ‐990,340 ‐1,088,849
CAFR Page # for each annual report pg. 118 pg. 122 pg. 127 pg. 131
2006 2007 2008 2009 2010 2011 2012 2013 2014 2015 2016 2017Transportation Investment Fund 176,300 363,982 373,222 293,498 771,720 980,628 803,775Transportation Investment Fund Projection 1,039,620 1,165,128 1,290,635 1,416,143 1,541,651Transportation Investment Fund Adopted 747,000 555,000
Expenditures, Revenue Sources Compared Against Appropriated for FY 2013 and FY 2014Sales tax 65,851 201,907 177,321 157,050 145,012 29,391 269,313Sales tax projection 351,572 395,633 439,694 483,755 527,816Sales tax adopted 373,531 409,240Motor Vehicle Registration Fees 21,486 22,354 23,055 22,955 68,792 70,573 71,706Motor Vehicle Registration Fees Projection 72,857 74,027 75,215 76,423 77,650Motor Vehicle Registration Fees Adopted 73,570 75,483All Other TIF Revenue 8,199 26,415 15,035 2,149 105,413 104,446 69,606All Other TIF Revenue Projection 138,704 144,069 149,434 154,799 160,164All Other TIF Revenue Adopted 105,733 106,156
Revenues ‐ Expenditures + Net Transfers 135,975 331,383 445,186 91,335 156,855 ‐1,453 ‐610,013Revenues ‐ Expenditures + Net Transfers Projection ‐694,696 ‐793,262 ‐891,811 ‐990,340 ‐1,088,849Cumulative, Revenues ‐ Expenditures + Net Transfers Projection ‐694,696 ‐1,487,958 ‐2,379,769 ‐3,370,108 ‐4,458,957
Appendix D: Transportation Investment Fund Detail Table
Page 82

Page 83
123710
111215161718
1920212223242526272829303132333435363738
A L M N O P Q R S T U V W X Y Z AA AB AC AD
Revenues 2000 2001 2002 2003 2004 2005 2006 2007 2008 2009 2010 2011 2012 Percent of 2013 2014 2015 2016 2017DABC Actual Actual Actual Actual Actual Actual Actual Actual Actual Actual Actual Actual Actual Total Forecast Forecast Forecast Forecast ForecastReceipts from Customers/Loan Interest/Fees/Prem 138,749 146,564 156,685 159,435 169,242 182,301 204,735 231,101 256,642 270,374 280,954 296,109 326,100 336,715 349,655 363,929 378,970 394,450Total Revenue 138,749 146,564 156,685 159,435 169,242 182,301 204,735 231,101 256,642 270,374 280,954 296,109 326,100 336,715 349,655 363,929 378,970 394,450
ExpendituresPayments to Suppliers/Claims/Grants 78,955 81,548 86,441 86,239 91,174 99,836 112,239 124,092 139,359 147,558 156,754 166,219 176,874 71.3% 183,833 191,423 199,425 207,695 216,141Payments for Employee Services and Benefits 9,228 9,835 10,379 11,259 11,371 12,103 12,990 13,235 15,088 16,290 16,231 16,021 15,487 6.2% 17,484 18,119 18,754 19,389 20,024Payments to State Suppliers 945 2,093 1,094 1,234 1,118 1,542 ‐1,285 1,820 7,217 4,220 3,177 1,112 3,333 1.3% 3,632 3,847 4,063 4,278 4,493Payments of Sales, School Lunch, and Premium Ta 22,534 22,854 24,974 24,004 25,597 29,390 31,824 36,302 41,312 40,764 42,610 45,283 52,348 21.1% 51,146 53,619 56,093 58,566 61,040Total Expenditures 111,662 116,330 122,888 122,736 129,260 142,871 155,768 175,449 202,976 208,832 218,772 228,635 248,042 256,094 267,009 278,334 289,928 301,697
Revenue‐Expenditures 27,087 30,234 33,797 36,699 39,982 39,430 48,967 55,652 53,666 61,542 62,182 67,474 78,058 80,621 82,646 85,595 89,041 92,753
CAFR Page # for each annual report pg. 150 pg. 156 pg. 137 pg. 141 pg. 147 pg. 147 pg. 149 pg. 155 pg. 157 pg. 161 pg. 165 pg. 171 pg. 1692000 2001 2002 2003 2004 2005 2006 2007 2008 2009 2010 2011 2012 2013 2014 2015 2016 2017
Receipts 138,749 146,564 156,685 159,435 169,242 182,301 204,735 231,101 256,642 270,374 280,954 296,109 326,100Receipts Projections 336,715 349,655 363,929 378,970 394,450Payments to Suppliers/Claims/Grants 78,955 81,548 86,441 86,239 91,174 99,836 112,239 124,092 139,359 147,558 156,754 166,219 176,874Payments to Suppliers/Claims/Grants Projection 183,833 191,423 199,425 207,695 216,141Payments of Sales, School Lunch, and Premium Taxe 22,534 22,854 24,974 24,004 25,597 29,390 31,824 36,302 41,312 40,764 42,610 45,283 52,348Payments of Sales, School Lunch, and Premium Taxes Projection 51,146 53,619 56,093 58,566 61,040DABC, Employee costs, all other 10,173 11,928 11,473 12,493 12,489 13,645 11,705 15,055 22,305 20,510 19,408 17,133 18,820DABC, Employee costs, all other Projection 21,116 21,966 22,816 23,667 24,517DABC Receipts Adopted 347,277 371,586DABC, Payments to Suppliers/Claims/Grants Adopted 176,972 189,360DABC, Payments of Sales, School Lunch, and Premium Taxes Adopted 56,467 60,420DABC, Employee costs, all other Adopted 19,220 21,847
Revenues ‐ Expenditures + Net Transfers 27,087 30,234 33,797 36,699 39,982 39,430 48,967 55,652 53,666 61,542 62,182 67,474 78,058Revenues ‐ Expenditures + Net Transfers Projection 80,621 82,646 85,595 89,041 92,753Cumulative, Revenues ‐ Expenditures + Net Transfers Projection 80,621 163,267 248,862 337,903 430,656
Appendix E: DABC Detail Table
Page 83