in brassica rapa l. and brassica oleracea l. expression
TRANSCRIPT
Page 1/29
Genome-wide identi�cation, and phylogenetic andexpression pro�ling analyses, of XTH gene familiesin Brassica rapa L. and Brassica oleracea L.Di Wu
Qufu Normal UniversityAnqi Liu
Qufu Normal UniversityXiaoyu Qu
Qufu Normal UniversityJiayi Liang
Qufu Normal UniversityMin Song ( [email protected] )
Qufu Normal University
Research article
Keywords: XTH, Brassica rapa, Brassica olerecea, tissue expression, Comparative genomics
Posted Date: October 12th, 2020
DOI: https://doi.org/10.21203/rs.3.rs-62331/v2
License: This work is licensed under a Creative Commons Attribution 4.0 International License. Read Full License
Version of Record: A version of this preprint was published at BMC Genomics on November 11th, 2020.See the published version at https://doi.org/10.1186/s12864-020-07153-1.
Page 2/29
AbstractBackground: Xyloglucan endotransglucosylase/hydrolase genes ( XTHs ) are a multigene family and playkey roles in regulating cell wall extensibility in plant growth and development. Brassica rapa and Brassicaoleracea contain XTHs, but detailed identi�cation and characterization of the XTH family in thesespecies, and analysis of their tissue expression pro�les, have not previously been carried out.
Results: In this study, 53 and 38 XTH genes were identi�ed in B. rapa and B. oleracea respectively, whichcontained some novel members not observed in previous studies. All XTHs of B. rapa , B. oleracea andArabidopsis thaliana could be classi�ed into three groups, Group I/II, III and the Early diverging group,based on phylogenetic relationships. Gene structures and motif patterns were similar within each group.All XTHs in this study contained two characteristic conserved domains (Glyco_hydro and XET_C). XTHsare located mainly in the cell wall but some are also located in the cytoplasm. Analyses of themechanisms of gene family expansion revealed that whole-genome triplication (WGT) events andtandem duplication (TD) may have been the major mechanisms accounting for the expansion of the XTHgene family. Interestingly, TD genes all belonged to Group I/II, suggesting that TD was the main reasonfor the largest number of genes being in these groups. B. oleracea had lost more of the XTH genes, theconserved domain XET_C and the conserved active-site motif EXDXE compared with B. rapa , consistentwith asymmetrical evolution between the two Brassica genomes. A majority of XTH genes exhibiteddifferent tissue-speci�c expression patterns based on RNA-seq data analyses. Moreover, there wasdifferential expression of duplicated XTH genes in the two species, indicating that their functionaldifferentiation occurred after B. rapa and B. oleracea diverged from a common ancestor.
Conclusions: We carried out the �rst systematic analysis of XTH gene families in B. rapa and B. oleracea .The results of this investigation can be used for reference in further studies on the functions of XTHgenes and the evolution of this multigene family.
BackgroundThe cell wall is an important characteristic structure in plant cells. Cell proliferation and volume increaseare inseparable from the process of cell wall reconstruction. Xyloglucan is a component of hemicellulosein the primary cell wall of higher plants. It consists of a cellulose chain with side chains ofoligosaccharides, each composed of a few xylose residues. Cell wall reconstruction is accompanied bybreakage and regeneration of the cell wall xyloglucan. Xyloglucan endotransglucosylase/hydrolase(XTH) can catalyze the breakage and connection of xyloglucan molecules and modify the �ber-xyloglucan composite structure of plant cell walls, making it one of the key enzymes in cell wallremodeling [1, 2].
The XTH family belongs to the glycoside hydrolase family 16 (GH16); common features of proteins inthis family are that they adopt a common β-jelly-roll fold and are active on a range of terrestrial andmarine polysaccharides [3-5]. XTH generally performs two catalytic functions, one being xyloglucan

Page 3/29
endoglucosidase (XEH) activity and the other being xyloglucan endohydrolase (XET) activity, whichspeci�cally hydrolyzes xyloglucan glycosidic bonds and promotes cell wall expansion, degradation, repairand morphogenesis [6-8]. Based on the structural characteristics of XTH proteins, they can be divided intothree groups, named I/II, III and the early diverging group. Of those reported to date, XTHs withglycosyltransferase activity belong mainly to Group I/II and those with hydrolase activity belong mainlyto Group III. There are two conserved domains in XTH proteins, named Glyco_hydro_16 and XET_C. TheXET_C domain distinguishes the XTH proteins from other proteins in the GH16 family [8-10].
XTHs are widespread in mosses, lycophytes, ferns, angiosperms and gymnosperms. [9,11-14]. Recently,XTH has even been found in algae [12]. XTHs have been widely reported in many plants, includingArabidopsis thaliana (33 genes), Oryza sativa (29 genes), Populus spp. (41 genes), Solanumlycopersicum (25 genes), Nicotiana tabacum (56 genes), Glycine max (61 genes), Hordeum vulgare (24genes) and Ananas comosus (24 genes) [13-20]. XTH genes show a diversity of tissue expression. InArabidopsis, AtXTH1, AtXTH21, AtXTH22, AtXTH30 and AtXTH33 are expressed mainly in green siliques,AtXTH24 and AtXTH32 mainly in stems [13]; AtXTH9 is preferentially expressed in �ower buds and �owerbranches, and mutation of this gene resulted in short internodes [21]. XTH proteins are active in theelongation regions of roots and hair cells of vascular plants [22]. Seven XTH genes in rice were found tobe speci�cally expressed in seedling roots [14]. DcXTH2 and DcXTH3 from Dianthus caryophyllus areexpressed mainly in petals [23]. XTH activity was detected during fruit expansion in Solanumlycopersicum, Malus domestica, Actinidia chinensis, and strawberry (Fragaria × ananassa Duch) [24-26].Constitutive expression of Brassica campestris BcXTH1 caused elongation of �owering branches andincreased height in transgenic Arabidopsis plants [27]. Overexpression of cotton (Gossypium spp)GhXTH1 improves cotton �ber length compared with that of wild type plants [28]. XTHs in Ananascomosus are involved in the regulation of fruit ripening and crassulacean acid metabolism and theyshow tissue speci�city [20]. These studies all indicated that XTH is closely linked to plant growth anddevelopment.
XTH genes are also associated with plant stress resistance. Overexpression of the Capsicum annuumXTH gene CaXTH3 enhanced drought and salt tolerance, accompanied by an increase in the number ofmesophyll cells and changes in leaf shape, in transgenic Arabidopsis and pepper plants [29,30].Overexpression of PeXTH from Populus euphratica in tobacco plants increased their capacity for salt andCd tolerance [31,32]. Overexpression of XTH from rose (Rosa rugosa) enhanced drought resistance intransgenic plants [33]. The T-DNA insertion mutants xth31, xth17 and xth15 were more aluminumresistant than the wild type in Arabidopsis [34]. MtXTH3 was induced by Hg exposure in Medicagotruncatula [26]. Some XTH genes are also regulated by hormones, such as gibberellin, brassinosteroids,ethylene and auxin [26].
The Brassicaceae are a large family of plants and many Brassica species are used as oilseed crops,vegetables or feed crops around the world. The Brassica ancestor diverged from a common ancestor withA. thaliana approximately 20 million years ago (Mya) followed by a whole genome triplication (WGT)approximately 15.9 Mya. Then the Brassica ancestor diverged to form the modern B. rapa and B. oleracea
Page 4/29
about 3.75 Mya [35-38]. The WGT event brought an increase in genomic materials in Brassica species,making them an excellent model with which to investigate the expansion and evolution of gene families.In addition to genome duplication, tandem duplication (TD) is another important mechanism that inducesan increase in the number of members of gene families, i.e. causes gene family expansion [39].
B. rapa and B. oleracea are important diploid species in the genus Brassica with completed genomesequencing projects and publicly released genome data, as well as being important as vegetables aroundthe world [40, 41]. Although Behar et al. identi�ed 48 and 27 XTHs in B. rapa and B. oleracea respectivelyby mining the JGI Phytozome v12.1 database [9], their characteristics are still unclear. In the presentstudy we identi�ed more XTHs in the genomes of B. oleracea and B. rapa using data from differentgenome versions/resources in three ways. The phylogenetic relationships, gene structures, chromosomelocations, subgenome distributions, and protein sequences and tissue expression patterns of the XTHswere then analyzed, laying a foundation for further study of XHT gene function in Brassica species andproviding useful information for gaining a better understanding of the function and evolution of this genefamily in higher plants; the �ndings may also help researchers to select the most appropriate targets forfurther genetic engineering and genetic improvement of Brassica crops.
ResultsIdentification and characterization of XTHs
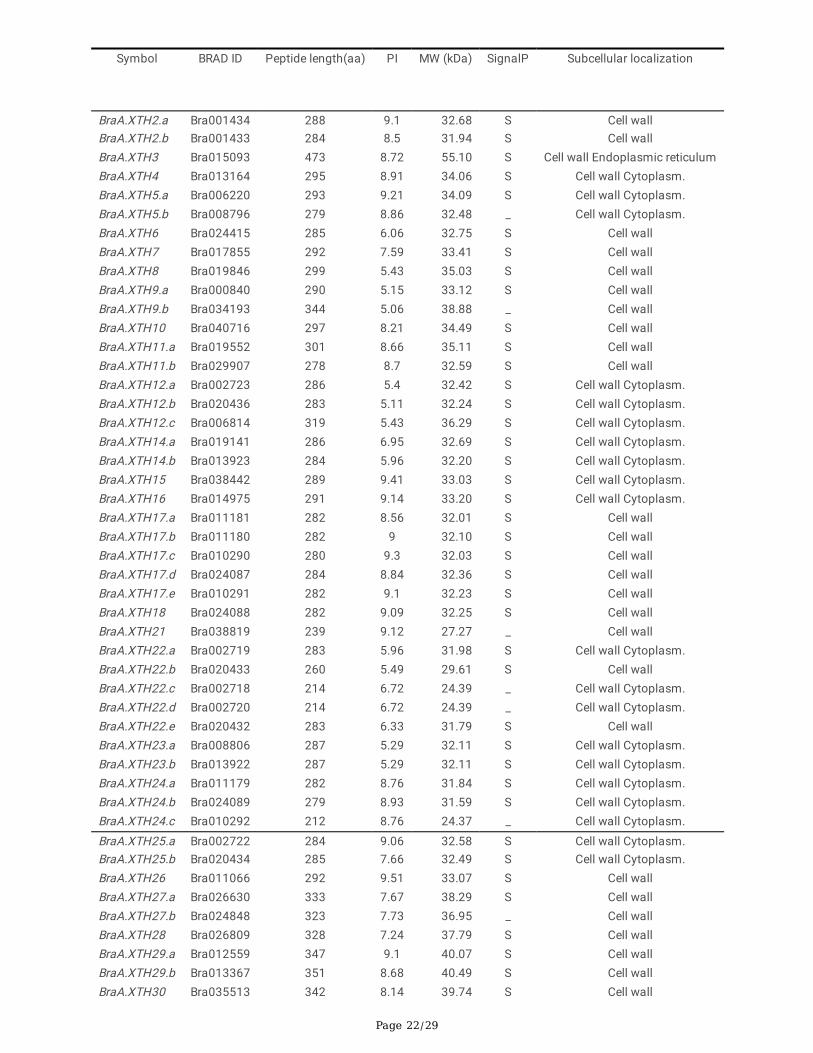
Compared with the 48 and 27 XTHs in B. rapa and B. oleracea that have previously been reported [9], weidenti�ed 53 and 38 XTHs, which include some novel members of the family, while Bol012212 was�ltered out in this study because of a lack of the XET_C domain. These genes were designatedcorresponding to the orthologous XTH genes in Arabidopsis (AtXTH) (Table 1). The identity of BraXTHsand their Arabidopsis orthologs ranged from 61% to 96%, while, the identity of BolXTHs and theirArabidopsis orthologs varying between 57% and 95% (Additional �le 1). Where the �nal lowercase letter inthe gene name is "a", this indicates the highest homology with Arabidopsis, "b" indicates the next highesthomology, and so on. The capital letter A or C in the name indicates, respectively, the B. rapa Ar genomeor the B. oleracea Co genome. The comparison results of BraXTHs reported in this paper and BraXTHs byBehar et al. [9] are shown in Additional �le 2.
No orthologs of AtXTH1, AtXTH2, AtXTH6, AtXTH10, AtXTH14, AtXTH18 or AtXTH19 were found in the B.oleracea genome, while the genome of B. rapa lacked orthologs of AtXTH1, AtXTH3, AtXTH19 andAtXTH20. Thus more XTH genes have been lost from B. oleracea than from B. rapa.
The lengths of BraXTHs ranged from 212 (BraA.XTH24.c) to 473 (BraA.XTH3) amino acids, with themolecular weights varying between 24.37 kDa to 55.10 kDa, while, the length of BolXTHs ranged from163 (BolC.XTH29.b) to 346 (BolC.XTH27.a) amino acids, with the molecular weights varying between18.67 kDa and 39.87 kDa. BraXTH3 was the largest XTH protein in this study. It possesses an ER lumenprotein retaining receptor (ER_lumen_recept: InterPro IPR000133, Pfam PF00810) domain in the N-terminal compared with other identi�ed XTHs.
Page 5/29
The theoretical PI values for XTHs ranged from 5.06 to 9.58 in B. rapa and 4.96-9.75 in B. oleracea due tothe differences in the polarities of the amino acids making up these proteins. The numbers of introns inXTH genes were relatively similar in the two species; 86.8% of BraXTH genes and 89.5% of BolXTH geneshad 2-3 introns, of which 24 BraXTHs and 19 BolXTHs had 3 introns, and 22 BraXTHs and 15 BolXTHshad 2 introns. The number of introns in BraA.XTH3 was the largest (7), while BolC.XTH29.b lackedintrons.
The Plant-mPLoc server (http://www.csbio.sjtu.edu.cn/bioinf/plant-multi/) was used to predict thesubcellular location of BraXTH and BolXTH proteins. The result showed that all XTH proteins werelocated on the cell wall. In addition to the cell wall, 20 BraXTHs and 12 BolXTHs were also predicted tolocalize in the cytoplasm. BraA.XTH3 was found to be located in both the cell wall and the endoplasmicreticulum. XTH localize just were bioinformatic speculation and the real situation will be experimentalevidence. The signal peptide prediction results indicated that 46 BraXTHs and 33 BolXTHs had signalpeptides.
Phylogenetic analysis of XTH proteins
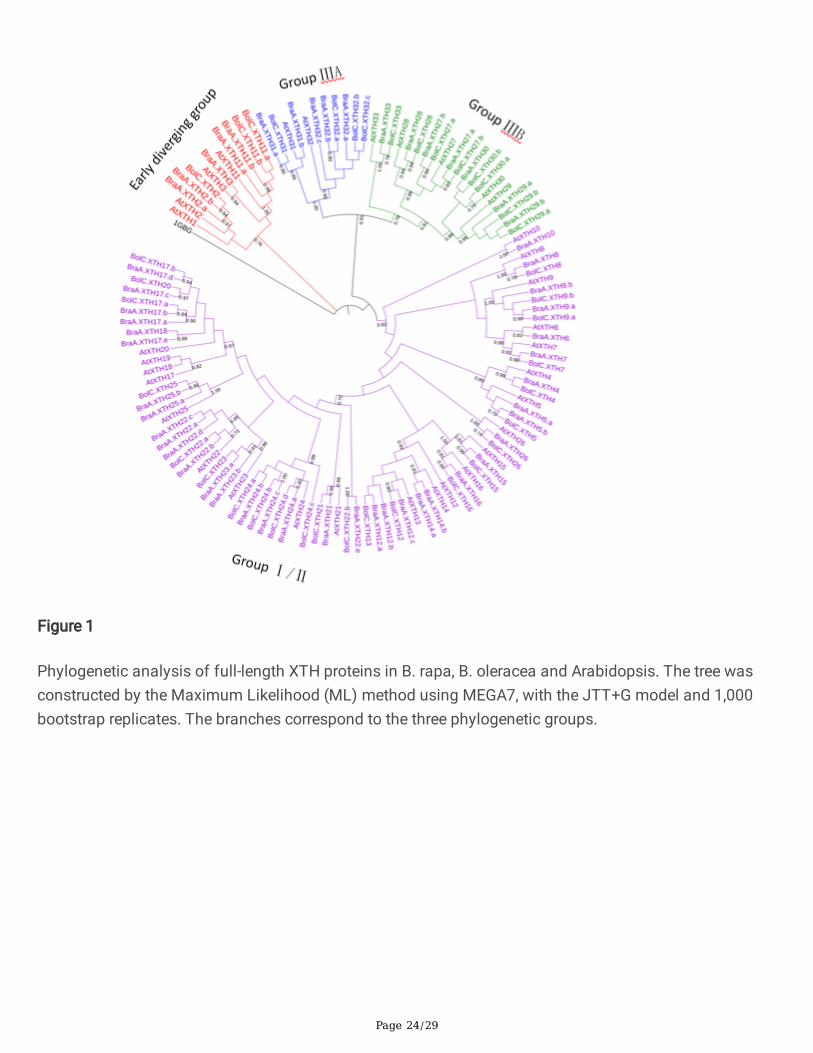
In order to investigate the evolutionary relationship among different XTH gene family members, we usedthe full-length XTH protein sequences from B. rapa, B. oleracea and A. thaliana to generate a phylogenetictree based on the Maximum Likelihood method, using a structurally characterized bacterial lichenase(1GBG, EC 3.2.1.73) as an outgroup Fig.1, Additional �le 3 . Three groups (Early diverging group, GroupI/II and Group III) were identi�ed based on clade support values, the topology of the phylogenetic tree, andthe previous classi�cation of XTH families in Arabidopsis [6,13]. So far, XEH activity has only beenreported in clade IIIA [9,42]. The early diverging close to the root was the smallest group, containing 12members. There were 11 XTHs in Group IIIA and 20 in Group IIIB. The rest of the XTHs belonged to GroupI/II, which included 22 AtXTHs, 35 BraXTHs and 23 BolXTHs. As Fig. 1 shows, XTHs from B. rapa and B.oleracea were clustered with their A. thaliana homologs. There were 41 sister pairs at the termini ofphylogenetic tree branches that showed close relationships and 30 of these were orthologous pairsbetween the B. rapa genome and the B. oleracea genome.
Structure of XTH genes, pattern of motifs and structure-based sequence alignment in XTH proteins
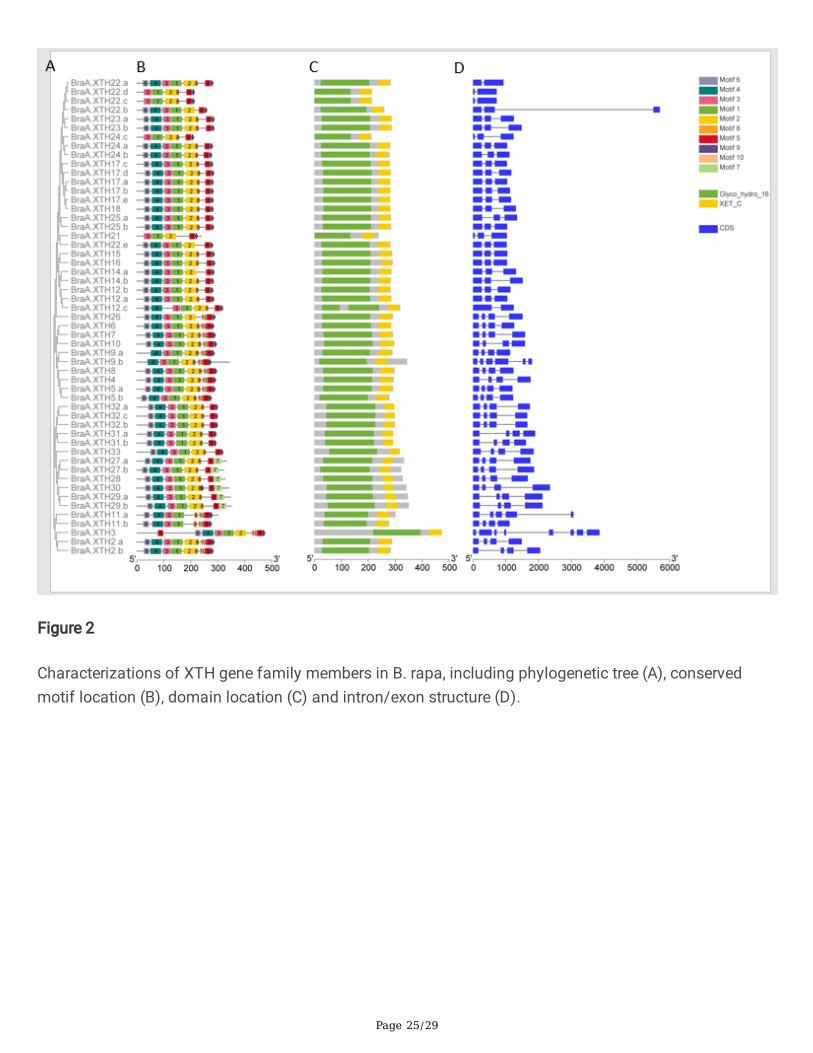
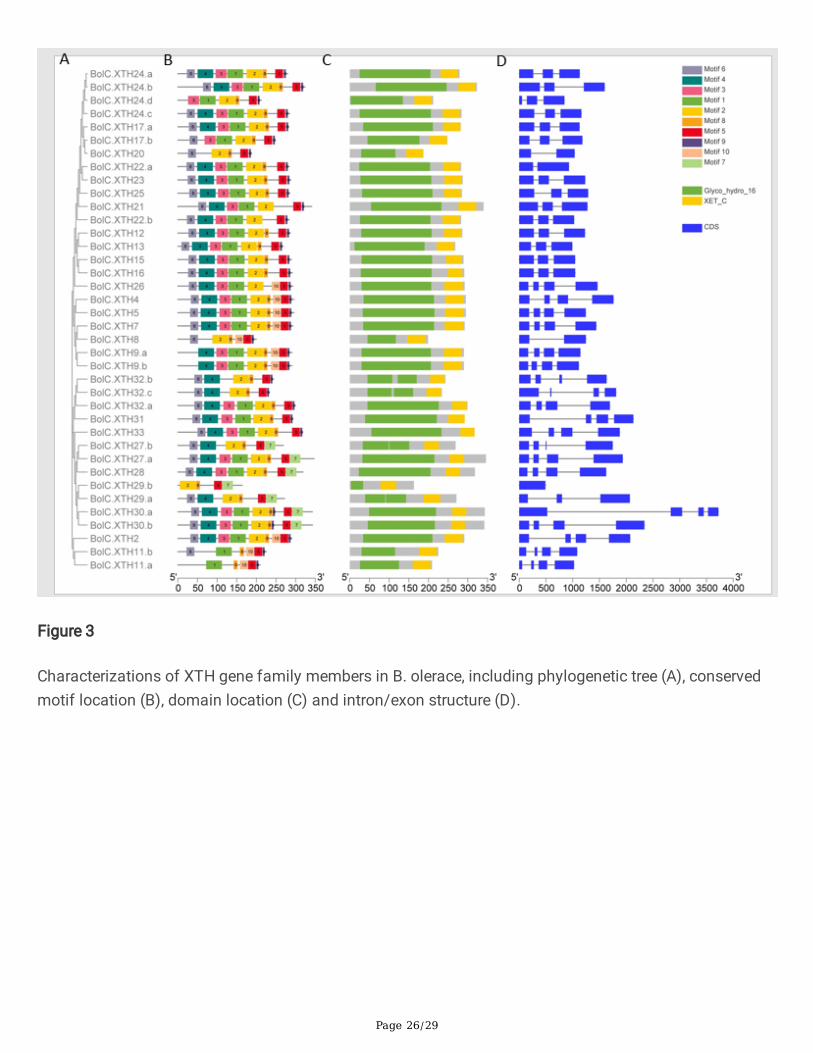
Previous studies showed that the exon organization in Arabidopsis XTH genes is well conserved withineach group [13,43].To better characterize the structural conservation and diversi�cation of XTH genesduring their evolution, the exon-intron organization of the coding sequences of individual XTH genescoding sequence was obtained for members of each group. Each XTH protein in the two species had aGlyco_hydro_16 domain and an XET_C domain. As shown in Fig.2B, 2C and Fig.3B, 3C, theGlyco_hydro_16 domain spanned the sequence of motifs 6-4-3-1-2-8, though some proteins lacked one ormore of these motifs. The lengths of 4 BraXTHs and 9 BolXTHs, including 7 newly identi�ed XTHs, areless than 250 amino acids, due to the deletion of 1 to 4 motifs from the Glyco_hydro_16 domain (Fig. 2,3). The XET_ C domain mainly covered motifs 5 and 9. Fifteen BraXTHs and 10 BolXTHs also sharedmotif 10, forming the block 10-5-9. Six BraXTHs and 7 BolXTHs replaced motif 9 with motif 7, forming a
Page 6/29
new tandem motif pattern (motif 5-7 in tandem). Overall, motifs had a similar distribution within thesame group.
In addition to XTH26, all genes in Group I contained 1-2 introns. Apart from XTH8, all genes in Group IIcontained 3 introns. All Group III genes in the two species had 3 introns with the exceptions ofBolC.XTH29.a and BolC.XTH29.b. Generally, the motif patterns in different XTH proteins showed onlysmall differences, and the genes that clustered in the same group showed similar patterns of genestructure.
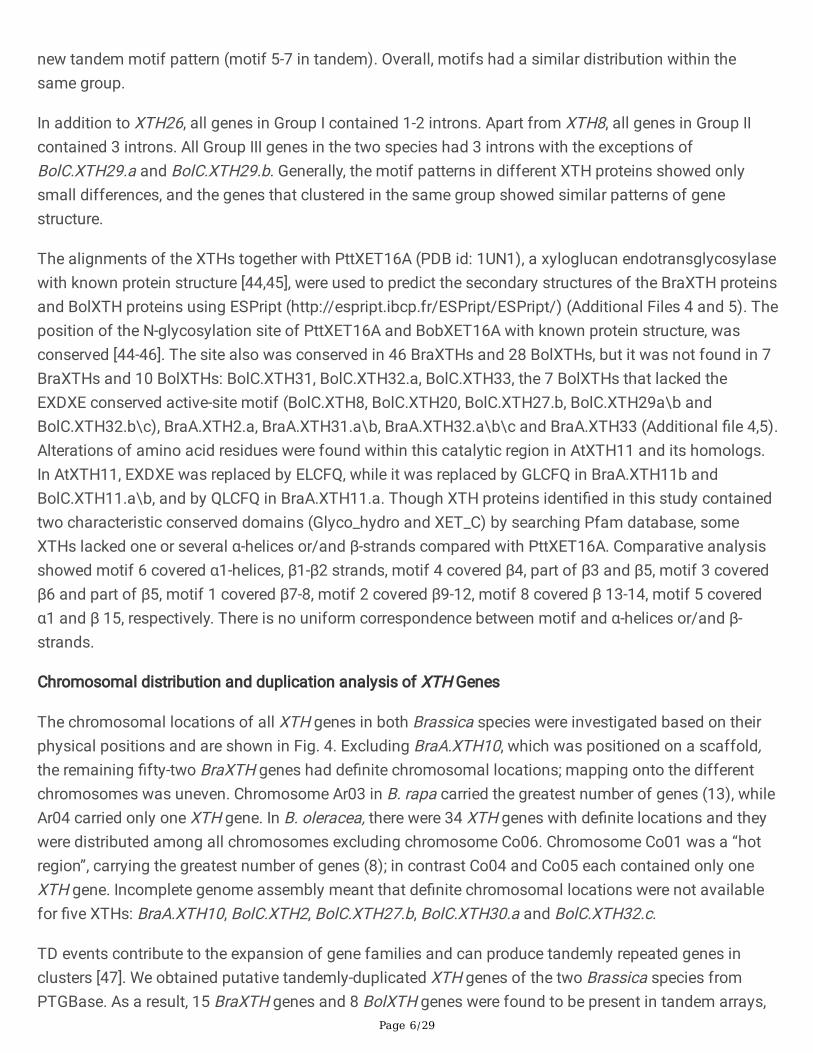
The alignments of the XTHs together with PttXET16A (PDB id: 1UN1), a xyloglucan endotransglycosylasewith known protein structure [44,45], were used to predict the secondary structures of the BraXTH proteinsand BolXTH proteins using ESPript (http://espript.ibcp.fr/ESPript/ESPript/) (Additional Files 4 and 5). Theposition of the N-glycosylation site of PttXET16A and BobXET16A with known protein structure, wasconserved [44-46]. The site also was conserved in 46 BraXTHs and 28 BolXTHs, but it was not found in 7BraXTHs and 10 BolXTHs: BolC.XTH31, BolC.XTH32.a, BolC.XTH33, the 7 BolXTHs that lacked theEXDXE conserved active-site motif (BolC.XTH8, BolC.XTH20, BolC.XTH27.b, BolC.XTH29a\b andBolC.XTH32.b\c), BraA.XTH2.a, BraA.XTH31.a\b, BraA.XTH32.a\b\c and BraA.XTH33 (Additional �le 4,5).Alterations of amino acid residues were found within this catalytic region in AtXTH11 and its homologs.In AtXTH11, EXDXE was replaced by ELCFQ, while it was replaced by GLCFQ in BraA.XTH11b andBolC.XTH11.a\b, and by QLCFQ in BraA.XTH11.a. Though XTH proteins identi�ed in this study containedtwo characteristic conserved domains (Glyco_hydro and XET_C) by searching Pfam database, someXTHs lacked one or several α-helices or/and β-strands compared with PttXET16A. Comparative analysisshowed motif 6 covered α1-helices, β1-β2 strands, motif 4 covered β4, part of β3 and β5, motif 3 coveredβ6 and part of β5, motif 1 covered β7-8, motif 2 covered β9-12, motif 8 covered β 13-14, motif 5 coveredα1 and β 15, respectively. There is no uniform correspondence between motif and α-helices or/and β-strands.
Chromosomal distribution and duplication analysis of XTH Genes
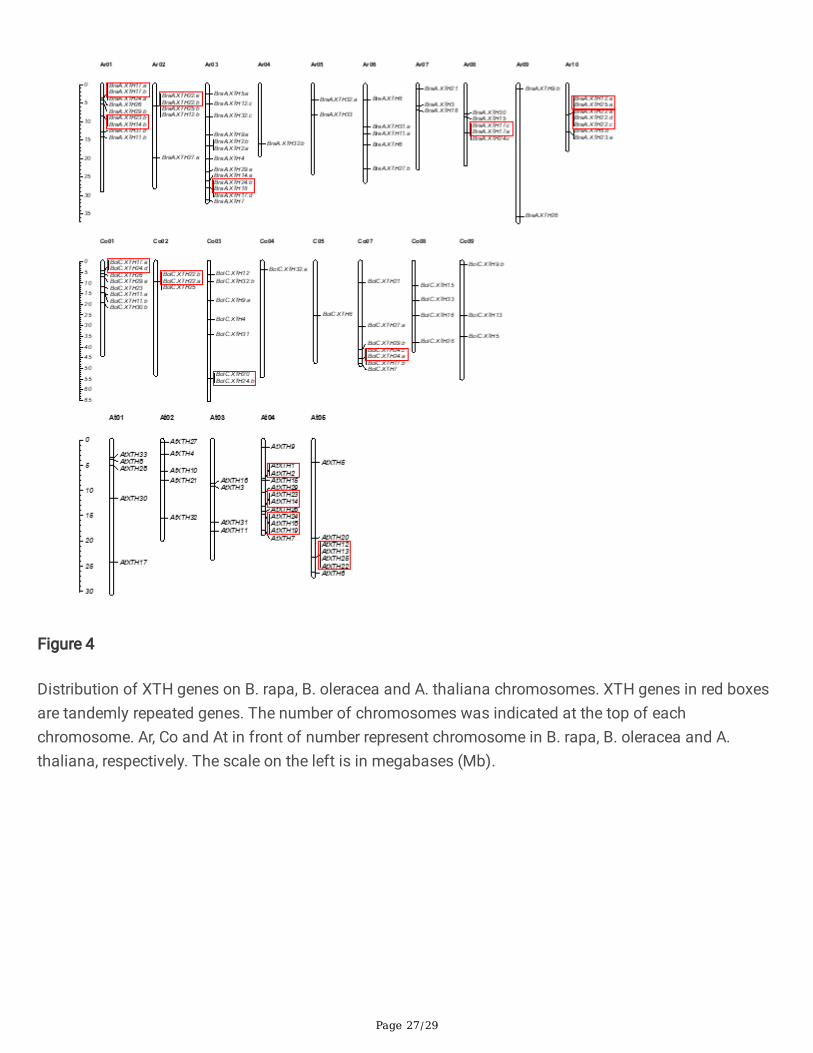
The chromosomal locations of all XTH genes in both Brassica species were investigated based on theirphysical positions and are shown in Fig. 4. Excluding BraA.XTH10, which was positioned on a scaffold,the remaining �fty-two BraXTH genes had de�nite chromosomal locations; mapping onto the differentchromosomes was uneven. Chromosome Ar03 in B. rapa carried the greatest number of genes (13), whileAr04 carried only one XTH gene. In B. oleracea, there were 34 XTH genes with de�nite locations and theywere distributed among all chromosomes excluding chromosome Co06. Chromosome Co01 was a “hotregion”, carrying the greatest number of genes (8); in contrast Co04 and Co05 each contained only oneXTH gene. Incomplete genome assembly meant that de�nite chromosomal locations were not availablefor �ve XTHs: BraA.XTH10, BolC.XTH2, BolC.XTH27.b, BolC.XTH30.a and BolC.XTH32.c.
TD events contribute to the expansion of gene families and can produce tandemly repeated genes inclusters [47]. We obtained putative tandemly-duplicated XTH genes of the two Brassica species fromPTGBase. As a result, 15 BraXTH genes and 8 BolXTH genes were found to be present in tandem arrays,
Page 7/29
representing 28.3% and 21.1% of the total XTH genes in B. rapa and B. oleracea respectively. Thesetandemly repeated genes were clustered, which was consistent with their chromosomal locations (Fig.4).Seven tandem arrays were identi�ed on chromosomes Ar01, Ar02, Ar03, Ar08 and Ar010 in B. rapa.Protein BLAST analysis revealed that BraA.XTH17.a is 93% identical to BraA.XTH17.b, BraA.XTH22C is99% identical to BraA.XTH22.c or BraA.XTH22.d, and BraA.XTH22.a is 100% identical and 75% coverageto BraA.XTH22.d. The identity of the other tandem gene pairs is varying from 55% to 68%. Four tandemarrays occurred on Co01, Co02, Co03 and Co07 in B. oleracea, with 58% to 84% identity of tandem genepairs.
In A. thaliana, four tandemly duplicated gene arrays composed of nine AtXTHs were found (Fig.4).Tandem arrays including AtXTH1/2, AtXTH23/14 and AtXTH24/18/19 were located on chromosomeAt04 while AtXTH12/13/25/22 was on chromosome At05. It is worth mentioning that some genes thatbear syntenic relationships to these tandem genes, though not AtXTH1/2, have a conserved tandemrepeat pattern in both the B. rapa genome and the B. oleracea genome, suggesting that these tandemarrays arose before the divergence of A. thaliana and the Brassica ancestor.
Syntenic analyses of XTH genes
The ancestor of diploid Brassica species experienced a WGT event since divergence from the Arabidopsislineage. Syntenic genes are orthologous genes located in fragments syntenic between different speciesthat derive from a shared ancestor, and synteny analysis can be used to transfer gene annotations andinvestigate genomic evolution in related species [48]. We obtained the genes syntenic with the XTH genesof Arabidopsis for the two Brassica species by searching for ‘syntenic gene’ in BRAD Additional �le 6 .According to comparative genomics analysis, the density and expression level of genes in differentregions show some differences in the genomes of B. rapa and B. oleracea, which can be divided intothree fractionated subgenomes which we denoted LF (Least-fractionated), MF1 (Medium-fractionated),and MF2 (Most-fractionated) according to the extent of gene retention [41,49]. Statistical analysisindicated that there were 13, 13, and 6 BraXTH genes and 9, 10, and 5 BolXTH genes located in the LF,MF1 and MF2 subgenomes respectively (Additional �le 6). In summary, 60.4% and 63.2% of the total XTHgenes in, respectively, B. rapa and B. oleracea were located in syntenic blocks. WGD events are thereforelikely to have played a major role in the expansion of XTH genes in the two Brassica species. Theidentities of 75% (24 out of 32) BraXTHs and 62.5% (15 out of 24) BolXTHs with their Arabidopsissyntenic orthologs exceeded 80% (Additional �le 6)
A total of 23 AtXTH genes had corresponding syntenic genes in the two Brassica species. The copynumbers of syntenic genes in the genomes of the two Brassica species differed. The �rst situation wasone in which genes syntenic with AtXTH genes were completely preserved in the same syntenic block inthe Ar and Co subgenome; 8 genes were of this type. In the second case, AtXTH genes were retained inthe Ar genome but lost from the Co genome, this applied to AtXTH3 and AtXTH5. The third case waswhere AtXTH genes had more than one syntenic gene in B. rapa or B. oleracea. For example, 8 and 1AtXTH genes had 3 syntenic genes in B. rapa and B. oleracea respectively. An AtXTH should theoretically
Page 8/29
correspond to 3 syntenic genes and if there are fewer than 3 it may be the result of gene loss aftergenome replication.
Selection forces acting on XTH duplicated pairs
To assess whether XTH duplicated pairs in Brassica species experienced different selective forces, Ka/Ksvalues were calculated (Additional �le 7). A Ka/Ks ratio > 1 represents positive selection, Ka/Ks = 1represents neutral selection and a Ka/Ks ratio < 1 represents purifying selection [50]. We found 33 and 18segmentally duplicated XTH gene pairs in B. rapa and B. oleracea respectively. All segmentally duplicatedXTH gene pairs had Ka/Ks <1, while two tandemly duplicated gene pairs (BraA.XTH22.a-BraA.XTH22.dand BraA.XTH22.c-BraA.XTH22.d) had no Ka/Ks value in B. rapa because they shared the samesequence.
The segmental duplications of the XTH genes in B. rapa originated between 0.34 Mya (Ks = 0.0103) and28.80 Mya (Ks = 0.8640), with a mean of 12.88 Mya (Ks = 0.1436). After comparative analysis, thesegmental duplications of the BolXTH genes were found to have originated from 5.37 Mya (Ks = 0.1612)to 32.12 Mya (Ks = 0.9637), with a mean of 13.20 Mya (Ks = 0.3960). Overall, the Ka/Ks ratios forsegmental duplication of BolC.XTH11.b and BolC.XTH11.a, BraA.XTH2.b and BraA.XTH2.a, together withBraA.XTH23.a and BraA.XTH23.b, were >0.3, while the ratios for the other segmental duplication pairswere all <0.3, suggesting that signi�cant functional divergence of some XTH genes might have occurredafter the duplication events.
Expression patterns of XTH genes in different tissues of B. rapa and B. oleracea
To understand the variations in expression pattern for XTH genes, we analyzed XTH gene expressionpatterns across different tissues in the two species of Brassica based on RNA-Seq retrieved from the GEOdatabase (Additional �le 8). If the FPKM of a gene was less than 1, it was considered to be anunexpressed gene in this study, including BraA.XTH2.a/b, BraA.XTH5.b, BraA.XTH11.a,BraA.XTH12.a/b/c, BraA.XTH25.a/b, BolC.XTH5, BolC.XTH11.a, BolC.XTH20, BolC.XTH21, BolC.XTH22.b,BolC.XTH24.c, BolC.XTH25 and BolC.XTH26. In addition, BolC.XTH12 and BolC.XTH13 lacked FPKMvalues. On this basis, 44 BraXTH genes and 28 BolXTH genes were expressed in at least one tissue, whilethe remaining genes lacked expression data or were unexpressed in all the tissues tested, indicating thatthey might be non-functional or have speci�c temporal and spatial expression patterns that were notdetected in this study. There were 23 out of 53 (approximately 43.4%) BraXTH genes and 14 out of 38(approximately 36.8%) BolXTH genes that were widely expressed in all the tissues tested (root, stem, leaf,�ower, silique and callus of B. rapa; root, stem, leaf, �ower, silique, callus and bud of B. oleracea). Theremaining 21 BraXTH genes and 14 BolXTH genes were expressed in at least one but not in all testedtissues. For example, BraA.XTH29.a and BraA.XTH29.b were expressed speci�cally in the �ower;BraA.XTH10, BraA.XTH17.c, BraA.XTH17.d and BraA.XTH32.b were expressed in all tissues except callus.BolC.XTH2 was expressed solely in the silique and BolC.XTH29.b was expressed only in buds at lowlevels.
Page 9/29
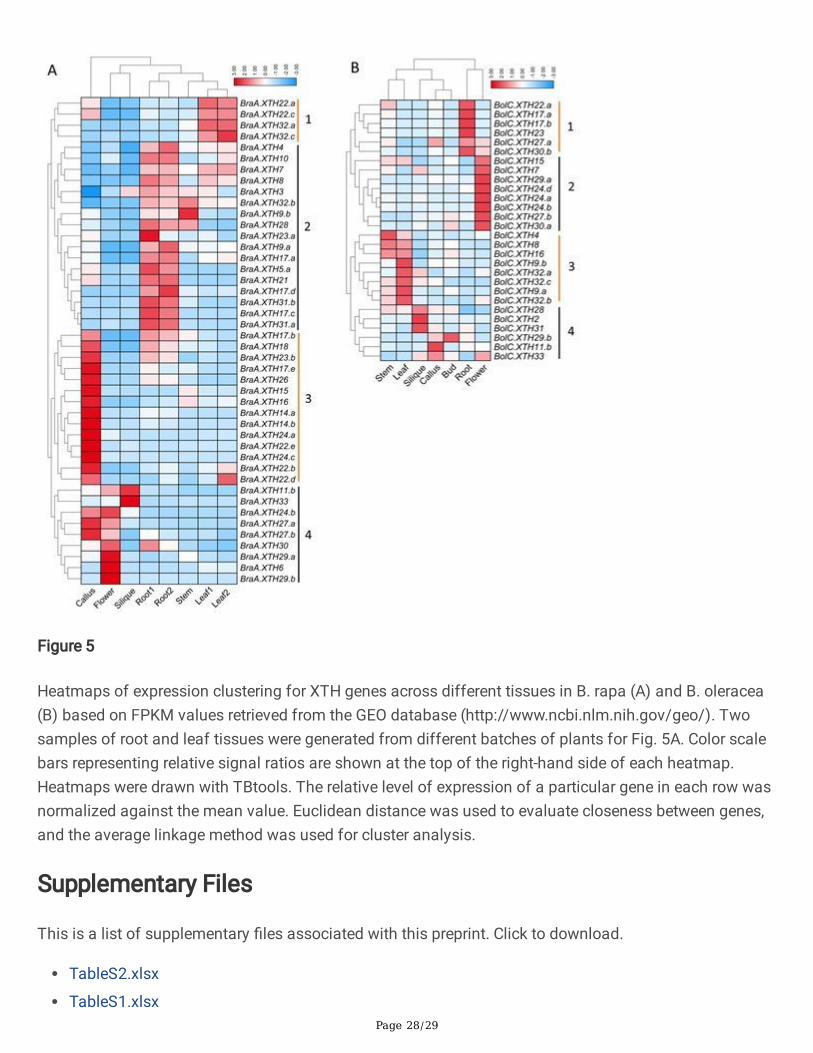
Clustering analysis of expression values showed that both the B. rapa and the B. oleracea XTH genes canbe divided into four groups (Fig. 5). In B. rapa, XTH genes in cluster 1 were more highly expressed in theleaf than in the other tissues examined, while cluster 2 were expressed mainly in the root, apart fromBraA.XTH32.b and BraA.XTH9.b. Cluster 3 showed higher expression in callus and group 4 wasexpressed mainly in �ower, silique or callus. In B. oleracea, XTH genes in cluster 1 were highly expressedin the root, whereas cluster 2 was expressed mainly in the �ower. Four genes in cluster 3 were expressedmainly in the stem or leaf and genes in cluster 4 were expressed mainly in the leaf, silique or callus. XTHgenes in the same group based on phylogenetic analysis did not show the same expression patterns.
Some tandemly repeated family members, such as BraA.XTH22.a and BraA.XTH22.c in cluster 1, showedsimilar expression patterns across the tissues tested, indicating the possible existence of redundancy(Fig. 5A). However, most tandemly repeated members displayed distinct expression patterns. Forexample, BolC.XTH24.a and BolC.XTH24.b showed higher expression levels in the �ower than the othertissues, whereas tandem repeats of them, BolC.XTH24.c and BolC.XTH20, were not expressed in thesetissues. BolC.XTH17.a showed high expression in the root and low expression in the bud, leaf and silique,while BolC.XTH24.d showed high expression in the �ower and low expression in the leaf (Fig. 5,Additional �le 8). All XTH tandem genes in seven arrays were also analyzed and compared in B. rapa. Atotal of 2 tandem genes (BraA.22b/e and BraA.14b/23b) showed different abundances, but the sametrend with respect to patterns, whereas the two members of each of the other pairs of tandem genesshowed differences in abundance and tissue speci�city of expression. In general, XTH genes in the twoBrassica species exhibit differential patterns of expression across different tissues, leading to differentfunctional clusters and suggesting functional divergence.
DiscussionThe XTH gene family expanded in B. rapa and B. oleracea
Previous studies revealed that the Brassica genome, like that of A. thaliana, underwent three paleo-polyploidy events. Brassica species also shared an additional WGT event since isolation fromArabidopsis [40,41]. Compared to the 33 AtXTH genes [13], higher numbers of XTH genes were identi�edin the B. rapa (53 genes) and B. oleracea (38) genomes. Moreover, 60.4% and 63.2% of the total XTHgenes in, respectively, B. rapa and B. oleracea were located in syntenic blocks. WGD events thereforeplayed a major role in the expansion of XTH genes in these two Brassica species. The secondary forceleading to the expansion of XTH genes was tandem duplication. There were, respectively, 28.3% and21.1% of the total XTH genes that were involved in tandem arrays in B. rapa and B. oleracea, and B. rapahas more tandem XTH genes than B. oleracea, which indicated that B. oleracea has lost some of its XTHtandem genes during the process of gene duplication. It re�ects the ampli�cation of tandem repeat genesis asymmetric between the two species. Tandem duplication also contributed to XTH gene familyexpansion in barley, tobacco, sorghum, and soybean [15,19, 51, 52].
Page 10/29
Since the Brassica ancestor diverged from its common ancestor with A. thaliana ~20 Mya; itsubsequently underwent a WGT event ~15.9 Mya. Then the Brassica ancestor diverged to form themodern B. rapa and B. oleracea about 3.75 Mya [35-38]. In this study, we found that most of thesegmental duplications of BraXTH and BolXTH genes occurred before the divergence of the modern B.rapa and B. oleracea. However, BraA.XTH16 and BraA.XTH15 arose around 28.80 Mya before thedivergence of the Brassica ancestor and its common ancestor with A. thaliana, while BraA.XTH23.a andBraA.XTH23.b arose around 0.34 Mya after the divergence of the modern B. rapa and B. oleracea.
The XTH gene family is highly conserved at the DNA and protein level
The XTH proteins of A. thaliana B. rapa and B. oleracea can be divided into 3 groups according to theresults of phylogenetic analysis. The number of genes in Group IIIA is the smallest, while the number inGroup I/II is the largest, which is consistent with results obtained from other plants [20]. All XTH proteinswere found to be located at the cell walls and this positioning is consistent with the function of XTHproteins involved in cell wall reconstruction. In addition, some XTHs, all members of Group I/II, were alsofound to be located in the cytoplasm. These �ndings were similar to those reported in barley andpineapple [15,20]. Interestingly, the TD genes all belong to Group I/II, suggesting that TD is the reason forthe large number of genes in this group. It has been reported that proteins showing XET activity belongmostly to Groups I/II and IIIB, while proteins showing XEH activity belong mostly to group IIIA [3,9,26].Thus Brassica XTH members in different groups may show different types of enzyme activity. Unlike theproteins in other groups, the Group IIIB proteins of the two species contained motif 7, suggesting that thismotif may be related to the speci�c function(s) of the IIIB proteins.
Gene and domain loss events in the XTH family
The genome size of B. rapa and B. oleracea is different, at about 529 Mb and 696 Mb respectively, andthe total number of genes according to the PLAZA 4.5 database is about 42,000 and 45,000 respectively[27]. However, B. rapa apparently has more XTHs than B. oleracea; this may be because the B. oleraceagenome assembly was incomplete, leading to incomplete identi�cation, or may be due to a greater loss ofXTH genes from B. oleracea.
Compared with A. thaliana, the Brassica genome experienced a unique triplication event [40,41]. Hence,each XTH gene in Arabidopsis should correspond to three homologs in B. rapa and B. oleracea. However,the number of XTH genes obtained from each of the two species was far less than three times thenumber of XTH genes in A. thaliana. All the AtXTH genes had 0-2 orthologs in the genomes of the twospecies, apart from AtXTH32, which had three homologs. This indicates that the loss of XTH genesoccurred after the Brassica WGT event. Synteny analysis revealed that 61.5% of the XTH genes of the twoBrassica species were located in conserved chromosomal blocks, whereas some genes had been deleted.These syntenic blocks account for the majority of the XTH genes in A. thaliana (75.76% of the genes), B.oleracea (63.16%) and B. rapa (84.21%). At the whole genome level syntenic blocks contain 72.24%,57.88% and 64.84% of the genes in A. thaliana, B. oleracea and B. rapa respectively [41]. B. oleracea had

Page 11/29
lost a considerably greater number of XTH genes compared with B. rapa, consistent with the asymmetryof gene loss between the two genomes.
After carrying out comparative analysis of the pattern of retention/loss of orthologous genes in each setof three subgenomic (LF, MF1 and MF2) blocks of the two species corresponding to A. thaliana, we foundthe XTH genes retained in B. rapa and B. oleracea are mostly located in the LF subgenome and the MF1subgenome, which is consistent with the retention pattern for their genomes as a whole. The MF2subgenome retained the fewest XTH genes and has thus undergone the greatest loss of orthologousgenes. The MF1 subgenome had lost the largest number of genes at the whole genome level. There weredifferences in the levels of XTH loss among the three subgenomic (LF, MF1 and MF2) blocks, which wasconsistent with the difference in gene loss rate among subgenomes [41].
Previous research demonstrated that statistically, more than one-third of all domains have a markedtendency to increase/decrease in size during protein evolution [53]. XTH proteins generally contain acharacteristic motif, EXDXE, which contains amino acid residues that mediate catalytic activity. Site-directed mutation of AtXTH22 has indicated that the �rst glutamine residue in this motif is required forcatalytic activity [54]. Compared with the AtXTH protein structures, there were seven BolXTHs lacking theEXDXE conserved active-site motif: BolC.XTH8, BolC.XTH20, BolC.XTH27.b, BolC.XTH29a\b andBolC.XTH32.b\c. In addition, several proteins encoded by syntenic XTH genes had a Glyco_hydro_16domain but lacked an XET_C domain, so that they could not be identi�ed as XTHs in this study. Thesephenomena re�ect differences in the evolution of homologous genes between the B. rapa genome andthe B. oleracea genome, and the higher level of DNA loss from the B. oleracea genome. Domain loss hasalso been observed in Hsp70 genes of Brassica species [55].
The patterns of expression of XTH genes
Previous research using GUS staining in Arabidopsis [56] showed that AtXTHs are probably expressed inall developmental stages from seed germination through to �owering. In this study, 83% and 74% of theXTH genes in, respectively, B. rapa and B. oleracea were expressed across all the tissues examined.Comparative analysis showed that the AtXTH orthologs in B. rapa and B. oleracea showed differentexpression characteristics, even among orthologous genes with high levels of identity of amino acidsequences. In a previous study AtXTH21, AtXTH22 and AtXTH30 were found to be expressed mainly insiliques [13]. However, their orthologs in the two Brassica species exhibited different expression patterns.For example, BraA.XTH21 had only a low expression level in callus and roots, but BolC.XTH21 was notexpress; BolC.XTH22.a was expressed mainly in roots, stems and callus, while BolC.XTH22.b was notexpressed in any of the tissues examined; BraA.XTH30 showed high expression levels in callus, roots and�owers, while BolC.XTH30.a showed its highest expression level in �owers, and BolC.XTH30.b wasexpressed most highly in roots. BraA.XTH33 showed the highest expression level in siliques, consistentwith its Arabidopsis homolog (AtXTH33), but BolC.XTH33 was expressed in callus, silique and �ower atan intermediate level. BolC.XTH24.a/b/d all showed the highest expression levels in �owers butBolC.XTH24.c showed no expression in this tissue, BraA.XTH24.a/b/c showed their highest expression
Page 12/29
levels in callus, followed by �owers, whereas the expression of its Arabidopsis homolog (AtXTH24) wasmainly in stems [13].
Duplicated genes usually share high levels of sequence similarities; however, over the course of evolution,the fates of duplicated genes may be quite different, as they undergo nonfunctionalization,neofunctionalization or subfunctionalization [57]. As a result of comparative analysis of the expressionpro�les of XTH genes involved in tandem and segmental duplications, patterns of similar, different orsilenced gene expression relative to other members were found. For example, BraA.XTH32.a andBraA.XTH32.c, BraA.XTH14.a and BraA.XTH14.b, which were segmentally duplicated genes, exhibitedsimilar expression behavior, indicating that their roles may have been conserved after the duplicationevents. BraA.XTH23.a and BraA.XTH23.b, together with BolC.XTH11.a and BolC.XTH11.b, showeddifferent expression patterns, suggesting that divergence in gene expression may have been associatedwith the acquisition of novel characteristics (Fig. 5, Additional �le 8). BraA.XTH5.a was expressed in rootsbut BraA.XTH5.b was not expressed in any of the tissues tested, suggesting that it had experiencednonfunctionalization after the duplication events (Fig. 5A, Additional �le 8).
ConclusionsIn this study, 53 and 38 XTH genes were identi�ed in B. rapa and B. oleracea respectively. They, togetherwith the 33 Arabidopsis XTH genes, were classi�ed into three groups (Early diverging group, Group I/IIand Group III) by phylogenetic analysis based on clade support values, the topology of the phylogenetictree, and the previous classi�cation of XTH families in Arabidopsis. Exon-intron distribution andcomparisons of conserved motifs also supported this classi�cation of XTH genes. Analysis of expansionmechanisms revealed that a WGT event exerted the most major in�uence, followed by TD events, on theexpansion of the XTH gene family in both Brassica species. Gene loss events have occurred in the XTHgene family in the two species; the extent of loss was greater in B. oleracea than in B. rapa. RNA-seq dataanalysis provided insight into species-speci�c functional divergence among members of the XTH genefamily. Taken together, these results increase our understanding of the evolution of the XTH gene familyand provide a reference for future determination of the functions of each XTH gene across Brassicaspecies.
MethodsData Sources
Genomic sequences, CDS sequences, protein sequences and annotation information for B. rapa and B.oleracea were downloaded from the BRAD database (http://brassicadb.org) [58]. A. thaliana XTH proteinsequences were downloaded from TAIR (http://www.arabidopsis.org/) [59].
Identification of XTH genes and analysis of their characteristics
Page 13/29
Three methods were used to identify XTH proteins in this study. First, all 33 A. thaliana XTH sequencesobtained from the TAIR database were used as query sequences to carry out a BLASTp (E-value <1e-5)search for all protein sequences from B. rapa and B. oleracea in the BRAD database. Second, the HMMpro�les of the Glyco_hydro_16 domain (PF00722) and XET_C domain (PF06955) were obtained from thePfam database (https://Pfam.xfam.org/) [60] and used to search all B. rapa and B. oleracea proteins withthe HMM search tool in the TBtools software package [58] with default parameters. The third approachwas to search for syntenic genes in the BRAD database by inputting the A. thaliana XTH gene IDs [61].After integrating the results of the three methods, all redundant sequences were removed manually, afterwhich candidate XTH protein sequences were �ltered using the CDD tool(http://www.ncbi.nlm.nih.gov/Structure/cdd/wrpsb.cgi/) [62]. Only proteins that contained both theGlyco_hydro_16 domain and the XET_C domain were regarded as XTHs and reserved for further analysis.Finally, all genes identi�ed as encoding XTH proteins were designated with reference to a previous study[63].
The molecular weight (Mw), number of amino acids and theoretical isoelectric point (pI) of each proteinwere obtained from ProtParam (http://web.expasy.org/protparam/) [64]. Plant-mPLoc(http://www.csbio.sjtu.edu.cn/bioinf/plant-multi/) [65] was used to predict patterns of protein subcellularlocalization. The TargetP-2.0 Server (http://www.cbs.dtu.dk/services/TargetP/) [66] was used to predictthe presence or absence of signal peptides. The MEME tool (http://meme-suite.org/tools/meme) [67] wasemployed to predict and analyze the motifs in each protein, with parameters set as follows: motif width6–60, maximum number of motifs 10 and default values were used for the remaining parameters. Thedistribution of motifs was illustrated using the Redraw motif pattern tool in TBtools.
Comparative phylogenetic analysis of XTH proteins
Multiple sequence alignments of the full-length XTH protein sequences from B. rapa, B. oleracea and A.thaliana were performed using Clustal X1.8, then MEGA7 was used to analyze the results (Additional �le9) [68]. The phylogenetic tree was constructed based on the Maximum Likelihood (ML) method, with theJTT+G model and 1,000 bootstrap replicates. The phylogenetic tree was visualized using the iTOL onlinetool (https://itol.embl.de/) [69].
Structural-Based Sequence Alignment
ESPript (http://espript.ibcp.fr/ESPript/ESPript/) [70] was used to predict the secondary structures as wellas the presence of structural elements in the XTH protein sequences. The crystal structure of PttXET16(PDB id:1UN1) [53] was obtained from the PDB databank to locate secondary structures.
Analysis of chromosomal locations and gene duplication
The chromosomal locations of XTH genes were derived from BRAD. All XTH genes were mapped tochromosomes by MapChart [71] except for a few that were located on unassigned scaffolds. DuplicatedXTH gene pairs were identi�ed by the BLASTn program with both coverage and identity set to > 80% in
Page 14/29
the two species [72]. Putative tandemly-duplicated genes in A. thaliana, B. rapa, and B. oleracea wereretrieved from PTGBase (http://ocri-genomics.org/PTGBase) [73].
To estimate the modes of selection acting on XTH genes, the Ka/Ks ratios between duplicated XTH genepairs were calculated. Ka/Ks ratios greater than 1, less than 1, and equal to 1 represented positiveselection, negative selection, and neutral selection respectively [74]. For each gene pair, the Ks value wasused to estimate the divergence time (T) as millions of years ago based on a rate of 1.5×10⁻⁸
substitutions per site per year, using the formula T=Ks/(2×1.5×10−8) Mya [75].
Analysis of tissue expression patterns
RNA-seq expression data for B. rapa tissues (GSE43245) and B. oleracea tissues (GSE42891) weredownloaded from the GEO database at NCBI (http://www.ncbi.nlm.nih.gov/geo/) [41,76]. The XTHexpression data were measured using the expressed FPKM values for transcripts assembled andanalyzed in a previous study [77,78]. FPKM values for different tissue were subjected to hierarchicalclustering analysis with TBtools. The data were normalized in order to more intuitively examinedifferences in expression of the same gene in different samples and represented as a heatmap withTBtools; genes with FPKM values of less than one in all samples were not included in the heatmap.
DeclarationsEthical approval: This article does not contain any studies with human participants or animals performedby any of the authors.
Abbreviations
A. thaliana: Arabidopsis thaliana; B. oleracea: Brassica oleracea; B. rapa: Brassica rapa; BLASTp: BasicLocal Alignment Search Tool; FPKM: fragments per kilobase of transcript per million fragmentssequenced; Ka: non-synonymous substitution; Ks: synonymous substitution; MW: molecular weight; MYA:million years ago; NJ: neighbor-joining; XTH: xyloglucan endotransglucosylase/hydrolase; LF: leastfractionated; MF1: medium fractionated; MF2: most fractionated; WGD: whole genome duplication; WGT:whole genome triplication; TD: tandem duplication; HMM: Hidden Markov Model.
Declarations
Acknowledgments
Not applicable.
Funding
This work was supported by funding to Min Song from the Science and Technology project of ShandongEducation Department (Grant no. J15LE02) and the China Postdoctoral Science Foundation funded
Page 15/29
project (Grant no. 2018M632646). The funding body did not participate in the design of the study,collection, analysis and interpretation of data or in writing the manuscript.
Availability of data and materials
All data generated or analyzed during this study are included in this published article and the additional�les.
Authors’ contributions
DW analyzed the in�uence of WGD and TD for XTH gene family, Ka/Ks value and estimated divergencetimed of duplication XTH gene pairs, as well as expression analysis of XTH gene family, prepared themanuscript. AQL identi�ed the members of XTH genes and �nished the phylogenetic analysis of XTHgene family. XYQ analyzed the characteristics of XTHs and sequence alignment of XTHs. JYL analyzedthe motif, domain, gene structure and syntenic genes. MS supervised the project and revised themanuscript. All authors read and approved the �nal manuscript.
Ethics approval and consent to participate
Not applicable.
Consent for publication
Not applicable.
Competing interests
The authors declare that they have no competing interests.
Author details
Qufu Normal University, College of Life Science, Qufu 273165, P.R.China;
References1. Xuan Y, Zhao HF, Guo XY, Ren J, Wang Y, Lu BY. Plant Cell Wall Remodeling Enzyme Xyloglucan
Endotransglucosylase/hydrolase (XTH). Chinese Agricultural Science Bulletin. 2016; 18: 83-8.
2. Thompson JE, Fry SC. Restructuring of wall-bound xyloglucan by transglycosylation in living plantcells. The Plant Journal. 2001; 26: 23-34.
3. Fry SC, Smith RC, Renwick KF, Martin DJ, Hodge SK, Matthews KJ. Xyloglucan endotransglucosylase,a new wall-loosening enzyme activity from plants. Biochem J. 1992; 282: 821–8.
4. Strohmeier M, Hrmova M, Fischer M, Harvey AJ, Fincher GB, Pleiss J. Molecular modeling of familyGH16 glycoside hydrolases: Potential roles for xyloglucan transglucosylases/hydrolases in cell wallmodi�cation in the poaceae. Protein Sci. 2004; 13: 3200–13.
Page 16/29
5. Viborg AH, Terrapon N, Lombard V, Michel G, Czjzek M, Henrissat B, et al. A subfamily roadmap of theevolutionarily diverse glycoside hydrolase family 16 (GH16). Journal of Biological Chemistry. 2019;doi:10.1074/jbcRA119010619.
�. Baumann MJ, Eklof JM, Michel G, Kallas AM, Teeri TT, Czjzek M, et al. 3rd Structural evidence for theevolution of xyloglucanase activity from xyloglucan endo-transglucosylases: Biological implicationsfor cell wall metabolism. Plant Cell. 2007; 19:1947–63.
7. Rose JK, Braam J, Fry SC, Nishitani K. The XTH family of enzymes involved in xyloglucanendotransglucosylation and endohydrolysis: Current perspectives and a new unifying nomenclature.Plant Cell Physiol. 2002; 43: 1421–35.
�. Eklof JM, Brumer H. The XTH gene family: An update on enzyme structure, function, and phylogenyin xyloglucan remodeling. Plant Physiol. 2010; 153: 456–66.
9. Behar H, Graham SW, Brumer H. Comprehensive cross-genome survey and phylogeny of glycosidehydrolase family 16 members reveals the evolutionary origin of EG16 and XTH proteins in plantlineages. Plant J. 2018; 95: 1114–28.
10. Michailidis G, Argiriou A, Darzentas N, Tsaftaris A. Analysis of xyloglucanendotransglucosylase/hydrolase (XTH) genes from allotetraploid (Gossypium hirsutum) cotton andits diploid progenitors expressed during �ber elongation. J Plant Physiol. 2009; 166: 403–16.
11 Ryusuke, Yokoyama, Yohei, Taro, Harada Yuji, Hiwatashi Mitsuyasu, Hasebe. Biological implicationsof the occurrence of 32 members of the XTH (xyloglucan endotransglucosylase/hydrolase) family ofproteins in the bryophyte Physcomitrella patens. Plant J. 2010; 64(4):645-56.
12 Jiao C, Sørensen I, Sun X, Sun H, Behar H, Alseekh S, et al. The Penium margaritaceum Genome:Hallmarks of the Origins of Land Plants. Cell, 2020;181(5):1-15.
13. Yokoyama R, Nishitani KA. Comprehensive expression analysis of all members of a gene familyencoding cell-wall enzymes allowed us to predict cis-regulatory regions involved in cell-wallconstruction in speci�c organs of Arabidopsis. Plant Cell Physiol. 2001; 42: 1025–33.
14. Yokoyama R, Rose JK, Nishitani KA. Surprising diversity and abundance of xyloglucanendotransglucosylase/hydrolases in rice. Classi�cation and expression analysis. Plant Physiol.2004; 134: 1088–1099.
15. Fu MM, Liu C, Wu F. Genome-Wide Identi�cation, Characterization and Expression Analysis ofXyloglucan Endotransglucosylase/Hydrolase Genes Family in Barley (Hordeum vulgare). Molecules.2019; 24: 1935.
1�. Geisler LJ, Geisler M, Coutinho PM, Segerman B, Nishikubo N, Takahashi J, et al Poplarcarbohydrate-active enzymes Gene identi�cation and expression analyses. Plant Physiol. 2006; 140946-62
17. Miedes E, Lorences EP. Xyloglucan endotransglucosylase/hydrolases (XTHs) during tomato fruitgrowth and ripening. J Plant Physiol. 2009; 166: 489–98.
Page 17/29
1�. Song L, Valliyodan B, Prince S, Wan J, Nguyen HT. Characterization of the XTH Gene Family: NewInsight to the Roles in Soybean Flooding Tolerance. Int J Mol Sci. 2018; 19: 2705.
19. Wang M, Xu Z, Ding A, Kong Y. Genome-Wide Identi�cation and Expression Pro�ling Analysis of theXyloglucan Endotransglucosylase/Hydrolase Gene Family in Tobacco (Nicotiana tabacum L). Genes.2018; 9: 273.
20. Li QY, Li HY, Yin CY, Wang XT, Jiang Q, Zhang R, et al. Genome-Wide Identi�cation andCharacterization of Xyloglucan Endotransglucosylase/Hydrolase in Ananas comosus duringDevelopment. Genes. 2019; 10: 537.
21. Hyodo H Yarnakawa S Takeda Y, Tsuduki M, Yokota A, Nishitani K, et al. Active gene expression of axyloglucan endotransglucosylase/hydrolase gene, XTH9, in in�orescence apices is related to cellelongation in Arabidopsis thaliana Plant Mol Biol. 2003; 52: 473-482.
22. Vissenberg K, Van Sandt V, Fry SC, Verbelen JP. Xyloglucan endotransglucosylase action is high inthe root elongation zone and in the trichoblasts of all vascular plants from Selaginella to Zea mays.J Exp Bot. 2003; 54: 335–44.
23. Harada T, Torii Y, Morita S, Onodera R, Hara Y, Yokoyama R, et al. Cloning, characterization, andexpression of xyloglucan endotransglucosylase/hydrolase and expansion genes associated withpetal growth and development during carnation �ower opening. J Exp Bot. 2011; 62: 815–23.
24. Atkinson RG, Johnston SL, Yauk YK, Sharma NN, Schröder R. Analysis of xyloglucanendotransglucosylase/hydrolase (XTH) gene families in kiwifruit and apple. Postharvest BiolTechnol. 2009; 51: 149–57.
25. Opazo MC, Figueroa CR, Henriquez J, Herrera R, Bruno C, Valenzuela PD, Moya-Leon MA.Characterization of two divergent cDNAs encoding xyloglucan endotransglucosylase/hydrolase(XTH) expressed in Fragaria chiloensis fruit. Plant Sci. 2010; 179: 479–88.
2�. Xuan Y, Zhou ZS, Li HB, Yang ZM. Identi�cation of a group of XTHs genes responding to heavy metalmercury, salinity and drought stresses in Medicago truncatula. Ecotoxicol Environ Saf. 2016; 132:153–63.
27. Shin Y Yum H Kim ES Cho H, Gothandam KM, Hyun J, et a1 BcXTH1 a Brassica campestrishomologue of Arabidopsis XTH9 is associated with cell expansion. Planta. 2006; 224: 32–41
2�. Lee J, Bums TH, Light G, Sun Y, FokarM, Kasukabe KF, et al. Xyloglucanendotransglucosylase/hydrolase genes in cotton and their role in �ber elongation Planta. 2010;232:l191–05
29. Cho SK, Kim JE, Park JA, Eom TJ, Kim WT. Constitutive expression of abiotic stress-inducible hotpepper CaXTH3, which encodes a xyloglucan endotransglucosylase /hydrolase homolog, improvesdrought and salt tolerance in transgenic Arabidopsis plants. FEBS Lett. 2006; 580: 3136–44.
30. Choi JY Seo YS Kim SJ Kim WT, Shin JS Constitutive expression of CaXTH3, a hot pepperxyloglucan endotransglucosylase / hydrolase enhanced tolerance to salt and drought stresseswithout phenotypic defects in tomato plants (Solanum lycopersicum cv. Dotaerang) Plant Cell Rep.2011; 30: 867–77.
Page 18/29
31. Han YS, Sa G, Sun J, Shen Z, Zhao R, Ding M, et al. Overexpression of Populus euphratica xyloglucanendo-transglucosylase/hydrolase gene confers enhanced cadmium tolerance by the restriction ofroot cadmium uptake in transgenic tobacco. Environ Exp Bot. 2014; 100: 74–83.
32. Han YS, Wang W, Sun J, Ding MQ, Zhao R, Deng SR, et al. Polus euphratica XTH overexpressionenhances salinity tolerance by the development of leaf succulence in transgenic tobacco plants. JExp Bot. 2013; 64: 4225–38.
33. Chen JR Chen YB Ziemianska M Liu R, Niedźwiecka-Filipiak I, Li YL, et al Co-expression ofMtDREB1C and RcXET enhances stress tolerance of transgenic China rose (Rosa chinensis Jacq). JPlant Growth Regul. 2016; 35: 586–99.
34. Zhu XF, Shi YZ, Lei GJ, Fry SC, Zhang BC, Zhou YH, et al. XTH31, encoding an in vitro XEH/XET-activeenzyme, regulates aluminum sensitivity by modulating in vivo XET action, cell wall xyloglucancontent, and aluminum binding capacity in Arabidopsis. Plant Cell. 2012; 24: 4731–47.
35. Town CD, Cheung F, Maiti R, Crabtree J, Haas BJ, Wortman JR, et al. Comparative genomics ofBrassica oleracea and Arabidopsis thaliana reveal gene loss, fragmentation, and dispersal afterpolyploidy. Plant Cell. 2006; 18:1348–59.
3�. Yang TJ, Kim JS, Kwon SJ, Lim KB, Choi BS, Kim JA, et al. Sequence-level analysis of thediploidization process in the triplicated FLOWERING LOCUS C region of Brassica rapa. Plant Cell.2006; 18: 1339–47.
37. Blanc G, Hokamp K, Wolfe KH. A recent polyploidy superimposed on older large-scale duplications inthe Arabidopsis genome. Genome Res. 2003; 13:137–44.
3�. Lysak MA, Koch MA, Pecinka A, Schubert I. Chromosome triplication found across the tribeBrassiceae. Genome Res. 2005; 15: 516–25.
39. Graham GJ. Tandem genes and clustered genes. J Theor Biol. 1995; 175:71–87.
40. Chalhoub B, Denoeud F, Liu SY, Parkin IAP, Tang HB, Wang XY, et al. Early allopolyploid evolution inthe post-Neolithic Brassica napus oilseed genome. Science. 2014; 345, 950–3.
41. Liu SY, Liu YM, Yang XH, Tong CB, Edwards D, Parkin IAP, Zhao MX, Ma JX, Yu JY, Huang SM, et al.The Brassica oleracea genome reveals the asymmetrical evolution of polyploidy genomes. NatCommun. 2014; 5: 3930.
42. Kaewthai N, Gendre D, EklöF JM, Ibatullin FM, Ezcuura I, Bhalerao RP, et al. Group III-A XTH genes ofArabidopsis encode predominant xyloglucan endohydrolases that are dispensable for normalgrowth. Plant Physiology, 2013; 161(1):440-454.
43. Yokoyama R, Nishitani K. Functional diversity of xyloglucan-related proteins and its implications inthe cell wall dynamics in plants. Plant Biol, 2000;2:598–604.
44. Kallas, A. M. et al. Enzymatic properties of native and deglycosylated hybrid aspen (Populus tremulax tremuloides) xyloglucan endotransglycosylase 16A expressed in Pichia pastoris. BiochemicalJournal,2005: 390, 105–113.
45. Johnasson P, Brumer H, Baumann MJ, Kallas ÅM, Henriksson H, Denman SE, et al. Crystal Structuresof a Poplar Xyloglucan Endotransglycosylase Reveal Details of Transglycosylation Acceptor Binding.
Page 19/29
Plant Cell, 2004; 16(4):874-886.
4�. Henriksson H , Denman S E , Campuzano I D G , Ademark P, Master ER, Teeri TT, et al. N-Linkedglycosylation of native and recombinant cauli�ower xyloglucan endotransglycosylase 16A.Biochemical Journal, 2003; 375(1):61-73.
47. Kozak KH, Mendyk RW, Wiens JJ. Can parallel diversi�cation occur in sympatry? Repeated patternsof body-size evolution in coexisting clades of north American salamanders. Evolution.2009;63(7):1769–84.
4�. Cheng F, Wu J, Fang L, Wang X. Syntenic gene analysis between B. rapa and other Brassicaceaespecies. Front Plant Sci. 2012; 3: 198.
49. Wang X, Wang H, Wang J, Sun R, Wu J, Liu S, et al. B. rapa Genome Sequencing Project Consortium-The genome of the mesopolyploid crop species Brassica rapa. Nat Genet. 2011; 43:1035–9.
50. Nekrutenko A, Makova KD, Li WH. The KA/KS ratio test for assessing the protein-coding potential ofgenomic regions: An empirical and simulation study. Genome Res. 2002, 12, 198–202.
51. Rai KM , Thu SW , Balasubramanian VK , Cobos CJ, Disasa T, Mendu V. Identi�cation,Characterization, and Expression Analysis of Cell Wall Related Genes in Sorghum bicolor (L.)Moench, a Food, Fodder, and Biofuel Crop. Front Plant Sci, 2016, 7(77):1287.
52. Nawaz MA, Rehman HM, Imtiaz M, Baloch FS, Lee JD, Yang SH, et al. Systems Identi�cation andCharacterization of Cell Wall Reassembly and Degradation Related Genes in Glycine max (L.) Merill,a Bioenergy Legume. Sci Rep. 2017; 7: 10862.
53. Wolf Y, Madej T, Babenko V, Shoemaker B, Panchenko AR. 2007. Long-term trends in evolution ofindels in protein sequences. BMC Evolutionary Biology 7:19
54. Van Sandt V, Guisez Y, Verbelen JP, Vissenberg K. Analysis of a xyloglucanendotransglucosylase/hydrolase (XTH) from the lycopodiophyte Selaginella kraussiana suggeststhat XTH sequence characteristics and function are highly conserved during the evolution ofvascular plants. Journal of Experimental Botany. 2006; 57: 2909–22.
55. Liang ZW, Li MD, Liu ZHY, Wang JB. Genome-wide identi�cation and characterization of the Hsp70gene family in allopolyploid rapeseed (Brassica napus L.) compared with its diploid progenitors. PeerJ.2019;7:e7511.
5�. Becnel J, Natarajan M, Kipp A, Braam J. Developmental expression patterns of Arabidopsis XTHgenes reported by transgenes and Genevestigator. Plant Mol Biol. 2006; 61: 451-467
57. Lynch M, Conery JS. The evolutionary fate and consequences of duplicate genes. Science. 2000;290:1151-1155.
5�. Cheng F, Liu SY, Wu J, Fang L, Sun SL, Liu B, et al. BRAD, the genetics and genomics database forBrassica plants. BMC Plant Biol. 2011; 11:136.
59. Lamesch P, Berardini TZ, Li D, Swarbreck D, Wilks C, Sasidharan R, et al. The Arabidopsis InformationResource (TAIR): improved gene annotation and new tools. Nucleic Acids Research. 2012; 40: D1202-10.
Page 20/29
�0. Finn RD, Coggill P, Eberhardt RY, Eddy SR, Mistry J, Mitchell AL, et al. The Pfam protein familiesdatabase: towards a more sustainable future. Nucleic Acids Research. 2016; 44: D279-85.
�1. Chen CJ, Chen H, Zhang Y, Thomas HR, Frank MH, He YH, et al. TBtools - an integrative toolkitdeveloped for interactive analyses of big biological data. Molecular plant. 2020; doi:10.1016/jmolp202006009.
�2. Marchler-Bauer A, Bo Y, Han L, He J, Lanczycki CJ, Lu S, et al. CDD/SPARCLE: functionalclassi�cation of proteins via subfamily domain architectures. Nucleic Acids Res. 2017; 45: D200–3.
�3. Østergaard L, King GJ. Standardized gene nomenclature for the Brassica genus. Plant Methods.2008; 4:10.
�4. Wilkins MR, Gasteiger E, Bairoch A, Sanchez JC, Williams KL, Appel RD, et al. Protein identi�cationand analysis tools in the ExPASy server. Methods in Molecular Biology. 1999; 112:531-52.
�5. Chou KC, Shen HB. Cell-PLoc 2.0: An improved package of web-servers for predicting subcellularlocalization of proteins in various organisms. Nat Sci. 2010; 2: 1090–103.
��. Armenteros JJA, Tsirigos KD, Sonderby CK, Petersen TN, Winther O, Brunak S, et al. SignalP 5.0improves signal peptide predictions using deep neural networks. Nat Biotechnol. 2019; 37: 420.
�7. Bailey TL, Johnson J, Grant CE, Noble WS. The MEME suite. Nucleic Acids Res. 2015; 43: W39–49.
��. Kumar S, Stecher G, Tamura K. MEGA7: Molecular Evolutionary Genetics Analysis Version 7.0 forBigger Datasets. Mol Biol Evol. 2016; 33: 1870–4.
�9. Letunic I, Bork P. Interactive tree of life (iTOL) v3: an online tool for the display and annotation ofphylogenetic and other trees. Nucleic Acids Research. 2016; 44: W242-5.
70. Robert X, Gouet P. Deciphering key features in protein structures with the new ENDscript server.Nucleic Acids Res, 2014; 42(W1):W320–W324.
71. Voorrips RE. Mapchart: software for the graphical presentation of linkage maps and QTLs. J Hered.2002; 93: 77-8.
72. Kong X, Lv W, Jiang S, Zhang D, Cai G, Pan J, et al. Genome-wide identi�cation and expressionanalysis of calcium-dependent protein kinase in maize. BMC Genomics. 2013;14:433.
73. Yu J, Ke T, Tehrim S, Sun F, Liao B, Hua W. PTGBase: an integrated database to study tandemduplicated genes in plants. Database (Oxford). 2015; bav017.
74. Doerks T, Copley RR, Schultz J, Ponting CP, Bork P. Systematic identification of novel protein domainfamilies associated with nuclear functions. Genome Res. 2002; 12: 47-56.
75. Koch MA, Haubold B, Mitchell-Olds T. Comparative evolutionary analysis of chalcone synthase andalcohol dehydrogenase loci in Arabidopsis, Arabis, and related genera (Brassicaceae). Mol Biol Evol.2000;17:1483-98.
7�. Yu J, Tehrim S, Zhang F, Tong C, Huang J, Cheng X, et al. Genome-wide comparative analysis of NBS-encoding genes between Brassica species and Arabidopsis thaliana. BMC Genomics. 2014;15(1):3.
77. Tong C, Wang X, Yu J, Wu J, Li W, Huang J, et al. Comprehensive analysis of RNA-seq data revealsthe complexity of the transcriptome in Brassica rapa. BMC Genomics. 2013; 14: 689.
Page 21/29
7�. Yao QY, Xia EH, Liu FH, Gao LZ. Genome-wide identi�cation and comparative expression analysisreveal a rapid expansion and functional divergence of duplicated genes in the WRKY gene family ofcabbage, Brassica oleracea var capitata. Gene. 2015; 35: 557.
TablesTable 1
Page 22/29
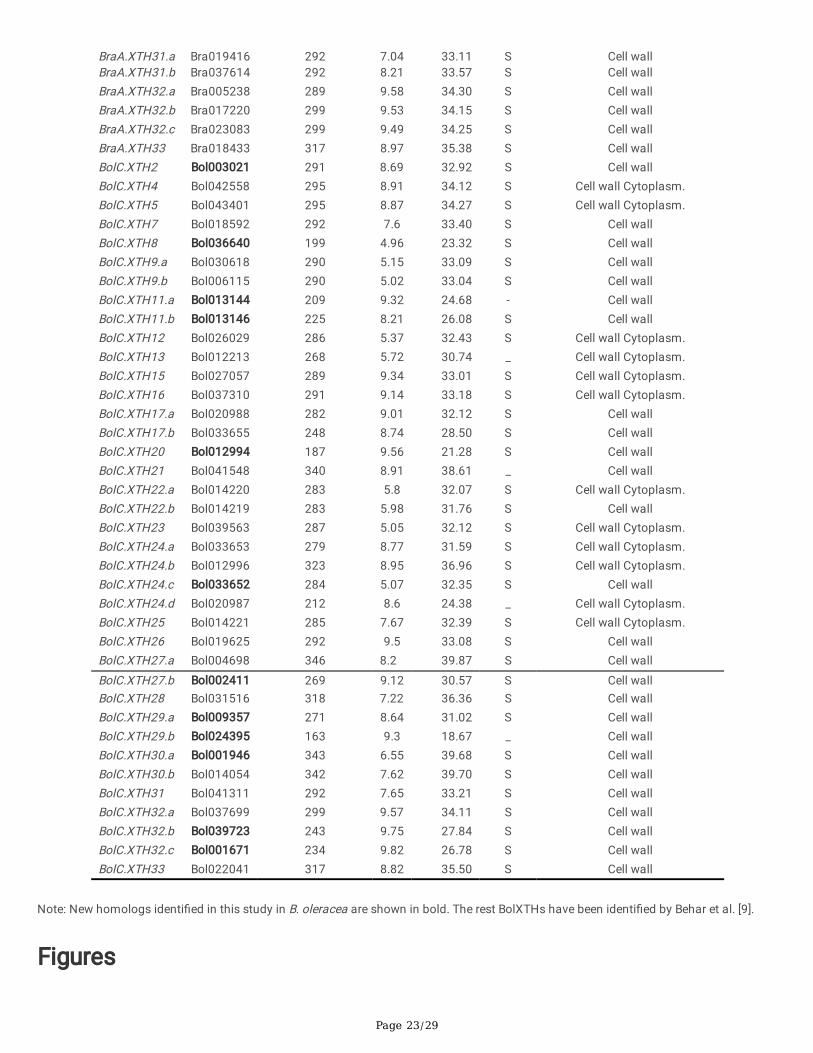
Symbol BRAD ID Peptide length(aa) PI MW (kDa) SignalP Subcellular localization
BraA.XTH2.a Bra001434 288 9.1 32.68 S Cell wallBraA.XTH2.b Bra001433 284 8.5 31.94 S Cell wallBraA.XTH3 Bra015093 473 8.72 55.10 S Cell wall Endoplasmic reticulumBraA.XTH4 Bra013164 295 8.91 34.06 S Cell wall Cytoplasm.BraA.XTH5.a Bra006220 293 9.21 34.09 S Cell wall Cytoplasm.BraA.XTH5.b Bra008796 279 8.86 32.48 _ Cell wall Cytoplasm.BraA.XTH6 Bra024415 285 6.06 32.75 S Cell wallBraA.XTH7 Bra017855 292 7.59 33.41 S Cell wallBraA.XTH8 Bra019846 299 5.43 35.03 S Cell wallBraA.XTH9.a Bra000840 290 5.15 33.12 S Cell wallBraA.XTH9.b Bra034193 344 5.06 38.88 _ Cell wallBraA.XTH10 Bra040716 297 8.21 34.49 S Cell wallBraA.XTH11.a Bra019552 301 8.66 35.11 S Cell wallBraA.XTH11.b Bra029907 278 8.7 32.59 S Cell wallBraA.XTH12.a Bra002723 286 5.4 32.42 S Cell wall Cytoplasm.BraA.XTH12.b Bra020436 283 5.11 32.24 S Cell wall Cytoplasm.BraA.XTH12.c Bra006814 319 5.43 36.29 S Cell wall Cytoplasm.BraA.XTH14.a Bra019141 286 6.95 32.69 S Cell wall Cytoplasm.BraA.XTH14.b Bra013923 284 5.96 32.20 S Cell wall Cytoplasm.BraA.XTH15 Bra038442 289 9.41 33.03 S Cell wall Cytoplasm.BraA.XTH16 Bra014975 291 9.14 33.20 S Cell wall Cytoplasm.BraA.XTH17.a Bra011181 282 8.56 32.01 S Cell wallBraA.XTH17.b Bra011180 282 9 32.10 S Cell wallBraA.XTH17.c Bra010290 280 9.3 32.03 S Cell wallBraA.XTH17.d Bra024087 284 8.84 32.36 S Cell wallBraA.XTH17.e Bra010291 282 9.1 32.23 S Cell wallBraA.XTH18 Bra024088 282 9.09 32.25 S Cell wallBraA.XTH21 Bra038819 239 9.12 27.27 _ Cell wallBraA.XTH22.a Bra002719 283 5.96 31.98 S Cell wall Cytoplasm.BraA.XTH22.b Bra020433 260 5.49 29.61 S Cell wallBraA.XTH22.c Bra002718 214 6.72 24.39 _ Cell wall Cytoplasm.BraA.XTH22.d Bra002720 214 6.72 24.39 _ Cell wall Cytoplasm.BraA.XTH22.e Bra020432 283 6.33 31.79 S Cell wallBraA.XTH23.a Bra008806 287 5.29 32.11 S Cell wall Cytoplasm.BraA.XTH23.b Bra013922 287 5.29 32.11 S Cell wall Cytoplasm.BraA.XTH24.a Bra011179 282 8.76 31.84 S Cell wall Cytoplasm.BraA.XTH24.b Bra024089 279 8.93 31.59 S Cell wall Cytoplasm.BraA.XTH24.c Bra010292 212 8.76 24.37 _ Cell wall Cytoplasm.
BraA.XTH25.a Bra002722 284 9.06 32.58 S Cell wall Cytoplasm.BraA.XTH25.b Bra020434 285 7.66 32.49 S Cell wall Cytoplasm.BraA.XTH26 Bra011066 292 9.51 33.07 S Cell wallBraA.XTH27.a Bra026630 333 7.67 38.29 S Cell wallBraA.XTH27.b Bra024848 323 7.73 36.95 _ Cell wallBraA.XTH28 Bra026809 328 7.24 37.79 S Cell wallBraA.XTH29.a Bra012559 347 9.1 40.07 S Cell wallBraA.XTH29.b Bra013367 351 8.68 40.49 S Cell wallBraA.XTH30 Bra035513 342 8.14 39.74 S Cell wall
Page 23/29
BraA.XTH31.a Bra019416 292 7.04 33.11 S Cell wallBraA.XTH31.b Bra037614 292 8.21 33.57 S Cell wallBraA.XTH32.a Bra005238 289 9.58 34.30 S Cell wallBraA.XTH32.b Bra017220 299 9.53 34.15 S Cell wallBraA.XTH32.c Bra023083 299 9.49 34.25 S Cell wallBraA.XTH33 Bra018433 317 8.97 35.38 S Cell wallBolC.XTH2 Bol003021 291 8.69 32.92 S Cell wallBolC.XTH4 Bol042558 295 8.91 34.12 S Cell wall Cytoplasm.BolC.XTH5 Bol043401 295 8.87 34.27 S Cell wall Cytoplasm.BolC.XTH7 Bol018592 292 7.6 33.40 S Cell wallBolC.XTH8 Bol036640 199 4.96 23.32 S Cell wallBolC.XTH9.a Bol030618 290 5.15 33.09 S Cell wallBolC.XTH9.b Bol006115 290 5.02 33.04 S Cell wallBolC.XTH11.a Bol013144 209 9.32 24.68 - Cell wallBolC.XTH11.b Bol013146 225 8.21 26.08 S Cell wallBolC.XTH12 Bol026029 286 5.37 32.43 S Cell wall Cytoplasm.BolC.XTH13 Bol012213 268 5.72 30.74 _ Cell wall Cytoplasm.BolC.XTH15 Bol027057 289 9.34 33.01 S Cell wall Cytoplasm.BolC.XTH16 Bol037310 291 9.14 33.18 S Cell wall Cytoplasm.BolC.XTH17.a Bol020988 282 9.01 32.12 S Cell wallBolC.XTH17.b Bol033655 248 8.74 28.50 S Cell wallBolC.XTH20 Bol012994 187 9.56 21.28 S Cell wallBolC.XTH21 Bol041548 340 8.91 38.61 _ Cell wallBolC.XTH22.a Bol014220 283 5.8 32.07 S Cell wall Cytoplasm.BolC.XTH22.b Bol014219 283 5.98 31.76 S Cell wallBolC.XTH23 Bol039563 287 5.05 32.12 S Cell wall Cytoplasm.BolC.XTH24.a Bol033653 279 8.77 31.59 S Cell wall Cytoplasm.BolC.XTH24.b Bol012996 323 8.95 36.96 S Cell wall Cytoplasm.BolC.XTH24.c Bol033652 284 5.07 32.35 S Cell wallBolC.XTH24.d Bol020987 212 8.6 24.38 _ Cell wall Cytoplasm.BolC.XTH25 Bol014221 285 7.67 32.39 S Cell wall Cytoplasm.BolC.XTH26 Bol019625 292 9.5 33.08 S Cell wallBolC.XTH27.a Bol004698 346 8.2 39.87 S Cell wall
BolC.XTH27.b Bol002411 269 9.12 30.57 S Cell wallBolC.XTH28 Bol031516 318 7.22 36.36 S Cell wallBolC.XTH29.a Bol009357 271 8.64 31.02 S Cell wallBolC.XTH29.b Bol024395 163 9.3 18.67 _ Cell wallBolC.XTH30.a Bol001946 343 6.55 39.68 S Cell wallBolC.XTH30.b Bol014054 342 7.62 39.70 S Cell wallBolC.XTH31 Bol041311 292 7.65 33.21 S Cell wallBolC.XTH32.a Bol037699 299 9.57 34.11 S Cell wallBolC.XTH32.b Bol039723 243 9.75 27.84 S Cell wallBolC.XTH32.c Bol001671 234 9.82 26.78 S Cell wallBolC.XTH33 Bol022041 317 8.82 35.50 S Cell wall
Note: New homologs identi�ed in this study in B. oleracea are shown in bold. The rest BolXTHs have been identi�ed by Behar et al. [9].
Figures
Page 24/29
Figure 1
Phylogenetic analysis of full-length XTH proteins in B. rapa, B. oleracea and Arabidopsis. The tree wasconstructed by the Maximum Likelihood (ML) method using MEGA7, with the JTT+G model and 1,000bootstrap replicates. The branches correspond to the three phylogenetic groups.
Page 25/29
Figure 2
Characterizations of XTH gene family members in B. rapa, including phylogenetic tree (A), conservedmotif location (B), domain location (C) and intron/exon structure (D).
Page 26/29
Figure 3
Characterizations of XTH gene family members in B. olerace, including phylogenetic tree (A), conservedmotif location (B), domain location (C) and intron/exon structure (D).
Page 27/29
Figure 4
Distribution of XTH genes on B. rapa, B. oleracea and A. thaliana chromosomes. XTH genes in red boxesare tandemly repeated genes. The number of chromosomes was indicated at the top of eachchromosome. Ar, Co and At in front of number represent chromosome in B. rapa, B. oleracea and A.thaliana, respectively. The scale on the left is in megabases (Mb).
Page 28/29
Figure 5
Heatmaps of expression clustering for XTH genes across different tissues in B. rapa (A) and B. oleracea(B) based on FPKM values retrieved from the GEO database (http://www.ncbi.nlm.nih.gov/geo/). Twosamples of root and leaf tissues were generated from different batches of plants for Fig. 5A. Color scalebars representing relative signal ratios are shown at the top of the right-hand side of each heatmap.Heatmaps were drawn with TBtools. The relative level of expression of a particular gene in each row wasnormalized against the mean value. Euclidean distance was used to evaluate closeness between genes,and the average linkage method was used for cluster analysis.
Supplementary Files
This is a list of supplementary �les associated with this preprint. Click to download.
TableS2.xlsx
TableS1.xlsx

Page 29/29
FigureS1.jpg
AdditionalFiles.zip