improving the effectiveness of rural development policy in
TRANSCRIPT

Improving the Effectiveness of Rural Development Policy in Chile
Improving the Effectiveness of Rural Developm
ent Policy in ChileLuis M
iguel Carter Leal 2016
Luis Miguel Carter Leal

Improving the Effectiveness of Rural Development Policy in Chile
Luis Miguel Carter Leal

Thesis committee
Promotor
Prof. Dr A.G.J.M. (Alfons) Oude Lansink
Professor of Business Economics
Wageningen University
Co-promotor
Dr H.W. (Helmut) Saatkamp
Associate professor, Business Economics Group
Wageningen University
Other members
Prof. Dr W.J.M. (Wim) Heijman, Wageningen University
Dr N.B.M. (Nico) Heerink, Wageningen University
Dr A.E. (Álvaro) Reyes Duarte, Santo Tomás University, Santiago, Chile
Dr R.A. (Roel) Jongeneel, Wageningen University
This research was conducted under the auspices of Wageningen School of Social
Sciences (WASS)

Improving the Effectiveness of Rural Development Policy in Chile
Luis Miguel Carter Leal
Thesis
submitted in fulfilment of the requirements for the degree of doctor
at Wageningen University
by the authority of the Rector Magnificus
Prof. Dr A.P.J. Mol,
in the presence of the
Thesis Committee appointed by the Academic Board
to be defended in public
on Friday 8 July 2016
at 11 a.m. in the Aula.

Luis Miguel Carter Leal
Improving the Effectiveness of Rural Development Policy in Chile
172 pages
PhD thesis, Wageningen University, Wageningen, NL (2016)
With references, with summary in English
ISBN 978-94-6257-817-3
DOI: 10.18174/381448

Abstract
In Chile, agriculture remains a key economic factor for rural development. Accordingly,
the Chilean government, through the Agricultural Development Institute (INDAP), provides
financial support for fostering entrepreneurship among small farmers to enable them to
become more competitive in global markets. Despite this support, a declining number of
farmers and an aging population are observed in rural areas. Most rural development
programs focus on increasing competitiveness, whereas the stay-exit decision in agriculture
is also affected by the characteristics and preferences of farmers and their families, and rural
development policy. The overall objective of this dissertation was to provide technical and
socioeconomic information for improving the effectiveness of rural development programs,
which are seen as the tool for stopping rural migration. To accomplish this objective, first an
analysis of the role of socioeconomic variables in the stay-exit decision in farming was made
based on efficiency theory, exit barrier theory, and life-cycle theory. The association of
potential factors with the stay-exit decision was identified using a probit model. This
dissertation suggests that, besides the technical characteristics of the farming, which have
been traditionally addressed in developing countries, rural development policies should
focus on (i) farmer characteristics, i.e. age, gender, and expectations; (ii) farming system, i.e.
multivariate production; and (iii) social aspect of rural society, i.e. membership of farmer
associations. In addition, technical, economic, and social data was used to explore the scope
for improving the technical efficiency of the sample farms and to identify the variables
influencing technical efficiency. Two-stage models were performed to estimate (i) the
technical efficiency and (ii) the input-specific technical inefficiency with which these farmers
operate, and to identify the association of potential factors with either farm-level technical
efficiency or input-specific technical inefficiency. Results for farm-level technical efficiency
showed that farmers could reduce their input use by 30%. When measuring input-specific
technical inefficiency results showed that the input use can be reduced by 26% (land use) to
37% (livestock use). This thesis also analyzed the effectiveness of existing rural development
programs in Chile by comparing the opinions of experts regarding the effectiveness of these
programs in achieving the main INDAP goals and the budget allocation among rural
development programs. Results showed (i) a discrepancy between the allocation of the
INDAP budget and the effectiveness of the rural development programs in achieving the
overall INDAP goal; and (ii) that some INDAP programs are less effective in achieving INDAP
goals. This suggested possibilities for reducing the current number of professional and
technical advice programs and reallocating budget from less effective programs to programs
that are more effective in the achievement of INDAP goals. Hence, designing new programs
that focus on improving the quality of social and organizational capital could increase the
achievement of INDAP goals.


Contents
Chapter 1 GENERAL INTRODUCTION 9
Chapter 2 FACTORS INFLUENCING THE STAY-EXIT DECISION OF SMALL
LIVESTOCK FARMERS: EMPIRICAL EVIDENCE FROM
SOUTHERN CHILE
21
Chapter 3 FACTORS AFFECTING FARM TECHNICAL EFFICIENCY OF
SMALL LIVESTOCK FARMERS IN SOUTHERN CHILE
51
Chapter 4 IMPROVING COMPETITIVENESS OF SMALL LIVESTOCK
FARMERS: AN EMPIRICAL INPUT-SPECIFIC INEFFICIENCY
ANALYSIS IN SOUTHERN CHILE
77
Chapter 5 EVALUATION OF RURAL DEVELOPMENT PROGRAMS IN CHILE 105
Chapter 6 GENERAL DISCUSSION 133
SUMMARY 161
ACKNOWLEDGEMENTS 165
CURRICULUM VITAE 169
TRAINING AND SUPERVISION PLAN 171


Chapter 1
GENERAL INTRODUCTION

Chapter 1 GENERAL INTRODUCTION
10

11
1.1 Background
Chile entered the global market in the 1970’s, (David et al. 2000; Fleming and Abler
2013), which resulted in a modernization process, greater economic prosperity, and lower
poverty (OECD 2014). The increasing participation in the world market is illustrated by a
doubling of international trade agreements in the past decade, an increase in international
trade (DIRECON 2014), and a more than doubling of per capita income over the past two
decades (OECD 2014). Chile now has the highest per capita income in Latin America (OECD
2014).
In 2006, the Chilean government developed an ambitious agricultural policy to become
one of the world’s top 10 agricultural exporter countries by 2015 (Echeverria et al. 2009;
Campos and Polit 2011). The economic benefits of participating in the global market have
been accompanied by numerous challenges, such as increasing the competitiveness of
traditional agricultural areas, the participation in international trade and adoption of
agricultural innovations (David et al. 2000; Echeverria et al. 2009; Moreira and Bravo-Ureta
2010). Not all farmers are able to meet these challenges, so they exit agriculture.
During the past 40 years, the rural population in Chile has decreased by more than 20%
(WorldBank 2015). The agricultural sector in Chile is characterized by an increasing number
of large, high-tech farms, declining farm employment, loss of family farms, and migration of
farm and non-farm residents (David et al. 2000; Chang et al. 2011; Raggi et al. 2013).
Younger and higher-educated people have mostly migrated from agriculture (Fawaz and
Vallejos 2011) because their higher education offers them more non-rural employment
opportunities (Ramírez et al. 2001). These developments have led to a declining number of
farmers and an aging rural population (Apey and López 2011). Similar changes are observed
in rural populations worldwide (Chang et al. 2011; Raggi et al. 2013).
From an economic perspective, the exit of smaller and less productive farms can make
the agricultural sector more competitive in world markets and foster a reallocation of
resources between agriculture and other sectors (Breustedt and Glauben 2007). However
the exit of smaller, less productive farms also affects income inequality in agriculture, the
productivity and efficiency of farming, and the welfare of rural communities.
To mitigate these negative consequences and to sustain or rejuvenate the rural
population, researchers and policy makers have developed strategies for farmers to increase
production efficiency, such as commodity subsidies, price controls, diverse forms of market
protection, government-funded research and development, and education (OECD 2006;
Chang et al. 2011; INDAP 2014).
In Chile, the Agricultural Development Institute (INDAP) is the public organization
mandated to assist farmers to reduce the economic gap between rural and urban areas and
to make farmers competitive in global markets. INDAP was established in 1962. INDAP
Chapter 1 GENERAL INTRODUCTION
12
supports farmers by providing funds to build and strengthen human, financial, and
productive capital to contribute to rural development and sustainability, and the
competitiveness of national agriculture (MINAGRI 1990; INDAP 2013a).
The support provided by INDAP focuses only on small farms, unlike the support given
by most OECD member countries. Small farms account for 90% of all farms in Chile (INDAP
2014). These small farms are sub-commercial and domestic-oriented livestock farms that
produce a relatively small share of agricultural output; the farms are mainly located in the
southern part of the country. The remaining 10% of farms are large-scale and internationally
competitive vegetable farms, which are mainly located in central Chile (Vera 2006; INE 2007;
Echeverria and Gopinath 2010; OECD 2014).
1.2 Problem statement
The economy of the rural sector in Chile has been shifting from an agriculture-based
economy to a service-oriented economy, a shift also seen in other OECD member states. As a
consequence, the share of the agricultural sector in employment and gross domestic product
(GDP) has declined by 50% during the past 20 years. Nevertheless, agriculture remains
important for the economy of the rural sector, and still accounts for 10.6% of total
employment and 3.4% of total GDP (OECD 2014). The economy of the rural sector grew by
5.6% per year during the last decade (OECD 2014).
INDAP has increased its budget for rural development programs by 77% (INDAP 2015)
during the last decade, in an attempt to make small farmers more competitive and stop the
continuing decrease in rural population. During the same period, a population decline of up
to 40% has been observed in some areas (Oyarzún and Miranda 2011). The continuing
decline in the rural population despite the increased investment in rural development
programs gives the impression that current rural development policy is ineffective in
reducing rural migration. This suggests that the factors underlying the stay-exit decision and
the economic development in rural areas are not yet fully understood or that constraints
prevent using this knowledge to improve rural development policies.
An understanding of the stay-exit mechanism is essential for designing well-targeted
and effective development programs that enhance the future structure of farming, land
management, and population and employment dynamics in rural areas (Raggi et al. 2013).
Understanding this mechanism requires knowledge of the expected utility offered by farming
versus the expected utility offered by non-farm alternatives (Boehlje 1992; Pushkarskaya and
Vedenov 2009). It also requires knowledge of the complementary factors that explain why a
farmer continues farming, even when the income from agricultural activities is very low (Gale
1994; Chang et al. 2011). Knowledge on these issues is essential to identify factors driving

13
the stay-exit decision and to develop recommendations for using this knowledge to improve
the effectiveness of rural development programs in achieving INDAP goals.
1.3 Objective
The overall objective of this dissertation was to provide information that is useful for
improving the effectiveness of rural development programs, which are seen as the tool for
stopping rural migration.
To achieve the overall objective, four sub-objectives were defined:
1. to identify the main factors driving the stay-exit decision of small livestock farmers;
2. to estimate the technical efficiency (TE) with which these farmers operate and
determine the effect of a set of external variables on TE;
3. to estimate the input-specific technical inefficiency with which these farmers
operate and to determine the effect of a set of external variables on the input-
specific technical inefficiency;
4. to evaluate the effectiveness of agricultural rural development programs in Chile.
1.4 Description of the study area
This study was conducted in three administrative regions in southern Chile: La
Araucanía, Los Ríos, and Los Lagos, which are located between parallels 37°S to 44°S and
from meridian 70°O to the Pacific Ocean (Figure 1.1).

Chapter 1 GENERAL INTRODUCTION
14
Figure 1.1. Geographic location of the study area.
The study area covers a quarter of the total land used for livestock and forestry in Chile
and accounts for half of all livestock and forestry farms in the country. Sixty percent of
bovine producers are situated in this area, who manage 63% of all beef cattle and 91% of all
dairy cows in Chile (INE 2007, 2012, 2014). Eighty percent of the farms are managed by
farmers older than 45 years, and 70% of farmers have no more than eight years of formal
education, i.e. preparatory school (Apey and López 2011).
Almost half of all the INDAP users are located in this area (INDAP 2013b), which makes
INDAP support essential for its rural development. Within this area, around 65% of the
farmers participate in INDAP programs, which is 11% higher than the average national
participation. Specifically, INDAP provides support to 77%, 45%, and 67% of the farmers
located in La Araucanía, Los Ríos, and Los Lagos, respectively. Most of the INDAP support
programs in the study area focus on livestock production (INDAP 2015).
Farm sizes in the study area range from 10 to 200 hectares of land, with 0.62 to 1.16
animal unit per hectare. Feeding is either solely from pastures, or in combination with
supplementary concentrates (Vera 2006). The coexistence of small farms, focused on timber

15
logging, livestock breeding, and small-scale cultivation of cereals and potatoes, with larger
and more entrepreneurial farms is common in this area (Barrett et al. 2002; Vera 2006).
1.5 Outline of the dissertation
This dissertation consists of a general introduction (Chapter 1), four research chapters
(Chapter 2-5), and a general discussion (Chapter 6). The structure of the dissertation is
presented in Figure 1.2.
Figure 1.2. Structure of this dissertation.
Chapter 2 presents the theories involved in the stay-exit decision problem: efficiency
theory, exit barrier theory, and life-cycle theory. A conceptual framework is developed from
these three theories that identifies the factors driving the stay-exit decision. This conceptual
framework is used to develop a questionnaire to collect information about factors that might
influence the stay-exit decision of farmers. The questionnaire is applied to a sample of small
livestock farmers in southern Chile. Information provided by this questionnaire is also used in
Research Chapters
Identifying main factors driving the stay-exit decision
Chapter 2 Estimating technical efficiency and the effects of external variables
Chapter 3
Estimating input-specific technical inefficiency and the effects
of external variables
Chapter 4
General discussion
Chapter 6
Evaluating rural development programs
Chapter 5
General Introduction
Chapter 1

Chapter 1 GENERAL INTRODUCTION
16
Chapters 3 and 4. In Chapter 2, the influence of potential factors on the stay-exit decision is
analyzed using a probit model.
Chapter 3 explores the scope for improving the TE of farms in the sample and identifies
the variables influencing TE. In the first stage of the analysis, data envelopment analysis is
used to estimate the TE with which these farmers operate. This stage uses technical and
economic information from the questionnaire developed in Chapter 2. In the second stage of
the analysis, the effect of a set of potential factors on farm TE is estimated using a truncated
regression, which also includes the outputs of Chapter 2.
Chapter 4 explores in more detail the possibilities to improve the TE of these farms,
with particular emphasis on the effect of external variables on specific inputs. In the first
stage of the analysis, a nonparametric directional input distance function is used to estimate
the input-specific technical inefficiency with which these farmers operate. This is followed by
a truncated bootstrap regression, in the second stage of the analysis, to identify the effect of
a set of potential factors on input-specific technical inefficiency.
Chapter 5 analyzes the effectiveness of existing rural development programs supporting
small farmers in Chile. This chapter presents a comparison of the budget allocation among
rural development programs with the opinion of experts about the effectiveness of these
programs in achieving the main INDAP goals. The opinions of experts were collected using an
online survey and analyzed using multi criteria analysis. Chapter 5 also presents
recommendations from experts to improve the effectiveness of rural development programs
for small Chilean livestock farmers. These recommendations were developed using the
results from Chapters 2 to 4 as a basis.
Finally, Chapter 6 discusses the overall results in a broader context and elaborates
implications for policy makers. It reflects on the approaches and methods used in this
dissertation, outlines directions for future research, and ends with the main conclusions of
this dissertation.
17
References
Apey, A, López, I, 2011. Agricultura chilena, información social y productiva según tamaño
del productor y localización geográfica, VII Censo Nacional Agropecuario y Forestal,
2007. Oficina de Estudios y Políticas Agrarias – ODEPA, Ministerio de Agricultura,
Gobierno de Chile, Santiago, Chile.
Barrett, G, Caniggia, M, Read, L (2002) “There are More Vets than Doctors in Chiloé”: Social
and Community Impact of the Globalization of Aquaculture in Chile. World
Development 30, 1951-1965.
Boehlje, M (1992) Alternative models of structural change in agriculture and related
industries. Agribusiness 8, 219-231.
Breustedt, G, Glauben, T (2007) Driving Forces behind exiting from farming in western
Europe. Journal of Agricultural Economics 58, 115-127.
Campos, J, Polit, E, 2011. Nuevos enfoques para Chile Potencia Alimentaria y Forestal. Oficina
de Estudios y Políticas Agrarias – ODEPA, Ministerio de Agricultura, Gobierno de Chile,
Santiago, Chile.
Chang, K, Langelett, G, Waugh, A (2011) Health, Health Insurance, and Decision to Exit from
Farming. Journal of Family and Economic Issues 32, 356-372.
David, M, Dirven, M, Vogelgesang, F (2000) The Impact of the New Economic Model on Latin
America’s Agriculture. World Development 28, 1673-1688.
DIRECON (2014) 'Acuerdos Comerciales.' Available at http://www.direcon.gob.cl/acuerdos-
comerciales/#tabs-1
Echeverria, R, Gopinath, M (2010) The Export-Production Decision of Chilean Farmers:
Implications for Chile’s Agricultural and Export Policies. International Agricultural Trade
Research Consortium Policy Briefs
Echeverria, R, Gopinath, M, Moreira, V, Cortés, P (2009) The Export-Production Decision of
Chilean Farmers: The Case of Blueberry Producers. In 'International Association of
Agricultural Economists Beijing, China', August 16-22. Available at
http://purl.umn.edu/51025
Fawaz, J, Vallejos, R (2011) Calidad de vida, ocupación, participación y roles de género: un
sistema de indicadores sociales de sostenibilidad rural (Chile). Cuadernos de Desarrollo
Rural 8, 45-68.
Fleming, D, Abler, D (2013) Does agricultural trade affect productivity? Evidence from
Chilean farms. Food Policy 41, 11-17.
Gale, H (1994) Longitudinal Analysis of Farm Size over the Farmer's Life Cycle. Review of
Agricultural Economics 16, 113-123.
INDAP (2013a) '50 años de INDAP.' Available at http://www.indap.gob.cl/historia-de-
exito/50-anos-de-indap

Chapter 1 GENERAL INTRODUCTION
18
INDAP (2013b) 'Comprometidos con el Mundo Rural, Programas de fomento 2010-2014.'
(Instituto de Desarrollo Agropecuario – INDAP, Ministerio de Agricultura, Gobierno de
Chile: Santiago, Chile)
INDAP (2014) 'Lineamientos Estratégicos 2014 - 2018 Por un Chile rural inclusivo.' (Instituto
de Desarrollo Agropecuario: Santiago, Chile)
INDAP, 2015. INDAP en cifras. Instituto de Desarrollo Agropecuario – INDAP, Ministerio de
Agricultura, Gobierno de Chile, Santiago, Chile.
INE, 2007. VII Censo Nacional Agropecuario y Forestal. Instituto Nacional de Estadística – INE,
Gobierno de Chile, Santiago, Chile.
INE, 2012. Encuesta de Ganado Bovino 2011. Departamento de Estadísticas Agropecuarias y
Medioambientales, Instituto Nacional de Estadísticas – INE, Gobierno de Chile,
Santiago, Chile.
INE, 2014. Producción Pecuaria, informe anual 2008-2013. Subdirección de Operaciones,
Subdepartamento de Estadísticas Agropecuarias, Departamento de Comunicaciones e
Imagen Corporativa, Instituto Nacional de Estadística – INE, Gobierno de Chile Santiago,
Chile.
MINAGRI, 1990. Ley Orgánica del Instituto de Desarrollo Agropecuario, Ministerio de
Agricultura – MINAGRI. Santiago, Chile.
Moreira, V, Bravo-Ureta, B (2010) Technical efficiency and metatechnology ratios for dairy
farms in three southern cone countries: a stochastic meta-frontier model. Journal of
Productivity Analysis 33, 33-45.
OECD (2006) 'The New Rural Paradigm: Policies and Governance.' (OECD Publishing: Paris,
France)
OECD (2014) 'OECD Rural Policy Reviews: Chile 2014.' (OECD Publishing: Paris, France)
Oyarzún, E, Miranda, B (2011) La economía rural en Chile: entre la pobreza y el desarrollo.
Estudios de Economía Aplicada 29, 31-56.
Pushkarskaya, H, Vedenov, D (2009) Farming exit decisions by age group: Analysis of tobacco
buyout impact in Kentucky. Journal of Agricultural and Applied Economics 41, 653-662.
Raggi, M, Sardonini, L, Viaggi, D (2013) The effects of the Common Agricultural Policy on exit
strategies and land re-allocation. Land Use Policy 31, 114-125.
Ramírez, E, Berdegué, J, Caro, J, Frigolett, D (2001) Estrategias de generación de ingresos de
hogares rurales en zonas de concentración de pobreza entre 1996 y 2000. In
'Estrategias para la superación de la pobreza rural: Visión desde distintas experiencias,
CEPAL. Naciones Unidas', July. Available at http://www.rimisp.org/wp-
content/uploads/2013/11/0127-000887-estrategiassecanopanel.pdf
Vera, R (2006) Country Pasture/Forage Resource Profiles CHILE, Country Pasture Profiles,
Food and Agriculture Organization of the United Nations – FAO. Food and Agriculture

19
Organization of the United Nations – FAO, Rome, Italy. Available at
http://www.fao.org/ag/agp/AGPC/doc/Counprof/PDF%20files/Chile-English.pdf
http://www.fao.org/ag/agp/AGPC/doc/Counprof/Chile/cile.htm#10.
WorldBank (2015) 'Indicadores de desarrollo mundial - Población rural.' Available at
http://databank.bancomundial.org/data/views/reports/tableview.aspx#

Chapter 2
FACTORS INFLUENCING THE STAY-EXIT DECISION OF SMALL
LIVESTOCK FARMERS: EMPIRICAL EVIDENCE FROM SOUTHERN
CHILE
L. M. Carter Leal, A.G.J.M. Oude Lansink, H.W. Saatkamp
Submitted to a peer reviewed international journal

Chapter 2 FACTORS INFLUENCING THE STAY-EXIT DECISION
22
Abstract
This study analyses the factors driving the stay-exit decision of small livestock farmers
located in southern Chile. Technical, economic, and social characteristics from two hundred
twelve farmers were included in this study. Through an empirical probit model we identified
the variables that should be considered when developing rural policies aimed at increasing
the likelihood to stay in farming. Our study finds that 12 of the 30 parameters were
significant (P<0.10), with an extremely good fit of the model (McFadden pseudo-R2 = 0.25,
Count R2 = 75.9%). Particularly, ‘female farmer’, ‘positive expectation about future farming
life’, ‘capacity of farm income to cover the expenses of the whole family’, ‘mixed
production’, ‘participation in an association’, and ‘distance to the nearest city’ were
positively associated with the stay decision. Moreover, our study also indicates, that
‘existence of a defined retirement age’, ‘existence of a defined sale price for the farm’, ‘a
mixed farm focused on livestock production’, ‘the possibility to make own decisions’, ‘age
squared’, and the ‘number of people living at the farm’ were negatively associated with the
stay decision. Our empirical findings suggest that farmer characteristics (gender, family size),
the farming system (multivariate production, efficiency), and social aspects of the rural
society (associations, protection of agricultural products) are also important aspects that
should be considered into rural development policies aimed at improving the likelihood of
staying, in addition to the technical characteristics of the farming, which have been
traditionally addressed in developing countries.
Keywords: exit decision, small farmers, family farming, binary choice model, developing
country, South America.

23
2.1 Introduction
Since 1970s Chile is open to global trade (Fleming and Abler 2013). As a consequence of
a successful international trade, an ambitious agricultural policy to become one of the
world’s top 10 agricultural exporter countries by 2015 was stated in 2006 (Campos and Polit
2011). This ‘open to global trade’ policy implied new challenges to competitiveness of
traditional agricultural areas with regard to survival, such as participation in international
trade and adoption of agricultural innovations (David et al. 2000; Echeverria et al. 2009;
Moreira and Bravo-Ureta 2010).
The exit of smaller and less productive farms from agriculture is beneficial for the
agricultural sector’s efforts to become competitive in world markets, and for allocating
resources between agriculture and other sectors (Breustedt and Glauben 2007). However, it
has an effect on equity within agriculture, productivity and efficiency of farming, and the
welfare of rural communities. This effect can be translated as an increase of larger and high
tech farms, declining farm employment, loss of family farms, and out-migration of farm and
non-farm residents, which are summarized in a declining number of farmers and an aging
rural population (David et al. 2000; Chang et al. 2011; Raggi et al. 2013). Particularly, in Chile
the rural population has decreased from 40% during the 1980s to 8% in the last decade
(Oyarzún and Miranda 2011). This is, mainly, rooted in the fact that younger and more
educated people have migrated from agriculture (Fawaz and Vallejos 2011), as their better
education offers them more non-rural employment opportunities (Ramírez et al. 2001).
Researchers and policy makers have developed long-term strategies to mitigate the
negative consequences of the exit from agriculture and to sustain or rejuvenate the rural
population. These strategies have considered long-term financial assistance for farmers to
increase production efficiency, such as commodity subsidies, price controls, diverse forms of
market protection, government-funded R & D and education (Chang et al. 2011). In Chile,
the Agricultural Development Institute – INDAP1 is the government organization mandated
to assist farmers2, in order to reduce the economic gap between rural and urban areas and
to make them competitive at global trade (MINAGRI 1990; INDAP 2013a). To counteract the
exit from agriculture INDAP gives technical and financial support to fostering
entrepreneurship among peasant families (as a first step) to then promote them as
successful firms able to compete into the global trade (as a second stage). The INDAP
investment in consolidating and expanding existing farm businesses, i.e., farmers in the
1 INDAP: Instituto de Desarrollo Agropecuario, established in 1962. In 2013, 62% of the 270,000 Chilean small
farmers were beneficiaries of the INDAP. 2 To receive this assistance, the farm’s size must not exceed 12 equivalent irrigated hectares (HRB) and the farmer’s
main income must be provided by farming (MINAGRI, 1990). A HRB is a measurement unit that uses soil and climate
variables to establish a production potential equivalent throughout the country.

Chapter 2 FACTORS INFLUENCING THE STAY-EXIT DECISION
24
second stage (15% of INDAP users), has been increased by 65% in the last 5 years. However,
the number of INDAP users has been increased by only 3% (INDAP 2013b), which indicates
that current INDAP programs have not been successful in achieving their goals.
To increase the likelihood to stay in farming, a good understanding of the factors underlying
the exit process and economic development in rural areas ought to be achieved (Henning et
al. 2013). Therefore, a more accurate understanding of the stay-exit mechanism is essential
for the design of well targeted and efficient policies that enhance the future structure of
farming, land management, and the population and employment dynamics in rural areas
(Raggi et al. 2013).
Existing studies on Chilean agriculture have been either focused on the economic and
technical efficiency of farms (Smith et al. 2002; Lerdon et al. 2010; Moreira and Bravo-Ureta
2010) or on the characteristics of the farmer and labor force (Vera and Moreira 2009;
Carmona et al. 2010). However, there are no studies that have examined the factors driving
the exit decision of farmers in Chile, neither in Latin America.
This paper aims to fill this knowledge gap by investigating the main factors driving the
stay-exit decision of small livestock farmers in three regions of southern Chile. This study
provides information for decision-makers that is useful to design well targeted and efficient
rural policies. The remainder of this paper is structured as follows: Section 2 outlines the
material and methods, followed by the presentation of the results in Section 3, the
discussion in section 4, and conclusions in section 5.
2.2 Material and methods
2.2.1 Theoretical foundation for the study
The stay-exit decision of farmers is conceptualized using three theories (see Figure 2.1):
efficiency theory, exit barriers theory, and the life-cycle theory (Boehlje 1992; Pushkarskaya
and Vedenov 2009).

25
Figure 2.1. Theories and their main driving factors involved in stay-exit decision problem.
Efficiency theory is the main theoretical framework for explaining the exit decision
(Boehlje 1992; Pushkarskaya and Vedenov 2009). It compares the expected utility of staying
in farming, E(U)stay, with the expected utility of exiting farming, E(U)exit. The E(U)stay is a
function of financial factors, such as farm income and non-farm income, and of non-financial
ones, such as social and network status. The E(U)exit is mainly determined by labor income
(which depends on job availability and skills), and by factors such as living expenses and
availability of services. This theory assumes a rational decision maker that has access to all
required information to make a decision; if so the alternative with the highest expected
utility E(U) is preferred. However, assumptions are never fulfilled. Therefore, two
complementary theories are used: exit barriers theory and life-cycle theory (Karakaya 2000;
Pushkarskaya and Vedenov 2009). Exit barriers theory focuses on direct or indirect obstacles,
which limit the rational behavior assumed by the efficiency theory. Direct barriers are
obstacles on their own, such as the sunk cost of previous investments, while indirect barriers
affect the E(U) by reducing the capability of acquiring new skills. This theory explains why
enterprises continue operating even while realizing a very low profit or a loss (Chang et al.
2011). Life-cycle theory focuses on specific human capital (Gale 1994). This theory assumes
that farmers make input, production, and investment plans that are optimal given their
Efficiency theory
Exit barriers theory
Life-cycle theory
E(U)Stay
E(U)Exit
LABOUR INCOME: Potential job Required skills
INDIRECT: Skills acquisition
DIRECT: Farm investment Capital availability Labour opportunity costs Farmer’s age
OTHERS: Social status Network status
OTHERS: Living expenses Services
FARM INCOME: Technical efficiency Price of inputs and outputs Production level
NON-FARM INCOME: Off-farm job Subsidies Transfers
STAY-EXIT DECISION
INDIRECT: Preferences Risk attitude
DIRECT: Age Knowledge
Main theory Auxiliary theories
Legend:

Chapter 2 FACTORS INFLUENCING THE STAY-EXIT DECISION
26
biological life cycle (Boehlje 1992). In this theory, factors that influence the stay-exit decision
include farmer’s age, family size, own knowledge, and risk attitude.
Because all these aspects are assumed to have a role in the stay-exit decision, these
three theories were merged into the conceptual framework (Figure 2.1), which provided a
consistent theoretical foundation for selecting the variables3 we have included in the
questionnaire.
2.2.2 Questionnaire development
We used the conceptual framework shown in Figure 2.1 to develop a questionnaire
focused on factors that might influence farmers’ stay-exit decision. It included both
qualitative and quantitative close-ended questions4 on characteristics of the farmer and his
family, farm production, satisfaction level, and expectations of the farmer. The variables we
analyzed in this study and their expected effects on the stay-exit decision are summarized in
Table 2.1.
3 A detailed explanation of the selected variables can be found in the Appendix 2.1. 4 This document is available upon request to authors.

27
Table 2.1. Definition and the expected effect of the variables used in the empirical model.
Dependent variables
STAY Dummy for decision to stay on farm (1 if yes, 0 if no)
Independent variables Expected
effect
Variables related to efficiency theory
INCENO Dummy for enough income from farm to cover expenses (1 if yes, 0 if no) +
HA Hectares of land +
MIXFARM Dummy for production of livestock and crop (1 if yes, 0 if no) +
LIVESMIXFARM Dummy for main production is livestock (1 if yes, 0 if no) +
DIVERSIFICATION Dummy for diversification preference (1 if yes, 0 if no) +
OFFINCREL Dummy for importance of off-farm income (1 if yes, 0 if no) +/-
ASSOCIATION Dummy for participation in associations (1 if yes, 0 0 if no) +
NETWORK Dummy for importance of social network (1 if yes, 0 if no) +
RECOGNIZE Dummy for importance of being recognized as good farmer (1 if yes, 0 if no) +
INDEPENDENCY Dummy for making own decisions about resource use (1 if yes, 0 if no) +
Variables related to exit barrier theory
BUILDINGS Number of buildings +
LEACOST Dummy for high leaving (opportunity) cost (1 if yes, 0 if no) +
DISTANCE Distance to the nearest city (in kilometers) +/-
Variables related to life-cycle theory
AGE Farmer’s age +
AGESQ Farmer’s age squared +
FEMALE Dummy for farmer's gender (1 if female, 0 if male) +
MARRIED Dummy for married (1 if yes, 0 if no) +/-
SCHOOLING Years of formal education of the farmer. +/-
AGRIEDUC Dummy for farmer has agricultural education (1 if yes, 0 if no) +/-
NONAGRIEDUC Dummy for farmer has non-agricultural education (1 if yes, 0 if no) +/-
FAMSIZE Number of people living at the farm +
FAMLAB Dummy for presence of family labor (1 if yes, 0 if no) +
SUCCESSOR Dummy for presence of defined successor (1 if yes, 0 if no) +
RETIREAGE Dummy for defined retirement age (1 if yes, 0 if no) -
SALEPRICE Dummy for defined sale price for the farm (1 if yes, 0 if no) -
SATISFY Dummy for overall satisfaction (1 if yes, 0 if no) +
LIFEEXP Dummy for positive expectation of future farming life (1 if yes, 0 if no) +
Location area
ARAUCANÍA Dummy for farms located in La Araucanía region (1 if yes, 0 if no)
RÍOS Dummy for farms located in Los Ríos region (1 if yes, 0 if no)
LAGOS Dummy for farms located in Los Lagos region (1 if yes, 0 if no)
The variables we identified as having potential impact on stay-exit decision and their
expected effect on this decision are following. From the Efficiency theory we used: INCENO,
HA, MIXFARM, LIVESMIXFARM, and DIVERSIFICATION to capture the effect of farm income
(Bragg and Dalton 2004; Foltz 2004; Pushkarskaya and Vedenov 2009). We expected these
variables to have a positive impact on the decision to stay. We used OFFINCREL to capture

Chapter 2 FACTORS INFLUENCING THE STAY-EXIT DECISION
28
the effect of off-farm activities (Bragg and Dalton 2004; Pushkarskaya and Vedenov 2009;
Zhan et al. 2012). We expected this variable to have either a positive or negative effect on
the decision to stay. We used ASSOCIATION, NETWORK, RECOGNIZE, and INDEPENDENCY to
capture the effect of non-financial variables (Gasson et al. 1988; Fairweather and Keating
1994). We expected these four variables to have a positive association with the decision to
stay. From the Exit barrier theory we used BUILDINGS and LEACOST to capture the effect of
sunk costs (Rosenbaum and Lamort 1992; Karakaya 2000; Goetz and Debertin 2001; Foltz
2004). We expected these variables to have a positive association with the decision to stay.
We also used the variable DISTANCE (Goetz and Debertin 2001) and we expected this
variable to have either a positive or negative association with the decision to stay. From the
Life-cycle theory we used AGE, AGESQ, FEMALE, MARRIED, SCHOOLING, AGRIEDUC, and
NONAGRIEDUC to capture the effect of farmer’s characteristics (Boehlje 1992; Bragg and
Dalton 2004; Baylina and Salamaña 2006; Pushkarskaya and Vedenov 2009; Charatsari et al.
2013). We expected AGE, AGESQ, and FEMALE to have a positive effect on the decision to
stay; while we expected the other four variables to have either a positive or negative effect
on the decision to stay. We used FAMSIZE, FAMLAB, and SUCCESSOR to capture the effect of
the characteristics of farmer’s family (Zollinger and Krannich 2002; Glauben et al. 2006;
Breustedt and Glauben 2007; Hennessy and Rehman 2008). We expected these variables to
have a positive association with the decision to stay. We used RETIREAGE and SALEPRICE to
capture the effect of farmer willingness to exit from farming (Pushkarskaya and Vedenov
2009). We expected these two variables to have a negative association with the decision to
stay. We include SATISFY and LIFEEXP to capture the effect of overall satisfaction and
positive expectation, respectively (Hellman 1997; Zollinger and Krannich 2002; Kuehne
2013). We expected these variables to have a positive association with the decision to stay.
Last, we also included the regions to identify the effect of the area.
2.2.3 Study area and sampling population
We conducted this study in three administrative regions in southern Chile: La
Araucanía, Los Ríos, and Los Lagos (see Figure 2.2).

29
Figure 2.2. Geographic location of the study area.
These regions cover 24% of the total land used for livestock and forestry in Chile, but
account for 49% of all livestock and forestry farms. Sixty per cent of bovine producers are
situated in these regions, which are managing 63% of all beef cattle and 91% of all dairy cows
in Chile (INE 2007). Eighty percent of the farms are managed by farmers older than 45 years,
and 70% of farmers have no more than eight years of formal education, i.e. preparatory
school (Apey and López 2011). It is also where 45% of the total number of INDAP users are
located (INDAP 2013b). Farm sizes range from 10 to 200 ha of land with 0.62 to 1.16 AU5/ha.
Feeding is either solely from pastures, or in combination with supplementary concentrates
(Vera 2006). The coexistence of small farms (focused on timber logging, livestock breeding,
and small-scale cultivation of cereals and potatoes) with larger and more entrepreneurial
farms is common in this area (Barrett et al. 2002; Vera 2006). We chose this area because
5 AU: Animal Unit is a standard unit used in calculating the relative grazing impact of different kinds and classes of
livestock and is defined as the amount of forage consumed by a 1,000 pound (454 kg) mature cow, either dry or
with a calf up to 6 months of age, with a daily dry matter forage requirement of 26 pounds (11.8 kg).

Chapter 2 FACTORS INFLUENCING THE STAY-EXIT DECISION
30
one of the participating research centers is located here, allowing access to the names and
addresses of farmers.
In January 2014, we obtained a database from each INDAP Regional Office, containing
the age of the farmer and the size of the farm. From this database, we selected the INDAP
users that had at least basic information about their farming system, i.e., production level
registers. Three hundred farmers were selected from this database using a stratified random
sampling method (Neyman 1934). We used the farm size as a proxy to determine the
optimum sample size by region. The questionnaire was applied by the farmers’ own
agriculture advisors, to increase the likelihood that farmers would participate and provide
personal information. Two hundred twelve questionnaires were returned, between January
and March 2014, by those farmers who gave their consent to participate in this study. The
representativeness of the sample in terms of farm size and age of the farmer is shown in
Table 2.2, where the mean and standard deviation for these two variables are shown for the
sample and total population.
Table 2.2. Descriptive statistics of the age and farm size of INDAP beneficiaries of commercial programs
in 2013 (population and sample) in the study area.
Population descriptive statisticsa
Region N INDAP beneficiaries’ age
Farm size (ha)
Mean (SD) Min Max
Mean (SD) Min Max
La Araucanía 699 57 (13) 22 90
24.8 (24.9) 0.5 228.6
Los Ríos 833 60 (13) 24 96
36.2 (28.3) 2.0 250.0
Los Lagos 1,023 58 (13) 21 93
33.1 (39.5) 0.5 375.0
Total area 2,555 58 (13) 21 96
31.9 (32.8) 0.5 375.0
Sample descriptive statistics
Region n INDAP beneficiaries’ age
Farm size (ha)
Mean (SD) Min Max
Mean (SD) Min Max
La Araucanía 57 55 (12) 27 85
30.5 (22.6) 3.0 136.0
Los Ríos 67 58 (11) 30 84
33.3 (25.7) 6.0 140.0
Los Lagos 88 56 (12) 28 81
26.7 (18.5)b 5.0 90.0
Total area 212 56 (12) 27 85
29.8 (22.2) 3.0 140.0 a Based on information provided by INDAP Regional offices 2014.
Note: no differences between regional values for the population and the sample were confirmed using a ɀ-test for the mean and
χ2-test for the variance at the 0.05 significance level. b Except for the variance of farm size for the Los Lagos region.
There is a small difference in the variance of the farm size for Los Lagos region, which is
attributable to the larger size of this region, and because the bigger farms are located in
more remote areas. Otherwise the sample is considered to be representative, as no other
differences in regional values between the sample and population were found.

31
0* if 0
0* if 1
(0,1) ~ ,'*
iy
iy
iStay
NIDiii
xi
y
0
2
log
log1pseudo sMcFadden'
L
LR M
2.2.4 Statistical modelling
We used a binary choice model to identify the impact of the selected variables on the
farmer’s decision to stay, as the farmer’s final decision has two possible outcomes, i.e. stay
and exit. This kind of model holds only two values for the unobserved dependent latent
variable *iy : 0 or 1 (Verbeek 2012). In our study, the dependent variable indicates the
likelihood that the ith farmer will stay on the farm during the next five years; where a value of
1 indicates the likelihood to stay and a value of 0 indicates the likelihood to exit. As each
farmer has his own preference, which is determined by many independent and individual
factors; we assumed a standard normal distribution for the error. Therefore, we used a
probit model as following (equation (2.1)):
(2.1)
where the explanatory variables are represented by 'i
x , the coefficients to be explained are
represented by , and the random error term is represented byi (Verbeek 2012).
We measured the goodness-of-fit for this model in terms of the significance-of-fit and
the proportion of correct predictions between calculated probabilities and observed
response frequencies6 (Domencich and McFadden 1975; Dhrymes 1986; Hoetker 2007).
Since no single pseudo-R2 covers these points
7, we chose McFadden pseudo-R
2 and Count R
2
to evaluate the goodness-of-fit (Veall and Zimmermann 1996; Hoetker 2007; Wooldridge
2012). The McFadden pseudo-R2 is the most frequently used measure in discrete choice
models because it uses the log-likelihood provided by the probit model, and because it is less
sensitive to misspecification in the error term8 (Veall and Zimmermann 1996). The McFadden
pseudo-R2 indicates a percent increase in the log-likelihood function (equation (2.2)):
(2.2)
6 The pseudo-R2 cannot be interpreted as the square of the correlation coefficient between ‘predicted’ and ‘actual’
observations (Dhrymes et al., 1986). 7 For a detailed coverage of pseudo-R2 measures see Veall and Zimmermann (1996). 8 Compared with McKelvey and Zavoina R2, which scores best under the comparability OLS criterion (Ibid).

Chapter 2 FACTORS INFLUENCING THE STAY-EXIT DECISION
32
CountTotal
CorrectR
# Count 2
where LM and L0 are the likelihood of the model with and without regressors, respectively,
subject to the constraint that all the regression coefficients except the constant term are
zeros. The Count R2 transforms the continuous predicted probabilities into a [0-1] scale, and
gives the proportion of correct predictions (equation (2.3)) (Hoetker 2007).
(2.3)
We also compared the key characteristics of the exit and stay groups after the probit
model estimation. This comparison provides potential insights that can be used to design
efficient policies. A t-test was used for metric variables and a Mann-Whitney U test was used
for non-metric variables.
2.3 Empirical results
The descriptive statistics of the variables used in this study and the empirical results
obtained from the estimation of the probit model are summarized in Table 2.3.

33
Table 2.3. Descriptive statistics and probit estimates of the variables used in the empirical model
Descriptive statistics Probit estimates
Dependent variables Mean (SD) Coefficient Marginal effect
(dF/dx) P>z
STAY 0.63 (0.48)
Independent variables
Variables related to efficiency theory
INCENO 0.77 (0.42) 0.541 0.206 0.061 *
HA 29.79 (22.16) 0.004 0.002 0.419
MIXFARM 0.28 (0.45) 0.740 0.247 0.072 *
LIVESMIXFARM 0.17 (0.38) -0.789 -0.303 0.074 *
DIVERSIFICATION 0.50 (0.50) 0.093 0.034 0.689
OFFINCREL 0.40 (0.49) 0.342 0.123 0.134
ASSOCIATION 0.47 (0.50) 0.420 0.152 0.088 *
NETWORK 0.61 (0.49) 0.104 0.038 0.656
RECONGNIZE 0.82 (0.39) 0.367 0.140 0.225
INDEPENDENCY 0.58 (0.49) -0.422 -0.152 0.081 *
Variables related to exit barrier theory
BUILDINGS 2.94 (1.24) -0.004 -0.002 0.962
LEACOST 0.79 (0.41) -0.230 -0.082 0.411
DISTANCE 20.68 (16.03) 0.011 0.004 0.107 *
Variables related to life-cycle theory
AGE 56.31 (12.04) 0.099 0.036 0.147
AGESQ 3315.19 (1352.25) -0.001 0.000 0.081 *
FEMALE 0.21 (0.41) 0.771 0.248 0.011 **
SCHOOLING 9.83 (3.01) 0.017 0.006 0.684
AGRIEDUC 0.43 (0.50) -0.318 -0.117 0.163
NONAGRIEDUC 0.23 (0.42) -0.080 -0.030 0.772
MARRIED 0.82 (0.39) 0.098 0.036 0.728
FAMSIZE 2.50 (2.00) -0.106 -0.039 0.068 *
FAMLAB 0.33 (0.47) 0.346 0.123 0.166
SUCCESSOR 0.56 (0.50) -0.270 -0.098 0.237
RETIREAGE 0.28 (0.45) -0.572 -0.217 0.018 **
SALEPRICE 0.34 (0.47) -0.538 -0.202 0.035 **
SATISFY 0.90 (0.31) 0.336 0.128 0.415
LIFEEXP 0.75 (0.44) 0.637 0.242 0.020 **
Location area:
ARAUCANÍA 0.27 (0.44)
RÍOS 0.32 (0.47) -0.054 -0.020 0.883
LAGOS 0.41 (0.49) -0.371 -0.137 0.201
consP -3.008 0.139
Measure of fit for Probit model
McFadden's pseudo-R2: 0.25
Count R2: 76% Note: Marginal change (dF/dx) is for discrete change of dummy variable from 0 to 1
Bold denotes: * significant at 10% critical level and ** significant at 5% critical level P Probit constant value

Chapter 2 FACTORS INFLUENCING THE STAY-EXIT DECISION
34
Table 2.3 shows the descriptive statistics of the variables we used in this study (columns
2 and 3). It also shows the coefficient estimates, the marginal effect, and the P–value for the
Probit model (columns 4 to 6). Since space is limited, independent variables that were found
significant for the probit model are described only.
Table 2.3 shows that 63% of the farmers indicated they will stay on farming during the
next five years (our dependent variable: STAY).
Regarding to efficiency theory Table 2.3 shows that, in terms of financial variables, 77%
of the farmers indicated to gain enough income from farming to cover their expenses
(INCENO). It also shows that 28% of these farms did produce both crops and livestock
(MIXFARM), and 17% of them did produce livestock as the main product (LIVESMIXFARM). In
terms of non-financial variables, almost half of the farmers indicated as belonging to a formal
association (ASSOCIATION), and about sixty percent indicated that farming allows them to
make their own decisions (INDEPENDENCY). Regarding to the exit barrier theory Table 2.3
shows that the distance to the nearest city was 21 km (DISTANCE). Regarding to the life-cycle
theory Table 2.3 shows that 21% of the farmers were owned by women (FEMALE) and that
the average family size was 2.5 members (FAMSIZE). Table 2.3 also shows that about thirty
percent of the farmers indicated to have either a defined retirement age (RETIREAGE) or a
defined sale price for the farm (SALEPRICE). Seventy five percent of the farmers indicated to
have a positive expectation of future farming life (LIFEEXP).
Our findings for the Probit model show that 12 out of the 30 parameters were
significant at the 10% critical level (in bold in Table 2.3). Although the coefficient estimates
are presented in Table 2.3 (column 4), the effect of changes in the explanatory variables
should be interpreted considering the marginal effects (column 5); a positive value of the
latter means the probability of the stay decision increases with that variable.
We found strongly positive associations (P<0.05) with the stay decision for two
variables related with life-cycle theory, i.e., FEMALE and LIFEEXP. However, we found
intermediate positive associations (P<0.10) with three variables related with efficiency
theory, i.e., INCENO, MIXFARM, and ASSOCIATION; with one variable related with exit barrier
theory, i.e., DISTANCE, and with one variable related with life-cycle theory, i.e., AGESQ.
Additionally, we also found another weaker positive associations (P<0.20) for OFFINCREL,
AGE, and FAMLAB.
Moreover, we found strongly negative associations (P<0.05) with the stay decision for
two variables related with life-cycle theory, i.e., RETIREAGE, and SALEPRICE. However, we
found intermediate negative associations (P<0.10) with two variables related with efficiency
theory, i.e., LIVESMIXFARM, and INDEPENDENCY; and with one variable related with life-
cycle theory, i.e., FAMSIZE. Additionally, we also found another weaker negative associations
(P<0.20) for AGRIEDUC and for LAGOS.

35
The goodness-of-fit measures of the model show a McFadden pseudo-R2 = 0.25, which
is in the range considered to be extremely good, i.e. between 0.2 – 0.4 (Louviere et al.
2000)9. The Count R
2 value indicates that the model correctly predicted the decision to stay
for 76% of the observations. These values indicate that the explanatory power of the
variables in the model was relatively high.
The comparison between groups of farmers likely to stay and those likely to exit is
shown in Table 2.4.
9 These values are approximately equivalent to a range from 0.7 to 0.9 for a linear regression Domencich, T,
McFadden, D (1975) 'Urban travel demand: a behavioral analysis: a Charles River Associates research study.' (North-
Holland Publishing Company Limited: Amsterdam, the Netherlands)

Chapter 2 FACTORS INFLUENCING THE STAY-EXIT DECISION
36
Table 2.4. Comparison of the mean values (standard deviations in parentheses) between exit-farmers
and stay-farmers
Variable Exit Stay (Asymp.) Sig.
(2-tailed) n=79 n=133
Variables related to efficiency theory
INCENO 0.684 (0.468) 0.820 (0.386) 0.023 **
HA 28.497 (16.713) 30.562 (24.871) 0.471
MIXFARM 0.253 (0.438) 0.293 (0.457) 0.530
LIVESMIXFARM 0.190 (0.395) 0.165 (0.373) 0.651
DIVERSIFICATION 0.418 (0.496) 0.556 (0.499) 0.051 **
OFFINCREL 0.316 (0.468) 0.444 (0.499) 0.068 *
ASSOCIATION 0.430 (0.498) 0.496 (0.502) 0.354
NETWORK 0.557 (0.500) 0.647 (0.480) 0.196
RECOGNIZE 0.759 (0.430) 0.850 (0.359) 0.102 *
INDEPENDENCY 0.595 (0.494) 0.579 (0.496) 0.820
Variables related to exit barrier theory
BUILDINGS 2.924 (1.207) 2.947 (1.269) 0.895
LEACOST 0.772 (0.422) 0.797 (0.404) 0.670
DISTANCE 19.873 (14.825) 21.167 (16.745) 0.571
Variables related to life-cycle theory
AGE 59.190 (12.592) 54.602 (11.403) 0.007 **
AGESQ 3660.000 (1458.806) 3110.376 (1245.804) 0.004 **
FEMALE 0.139 (0.348) 0.256 (0.438) 0.046 **
SCHOOLING 9.506 (2.828) 10.015 (3.109) 0.235
AGRIEDUC 0.430 (0.498) 0.429 (0.497) 0.980
NONAGRIEDUC 0.190 (0.395) 0.248 (0.434) 0.328
MARRIED 0.835 (0.373) 0.805 (0.398) 0.575
FAMSIZE 2.620 (2.126) 2.421 (1.920) 0.484
FAMLAB 0.253 (0.438) 0.376 (0.486) 0.067 *
SUCCESSOR 0.620 (0.488) 0.519 (0.502) 0.151
RETIREAGE 0.418 (0.496) 0.195 (0.398) 0.000 **
SALEPRICE 0.418 (0.496) 0.293 (0.457) 0.065 *
SATISFY 0.848 (0.361) 0.925 (0.265) 0.077 *
LIFEEXP 0.595 (0.494) 0.835 (0.373) 0.000 **
Location area
ARAUCANÍA 0.203 (0.404) 0.308 (0.464) 0.094 *
RÍOS 0.228 (0.422) 0.368 (0.484) 0.034 **
LAGOS 0.570 (0.498) 0.323 (0.470) 0.000 ** Notes: t-test was used for testing parametric variables and Mann-Whitney U test was used for non-parametric variables
Bold denotes: * significant at 10% critical level and
** significant at 5% critical level.
Table 2.4 shows that 15 of the 30 variables were significantly different between these
two groups at the 10% critical level, with 9 of the 30 variables significantly different at the 5%
critical level. We found strong statistical differences between groups (P<0.05) for two
variables related with efficiency theory, i.e., INCENO, and DIVERSIFICATION; and for five
variables related with life-cycle theory, i.e., AGE, AGESQ, FEMALE, RETIREAGE, and LIFEEXP.
We also found strong statistical differences between groups for RIOS and LAGOS. We found

37
intermediate statistical differences between both groups (P<0.10) for two variables related
with efficiency theory, i.e., OFFINCREL, and RECOGNIZE; for three variables related with life-
cycle theory, i.e., FAMLAB, SALEPRICE, and SATISFY. We also found intermediate statistical
differences between groups for ARAUCANIA.
2.4 Discussion
The aim of this study was to identify the main factors driving the stay-exit decision of
small sized livestock farmers in Chile to provide useful information for policy/decision-
makers to design well targeted and efficient rural policies. To do this, we reviewed the
related literature for designing a questionnaire to collect the required data from farmers. We
obtained two sets of results, which are summarized in Tables 2.3 and 2.4.
2.4.1 Theoretical foundation for the study
Previous studies have established efficiency theory as the main theory for explaining
the stay-exit decision in farming, with the exit barrier theory and life-cycle theory as two
auxiliary theories (Boehlje 1992; Rosenbaum and Lamort 1992; Karakaya 2000; Goetz and
Debertin 2001; Pietola et al. 2003; Breustedt and Glauben 2007; Pushkarskaya and Vedenov
2009; Zhan et al. 2012). However, most of these studies used only one theory to explain this
decision, and only a few of them included variables from all three theories (Boehlje 1992;
Karakaya 2000; Pushkarskaya and Vedenov 2009). Moreover, these studies have been
carried out in developed countries, and there is no evidence of a study on the stay-exit
decision in South America, which includes variables from all three theories. Most notably, to
our knowledge, this is the first study that investigates the factors involved in the stay-exit
decision in farming in Chile, which includes aspects from these three theories (as
summarized in Figure 2.1). We tested the association of the hypothesized explanatory
variables with the decision to stay in farming using a probit model. We found associations
with variables from the three theories. However, the stronger associations were found for
life-cycle theory related variables. Our results agree with previous studies, e.g. farm income
or positive expectation of future farming life. But they also contradict those of other studies,
e.g. farm focused on livestock production or possibility to make own decisions, which may be
attributed to cultural and geographical differences. Since our findings support the idea that
efficiency theory is not enough for explaining the stay-exit decision, we believe that variables
from the other two theories must be considered by policy makers for designing well targeted
and efficient rural policies.

Chapter 2 FACTORS INFLUENCING THE STAY-EXIT DECISION
38
Therefore, our findings support the idea that variables from the both exit barrier and
life-cycle theories must be considered by policy makers for designing well targeted and
efficient rural policies, since only using variables from efficiency theory is not enough for
explaining the stay-exit decision.
2.4.2 Explanation of the analyses findings
Descriptive analysis showed that having enough income (provided by farming) to cover
farmer expenses (77%) is not sufficiently enough argument to increase the likelihood to stay
in farming (63%). This supports the fact that stay-decision cannot be fully explained by
efficiency theory. We could infer that farmers believe that diversification is a good farming
strategy (50%); however, only 28% of them produced both crops and livestock products.
These farms are mostly owned by farmer aged 56 or older. The farmer's family size is as
small as 2 or 3 people and one out of three family members work in the farm only.
Probit model showed that the effects of all variables associated with the stay decision
were in line with our a priori expectations. Our findings for the capacity of farm income to
cover the expenses of the whole family are supportive of utility theory (Boehlje 1992; Goetz
and Debertin 2001; Pushkarskaya and Vedenov 2009; Zhan et al. 2012). Therefore it may be
assumed that farming, from a financial viewpoint, provides a higher expected utility than exit
from farming. Although we found a small level of diversification among these farmers, its
effect is in agreement with other studies (Goetz and Debertin 2001; Bragg and Dalton 2004;
Foltz 2004; Zhan et al. 2012). This could indicate the willingness of small farmers to
commercialize more than one product as a strategy to either buffer or expand their farm
income. The result found for the participation in associations is in agreement with the theory
that exit from farming implies a loss of location-specific social capital (networks) (Huffman
and Feridhanusetyawan 2007). The fact that only participation in an association was found to
be significant, and that participation in a network was not (even considering that 61% of the
farmer reported this variable as an important one), suggests that farmers prefer ‘formal’
social networks providing technical and financial assistance, i.e. agricultural cooperatives,
rather than more informal networks that share labor and machinery, i.e. neighborhood
relationships. Distance to the nearest city is positively associated with the decision to stay,
which is in agreement with Goetz and Debertin (2001). This implies that greater distance
does lead to higher transaction and opportunity costs. The age (not significant) and age
squared effect are in agreement with both Gale (1994) and Breustedt and Glauben (2007).
They showed that exit is more likely at the consolidation period than at start-up or maturity,
mainly, because changing from farm job to nonfarm job requires specific investments in
human capital, which are higher for older farmers. Also, older farmers may be less willing to
bear risks either due to their shorter planning horizons (Polson and Spencer 1991).

39
Therefore, an older farmer has a higher likelihood to stay. In addition, age is statistically
different between the exit-farmer and the stay-farmer groups. Although the labor market for
women in rural areas is limited by their roles in the family, the availability of services, and
mobility (Baylina and Salamaña 2006; Charatsari et al. 2013), the presence of a female
farmer increases the likelihood to stay. This result could be related to the ‘manager role’
played by wives/mothers in the family farm, where they are formally the owner of the farm
and their husband and/or children do the physical work on the farm. Possible explanation for
this are given by the fact that network, sunk costs, family size, successor presence, and
overall satisfaction were significantly higher for female rather than male farmers, which
reinforces the finding of the positive association of a female farmer with the decision to stay
(data not shown). The effect of having positive expectation regarding future farming life is in
agreement with Zollinger and Krannich (2002), who showed that when a farmer perceives
positives changes, the likelihood to continue the farming operation increases. Hence, having
a promising future for farming is a key for the likelihood to stay.
Moreover, the variables negatively associated with the stay decision did not always
show the expected effect. The negative effect of being a farm focused on livestock
production could be explained by an unbalanced production system or due to some specific
features of the land, which might not be adequate for livestock production. It also could be
explained by the fact that livestock production demands more time than crop production
giving a reduced leisure time for farmers (Boehlje and Eidman 1984). As the surveyed
farmers said, for them the livestock production is an enslaving job. The possibility to make
own decisions did not show the expected effect, which is in disagreement with Fairweather
and Keating (1994) and Gasson et al. (1988). A possible explanation for this finding is that the
supposed autonomy of the farmer is restricted by the biological cycle of farming (Boehlje and
Eidman 1984). The family size did not show the expected effect. This finding is not in
agreement neither with Chang et al. (2011), who indicated that family size, like most
demographic characteristics, does not affect the stay-exit decision, nor with Breustedt and
Glauben (2007), who indicated that large family size reduces the net exit rates. This result
could be explained by the lack of opportunities in large families for all family members to
work on the farm. Even if these opportunities exist, it is also likely that some family members
prefer to find employment outside the farm. If some members of the family are employed
off-farm, then this lowers the transaction costs of exiting farming and increases the
opportunity cost of farm labor (Goetz and Debertin 2001; Pushkarskaya and Vedenov 2009).
The existence of a defined retirement age and the presence of a defined sale price for the
farm showed the expected effect, indicating that these variables are predictors of farmers
that prepare to exit, a result that is in agreement with Pushkarskaya and Vedenov (2009).
Besides indicating that the likelihood to stay decreases, it might also imply that no family
member is available for transferring responsibilities or to take over the farm. In addition,

Chapter 2 FACTORS INFLUENCING THE STAY-EXIT DECISION
40
these two variables were statistically different between the exit-farmer and stay-farmer
groups.
Other variables included in our probit model did not show a statistically significant
effect on the stay decision. However, when variable region was removed from the model,
the presence of a successor showed a slightly negative effect, which is not in agreement with
previous studies (Zollinger and Krannich 2002; Gale 2003; Glauben et al. 2006). This effect
could be explained by the fact that the owner assumes that there is a successor for taking
over the farm (56% of the answers); nevertheless the farmer is not preparing to exit and pass
on the farm to his/her successor (72% of them said did not want to retire from farming). The
education variables also showed no significant effect on the decision to stay, which is in
agreement with Bragg and Dalton (2004). However, the sign of this effect suggests that
higher educated farmers increased their own knowledge to improve access to off-farm
employment, i.e. exit (Huffman and Feridhanusetyawan 2007; Chang et al. 2011), rather
than adopting management-intensive systems in an effort to improve farm efficiency, i.e.
stay.
In addition to our findings from probit model, we also found statistically significant
differences between the exit-farmer and stay-farmer groups for the following variables:
INCENO, AGESQ, FEMALE, RETIREAGE, SALEPRICE, SATISFY, and LIFEEXP.
2.5 Conclusions
2.5.1 Farmers’ profiles and implications for policy making
Based on our findings, a ‘typical’ stay farmer is able to cover the expenses of the whole
family, through the production of both livestock and crop. He or she participates in
associations and considers that the distance to the nearest city is not a problem for farming.
This farmer could be also characterized to be a woman, and for having a positive expectation
of future farming life. In contrast, a ‘typical’ exit farmer is characterized as a farmer who has
both a retirement age and a sale price for the farm defined. Although this farmer also
produces both livestock and crop, is more focused on livestock and, accordingly, considers
that there is no possibility to make own decisions about the use of resources in farming. This
‘exit’ farmer also considers that the larger the size of the family, the better it is to leave
farming.
Our empirical findings indicate potential opportunities for the development of efficient
policies aimed at increasing the likelihood of farmers staying in rural areas in Chile. Firstly,
new rural policies should focus on farmer characteristics such as age, gender and
expectations. These policies could be developed to foster female agricultural

41
entrepreneurship, and provide space for new jobs for family members. They should also
consider a retirement plan, including benefits for those farmers that transfer the farming
business to another family member. Secondly, new rural policies should also focus on the
farming system. The emphasis should be on fostering multivariate production at a basic
level, as a buffer tool to overcome unexpected changes, and on fostering the adoption of
new technologies and management skills to improve efficiency. Thirdly, new policies should
focus on the social aspect of rural society as well. Programs could be developed that foster
formal associations and provide a more accessible, secure and promising future for farming.
However, to make these recommendations usable for policy makers, the following
aspects need further research as a basis for designing new rural policies: characteristics of
the farmer and his family, farm efficiency and factors influencing this efficiency, and socio-
economic behavior both inside and outside of rural communities. These aspects could
provide a foundation for increasing the opportunities to keep family members working on
the farm (or hire people), make small livestock famers competitive, generate rural jobs, and
provide autonomy to farmers, which in turn should stop the migration from rural areas.

Chapter 2 FACTORS INFLUENCING THE STAY-EXIT DECISION
42
Acknowledgements
This research was financially sponsored by CONICYT (National Commission for Scientific
and Technological Research) of the Chilean Government through the BecasChile Program.
The authors would like to thank all the farmers who kindly provided data for this study, and
to the agriculture advisors for helping with the data collection.

43
Appendix 2.1
Factors which might explain stay-exit were derived from these three theories. From the
Efficiency theory the potential related stay-factors we identified as having impact either on
farm income and non-farm income are following. We used the dummy variable INCENO to
capture the effect of farm income on the stay-exit decision (whether the farmer earns
enough income from the farm to cover the expenses of the whole family). Since the farm
income is a function of a particular combination of inputs to produce output(s), we included
variables to capture the effect of the size of the farm (HA), and the production of one or
more products (MIXFARM, LIVESMIXFARM, and DIVERSIFICATION). Land area has been
recognized to provide benefit from economies of scale (Tauer 2001; Pushkarskaya and
Vedenov 2009), while number of products has been recognized as increasing the farm
income (Bragg and Dalton 2004; Foltz 2004; Baylina and Salamaña 2006), and decreasing the
risk at farm level. We expected all these variables to have a positive impact on the decision
to stay. We used the dummy variable OFFINCREL to capture the effect of off-farm activities
on the stay-exit decision (for importance of off-farm income). Off-farm income has been
recognized for either (i) increasing the possibilities for maintaining a farm when there is low
farm income or losses (Bragg and Dalton 2004; Pushkarskaya and Vedenov 2009; Zhan et al.
2012), or (ii) increasing the farm exits since it lowers the transaction costs of leaving the farm
(Goetz and Debertin 2001), or increases the opportunity cost of farm labor (Boehlje 1992;
Bragg and Dalton 2004; Pushkarskaya and Vedenov 2009). We expected this variable to have
either a positive or negative effect on the decision to stay. We also used four dummy
variables to capture the effect of non-financial variables on stay decision, i.e., ASSOCIATION,
NETWORK, RECOGNIZE, and INDEPENDENCY. Participation in associations and network
status have been recognized as a location-specific social capital that provides information
and mutual assistance (labor and machinery sharing) to the farmer (Gasson et al. 1988;
Fairweather and Keating 1994). Farmer’s pride (RECOGNIZE) and autonomy (INDEPENDENCY)
have been recognized as increasing the expected utility provided by the farm (Gasson et al.
1988; Fairweather and Keating 1994; Chang et al. 2011). We expected these four variables to
have a positive association with the decision to stay.
From the Exit barrier theory the potential factors we identified as having either direct or
indirect impact on stay-exit decision are following. We used the variable BUILDINGS, and the
dummy variable LEACOST (opportunity cost of leaving) to capture the effect of sunk costs on
the stay-exit decision. Since infrastructure allows a farm to remain operating at a low profit
or even at a loss (Rosenbaum and Lamort 1992; Karakaya 2000; Goetz and Debertin 2001;
Foltz 2004), the quantity of buildings has been recognized as critical to a farmer’s decision to
work part-time off-farm or even quit from farming (Zhan et al. 2012). We expected these
variables to have a positive association with the decision to stay. We used the variable

Chapter 2 FACTORS INFLUENCING THE STAY-EXIT DECISION
44
DISTANCE (to the nearest city) to capture its effect on the stay-exit decision. Distance to the
nearest city is an indirect natural barrier for accessing off-farm employment (Goetz and
Debertin 2001). We expected this variable to have either a positive or negative association
with the decision to stay.
From the Life-cycle theory the potential factors we identified as having either direct or
indirect impact on stay-exit decision are following. We used the variables AGE, and AGESQ
(age squared) to capture the effect of farmer’s age on the stay-exit decision. The farmer’s
age has been recognized as having an impact on farmer’s preferences, beliefs, and risk
attitudes, which tend to change with different biological life cycle stages (Boehlje 1992; Gale
1994; Bragg and Dalton 2004; Breustedt and Glauben 2007; Huffman and
Feridhanusetyawan 2007; Pushkarskaya and Vedenov 2009). We expected these variables to
have a positive impact on the decision to stay. We used the variable FEMALE to capture the
effect of farmer’s gender on stay-exit decision. The crucial role women play in rural
production has been recognized by the introduction of rural entrepreneurship programs
specifically designed for them (Baylina and Salamaña 2006; Charatsari et al. 2013; INDAP
2014). We expected this variable to have a positive association with the stay decision. We
used the variables SCHOOLING, AGRIEDUC, and NONAGRIEDUC to capture the effect of the
farmer’s education level on the stay-exit decision. Education level has been recognized as
increasing the farmer’s ability to improve his knowledge and acquire new skills, which can
improve either the adoption of management-intensive systems or opportunities for off-farm
employment (Rettig 1993; Bragg and Dalton 2004; Huffman and Feridhanusetyawan 2007;
Schaber and Stum 2007; Chang et al. 2011). We expected these variables to have either a
positive or negative effect on the decision to stay. We also included the variable MARRIED to
capture the effect of farmer’s marital status on the stay-exit decision. Marital status has
been recognized as having impact on the career orientation of farmers and their children
mainly because the attitudes of wives and mothers in the family (Gasson et al. 1988). Wives
and mothers had been motivated to work outside farming (Boehlje 1992), however,
nowadays they have become, and are becoming, more involved in farming (Baylina and
Salamaña 2006; Trauger et al. 2010; Charatsari et al. 2013; INDAP 2014). We expected this
variable to have either a positive or negative effect on the decision to stay. We included the
variables FAMSIZE, FAMLAB, and SUCCESSOR to capture the effect of the characteristics of
farmer’s family on the stay-exit decision. Farming has been recognized as providing the
possibility of being self-employed and having more family members work (FAMLAB) on the
farm (Chang et al. 2011). It also has been recognized as an activity that allows, and
influences, a farmer to pass the business down to the next generation (SUCCESSOR) and
keep the farm in the family (Goetz and Debertin 2001; Lobley et al. 2002; Zollinger and
Krannich 2002; Gale 2003; Glauben et al. 2006; Breustedt and Glauben 2007; Hennessy and
Rehman 2008). We expected these three variables to have a positive association with the
45
decision to stay. We used the variables RETIREAGE, and SALEPRICE to capture the effect of
farmer willingness to exit from farming on stay-exit decision. These two variables have been
recognized as indicators of exiting from farming (Pushkarskaya and Vedenov 2009). We
expected these two variables to have a negative association with the decision to stay. Last,
we include two variables to capture the effect of overall satisfaction (SATISFY) and positive
expectation (LIFEEXP) on stay-exit decision. Both satisfied people and people perceiving
positive changes have been recognized as increasing the likelihood to stay in their jobs
(Hellman 1997; Zollinger and Krannich 2002). Since farming is a way of life that encompasses
the place where farmers live and work (Kuehne 2013), we expected these variables to have a
positive association with the decision to stay.

Chapter 2 FACTORS INFLUENCING THE STAY-EXIT DECISION
46
References
Apey, A, López, I, 2011. Agricultura chilena, información social y productiva según tamaño
del productor y localización geográfica, VII Censo Nacional Agropecuario y Forestal,
2007. Oficina de Estudios y Políticas Agrarias – ODEPA, Ministerio de Agricultura,
Gobierno de Chile, Santiago, Chile.
Barrett, G, Caniggia, M, Read, L (2002) “There are More Vets than Doctors in Chiloé”: Social
and Community Impact of the Globalization of Aquaculture in Chile. World
Development 30, 1951-1965.
Baylina, M, Salamaña, I (2006) El lugar del género en la geografía rural. Boletin de la
Asociacion de Geografos Espanoles 41, 99-112.
Boehlje, M (1992) Alternative models of structural change in agriculture and related
industries. Agribusiness 8, 219-231.
Boehlje, M, Eidman, V (1984) 'Farm management.' (Wiley: New York, USA)
Bragg, L, Dalton, T (2004) Factors Affecting the Decision to Exit Dairy Farming: A Two-Stage
Regression Analysis. Journal of Dairy Science 87, 3092-3098.
Breustedt, G, Glauben, T (2007) Driving Forces behind exiting from farming in western
Europe. Journal of Agricultural Economics 58, 115-127.
Campos, J, Polit, E, 2011. Nuevos enfoques para Chile Potencia Alimentaria y Forestal. Oficina
de Estudios y Políticas Agrarias – ODEPA, Ministerio de Agricultura, Gobierno de Chile,
Santiago, Chile.
Carmona, A, Nahuelhual, L, Echeverría, C, Báez, A (2010) Linking farming systems to
landscape change: An empirical and spatially explicit study in southern Chile.
Agriculture, Ecosystems & Environment 139, 40-50.
Chang, K, Langelett, G, Waugh, A (2011) Health, Health Insurance, and Decision to Exit from
Farming. Journal of Family and Economic Issues 32, 356-372.
Charatsari, C, Papadaki-Klavdianou, A, Michailidis, A, Partalidou, M (2013) Great
expectations? Antecedents of women farmers' willingness to participate in agricultural
education programmes. Outlook on Agriculture 42, 193-199.
David, M, Dirven, M, Vogelgesang, F (2000) The Impact of the New Economic Model on Latin
America’s Agriculture. World Development 28, 1673-1688.
Dhrymes, PJ (1986) Limited dependent variables. In 'Handbook of Econometrics.' (Eds Z
Griliches, M Intriligator.) Vol. 3 pp. 1567-1631. (Elsevier Science Publisher BV: North-
Holland, Amsterdam, the Netherlands)
Domencich, T, McFadden, D (1975) 'Urban travel demand: a behavioral analysis: a Charles
River Associates research study.' (North-Holland Publishing Company Limited:
Amsterdam, the Netherlands)

47
Echeverria, R, Gopinath, M, Moreira, V, Cortés, P (2009) The Export-Production Decision of
Chilean Farmers: The Case of Blueberry Producers. In 'International Association of
Agricultural Economists Beijing, China', August 16-22. Available at
http://purl.umn.edu/51025
Fairweather, J, Keating, N (1994) Goals and management styles of New Zealand farmers.
Agricultural Systems 44, 181-200.
Fawaz, J, Vallejos, R (2011) Calidad de vida, ocupación, participación y roles de género: un
sistema de indicadores sociales de sostenibilidad rural (Chile). Cuadernos de Desarrollo
Rural 8, 45-68.
Fleming, D, Abler, D (2013) Does agricultural trade affect productivity? Evidence from
Chilean farms. Food Policy 41, 11-17.
Foltz, J (2004) Entry, exit, and farm size: Assessing an experiment in dairy price policy.
American Journal of Agricultural Economics 86, 594-604.
Gale, H (1994) Longitudinal Analysis of Farm Size over the Farmer's Life Cycle. Review of
Agricultural Economics 16, 113-123.
Gale, H (2003) Age-Specific Patterns of Exit and Entry in U.S. Farming, 1978-1997. Review of
Agricultural Economics 25, 168-186.
Gasson, R, Crow, G, Errington, A, Hutson, J, Marsden, T, Winter, D (1988) The farm as a
family business: a review. Journal of Agricultural Economics 39, 1-41.
Glauben, T, Tietje, H, Weiss, C (2006) Agriculture on the move: Exploring regional differences
in farm exit rates in Western Germany. Jahrbuch für Regionalwissenschaft 26, 103-118.
Goetz, S, Debertin, D (2001) Why farmers quit: A county-level analysis. American Journal of
Agricultural Economics 83, 1010-1023.
Hellman, C (1997) Job Satisfaction and Intent to Leave. The Journal of Social Psychology 137,
677-689.
Hennessy, T, Rehman, T (2008) Assessing the impact of the ‘decoupling’ reform of the
Common Agricultural Policy on Irish farmers’ off-farm labour market participation
decisions. Journal of Agricultural Economics 59, 41-56.
Henning, C, Zarnekow, N, Kaufmann, P (2013) Understanding rural migration in industrialised
countries: the role of heterogeneity, amenities and social networks. European Review of
Agricultural Economics 40, 95-120.
Hoetker, G (2007) The use of logit and probit models in strategic management research:
Critical issues. Strategic Management Journal 28, 331-343.
Huffman, W, Feridhanusetyawan, T (2007) Migration, Fixed Costs, and Location-Specific
Amenities: A Hazard Analysis for a Panel of Males. American Journal of Agricultural
Economics 89, 368-382.
INDAP (2013a) '50 años de INDAP.' Available at http://www.indap.gob.cl/historia-de-
exito/50-anos-de-indap

Chapter 2 FACTORS INFLUENCING THE STAY-EXIT DECISION
48
INDAP (2013b) 'Comprometidos con el Mundo Rural, Programas de fomento 2010-2014.'
(Instituto de Desarrollo Agropecuario – INDAP, Ministerio de Agricultura, Gobierno de
Chile: Santiago, Chile)
INDAP, 2014. Resolución No 2469, Convenio Marco INDAP-PRODEMU Instituto de Desarrollo
Agropecuario – INDAP, Ministerio de Agricultura, Gobierno de Chile, Santiago, Chile.
INE, 2007. VII Censo Nacional Agropecuario y Forestal. Instituto Nacional de Estadística – INE,
Gobierno de Chile, Santiago, Chile.
Karakaya, F (2000) Market exit and barriers to exit: Theory and practice. Psychology and
Marketing 17, 651-668.
Kuehne, G (2013) My decision to sell the family farm. Agriculture and Human Values 30, 203-
213.
Lerdon, J, Muñoz, C, Moreira, V (2010) Productive and economic characterization of medium
and large dairy farmers of southern Chile. Idesia (Chile) 28, 41-49.
Lobley, M, Errington, A, McGeorge, A, Millard, N, Potter, C, 2002. Implications of changes in
the structure of agricultural businesses. Devon, UK.
Louviere, J, Hensher, D, Swait, J, Adamowicz, W (2000) 'Stated choice methods: analysis and
applications.' (Cambridge University Press: Cambridge, UK)
MINAGRI, 1990. Ley Orgánica del Instituto de Desarrollo Agropecuario, Ministerio de
Agricultura – MINAGRI. Santiago, Chile.
Moreira, V, Bravo-Ureta, B (2010) Technical efficiency and metatechnology ratios for dairy
farms in three southern cone countries: a stochastic meta-frontier model. Journal of
Productivity Analysis 33, 33-45.
Neyman, J (1934) On the Two Different Aspects of the Representative Method: The Method
of Stratified Sampling and the Method of Purposive Selection. Journal of the Royal
Statistical Society 97, 558-625.
Oyarzún, E, Miranda, B (2011) La economía rural en Chile: entre la pobreza y el desarrollo.
Estudios de Economía Aplicada 29, 31-56.
Pietola, K, Väre, M, Oude Lansink, A (2003) Timing and type of exit from farming: Farmers'
early retirement programmes in Finland. European Review of Agricultural Economics 30,
99-116.
Polson, R, Spencer, D (1991) The technology adoption process in subsistence agriculture: The
case of cassava in Southwestern Nigeria. Agricultural Systems 36, 65-78.
Pushkarskaya, H, Vedenov, D (2009) Farming exit decisions by age group: Analysis of tobacco
buyout impact in Kentucky. Journal of Agricultural and Applied Economics 41, 653-662.
Raggi, M, Sardonini, L, Viaggi, D (2013) The effects of the Common Agricultural Policy on exit
strategies and land re-allocation. Land Use Policy 31, 114-125.
Ramírez, E, Berdegué, J, Caro, J, Frigolett, D (2001) Estrategias de generación de ingresos de
hogares rurales en zonas de concentración de pobreza entre 1996 y 2000. In

49
'Estrategias para la superación de la pobreza rural: Visión desde distintas experiencias,
CEPAL. Naciones Unidas', July. Available at http://www.rimisp.org/wp-
content/uploads/2013/11/0127-000887-estrategiassecanopanel.pdf
Rettig, K (1993) Problem-Solving and Decision-Making as Central Processes of Family Life.
Marriage & Family Review 18, 187-222.
Rosenbaum, D, Lamort, F (1992) Entry, barriers, exit, and sunk costs: an analysis. Applied
Economics 24, 297-304.
Schaber, P, Stum, M (2007) Factors Impacting Group Long-Term Care Insurance Enrollment
Decisions. Journal of Family and Economic Issues 28, 189-205.
Smith, R, Moreira, V, Latrille, L (2002) Caracterización de sistemas productivos lecheros en la
X región de Chile mediante análisis multivariable. Agricultura Tecnica 62, 375-395.
Tauer, LW (2001) Input aggregation and computed technical efficiency. Applied Economics
Letters 8, 295-297.
Trauger, A, Sachs, C, Barbercheck, M, Kiernan, N, Brasier, K, Schwartzberg, A (2010) The
Object of Extension: Agricultural Education and Authentic Farmers in Pennsylvania.
Sociologia Ruralis 50, 85-103.
Veall, M, Zimmermann, K (1996) Pseudo-R2 measures for some common limited dependent
variable models. Journal of Economic Surveys 10, 241-259.
Vera, M, Moreira, V (2009) Caracterización de la microempresa agrícola del sur de Chile.
Idesia (Chile) 27, 89-99.
Vera, R (2006) Country Pasture/Forage Resource Profiles CHILE, Country Pasture Profiles,
Food and Agriculture Organization of the United Nations – FAO. Food and Agriculture
Organization of the United Nations – FAO, Rome, Italy. Available at
http://www.fao.org/ag/agp/AGPC/doc/Counprof/PDF%20files/Chile-English.pdf
http://www.fao.org/ag/agp/AGPC/doc/Counprof/Chile/cile.htm#10.
Verbeek, M (2012) 'A guide to modern econometrics.' (John Wiley & Sons, Ltd.: Chichester,
UK)
Wooldridge, J (2012) 'Introductory econometrics: A modern approach.' (Cengage Learning:
Michigan, USA)
Zhan, J, Wu, Y, Zhang, X, Zhou, Z (2012) Why do farmers quit from grain production in China?
Causes and implications. China Agricultural Economic Review 4, 342-362.
Zollinger, B, Krannich, R (2002) Factors Influencing Farmers' Expectations to Sell Agricultural
Land for Non-Agricultural Uses. Rural Sociology 67, 442-463.


Chapter 3
FACTORS AFFECTING FARM TECHNICAL EFFICIENCY OF SMALL
LIVESTOCK FARMERS IN SOUTHERN CHILE
L. M. Carter Leal, A.G.J.M. Oude Lansink, H.W. Saatkamp
Submitted to a peer reviewed international journal

Chapter 3 FACTORS AFFECTING FARM TECHNICAL EFFICIENCY
52
Abstract
Public efforts to make small Chilean farmers competitive in world markets have
increased during recent years, but have been hindered by the lack of knowledge about the
technical efficiency (TE) with which farmers operate and the effect of external variables on
TE. As a result a declining number of farmers and an aging rural population are observed.
This study was aimed to cover this lack of knowledge to support public efforts to improve the
competitiveness of farmers and stop the continuing decrease of the rural population. We
performed a data envelopment analysis to estimate the TE, followed by a truncated
regression to identify external variables affecting TE of 147 small livestock farmers in
southern Chile. The results showed that farmers could reduce their input use by 30% and still
produce the same level of output (TE=0.70). These farmers demonstrated to be as efficient
(37.4% fully efficient) as farmers from developed countries. However, a large percentage
(69%) of them could gain efficiency by increasing the size of the operation. Results suggested
that rural policy programs should consider off-farm income, farmer participation in a
cooperative, farmer age, family size, family labor, and distance as key external variables to
improve the competitiveness of these farmers. This is a pioneer study in Chile, which
provides empirical evidence of the effect of external variables on the performance of small
livestock farmers in southern Chile. Moreover, this study offers findings that are useful for
the design and development of new rural policies or programs.
Keywords: data envelopment analysis DEA, small farmers, technical efficiency, truncated
regression.

53
3.1 Introduction
During the last four decades, Chile has developed an ambitious agricultural policy to
open the country to global trade (Fleming and Abler 2013). As a result, the number of
international agreements has doubled and international trade has increased (DIRECON
2014). During the same period, the rural population decreased by more than 20%
(WorldBank 2015); in the last decade alone, a decline of up to 40% has been observed in
some areas (Oyarzún and Miranda 2011). This decrease in rural population has meant that
farms are currently managed mainly by farmers aged 54 and older (Apey and López 2011).
Similar changes in the rural population are observed worldwide (Chang et al. 2011; Raggi et
al. 2013).
The Agricultural Development Institute (INDAP) of Chile aims to make small farmers1
more competitive in world markets and to reduce the income gap between rural and urban
areas, mainly by consolidating and expanding existing businesses in rural areas (MINAGRI
1990; INDAP 2013a). INDAP investment in rural areas has increased by 65% during the last
five years (INDAP 2013b). However, this investment has been insufficient to make small
farmers more competitive and stop the continuing decrease in the rural population.
Farmers can become more competitive in world markets by increasing the efficiency
with which they produce (Fried et al. 2008). This efficiency may be affected by variables,
such as farm-specific conditions and socio-economic characteristics of farmers and their
families (Pushkarskaya and Vedenov 2009). Specifically, the efficiency may also correlate
with the farmer’s motivation to continue farming. In general, the motivation to continue
farming depends on urban growth, economic and non-economic rewards from farming
(Zollinger and Krannich 2002). If the farmer’s motivation to continue farming is negatively
associated with the efficiency with which the farmer operates, then government investments
that aim to keep farmers in business are less likely to be successful and there is a need to
focus on improving the motivation of farmers to stay in business.
Efficiency can be expressed in terms of technical efficiency (TE) and scale efficiency
(SE). It is mainly explained by the use of the proper combination of inputs in relation to the
outputs produced. However, other variables, which are neither inputs nor outputs, have also
been shown to influence farm efficiency (Simar and Wilson 2015). Researchers have
analyzed the influence of many variables: presence of off-farm income, cooperative
participation, buildings, distance between the farm and the nearest city, farmer age,
education level, gender, family size, and family labor (Bragg and Dalton 2004; Latruffe et al.
2005; Pushkarskaya and Vedenov 2009; Uzmay et al. 2009; Kelly et al. 2012). The variables
1 To receive this assistance, the farm’s size must not exceed 12 equivalent irrigated hectares (HRB) and the farmer’s
main income must be provided by farming (MINAGRI, 1990). A HRB is a measurement unit that uses soil and climate
variables to establish a production potential equivalent throughout the country.
Chapter 3 FACTORS AFFECTING FARM TECHNICAL EFFICIENCY
54
most frequently used in Latin America are farmer education and experience, contacts with
extension, access to credit, and farm size (Bravo-Ureta and Pinheiro 1993). For Chile, von
Cramon-Taubadel and Saldias (2014) found that the age and education of the farmer and the
share of on-farm income influence farm efficiency.
The existing literature shows that there is potential to improve the TE of Chilean
farmers, either by reducing inputs while keeping outputs constant or by increasing outputs
while keeping input levels constant. However, none of the studies have analyzed the effect
of external variables, such as characteristics of the farmer and family or the effect of the
farmer’s motivation to continue farming on the TE with which a farmer operates.
The objective of this paper is twofold. First, to estimate the TE of small livestock
farmers in three regions in southern Chile. Second, to determine the effect on TE of a set of
external variables, i.e., farm characteristics and socio-economic characteristics of farmers
and their families. Specifically, the impact of the farmer’s motivation to stay in business on
TE is explored. The results of this study can be used by policy makers in Chile to design
programs that are more effective in achieving the goal of improving small farm
competitiveness and reducing the income gap between rural and urban populations. The
remainder of this paper is structured as follows: material and methods are presented in
Section 2, results and discussion in section 3, and main conclusions and policy implications in
Section 4.
3.2 Materials and methods
3.2.1 Questionnaire and data set
We designed a questionnaire to identify the main variables driving the stay-exit
decision of the farm business. It included variables from the three main theories used to
explain the reasons for exiting farming, i.e., efficiency theory, exit barrier theory, and life-
cycle theory. Efficiency theory has been recognized as the main theory explaining this
phenomenon, whereas the other two have served as auxiliary theories that motivate
variables that are not covered by efficiency theory (Pushkarskaya and Vedenov 2009). The
data collected in this questionnaire was used to estimate the TE of farmers (i.e. inputs and
outputs) and to identify the external variables, which may explain differences in TE between
farmers.
The questionnaire was applied to 212 farmers located in three regions. They were
selected from a population that is registered with the INDAP Regional Office. Farmers were
surveyed by their own agricultural advisors. We received complete responses from 147
farms (response rate 69.3%), which is sufficiently large to conduct the efficiency analysis and

55
for statistical inference (Dyson et al. 2001). The data set was corrected for outliers2 (Kapelko
et al. 2015).
3.2.2 Study area
We conducted this study in three administrative regions in southern Chile: La
Araucanía, Los Ríos, and Los Lagos (see Figure 3.1).
Figure 3.1. Geographic location of the study area.
2 An observation was defined as an outlier if the ratio of output to any of the five inputs was outside the interval of
the median plus and minus two standard deviations. This method of outlier detection is an adaptation of the basic
threshold statistical rule for the specific context of efficiency analysis using DEA.
Chapter 3 FACTORS AFFECTING FARM TECHNICAL EFFICIENCY
56
These regions cover 24% of the total land used for livestock and forestry in Chile, but
account for 49% of all livestock and forestry farms. Sixty percent of bovine producers are
situated in these regions, who are managing 63% of all beef cattle and 91% of all dairy cows
(INE 2007). Forty-five percent of the total number of INDAP beneficiaries are located in these
three regions (INDAP 2013b). Farm sizes range from 10 to 200 ha of land with 0.62 to 1.16
AU3/ha. Feeding is either solely from pastures, or in combination with supplementary
concentrates. The coexistence of small farms (focused on timber logging, livestock breeding,
and small-scale cultivation of cereals and potatoes) with larger and more entrepreneurial
farms is common in this area (Vera 2006). We chose this survey area because one of the
participating research centers is located here, allowing access to the names and addresses of
farmers, particularly INDAP beneficiaries.
3.2.3 Analyses
The Data Envelopment Analysis (DEA) approach
DEA is a nonparametric method that has been widely applied to examine the efficiency
of individual decision-making units (DMU) in a variety of industries (Heinrichs et al. 2013). Its
nonparametric nature enables the analyst (i) to avoid having to make assumptions about the
distribution of the data, (ii) to estimate the production function with minimal prior
assumptions, and (iii) to analyze simultaneously multiple input/output technologies to
account for interactions affecting efficiency (Heinrichs et al. 2013). DEA measures efficiency
relative to an estimate of the true (but unobserved) production frontier (Simar and Wilson
2007). Firms lying on the frontier are fully efficient, whereas those away from the frontier
are considered inefficient. A technically inefficient producer could produce the same outputs
using a lower quantity of at least one input, or could use the same inputs to increase the
quantity of at least one output (Fried et al. 2008).
DEA estimates can be obtained under the assumption that the frontier satisfies either
constant return to scale (CRS) or variable returns to scale (VRS). Under CRS, an increase in
input will lead to a proportional increase in output, whereas VRS allows the heterogeneity
among the firms in the sample to be taken into consideration (Assaf and Matawie 2010). In
addition to the returns-to-scale assumption, DEA requires choosing an input orientation or
output orientation. An input-oriented efficiency measure reflects by how much inputs can be
reduced while maintaining a constant level of output, whereas an output-oriented efficiency
measure reflects by how much output can be increased while keeping the level of inputs
constant (Thanassoulis et al. 2008).
3 AU: Animal Unit is a standard unit used in calculating the relative grazing impact of different kinds and classes of
livestock. It is defined as the amount of forage consumed by a 1,000 pound (454 kg) mature cow, either dry or with
a calf of up to 6 months of age, with a daily dry matter forage requirement of 26 pounds (11.8 kg).

57
, min ,
i
efficiency VRS
efficiency CRS (SE) efficiency Scale
In this study, we applied DEA to a sample of livestock producers. We assumed VRS and
an input orientation, because farms in the sample are heterogeneous and because they can
more easily contract their input use. The input-oriented DEA model under VRS can be
formulated as:
(3.1)
subject to:
0
1'
0
0
N
Xx
Yy
i
i
where θ is a scalar and λ is a N x 1 vector of ones, yi is the observed output vector, Y is an M x
N output matrix, xi is the observed input vector, and X is a K x N input matrix. The value of θi
obtained is the TE score for the i-th firm. The model in (3.1) is solved for each firm
separately; hence a measure of θi is obtained for each firm. A measure of θi = 1 indicates that
the farm is completely technically efficient and lies on the production frontier. Thus, 1 – θi
measures how much farm i’s input can be proportionally reduced without any loss in output.
The restriction 1' N has been introduced to impose VRS. Excluding this constraint implicitly
imposes CRS.
The VRS estimate is considered as the pure technical input efficiency of a DMU because
it is net of any impact from scale size. As the size of the firm influences the average product
of a DMU, the SE is used to indicate the distance of the current scale size of a DMU from its
“most productive scale size” (Thanassoulis et al. 2008). SE is defined as:
(3.2)
The SE of a DMU shows the scale adjustment, which is necessary to achieve optimal
efficiency. Hence, SE gives a better insight in the structural adjustment needed
(Galanopoulos et al. 2006). The optimal scale size is the size at which the firm achieves CRS.
From a managerial decision-making viewpoint, a DMU operating at a point where increasing
returns to scale (IRS) holds can increase its scale size, because the additional inputs required
are more than compensated for by the increase in output levels. On the other hand, a DMU
operating at a point where decreasing returns to scale (DRS) holds should decrease its scale

Chapter 3 FACTORS AFFECTING FARM TECHNICAL EFFICIENCY
58
size (Thanassoulis et al. 2008). To identify the location of a DMU in relation to the efficiency
frontier we used the method proposed by Färe et al. (1985)4.
As DEA by itself neither determines the accuracy of the efficiency estimates nor
provides a statistical foundation for the estimated frontier (Assaf and Matawie 2010), we
have included the bootstrap procedure as introduced by Simar and Wilson (1998, 2000). This
nonparametric approach gives reasonable approximations for correcting the bias of the
efficiency estimates (resulting from the fact that the efficiency scores in DEA are not
observed but instead are replaced by biased estimators that are not independent (Simar and
Wilson 2015)) and for building confidence intervals (CI) for the efficiency of any fixed point
(xi,yi). To date, bootstrap methods are the only viable alternative for making statistical
inference on θi and for providing decision makers with a technique for attaching precision
and greater confidence to the efficiency analysis, which may form the basis of important
decisions (Simar and Wilson 2015). This method incorporates two important assumptions:
heterogeneity in the distribution of inefficiency, and separability between the production set
and the covariates (Simar and Wilson 2007; Singbo and Oude Lansink 2010).
The second-stage regression
Efficiency analysis commonly has two components: (i) estimation of the benchmark
frontier as a reference for performance evaluation of DMUs and (ii) identification of variables
determining differences between farmers, i.e. external variables. These variables are neither
inputs nor outputs and are typically not under the control of the manager, although they
may influence the production process (Simar and Wilson 2015). The literature describes a
wide range of methods to introduce external variables into the analysis of the production
process (Simar and Wilson 2007). However, Simar and Wilson (2011b) propose that only two
methods are well-defined, statistically coherent, and meaningful: (i) truncated regression
and (ii) ordinary least squares regression. As DEA efficiency estimates are truncated at one
by construction (Simar and Wilson 2015), we used a truncated regression model to
determine the variables explaining differences in TE between the livestock farmers in our
sample.
4 This method requires three efficiency estimates: CRS, VRS, and NIRS, all of them related to technological returns-
to-scale specifications. The location of a DMU in relation to the efficiency frontier is determined as following:
- If the CRS, VRS, and NIRS models yield exactly the same efficiency measure, then the unit lies, or is projected,
on a boundary region exhibiting local CRS.
- If the CRS and NIRS efficiency measures are both equal and lower than the VRS efficiency measure, then the
unit lies, or is projected, on an IRS region of the boundary.
- If VRS and NIRS efficiency measures are both equal and higher than the CRS efficiency measure, then the unit
lies, or is projected, on a DRS region of the boundary.
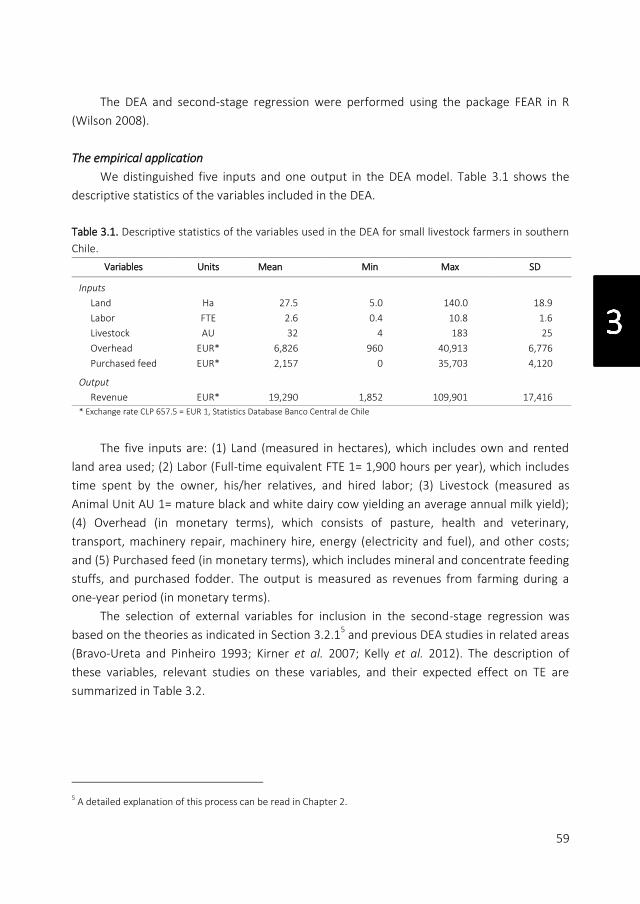
59
The DEA and second-stage regression were performed using the package FEAR in R
(Wilson 2008).
The empirical application
We distinguished five inputs and one output in the DEA model. Table 3.1 shows the
descriptive statistics of the variables included in the DEA.
Table 3.1. Descriptive statistics of the variables used in the DEA for small livestock farmers in southern
Chile.
Variables Units Mean Min Max SD
Inputs
Land Ha 27.5 5.0 140.0 18.9
Labor FTE 2.6 0.4 10.8 1.6
Livestock AU 32 4 183 25
Overhead EUR* 6,826 960 40,913 6,776
Purchased feed EUR* 2,157 0 35,703 4,120
Output
Revenue EUR* 19,290 1,852 109,901 17,416
* Exchange rate CLP 657.5 = EUR 1, Statistics Database Banco Central de Chile
The five inputs are: (1) Land (measured in hectares), which includes own and rented
land area used; (2) Labor (Full-time equivalent FTE 1= 1,900 hours per year), which includes
time spent by the owner, his/her relatives, and hired labor; (3) Livestock (measured as
Animal Unit AU 1= mature black and white dairy cow yielding an average annual milk yield);
(4) Overhead (in monetary terms), which consists of pasture, health and veterinary,
transport, machinery repair, machinery hire, energy (electricity and fuel), and other costs;
and (5) Purchased feed (in monetary terms), which includes mineral and concentrate feeding
stuffs, and purchased fodder. The output is measured as revenues from farming during a
one-year period (in monetary terms).
The selection of external variables for inclusion in the second-stage regression was
based on the theories as indicated in Section 3.2.15 and previous DEA studies in related areas
(Bravo-Ureta and Pinheiro 1993; Kirner et al. 2007; Kelly et al. 2012). The description of
these variables, relevant studies on these variables, and their expected effect on TE are
summarized in Table 3.2.
5 A detailed explanation of this process can be read in Chapter 2.

Chapter 3 FACTORS AFFECTING FARM TECHNICAL EFFICIENCY
60
Table 3.2. Variables included in the second-stage regression, previous studies on these variables, and
their expected effect on TE.
Variables Description Relevant studies* Theoretically
expected effect†
Variables related to efficiency theory
Offincrel Dummy for importance of off-
farm income (1 if yes, 0 if no)
Bahta and Malope (2014), Bragg and
Dalton (2004), Goetz and Debertin
(2001), Kelly et al. (2012)
-
Cooperatives Dummy for participation in
cooperatives (1 if yes, 0 if no)
Kelly et al. (2012), Uzmay et al. (2009) +
Variables related to exit barrier theory
Building Number of buildings Goetz and Debertin (2001), Hansson
(2007)
-
Distance Distance to the nearest city
(in kilometers)
Bahta and Malope (2014) -
Variables related to life-cycle theory
Age Farmer’s age Bahta and Malope (2014), Kelly et al.
(2012), Kirner et al. (2007),
Pushkarskaya and Vedenov (2009),
Uzmay et al. (2009), von Cramon-
Taubadel and Saldias (2014)
+
Schooling Years of formal education of
the farmer
Avilez et al. (2010), Bahta and Malope
(2014), Bragg and Dalton (2004),
Kirner et al. (2007), Uzmay et al.
(2009), von Cramon-Taubadel and
Saldias (2014)
+/-
Agrieduc Dummy for farmer with
agricultural education (1 if
yes, 0 if no)
+/-
Nonagrieduc Dummy for farmer with non-
agricultural education (1 if
yes, 0 if no)
+/-
Female Dummy for farmer's gender
(1 if female, 0 if male)
Bahta and Malope (2014), Dhungana
et al. (2004)
+
Famsize Number of people living at
the farm
Hansson (2007), Latruffe et al. (2005),
Uzmay et al. (2009), Zollinger and
Krannich (2002)
+
Famlab Dummy for presence of
family labor (1 if yes, 0 if no)
+
Successor Dummy for presence of
successor (1 if yes, 0 if no)
+
Staydec Dummy for motivation to stay
on farm (1 if yes, 0 if no)
Zollinger and Krannich (2002) +
* The most relevant for this study are mentioned (available literature is broader).
† The symbols (+) and (-) must be taken as a positive and negative expected effect on TE, respectively.

61
The logic behind the selection of the variables is supported by previous researches as
follows. For example, from efficiency theory, we included Offincrel because it serves as a
source of finance for maintaining a farm when there is low farm income or losses. This
variable could reduce the efficiency of the farm due to a redistribution of the farmer labor in
favor of off-farm activities (Bragg and Dalton 2004). Hence, we expected Offinrel to have a
negative effect on TE.
3.3 Results and discussion
3.3.1 DEA results
The results of the DEA models, i.e. the original TE estimates, the bias-corrected TE
estimates, and the estimated confidence interval (CI) under VRS are presented in Figure 3.2.
0.00
0.10
0.20
0.30
0.40
0.50
0.60
0.70
0.80
0.90
1.00
1 21 41 61 81 101 121 141
Effi
cie
ncy
le
vel
Quantity of farms
Original TE estimates
Bias-corrected TE estimates
Lower bound CI
Upper bound CI
Figure 3.2. DEA efficiency estimates, bias-corrected efficiency estimates, and confidence intervals (CI)
for the DMUs under VRS.
Figure 3.2 shows the sample observations ordered by their bias-corrected TE score
(represented by diamonds). The original TE estimates for each farm are depicted as circles,
and their 95% CI are represented by the lower dashed line and the upper solid line. The
original TE estimates are not included in this interval, which is in line with the theory behind

Chapter 3 FACTORS AFFECTING FARM TECHNICAL EFFICIENCY
62
the CI construction (Gocht and Balcombe 2006). The original TE estimates for farms are by
definition larger than the bias-corrected TE estimates. Therefore, the estimated bias is
negative. Among the observations, which were originally efficient, the lower boundary for
the estimated 95% CIs ranges from 0.62 to 0.86. The estimated CIs for the less efficient
farms are narrower than those for the more efficient ones, which indicates that the bias is
bigger for the more efficient farms. This is expected, as many sample observations under VRS
will have efficiency estimates equal to unity (Simar and Wilson 2011a). Our results confirm
that the bootstrap procedure is useful for eliminating the bias from the original efficiency
estimates, which is particularly important for the subsequent regression analysis. The CI of
the TE estimates allow us to infer that identification of less efficient farms is easier than
identification of more efficient farms, which is consistent with previous studies (Gocht and
Balcombe 2006). This finding is an advantage for getting efficiency improvements. Because
the TE estimates are measured with less noise in less efficient farms, any intervention should
have a bigger impact on these farms, which in turn also improves the TE in agriculture as a
whole.
Table 3.3 shows descriptive statistics of the original and bias-corrected efficiency
estimates, and the SE for the DMU. For both TE and SE the maximum score was unity,
therefore only minima are reported.
Table 3.3. Descriptive statistics of the original and bias-corrected technical efficiency (TE) estimates,
and scale efficiency (SE) estimates for the DMU.
Descriptive statistic TE Bias-corrected TE SE
Mean 0.80 0.70 0.80
SD 0.21 0.17 0.22
Min 0.34 0.31 0.23
Share of fully efficient farms 0.37 0.31 0.17
Table 3.3 indicates that, on average, these farms have a TE score of 0.80. This value is
consistent with TE levels found in literature, for Chile and other countries, which mostly vary
from 0.66 to 0.92 (Bravo-Ureta and Pinheiro 1993; Fraser and Cordina 1999; Arzubi and
Berbel 2001; Moreira et al. 2006). The TE we found for small livestock farmers in southern
Chile is within the (in)efficiency range found in other countries; it indicates that farms could
reduce their inputs by 20% and still produce the same level of output. The percentage of
farms with a score of unity (fully efficient farms) was 37% (55 farms). This is consistent with
the 35% of fully efficient farms reported for Turkey and Australia (Fraser and Cordina 1999;
Candemir and Koyubenbe 2006). This share is in between the 24% of fully efficient farms
reported for Austria (Kirner et al. 2007) and the 52% reported for Argentina (Arzubi and
Berbel 2001). The percentage of efficient farms we found indicates that small livestock
farmers in Chile are as efficient as farmers in developed countries. However, compared with

63
the value reported in Argentina, there is still potential for increasing the number of efficient
farms. Table 3.3 also shows that, following the bootstrap procedure, the average TE
decreased from 0.80 (original TE) to 0.70 (bias-corrected TE). The bias-corrected TE indicates
that farmers could reduce their inputs by 30% and still produce the same level of output.
We found a mean SE of 0.80 (Table 3.3). This value is lower than the 0.89 reported for
Austria (Kirner et al. 2007) and the 0.94 reported for Argentina (Arzubi and Berbel 2001).
This finding indicates that, on average, the farms can reduce their input use by 20% by
producing at an optimal scale, i.e. a scale where they operate under CRS. The percentage of
farms with a score of unity for scale efficiency was 17% (25 farms). This value is consistent
with the 14% reported for Argentina (Arzubi and Berbel 2001) and the 15% reported for
Austria (Kirner et al. 2007).
Table 3.4 shows the number and the percentage of farms operating under increasing
returns to scale (IRS), constant returns to scale (CRS), and decreasing returns to scale (DRS).
Table 3.4. Farms operating under increasing returns to scale (IRS), constant returns to scale (CRS), and
decreasing returns to scale (DRS).
Operating scale n of farms % of farms
Increasing returns to scale (IRS) 102 69
Constant returns to scale (CRS) (scale efficient) 25 17
Decreasing returns to scale (DRS) 20 14
Results in Table 3.4 indicate that most farms in the sample operated under IRS (69% =
102 farms). Only 17% (25 farms) of the farms were operating at the optimal scale size (CRS),
and a similar percentage (14% = 20 farms) were operating under DRS. Our finding is
consistent with values reported for Chile (Moreira et al. 2006; von Cramon-Taubadel and
Saldias 2014), and other countries (Fraser and Cordina 1999). These findings indicate that
the scale at which most farms were operating was too small (IRS), therefore these farms can
gain efficiency by increasing the size of the operation (Assaf and Matawie 2010). Moreover,
farms operating under DRS could gain efficiency by decreasing in size.
3.3.2 Second-stage regression results
Table 3.5 shows the descriptive statistics of the variables we used in this study to
explain differences between the TE of farms (columns 2 and 3). It also shows the results for
the truncated second-stage regression (columns 4 to 6).

Chapter 3 FACTORS AFFECTING FARM TECHNICAL EFFICIENCY
64
Table 3.5. Descriptive statistics and truncated second-stage regression estimates of the variables used
in the empirical model to explain differences in the efficiency of farms.
Descriptive statistics Truncated second-stage regression
Independent variables Mean (SD) β-hat se t-stat*
Variables related to efficiency theory
Offincrel† 0.38 (0.49)
-0.612 0.216 -2.837
Cooperatives‡ 0.51 (0.50)
-0.681 0.235 -2.898
Variables related to exit barrier theory
Building 2.95 (1.16)
0.124 0.082 1.500
Distance‡ 21.82 (17.15)
0.022 0.008 2.680
Variables related to life-cycle theory
Age† 57 (11.90)
-0.013 0.005 -2.435
Schooling 10 (3.13)
0.009 0.027 0.320
Agrieduc 0.44 (0.50)
0.199 0.219 0.908
Nonagrieduc 0.21 (0.41)
0.513 0.285 1.803
Female†‡ 0.19 (0.39)
0.193 0.256 0.753
Famsize‡ 2.47 (1.81)
-0.117 0.048 -2.422
Famlab† 0.34 (0.48)
-0.698 0.221 -3.154
Successor 0.58 (0.50)
-0.003 0.199 -0.013
Staydec 0.56 (0.50) -0.163 0.205 -0.795 *t-stat value >1.96 (2.37) implies 5(1)% significance level †Significant for comparison between exit-farmers and stay-farmers in previous chapter
‡Significant for Probit model in previous chapter
Table 3.5 shows that 38% of the farmers in the sample indicated that off-farm income
(Offincrel) is important for making a living from farming. It also shows that half of the farmers
are members of a cooperative (Cooperatives), and indicates that the average distance from
the farm to the nearest city is 22 km. The average age of the farmers is 57, the average
family size is 2.5 members, and an average of only 0.34 family members work at the farm.
Six of the thirteen variables have a significant effect on the technical efficiency level (in
bold in Table 3.5). Off-farm (Offincrel) income has negative and significant relation with TE,
which is consistent with our a priori expectations. This finding is also consistent with both
Bragg and Dalton (2004) and Goetz and Debertin (2001), who indicated that off-farm
activities could negatively affect the TE of a farm due to a redistribution of farm labor in
favor of off-farm activities. Also, this may imply that farmers working off-farm have to hire
replacements who may not be as committed as the farmer to use of inputs efficiently
(Latruffe 2010). This finding supports the argument of Jaime and Salazar (2011), who
indicated that Chilean farmers view off-farm employment as a complement to their farm
income, rather than a source of finance for investments in up-to-date technologies. The
farmer’s participation in a cooperative also has a negative and significant relation with TE.
This finding is not consistent with our a priori expectation and with results from previous

65
studies which found that participating in cooperatives or other kind of working/discussion
groups implies a regular transfer of knowledge that can increase TE (Bravo-Ureta and
Pinheiro 1993; O'Neill et al. 2002; Hansson 2007; Jaime and Salazar 2011; Kelly et al. 2012). It
is also not consistent with Uzmay et al. (2009), who showed that membership in a
cooperative has no relation with technical efficiency. A possible explanation for our finding is
that the economic and commercial benefits provided by a cooperative (i.e. COLUN, the only
cooperative in southern Chile) to their members reduce the incentives to operate more
efficiently.
Distance to the nearest city has a positive and significant relation with TE, which implies
that as distance increases, TE increases. This positive relation is consistent with Bahta and
Malope (2014), who found that farmers traveling long distances to sell their animals are
more efficient. This could be explained by the fact that a greater distance to the nearest city
increases opportunity costs and transport costs (Pushkarskaya and Vedenov 2009), thereby
giving a farmer an incentive to use the production potential as efficiently as possible.
Farmer age (Age) has a negative and significant relation with TE, which suggests that
older farmers are less efficient, ceteris paribus. This finding is not consistent with many
previous studies (Kelly et al. 2012; von Cramon-Taubadel and Saldias 2014) and suggests that
older farmers are more reluctant to innovate or less committed to business (as they are
mostly at or near their exit stage) (Brummer and Loy 2000; Zollinger and Krannich 2002;
Rakipova et al. 2003; Nganga et al. 2010; Jaime and Salazar 2011). In addition, older farmers
might be less energetic than younger farmers.
Family size (Famsize) has a negative and significant relation with TE, which suggests
that TE decreases with family size. This finding is not consistent with the positive relation
with TE reported for Turkey (Uzmay et al. 2009) and could indicate that a bigger family
triggers farmers to find an off-farm job to increase family income and provide them a better
condition for living, thereby distracting from on-farm work.
Family labor (Famlab) also has a negative and significant relation with TE. This finding
suggests that TE decreases as family labor increases, which is not in agreement with our
expectation or previous studies (Latruffe et al. 2005; Hansson 2007). This finding suggests
that, although family workers, as the only residual claimants, have incentives to act
efficiently (Latruffe et al. 2005); if the farm is not large enough to allow all family members
to work at farm, the marginal effect of an additional member becomes smaller or even
negative.
Other variables, such as buildings (Building), education level (Schooling, Agrieduc,
Nonagrieduc), gender (Female), successor (Successor) and stay decision (Staydec), have no
significant relation with TE. Education is often found to have a positive effect on technical
efficiency (Avilez et al. 2010; von Cramon-Taubadel and Saldias 2014), however our study
finds no significant effect. Women have become more involved in farming in the past decade

Chapter 3 FACTORS AFFECTING FARM TECHNICAL EFFICIENCY
66
(Baylina and Salamaña 2006; Trauger et al. 2010; Charatsari et al. 2013; INDAP 2014),
however our finding indicates that there is no difference ceteris paribus, in the efficiency
with which farms managed by men and women are managed. Also, Table 3.5 shows that the
presence of a successor or the motivation of the farmer to stay in business in the near future
has no significant relation with TE. This finding suggests that these variables (Successor and
Staydec) do not significantly affect the efficiency with which the farms are operated. The
research of Zollinger and Krannich (2002) suggests that farmers have no incentive to exit
farming as long as a farmer expects that his/her operation remains economically viable and
provides sufficient intrinsic rewards to farming such as: independency, doing something
worthwhile, or working out-doors. However, many variables that were significantly
correlated with the motivation to stay in business in a previous work of the authors (Carter
Leal et al. 2016) are also significantly correlated with TE. Variables for which a similar
significant effect was found are: distance, farmer’s age (square), and family size. In contrast,
a significant positive effect of participation in a cooperative on the motivation to stay in
farming was found, whereas this variable is negatively associated with TE. Further similarities
exist in the effects of female farmer (positive and significantly related to the stay decision
but not significantly related to TE), schooling (positively related to both the stay decision and
TE) and presence of a successor (negatively related to both the stay decision and TE).
3.4 Conclusions and policy implications
This paper provides empirical evidence of the effect of external variables on the farm
performance of small livestock farmers in southern Chile. To our knowledge, this is the first
study in Chile that (1) uses a nonparametric approach to analyze the TE of small livestock
farmers, (2) followed by a truncated second-stage regression to identify the effect of
external variables on TE.
Our results highlight the potential role of DEA as a tool to support decisions of farmers
and policy makers. The efficiency estimates we obtained using the DEA approach are in line
with previous findings, where a similar potential for performance improvements in farms
were found (mainly through parametric approaches). Hence, DEA is confirmed as a useful
technique to identify the TE of farms with minimal prior assumptions and allowing for
multiple input/output technologies.
The efficiency measures found in our study show that it is possible to increase the TE of
these farms. The results show two options for increasing the TE of small livestock farmers.
Firstly, by decreasing the use of inputs, i.e., land, labor, livestock, overhead, and purchased
feed. Secondly, by improving scale efficiency, i.e., increasing the size of the operation. Both
options would be beneficial for productivity.

67
The truncated second-stage regression analysis indicated that distance is positively
related with TE, whereas off-farm income, cooperative participation, farmer age, family size,
and family labor were negatively related with TE. Because of differences in methods and
input-output variables it is not possible to determine how much better or worse Chilean
small livestock farms are compared to farms in other countries. The motivation of farmers to
stay in business was not significantly related with the TE of farms.
This study provides improved information about the true level of efficiency, and can
assist either decision makers or policy makers to take the appropriate corrective actions to
improve the future of small livestock farms. Future research could focus on a more detailed
level. Areas for further research could include: investigating the role of off-farm income and
the analysis of the efficiency of the use of specific inputs such as labor and land.
The insights provided by this study are useful for the design of rural policies aimed at
improving small farm competitiveness and reducing the income gap between rural and
urban populations. Our results show that the TE of small livestock farmers in southern Chile
can be improved. The external variables with a significant effect on TE should be taken into
consideration when developing new rural policies or programs. Based on the results of this
study, we suggest the following five policy recommendations.
First, it is important to identify the efficiency with which farmers operate in order to
provide effective support. Our efficiency estimates were more accurate for the most
inefficient farms. Intervention measures targeted at the most inefficient farms will be the
most effective in improving the TE because: (1) the estimates are more reliable, and also (2)
the potential gains are greater. As the marginal effect is likely to be larger for the less
efficient farmers, targeting these farmers is also the most effective way, and efficient use of
scarce (policy) resources, to improve the TE of agriculture as a whole. Second, analysis of the
possibilities for generating off-farm or undertaking non-farm activities is important. We
found a significant negative effect of off-farm income on TE. Therefore rural development
programs aimed at promoting alternatives for off-farm income, should be designed in such a
way that their negative effect on TE is reduced. Third, the results suggest that participation in
a cooperative decreases the TE of farmers. Hence, the benefits provided by a cooperative to
their members should be more focused at improving TE, i.e. technical advice, rather than
focused on protectionism, i.e. economic and commercial benefits. Fourth, a negative effect
was found for farmer’s age, which implies that rural development programs that enhance
generational transfers of the farm could improve the TE of the sector. Fifth, a negative effect
was found for the relationship between the stay decision and TE. Furthermore, the negative
relationship found in this study was insignificant. Therefore, our results do not provide
support for targeting farmer motivation rather than TE in rural policy. Sixth, rural policy
development in Chile could invest in an infrastructure that allows researchers to collect data,
which can be used for estimating the TE of individual farms. Such research could provide

Chapter 3 FACTORS AFFECTING FARM TECHNICAL EFFICIENCY
68
country-wide insights to policy makers into the factors underlying differences in the
efficiency with which farms are operated. These insights could form the foundation for the
evaluation of current, and the design of new rural development programs.

69
Acknowledgements
This research was financially supported by CONICYT (National Commission for Scientific
and Technological Research) of the Chilean Government through the BecasChile Program.
The authors would like to thank the farmers who kindly provided data for this study and the
agriculture advisors for helping with the data collection.

Chapter 3 FACTORS AFFECTING FARM TECHNICAL EFFICIENCY
70
References
Apey, A, López, I, 2011. Agricultura chilena, información social y productiva según tamaño
del productor y localización geográfica, VII Censo Nacional Agropecuario y Forestal,
2007. Oficina de Estudios y Políticas Agrarias – ODEPA, Ministerio de Agricultura,
Gobierno de Chile, Santiago, Chile.
Arzubi, AA, Berbel, J (2001) Determinación de eficiencia usando DEA en explotaciones
lecheras de Argentina. In 'IV Congreso de la Asociación Española de Economía
Agraria. Valencia, España'.
Assaf, A, Matawie, KM (2010) Improving the accuracy of dea efficiency analysis: A bootstrap
application to the health care foodservice industry. Applied Economics 42, 3547-
3558.
Avilez, JP, Escobar, P, von Fabeck, G, Villagran, K, García, F, Matamoros, R, García Martínez, A
(2010) Caracterización productiva de explotaciones lecheras empleando
metodología de análisis multivariado. Revista Científica-Facultad de Ciencias
Veterinarias 20, 74-80.
Bahta, S, Malope, P (2014) Measurement of competitiveness in smallholder livestock
systems and emerging policy advocacy: An application to Botswana. Food Policy 49,
408-417.
Baylina, M, Salamaña, I (2006) El lugar del género en la geografía rural. Boletin de la
Asociacion de Geografos Espanoles 41, 99-112.
Bragg, L, Dalton, T (2004) Factors Affecting the Decision to Exit Dairy Farming: A Two-Stage
Regression Analysis. Journal of Dairy Science 87, 3092-3098.
Bravo-Ureta, BE, Pinheiro, AE (1993) Efficiency analysis of developing country agriculture: A
review of the frontier function literature. Agricultural and Resource Economics
Review 22, 88-101.
Brummer, B, Loy, JP (2000) The technical efficiency impact of farm credit programmes: A
case study of Northern Germany. Journal of Agricultural Economics 51, 405-418.
Candemir, M, Koyubenbe, N (2006) Efficiency Analysis of Dairy Farms in the Province of Izmir
(Turkey): Data Envelopment Analysis (DEA). Journal of Applied Animal Research 29,
61-64.
Carter Leal, LM, Oude Lansink, A, Saatkamp, H, 2016. Factors influencing the stay-exit
decision of small livestock farmers: Empirical evidence from southern Chile.
Wageningen University, Wageningen, the Netherlands.
Chang, K, Langelett, G, Waugh, A (2011) Health, Health Insurance, and Decision to Exit from
Farming. Journal of Family and Economic Issues 32, 356-372.
71
Charatsari, C, Papadaki-Klavdianou, A, Michailidis, A, Partalidou, M (2013) Great
expectations? Antecedents of women farmers' willingness to participate in
agricultural education programmes. Outlook on Agriculture 42, 193-199.
Dhungana, BR, Nuthall, PL, Nartea, GV (2004) Measuring the economic inefficiency of
Nepalese rice farms using data envelopment analysis. Australian Journal of
Agricultural and Resource Economics 48, 347-369.
DIRECON (2014) 'Acuerdos Comerciales.' Available at http://www.direcon.gob.cl/acuerdos-
comerciales/#tabs-1
Dyson, RG, Allen, R, Camanho, AS, Podinovski, VV, Sarrico, CS, Shale, EA (2001) Pitfalls and
protocols in DEA. European Journal of Operational Research 132, 245-259.
Färe, R, Grosskopf, S, Lovell, C (1985) 'The measurement of efficiency of production.'
(Springer Netherlands: Amsterdam, the Netherlands)
Fleming, D, Abler, D (2013) Does agricultural trade affect productivity? Evidence from
Chilean farms. Food Policy 41, 11-17.
Fraser, I, Cordina, D (1999) An application of data envelopment analysis to irrigated dairy
farms in Northern Victoria, Australia. Agricultural Systems 59, 267-282.
Fried, HO, Lovell, CAK, Schmidt, S (2008) Efficiency and Productivity. In 'The measurement of
productive efficiency and productivity growth.' (Eds HO Fried, CAK Lovell, S
Schmidt.) (Oxford University Press: New York, USA)
Galanopoulos, K, Aggelopoulos, S, Kamenidou, I, Mattas, K (2006) Assessing the effects of
managerial and production practices on the efficiency of commercial pig farming.
Agricultural Systems 88, 125-141.
Gocht, A, Balcombe, K (2006) Ranking efficiency units in DEA using bootstrapping an applied
analysis for Slovenian farm data. Agricultural Economics 35, 223-229.
Goetz, S, Debertin, D (2001) Why farmers quit: A county-level analysis. American Journal of
Agricultural Economics 83, 1010-1023.
Hansson, H (2007) Strategy factors as drivers and restraints on dairy farm performance:
Evidence from Sweden. Agricultural Systems 94, 726-737.
Heinrichs, AJ, Jones, CM, Gray, SM, Heinrichs, PA, Cornelisse, SA, Goodling, RC (2013)
Identifying efficient dairy heifer producers using production costs and data
envelopment analysis. Journal of Dairy Science 96, 7355-7362.
INDAP (2013a) '50 años de INDAP.' Available at http://www.indap.gob.cl/historia-de-
exito/50-anos-de-indap
INDAP (2013b) 'Comprometidos con el Mundo Rural, Programas de fomento 2010-2014.'
(Instituto de Desarrollo Agropecuario – INDAP, Ministerio de Agricultura, Gobierno
de Chile: Santiago, Chile)
INDAP, 2014. Resolución No 2469, Convenio Marco INDAP-PRODEMU Instituto de Desarrollo
Agropecuario – INDAP, Ministerio de Agricultura, Gobierno de Chile, Santiago, Chile.

Chapter 3 FACTORS AFFECTING FARM TECHNICAL EFFICIENCY
72
INE, 2007. VII Censo Nacional Agropecuario y Forestal. Instituto Nacional de Estadística – INE,
Gobierno de Chile, Santiago, Chile.
Jaime, MM, Salazar, CA (2011) Participation in organizations, technical efficiency and
territorial differences: A study of small wheat farmers in Chile. Chilean Journal of
Agricultural Research 71, 104-113.
Kapelko, M, Oude Lansink, A, Stefanou, SE (2015) Analyzing the impact of investment spikes
on dynamic productivity growth. OMEGA-International Journal of Management
Science 54, 116-124.
Kelly, E, Shalloo, L, Geary, U, Kinsella, A, Thorne, F, Wallace, M (2012) The associations of
management and demographic factors with technical, allocative and economic
efficiency of Irish dairy farms. Journal of Agricultural Science 150, 738-754.
Kirner, L, Ortner, K, Hambrusch, J (2007) Using technical efficiency to classify Austrian dairy
farms. Die Bodenkultur 58, 15-24.
Latruffe, L (2010) 'Competitiveness, Productivity and Efficiency in the Agricultural and Agri-
Food Sectors.' (OECD Publishing: Paris, France)
Latruffe, L, Balcombe, K, Davidova, S, Zawalinska, K (2005) Technical and scale efficiency of
crop and livestock farms in Poland: does specialization matter? Agricultural
Economics 32, 281-296.
MINAGRI, 1990. Ley Orgánica del Instituto de Desarrollo Agropecuario, Ministerio de
Agricultura – MINAGRI. Santiago, Chile.
Moreira, VH, Bravo-Ureta, BE, Carrillo, BL, Vásquez, JA (2006) Technical efficiency measures
for small dairy farms in Southern Chile: A stochastic frontier analysis with
unbalanced panel data. Archivos de Medicina Veterinaria 38, 25-32.
Nganga, SK, Kungu, J, de Ridder, N, Herrero, M (2010) Profit efficiency among Kenyan
smallholders milk producers: A case study of Meru-South district, Kenya. African
Journal of Agricultural Research 5, 332-337.
O'Neill, S, Leavy, A, Matthews, A (2002) Measuring productivity change and efficiency on
Irish farms, Rural Economy Research Centre, Teagasc. Teagasc, Carlow, Ireland.
Available at
https://www.researchgate.net/profile/Alan_Matthews/publication/253356620_Me
asuring_Productivity_Change_and_Efficiency_on_Irish_Farms/links/54a13daa0cf25
6bf8bae6a28.pdf.
Oyarzún, E, Miranda, B (2011) La economía rural en Chile: entre la pobreza y el desarrollo.
Estudios de Economía Aplicada 29, 31-56.
Pushkarskaya, H, Vedenov, D (2009) Farming exit decisions by age group: Analysis of tobacco
buyout impact in Kentucky. Journal of Agricultural and Applied Economics 41, 653-
662.

73
Raggi, M, Sardonini, L, Viaggi, D (2013) The effects of the Common Agricultural Policy on exit
strategies and land re-allocation. Land Use Policy 31, 114-125.
Rakipova, AN, Gillespie, JM, Franke, DE (2003) Determinants of technical efficiency in
louisiana beef cattle. Journal of the ASFMRA 66, 99-107.
Simar, L, Wilson, PW (1998) Sensitivity analysis of efficiency scores: How to bootstrap in
nonparametric frontier models. Management Science 44, 49-61.
Simar, L, Wilson, PW (2000) A general methodology for bootstrapping in nonparametric
frontier models. Journal of Applied Statistics 27, 779-802.
Simar, L, Wilson, PW (2007) Estimation and inference in two-stage, semi-parametric models
of production processes. Journal of Econometrics 136, 31-64.
Simar, L, Wilson, PW (2011a) Performance of the bootstrap for DEA estimators and iterating
the principle. In 'Handbook on Data Envelopment Analysis.' (Eds W Cooper, L
Seiford, J Zhu.) pp. pp 241-271. (Springer US: New York, USA)
Simar, L, Wilson, PW (2011b) Two-stage DEA: Caveat emptor. Journal of Productivity Analysis
36, 205-218.
Simar, L, Wilson, PW (2015) Statistical Approaches for Non-parametric Frontier Models: A
Guided Tour. International Statistical Review 83, 77-110.
Singbo, A, Oude Lansink, A (2010) Lowland farming system inefficiency in Benin (West
Africa): directional distance function and truncated bootstrap approach. Food
Security 2, 367-382.
Thanassoulis, E, Portela, M, Despić, O (2008) Data Envelopment Analysis: The Mathematical
Programming Approach to Efficiency Analysis. In 'The Measurement of Productive
Efficiency and Productivity Growth.' (Eds HO Fried, C Knox, S Schmidt.) (Oxford
University Press: New York, USA)
Trauger, A, Sachs, C, Barbercheck, M, Kiernan, N, Brasier, K, Schwartzberg, A (2010) The
Object of Extension: Agricultural Education and Authentic Farmers in Pennsylvania.
Sociologia Ruralis 50, 85-103.
Uzmay, A, Koyubenbe, N, Armagan, G (2009) Measurement of efficiency using data
envelopment analysis (DEA) and social factors affecting the technical efficiency in
dairy cattle farms within the province of Izmir, Turkey. Journal of Animal and
Veterinary Advances 8, 1110-1115.
Vera, R (2006) Country Pasture/Forage Resource Profiles CHILE, Country Pasture Profiles,
Food and Agriculture Organization of the United Nations – FAO. Food and
Agriculture Organization of the United Nations – FAO, Rome, Italy. Available at
http://www.fao.org/ag/agp/AGPC/doc/Counprof/PDF%20files/Chile-English.pdf
http://www.fao.org/ag/agp/AGPC/doc/Counprof/Chile/cile.htm#10.

Chapter 3 FACTORS AFFECTING FARM TECHNICAL EFFICIENCY
74
von Cramon-Taubadel, S, Saldias, R (2014) Access to credit and determinants of technical
inefficiency of specialized smallholder farmers in chile. Chilean Journal of
Agricultural Research 74, 413-420.
Wilson, PW (2008) FEAR: A software package for frontier efficiency analysis with R. Socio-
Economic Planning Sciences 42, 247-254.
WorldBank (2015) 'Indicadores de desarrollo mundial - Población rural.' Available at
http://databank.bancomundial.org/data/views/reports/tableview.aspx#
Zollinger, B, Krannich, R (2002) Factors Influencing Farmers' Expectations to Sell Agricultural
Land for Non-Agricultural Uses. Rural Sociology 67, 442-463.

75


Chapter 4
IMPROVING COMPETITIVENESS OF SMALL LIVESTOCK FARMERS:
AN EMPIRICAL INPUT-SPECIFIC INEFFICIENCY ANALYSIS IN
SOUTHERN CHILE
L. M. Carter Leal, A.G.J.M. Oude Lansink, H.W. Saatkamp
Submitted to a peer reviewed international journal

Chapter 4 INPUT-SPECIFIC INEFFICIENCY ANALYSIS
78
Abstract
This paper analyzes the input-specific inefficiency of small livestock farmers in southern
Chile using a two-stage procedure. First, we used a nonparametric directional input distance
function to estimate the input-specific technical inefficiency with which these farmers
operate. Second, we followed a single truncated bootstrap procedure to analyze the external
factors affecting the input-specific inefficiencies. Our empirical results show that input use
can be reduced by 26% to 37%, while still obtaining the same quantity of output. Moreover,
our results show that external variables, such as farm characteristics, characteristics of the
farmer and family, farmer expectations, and government subsidies affect the efficiency of
input use. The effects of the external variables varied across inputs. The results of this paper
provide valuable information for (re)designing new rural policies or programs. The results
show that policies should consider interventions targeted to reduce inefficiency of livestock
as the most effective in improving productivity. They also show that both distance and
increasing alternative on-farm work for family members plays an important role in farm
productivity. Lastly, these results show that subsidies should be reallocated to increase
productivity.
Keywords: nonparametric directional input distance function, truncated bootstrap
regression, farm productivity, rural policy.

79
4.1 Introduction
Competitiveness is a key issue for the agricultural sector in developed and developing
countries due to its importance for economic growth and prosperity (OECD 2011; Bahta and
Malope 2014; Carayannis and Grigoroudis 2015). Domestic and regional governments are
increasingly aware of competitiveness and are developing new forms of regionally based
policy interventions to enhance productivity growth (OECD 2011; Gardiner et al. 2012).
At the farm level, competitiveness can be understood as the ability of a farm to produce
and sell quality products in a given market at a profit, which is required for the continued
existence of a farm (Latruffe 2010; Laureti and Viviani 2011; Bahta and Malope 2014;
Carayannis and Grigoroudis 2015). This profit depends on the productivity of a particular
farm, which is basically a physical concept, relating output to input in the transformation
process (Tangen 2003, 2005; OECD 2011), i.e. how much a farmer gets out of the available
resources (Färe et al. 2008b). Furthermore, profitability depends both on the value of
products and services, measured by their prices, and the efficiency with which they can be
produced (Porter et al. 2006; Bahta and Malope 2014).
Empirical studies of productivity and efficiency do not refer explicitly to
competitiveness (OECD 2011). However, productivity and efficiency are often cited as the
most reliable indicators for competitiveness (Porter and Ketels 2003; Dhungana et al. 2004;
Färe et al. 2008b; EC 2009; Kapelko et al. upcoming). Measuring efficiency involves
comparing the potential input reduction or potential output increase of a farm relative to a
benchmark, namely the production frontier, which represents the most productive input-
output combinations observed in the industry (Färe et al. 2008b; OECD 2011). The closer a
farm operates to the frontier, the more efficient it is.
Farm efficiency can be expressed in terms of technical efficiency (TE), which indicates
whether farms are able to use the available existing technology in the best way (Tauer and
Mishra 2006). Efficiency is determined by both internal and external variables of the farm
(Latruffe 2010; Bahta and Malope 2014; Simar and Wilson 2015). Internal variables are
related to the production system itself, such as farm size and input use. External variables
are those that affect the production system indirectly, such as geographical conditions, social
and demographic characteristic of farmers and their families, and government intervention
(Porter et al. 2006; Latruffe 2010; OECD 2011).
Studies have analyzed the efficiency of livestock farms (Bravo-Ureta and Pinheiro 1993;
Fraser and Cordina 1999; Arzubi and Berbel 2001; Moreira et al. 2006) and the influence of
external variables on this efficiency, such as presence off-farm income, participation in
cooperatives, and characteristics of farmers and their families (Bragg and Dalton 2004;
Latruffe et al. 2005; Pushkarskaya and Vedenov 2009; Uzmay et al. 2009; Kelly et al. 2012;
Carter Leal et al. 2016). These studies concluded that farmers can increase their efficiency,

Chapter 4 INPUT-SPECIFIC INEFFICIENCY ANALYSIS
80
mainly by decreasing input use and adjusting scale size. These studies measured TE for all
inputs simultaneously, assuming that all inputs can be reduced by the same magnitude. This
assumption implies by extension that the effect of external factors on TE is the same for all
inputs, which limits the value of the findings for the development of policies to improve
sector competitiveness.
Recent studies have adopted an input-specific inefficiency measurement approach, a
more in-depth technique to explore the efficiency with which any input is used (Kapelko and
Oude Lansink upcoming; Kapelko et al. upcoming). The identification of input-specific
contributions to economic performance helps farmers focus their efforts to improve
efficiency, and also assists policy makers in the design of effective policies to improve the
competitiveness of farmers at world markets.
This paper addresses the competitiveness of small livestock farmers in southern Chile,
within an input-specific framework in a static context. Although existing literature shows that
there is substantial scope for improving the farm efficiency of Chilean farmers (Moreira et al.
2006; Moreira and Bravo-Ureta 2010; von Cramon-Taubadel and Saldias 2014; Carter Leal et
al. 2016), none of these studies analyzed the input-specific technical inefficiency with which
a farmer operates.
The aim of our study is twofold. First, to estimate the input-specific technical
inefficiency of small livestock farmers in three regions in southern Chile. Second, to
determine the effect on the input-specific technical inefficiency of a set of external variables,
such as geographical conditions, social and demographic characteristic of farmers and their
families, and government intervention. The results of our study are valuable for policy
makers in Chile, and can be used to (re)design programs that are more effective in achieving
the goal of reducing the income gap between rural and urban populations. Our study also
contributes to the literature, as only a few studies on input-specific inefficiency are available,
especially studies focused on agriculture (Lansink et al. 2002; Manevska-Tasevska et al. 2014;
Kapelko et al. 2015a; Kapelko and Oude Lansink upcoming). The remainder of this paper is
structured as follows. Material and methods are presented in Section 2. This is followed by
the presentation of results and discussion in Section 3, and main conclusions and policy
implications in Section 4.
4.2 Material and methods
4.2.1 Study area and sample population
We conducted this study in three administrative regions in southern Chile: La
Araucanía, Los Ríos, and Los Lagos. These regions cover 24% of the total land used for

81
livestock and forestry in Chile; but they account for 49% of all livestock and forestry farms.
These regions kept 63% of all beef cattle and 91% of all dairy cows (INE 2007). Farm sizes
range from 10 to 200 ha of land with 0.62 to 1.16 AU1/ha (Vera 2006). Feeding is either
solely from pastures, or in combination with supplementary concentrates (Vera 2006). The
coexistence of small farms with larger and more entrepreneurial farms is common in this
area (Barrett et al. 2002; Vera 2006).
We used a structured questionnaire to collect detailed information on production
inputs (quantity and costs) and outputs (quantity and prices), and also to collect information
on farmers’ social and demographic characteristics, farmers’ expectations, and types of
subsidies received. The data collected in this questionnaire enables the evaluation of input-
specific technical inefficiency of farmers (i.e. inputs and outputs), and the identification of
external variables that determine differences among farmers in the inefficient use of inputs.
We applied the questionnaire to 212 small livestock farmers, which were randomly selected
from a population that is registered with the Agricultural Development Institute (INDAP)
Regional Offices, using farm size as a proxy to determine the optimal sample size by region
(Neyman 1934). The INDAP is the domestic entity committed to making small farmers2 more
competitive in world markets and to reducing the income gap between rural and urban
areas. This aim is achieved mainly by consolidating and expanding existing businesses in rural
areas (MINAGRI 1990; INDAP 2013a). These three regions account for 45% of INDAP’s
beneficiaries (INDAP 2013b).
Farmers were surveyed by their own agricultural advisors. We received complete
responses from 147 farms (response rate 69.3%). The sample is sufficiently large to conduct
the inefficiency analysis and make statistical inferences about the impact of different factors
on inefficiency (Golany and Roll 1989; Boussofiane et al. 1991; Bowlin 1998; Friedman and
Sinuany-Stern 1998; Dyson et al. 2001). The data set was corrected for outliers using the
approach outlined in Kapelko et al. (2015b)3.
1 AU: Animal Unit is a standard unit used in calculating the relative grazing impact of different kinds and classes of
livestock. It is defined as the amount of forage consumed by a 1,000 pound (454 kg) mature cow, either dry or with
a calf of up to 6 months of age, with a daily dry matter forage requirement of 26 pounds (11.8 kg). 2 To receive this assistance, the farm’s size must not exceed 12 equivalent irrigated hectares (HRB) and the farmer’s
main income must be provided by farming (MINAGRI, 1990). A HRB is a measurement unit that uses soil and climate
variables to establish a production potential equivalent throughout the country. 3 An observation was defined as an outlier if the ratio of output to any of the five inputs was outside the interval of
the median plus and minus two standard deviations. The outlier detection rules from statistics identify outliers by
creating the intervals for variables based on their means/medians and standard deviations, whereas in this case the
intervals are defined based on the DEA output/input ratios. Kapelko, M, Oude Lansink, A, Stefanou, SE (2015b)
Analyzing the impact of investment spikes on dynamic productivity growth. OMEGA-International Journal of
Management Science 54, 116-124.

Chapter 4 INPUT-SPECIFIC INEFFICIENCY ANALYSIS
82
max );,( M
1m
xm
VRSgxyDN xmnm
n
m),0(
, 1
S, , 1,...s ,y
M, , 1,...m ,-x
xm
N
1n
s
N
1n
xmx
mm
N
1n
n
nsn
nmn
z
yz
gxz
4.2.2 Methodology considerations
This study uses a directional input distance function (DIDF) to estimate the technical
inefficiency of inputs used by the sample of livestock farmers. The DIDF is estimated using a
nonparametric approach, Data Envelopment Analysis (DEA).
Using nonparametric approaches to evaluate productivity is advantageous for several
reasons. These approaches construct the frontier as a linear piecewise function from
empirical observations on inputs and outputs, without assuming any a priori functional
relationship between them, or any restrictive assumption regarding input remuneration
(Coelli and Rao 2005; Färe et al. 2008a; Assaf and Matawie 2010; Heinrichs et al. 2013).
Nonparametric approaches can also more easily represent multiple input-multiple output
technologies. Furthermore, the frontier nature of the production function allows any
productive inefficiency to be captured (Singbo and Oude Lansink 2010). DEA studies
commonly use a two-stage approach, where efficiency is estimated in the first stage,
followed by the regression of estimated efficiencies on covariates that represent external
variables.
First stage: Input-specific inefficiency analysis
We used a nonparametric DIDF to estimate the input-specific inefficiency. The input-
specific technical inefficiency of the n-th observation (farm) was computed by solving the
following DEA- model:
(4.1)
subject to:
where );,( VRSgxyDN xmnm
n
represents the technical inefficiency for the nth farm under
variable returns to scale constraint (VRS); yn represents the observed output; x
n the observed
inputs; xmg is the directional vector of input m (land, labor, livestock, and other costs); xm

83
Zxm
denotes the technical inefficiency of input m; zn are the intensity variables; the constraint
1N
1n
nz has been introduced to impose VRS.
We assumed variable returns to scale (VRS) in the model to account for the
heterogeneity among farms in the sample (Thanassoulis et al. 2008; Assaf and Matawie
2010). We also assumed an input orientation because farmers can more easily contract their
input use.
Second-stage regression: Single truncated bootstrap
We used the single truncated bootstrap procedure proposed by Simar and Wilson
(2007) to determine whether certain external variables influence the input-specific technical
inefficiency of the livestock farms in our sample. This procedure has been proposed by Simar
and Wilson (2011) as the only well-defined, statistically coherent, and meaningful second-
stage regression method. The method incorporates two important assumptions:
heterogeneity in the distribution of inefficiency, and separability between the production set
and the covariates (Simar and Wilson 2007; Singbo and Oude Lansink 2010). The steps in the
bootstrapping approach follow Simar and Wilson (2007). The truncated regression model we
used is formally represented by:
(4.2)
where represent the unknown parameters, Z represents the external variables, and the
error term.
4.2.3 Empirical application
First stage: Input-specific inefficiency analysis
Data used in the first stage consisted of one output and four inputs. Table 4.1 shows
the descriptive statistics of the variables used for estimating the input-specific technical
inefficiency.

Chapter 4 INPUT-SPECIFIC INEFFICIENCY ANALYSIS
84
Table 4.1. Descriptive statistics for the output and input variables for the sample of farms in southern
Chile (147 farms).
Variable Unit Mean Min Max SD
Output
Revenue EUR* 19,289.1 1,851.6 109,894.5 17,415.1
Inputs
Land Ha 27.5 5.0 140.0 18.9
Labor FTE 2.6 0.4 10.8 1.6
Livestock AU 32.5 4.4 183.2 25.4
Other costs EUR* 8,982.7 959.9 76,611.3 9,444.3
* Exchange rate $657,5 (Chilean pesos ) = €1, Statistics Database Banco Central de Chile
The output is measured as revenues from farming during a one-year period (in
monetary terms). To avoid the risk of multicollinearity and the ‘zero-observation’ problem
for input variables in the first stage, the inputs were aggregated into four categories: (1) Land
(measured in hectares), which includes owned and rented land area used; (2) Labor
(measured as full-time equivalent (FTE) 1= 1,900 hours per year), which includes time spent
by the owner, his/her relatives, and hired labor; (3) Livestock (measured as Animal Unit (AU)
1= mature black and white dairy cow yielding an average annual milk yield); (4) Other costs
(in monetary terms), which consists of pasture, health and veterinary, transport, machinery
repair, machinery hire, energy (electricity and fuel), purchased feed (mineral and
concentrate feeding stuffs, and purchased fodder), and other costs.
We chose the directional vector (gx) to be the observed input vector (x). This directional
vector implies that the DIDF gives an estimate of the maximum feasible contraction in
variable inputs (Chambers et al. 1998). The DIDF consistent with equation (4.1) was
estimated using the software GAMS (General Algebraic Modelling System).
Second stage: Truncated bootstrap regression
There are currently no studies that provide evidence of how the effects of external
variables on the input-specific inefficiency differ across the four inputs land, labor, livestock,
and other costs. However, based on studies that reported the effect of external variables on
TE (as a whole), we expect that the effects of external variables differ across the inputs, from
negative to positive effect or none. If the effects differ then an input-specific approach is
valuable and the results provide added value for policy makers in developing rural policies.
The selection of external variables for inclusion in the second-stage regression was
based on a literature review and previous work of the authors (Carter Leal et al. 2016). We
assumed that external variables only affect the inefficiency and not the transformation
process of inputs into outputs. Possible variables influencing input-specific technical
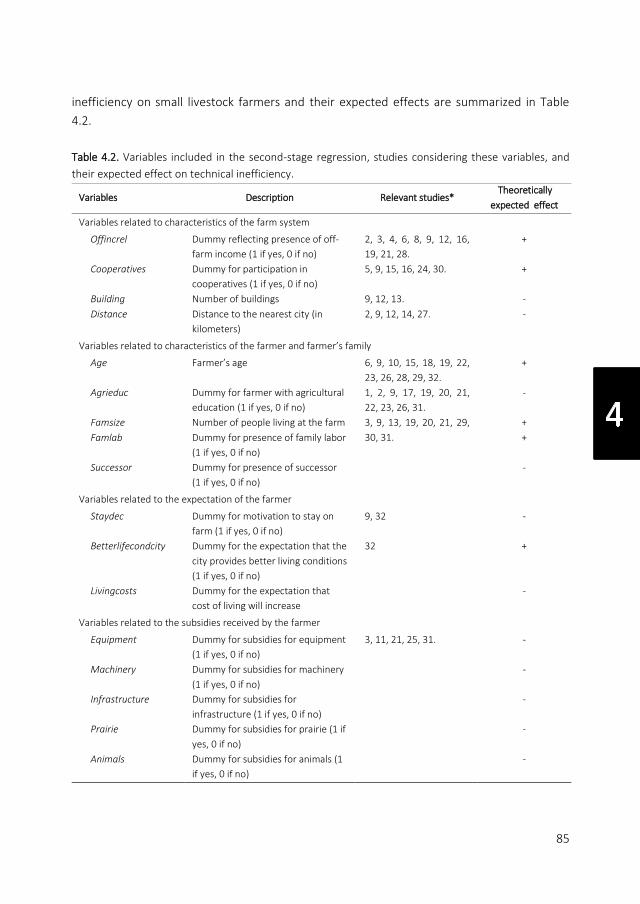
85
inefficiency on small livestock farmers and their expected effects are summarized in Table
4.2.
Table 4.2. Variables included in the second-stage regression, studies considering these variables, and
their expected effect on technical inefficiency.
Variables Description Relevant studies* Theoretically
expected effect
Variables related to characteristics of the farm system
Offincrel Dummy reflecting presence of off-
farm income (1 if yes, 0 if no)
2, 3, 4, 6, 8, 9, 12, 16,
19, 21, 28.
+
Cooperatives Dummy for participation in
cooperatives (1 if yes, 0 if no)
5, 9, 15, 16, 24, 30. +
Building Number of buildings 9, 12, 13. -
Distance Distance to the nearest city (in
kilometers)
2, 9, 12, 14, 27. -
Variables related to characteristics of the farmer and farmer’s family
Age Farmer’s age 6, 9, 10, 15, 18, 19, 22,
23, 26, 28, 29, 32.
+
Agrieduc Dummy for farmer with agricultural
education (1 if yes, 0 if no)
1, 2, 9, 17, 19, 20, 21,
22, 23, 26, 31.
-
Famsize Number of people living at the farm 3, 9, 13, 19, 20, 21, 29,
30, 31.
+
Famlab Dummy for presence of family labor
(1 if yes, 0 if no)
+
Successor Dummy for presence of successor
(1 if yes, 0 if no)
-
Variables related to the expectation of the farmer
Staydec Dummy for motivation to stay on
farm (1 if yes, 0 if no)
9, 32 -
Betterlifecondcity Dummy for the expectation that the
city provides better living conditions
(1 if yes, 0 if no)
32 +
Livingcosts Dummy for the expectation that
cost of living will increase
-
Variables related to the subsidies received by the farmer
Equipment Dummy for subsidies for equipment
(1 if yes, 0 if no)
3, 11, 21, 25, 31. -
Machinery Dummy for subsidies for machinery
(1 if yes, 0 if no)
-
Infrastructure Dummy for subsidies for
infrastructure (1 if yes, 0 if no)
-
Prairie Dummy for subsidies for prairie (1 if
yes, 0 if no)
-
Animals Dummy for subsidies for animals (1
if yes, 0 if no)
-
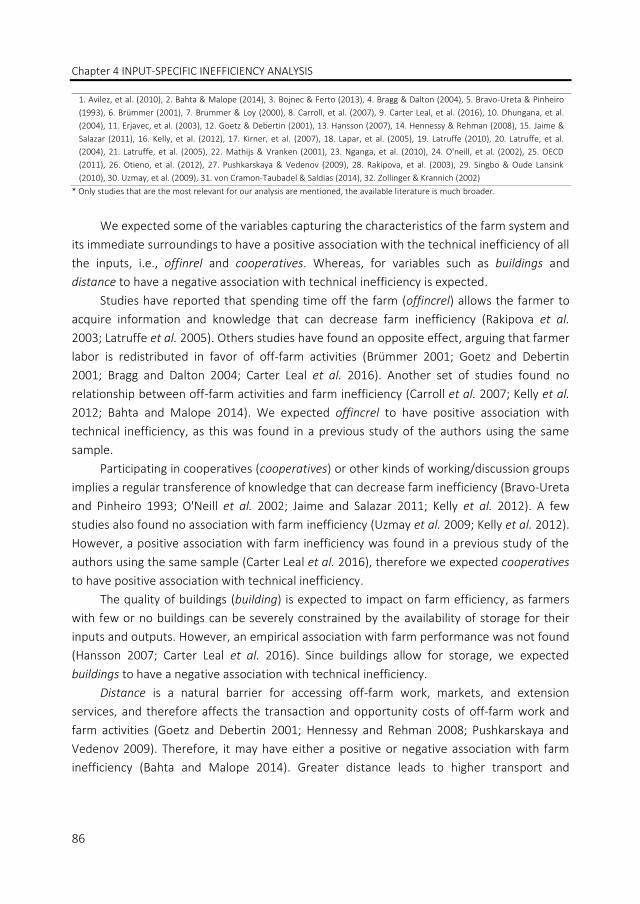
Chapter 4 INPUT-SPECIFIC INEFFICIENCY ANALYSIS
86
1. Avilez, et al. (2010), 2. Bahta & Malope (2014), 3. Bojnec & Ferto (2013), 4. Bragg & Dalton (2004), 5. Bravo-Ureta & Pinheiro
(1993), 6. Brümmer (2001), 7. Brummer & Loy (2000), 8. Carroll, et al. (2007), 9. Carter Leal, et al. (2016), 10. Dhungana, et al.
(2004), 11. Erjavec, et al. (2003), 12. Goetz & Debertin (2001), 13. Hansson (2007), 14. Hennessy & Rehman (2008), 15. Jaime &
Salazar (2011), 16. Kelly, et al. (2012), 17. Kirner, et al. (2007), 18. Lapar, et al. (2005), 19. Latruffe (2010), 20. Latruffe, et al.
(2004), 21. Latruffe, et al. (2005), 22. Mathijs & Vranken (2001), 23. Nganga, et al. (2010), 24. O'neill, et al. (2002), 25. OECD
(2011), 26. Otieno, et al. (2012), 27. Pushkarskaya & Vedenov (2009), 28. Rakipova, et al. (2003), 29. Singbo & Oude Lansink
(2010), 30. Uzmay, et al. (2009), 31. von Cramon-Taubadel & Saldias (2014), 32. Zollinger & Krannich (2002)
* Only studies that are the most relevant for our analysis are mentioned, the available literature is much broader.
We expected some of the variables capturing the characteristics of the farm system and
its immediate surroundings to have a positive association with the technical inefficiency of all
the inputs, i.e., offinrel and cooperatives. Whereas, for variables such as buildings and
distance to have a negative association with technical inefficiency is expected.
Studies have reported that spending time off the farm (offincrel) allows the farmer to
acquire information and knowledge that can decrease farm inefficiency (Rakipova et al.
2003; Latruffe et al. 2005). Others studies have found an opposite effect, arguing that farmer
labor is redistributed in favor of off-farm activities (Brümmer 2001; Goetz and Debertin
2001; Bragg and Dalton 2004; Carter Leal et al. 2016). Another set of studies found no
relationship between off-farm activities and farm inefficiency (Carroll et al. 2007; Kelly et al.
2012; Bahta and Malope 2014). We expected offincrel to have positive association with
technical inefficiency, as this was found in a previous study of the authors using the same
sample.
Participating in cooperatives (cooperatives) or other kinds of working/discussion groups
implies a regular transference of knowledge that can decrease farm inefficiency (Bravo-Ureta
and Pinheiro 1993; O'Neill et al. 2002; Jaime and Salazar 2011; Kelly et al. 2012). A few
studies also found no association with farm inefficiency (Uzmay et al. 2009; Kelly et al. 2012).
However, a positive association with farm inefficiency was found in a previous study of the
authors using the same sample (Carter Leal et al. 2016), therefore we expected cooperatives
to have positive association with technical inefficiency.
The quality of buildings (building) is expected to impact on farm efficiency, as farmers
with few or no buildings can be severely constrained by the availability of storage for their
inputs and outputs. However, an empirical association with farm performance was not found
(Hansson 2007; Carter Leal et al. 2016). Since buildings allow for storage, we expected
buildings to have a negative association with technical inefficiency.
Distance is a natural barrier for accessing off-farm work, markets, and extension
services, and therefore affects the transaction and opportunity costs of off-farm work and
farm activities (Goetz and Debertin 2001; Hennessy and Rehman 2008; Pushkarskaya and
Vedenov 2009). Therefore, it may have either a positive or negative association with farm
inefficiency (Bahta and Malope 2014). Greater distance leads to higher transport and
87
opportunity costs, which could increase farm efficiency (Carter Leal et al. 2016). Therefore,
we expected distance to have a negative association with technical inefficiency.
We expected the characteristics of farmers and their families, captured by the variables
age, agrieduc, famsize, famlab, and successor, to have a positive or negative association with
farm inefficiency.
Studies have shown that age of the farmer could increase farm inefficiency because
older farmers may be reluctant to innovate or be less committed to business (as they are
mostly at or near their exit stage) (Brummer and Loy 2000; Rakipova et al. 2003; Nganga et
al. 2010; Jaime and Salazar 2011; Carter Leal et al. 2016). However, older farmers could also
use inputs more efficiently based on their expertise (Mathijs and Vranken 2001; Lapar et al.
2005; Avilez et al. 2010; Otieno et al. 2012). Yet Bahta and Malope (2014) found no
significant association of age with farm inefficiency. In line with the previous work of the
authors, we expected age to have a positive association with technical inefficiency.
In addition, a better educated farmer implies more skills that allow for increasing the
opportunities for non-farm employment (Latruffe et al. 2005), or for the more efficient use
of inputs (Mathijs and Vranken 2001; Latruffe et al. 2005; Kirner et al. 2007; Nganga et al.
2010; Jaime and Salazar 2011; Otieno et al. 2012; Bahta and Malope 2014; von Cramon-
Taubadel and Saldias 2014). Nevertheless, no association between education and farm
inefficiency has also been reported (Latruffe et al. 2004; Carter Leal et al. 2016). Given the
age of the farmers in our sample, we expected them to use their additional knowledge to
improve their efficiency. Therefore, we expected agrieduc to have a negative association
with technical inefficiency.
The farmer’s family characteristics, such as famsize and famlab, can be positively or
negatively associated with farm inefficiency (Latruffe et al. 2004, 2005; Hansson 2007;
Uzmay et al. 2009; Bojnec and Ferto 2013; Carter Leal et al. 2016). Inefficiency can increase
when there are not enough job places for all family members to work at farm (Hansson
2007). On the other hand, family laborers, as the only residual claimants, have incentives to
act efficiently (Latruffe 2010). We expected famsize and famlab to have a positive
association with technical inefficiency, based on the results of a previous study of the
authors using the same sample.
Having a successor could act as an incentive to transfer a profitable business to the next
generation (Zollinger and Krannich 2002). Therefore, we expected successor to have a
negative association with technical inefficiency.
Farmer’s expectations play a role in the efficiency with which a farmer operates
(Zollinger and Krannich 2002). The staydec could act as an incentive to have a profitable
business for the next five years (Zollinger and Krannich 2002; Carter Leal et al. 2016).
Therefore, we expected staydec to have a negative association with technical inefficiency.
We also included betterlifecondcity to capture the expectation that living conditions are

Chapter 4 INPUT-SPECIFIC INEFFICIENCY ANALYSIS
88
better in the city. We expected this variable to have a positive association with technical
inefficiency. We included livingcosts to capture the expectation that living costs will increase
in the future, and expected this variable to have a negative association with farm
inefficiency.
From a public support viewpoint, government subsidies increase farm income (Erjavec
et al. 2003). We expected the different subsidies (equipment, machinery, infrastructure,
prairie, and animals) to have a negative association with farm inefficiency; von Cramon-
Taubadel and Saldias (2014) found subsidies given to small specialized livestock farmers in
Chile decrease their inefficiency. This finding is in contrast with the consistently positive
relationship found in most literature between public support and technical inefficiency
(Latruffe et al. 2005; OECD 2011; Bojnec and Ferto 2013). In some cases, policies aimed at
subsidizing credit for the purchase of agricultural machinery might have encouraged
inefficient investments (Latruffe et al. 2005). We considered the study of von Cramon-
Taubadel and Saldias (2014) to be the most relevant for our analysis, and therefore expected
the association to be negative.
The truncated bootstrap regression was estimated using Stata software version 13.0.
The bootstrap was run using L=2,000 replications, as suggested by Simar and Wilson (2007).
4.3 Results and discussion
4.3.1 First stage: Input-specific inefficiency results
The percentage of fully efficient farms and the input-specific technical inefficiency
measures are summarized in Table 4.3. For the input-specific technical inefficiencies, values
equal to zero indicate efficiency and values greater than zero indicate a degree of
inefficiency.
Table 4.3. Percentage of fully efficient farms and input-specific technical inefficiencies.
Inputs
Fully efficient farms Technical inefficiency
Mean SD Min Max
Land
40%
0.26 0.27 0 0.83
Labor
35%
0.29 0.27 0 0.89
Livestock
27%
0.37 0.28 0 0.85
Other costs 30% 0.35 0.29 0 0.87
In the second column of Table 4.3 we report the percentage of fully efficient farms for
the use of each input, i.e. farms operating at the frontier. This percentage varies between
27% and 40%. The percentage of fully-efficient farms was largest for the use of land (40%),

89
followed by labor (35%) and other costs (30%), and smallest for the use of livestock (27%).
Our finding indicates that 60% to 73% of the farms are inefficient when using these inputs.
This is in agreement with previous studies, which reported percentages of fully efficient
farms between 24% and 37% (Fraser and Cordina 1999; Candemir and Koyubenbe 2006;
Kirner et al. 2007; Carter Leal et al. 2016). However, these studies analyzed technical
efficiency as a whole, not for each input individually, as done in this study. Nevertheless, our
finding indicates that low productivity is due to inefficiency, which implies that the currently
available technology allows small farmers to be competitive with larger ones (Tauer and
Mishra 2006).
The input-specific technical inefficiencies reported in Table 4.3 indicate that input use
can be reduced by 26% to 37% on average, which is in the range mostly found for technical
inefficiency (Bravo-Ureta and Pinheiro 1993; Fraser and Cordina 1999; Arzubi and Berbel
2001; Moreira et al. 2006). Our finding indicates that, if the average farm was to become
efficient, land could on average be reduced by 7.15 ha (27.5 × 0.26), labor by 0.75 FTE (2.6 ×
0.29), livestock by 12.02 AU (32.5 × 0.37), and other costs by 3,143.94 euro (8,982.7 × 0.35),
while obtaining the same level of revenue. The input-specific technical inefficiencies we
found are higher than the 20% to 22% reported in Chile (von Cramon-Taubadel and Saldias
2014; Carter Leal et al. 2016). This could be explained by the method used in this study,
which provides more scope for contraction when all slack is removed. Our finding is
supported by a study conducted in Sweden (Manevska-Tasevska et al. 2014), which is the
only similar to ours. Manevska-Tasevska et al. (2014) found that, on average, land can be
reduced by 32%, labor by 24%, and livestock by 30%. Our findings show that, although many
of the small livestock farmers operate at levels below the efficient frontier, they operate as
well as farmers in a developed country, i.e. Sweden. Additionally, our findings show that
small livestock farmers can gain from improving the input-specific technical efficiency with
which they operate.
4.3.2 Second stage: Truncated bootstrap regression
In Table 4.4 we report the results of the second stage regression of external variables
on input-specific technical inefficiencies4. Positively related variables increase inefficiency,
whereas negatively related variables decrease inefficiency. A parameter estimate was
significant when the confidence interval did not include the value of zero, otherwise it was
insignificant.
4 To simplify the table and facilitate the comparison across inputs, only the second-stage beta coefficients
representing the effect of external variables on the input-specific technical inefficiency estimates are shown in Table
4.4. Bootstrap confidence intervals are omitted, but are available from the authors upon request.

Chapter 4 INPUT-SPECIFIC INEFFICIENCY ANALYSIS
90
Table 4.4. Beta coefficients for input-specific technical inefficiency at the 1% (**) and 5% (*)
significance levels (L=2000).
Variables Coefficients
Land Labor Livestock Other costs
Statistics: Wald χ2(17) 105.43 ** 111.27 ** 79.62 ** 164.46 **
Variables related to characteristics of the farm system
Offincrel 0.0565 0.0090 0.0822 * 0.1175 *
Cooperatives 0.1038 * 0.0154 0.0582 * 0.0356
Building -0.0322 * -0.0279 * 0.0035 -0.0071
Distance 0.0003 -0.0034 * -0.0019 * -0.0017 *
Variables related to characteristics of the farmer and farmer’s family
Age 0.0018 0.0040 * 0.0031 * 0.0030 *
Agrieduc -0.1341 * -0.0635 * -0.0152 -0.0032
Famsize -0.0231 * 0.0022 0.0063 0.0257 *
Famlab 0.0638 * 0.1150 * 0.0095 0.1631 *
Successor 0.0290 0.0760 * 0.0155 0.0013
Variables related to the expectation of the farmer
Staydec -0.0304 0.0766 * 0.0320 0.0976 *
Betterlifecondcity -0.0768 0.0516 0.1705 * 0.0114
Livingcosts 0.0236 -0.1031 * -0.0475 -0.0701 *
Variables related to the subsidies received by the farmer
Equipment -0.0796 -0.0368 0.0256 0.0445
Machinery -0.1219 * -0.0405 -0.0280 0.0539
Infrastructure 0.0415 0.0233 0.0248 0.0021
Prairie 0.0372 -0.0850 * -0.1247 * 0.0181
Animals -0.1120 * 0.0272 0.0188 0.0102
_cons 0.4000 * 0.3685 * 0.3660 * 0.1625
** Significance at 1% level, * Significance at 5% level.
Our model was significant with Wald χ2 (17) values of 105.43 for land, 111.27 for labor,
79.62 for livestock, and 164.46 for other costs.
Land technical inefficiency was significantly and positively associated with both
cooperatives and famlab; and significantly and negatively associated with building, agrieduc,
famsize, machinery, and animals. Labor technical inefficiency was significantly and positively
associated with age, famlab, successor, and staydec; and significantly and negatively
associated with building, distance, agrieduc, livingcosts, and prairie. Livestock technical
inefficiency was significantly and positively associated with offincrel, cooperatives, age, and
betterlifecondcity; and significantly and negatively associated with distance and prairie. Other
costs technical inefficiency was significantly and positively associated with offincrel, age,
famsize, famlab, and staydec; and significantly and negatively associated with distance and
livingcosts.

91
Variables capturing the characteristics of the farm system
According to our expectations, which were based on the findings in Carter Leal et al.
(2016), offincrel was positively associated with higher technical inefficiency of livestock and
other costs. This result is in agreement with other studies (Brümmer 2001; Bragg and Dalton
2004; Jaime and Salazar 2011; Bahta and Malope 2014). Two possible reasons may explain
the positive effect of offincrel on the technical inefficiency of livestock and other costs.
Farmers working off-farm may have to compensate their absence through additional
payments for labor (replacement person), extra feeding, and other costs, which increase the
use of inputs (Latruffe et al. 2005). In addition, the person replacing the farmer may not be
as committed as the farmer to efficient use of available inputs, as hired labor do not benefit
directly from farm profits (Latruffe 2010).
We found no evidence of a negative association of offincrel with any of the input
inefficiencies. This provides some support for the argument that the socioeconomic
characteristics of small Chilean farmers are such that they prefer to have non-farm
employment to complement their farm income, rather than obtaining additional resources
to be invested in the farm (Jaime and Salazar 2011).
The positive association we found for cooperatives with both land and livestock
inefficiencies, is in agreement with our expectations. However, it is not in agreement with
most previous studies (O'Neill et al. 2002; Jaime and Salazar 2011; Kelly et al. 2012). Perhaps
the economic and commercial benefits provided by cooperatives to their members remove
the incentives to be more efficient. Therefore those non-cooperative members are more
efficient and profitable when using land and livestock, or other inputs.
The number of buildings was negatively associated with the technical inefficiency of
land and labor, which is consistent with our expectations. In contrast, the studies of Carter
Leal et al. (2016) and Hansson (2007) found no effect of buildings on technical inefficiency. A
potential explanation for this finding is that more buildings enable farmers to increase their
stock capacity, i.e. more forage, more animals, more machinery, etc. (Hansson 2007).
Therefore a farmer will efficiently use both land and labor to produce as much as possible.
The distance of a farm from the nearest city was negatively associated with the
technical inefficiency of the use of labor, livestock, and other costs, which is in agreement
with our expectations, and with Bahta and Malope (2014). An explanation for the negative
effect on the technical inefficiency of labor, livestock, and other costs is that both
opportunity costs and transport costs increase with distance. As a consequence, a farmer
exploits resources other than land as much as possible, since the costs involved and time
used, i.e., fertilizer or animal acquisition, external services, and/or a veterinarian visit, can be
shared among different activities.
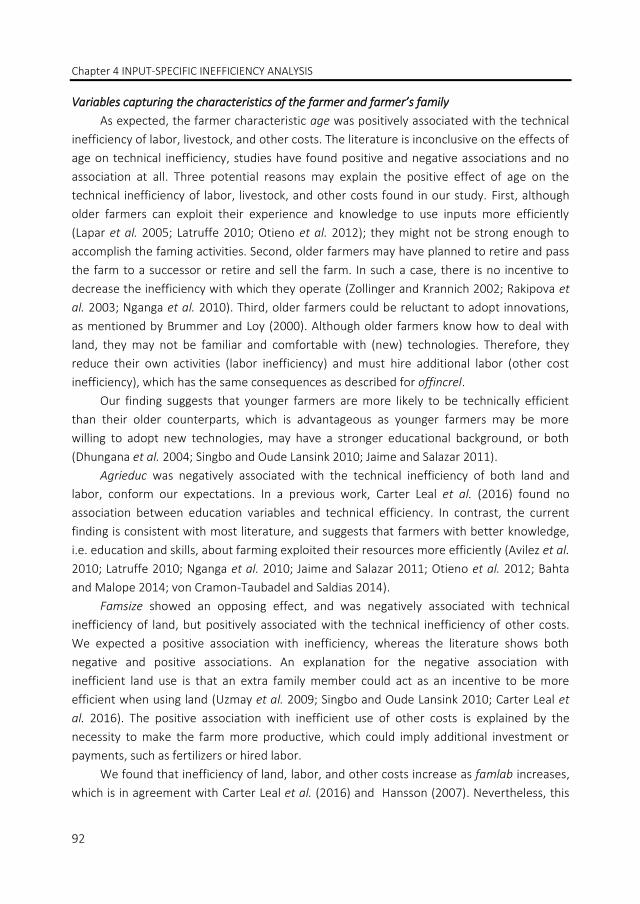
Chapter 4 INPUT-SPECIFIC INEFFICIENCY ANALYSIS
92
Variables capturing the characteristics of the farmer and farmer’s family
As expected, the farmer characteristic age was positively associated with the technical
inefficiency of labor, livestock, and other costs. The literature is inconclusive on the effects of
age on technical inefficiency, studies have found positive and negative associations and no
association at all. Three potential reasons may explain the positive effect of age on the
technical inefficiency of labor, livestock, and other costs found in our study. First, although
older farmers can exploit their experience and knowledge to use inputs more efficiently
(Lapar et al. 2005; Latruffe 2010; Otieno et al. 2012); they might not be strong enough to
accomplish the faming activities. Second, older farmers may have planned to retire and pass
the farm to a successor or retire and sell the farm. In such a case, there is no incentive to
decrease the inefficiency with which they operate (Zollinger and Krannich 2002; Rakipova et
al. 2003; Nganga et al. 2010). Third, older farmers could be reluctant to adopt innovations,
as mentioned by Brummer and Loy (2000). Although older farmers know how to deal with
land, they may not be familiar and comfortable with (new) technologies. Therefore, they
reduce their own activities (labor inefficiency) and must hire additional labor (other cost
inefficiency), which has the same consequences as described for offincrel.
Our finding suggests that younger farmers are more likely to be technically efficient
than their older counterparts, which is advantageous as younger farmers may be more
willing to adopt new technologies, may have a stronger educational background, or both
(Dhungana et al. 2004; Singbo and Oude Lansink 2010; Jaime and Salazar 2011).
Agrieduc was negatively associated with the technical inefficiency of both land and
labor, conform our expectations. In a previous work, Carter Leal et al. (2016) found no
association between education variables and technical efficiency. In contrast, the current
finding is consistent with most literature, and suggests that farmers with better knowledge,
i.e. education and skills, about farming exploited their resources more efficiently (Avilez et al.
2010; Latruffe 2010; Nganga et al. 2010; Jaime and Salazar 2011; Otieno et al. 2012; Bahta
and Malope 2014; von Cramon-Taubadel and Saldias 2014).
Famsize showed an opposing effect, and was negatively associated with technical
inefficiency of land, but positively associated with the technical inefficiency of other costs.
We expected a positive association with inefficiency, whereas the literature shows both
negative and positive associations. An explanation for the negative association with
inefficient land use is that an extra family member could act as an incentive to be more
efficient when using land (Uzmay et al. 2009; Singbo and Oude Lansink 2010; Carter Leal et
al. 2016). The positive association with inefficient use of other costs is explained by the
necessity to make the farm more productive, which could imply additional investment or
payments, such as fertilizers or hired labor.
We found that inefficiency of land, labor, and other costs increase as famlab increases,
which is in agreement with Carter Leal et al. (2016) and Hansson (2007). Nevertheless, this

93
finding is not in agreement with other studies (Latruffe et al. 2004, 2005; Latruffe 2010).
Although family labor is considered to be more adaptable (Latruffe 2010), our finding
indicates that when the farm is not large enough to allow all family members to work at the
farm, the marginal effect of an additional member becomes smaller or even negative.
Therefore, our finding supports the idea of hidden unemployment at the farm, as reported
by Hansson (2007).
The presence of a successor was positively associated with technical inefficiency of
labor and had no significant effect on the inefficient use of the other inputs. This is not
consistent with the scarce literature (Zollinger and Krannich 2002; Carter Leal et al. 2016) nor
with our prior expectations. An explanation for the effect of successor on labor inefficiency is
that once farmers believe they have a successor, they then delegate some activities to the
successor, who is often not as interested in farming (this lack of interest was mentioned
during the survey).
Variables capturing the expectations of the farmer
With respect to farmer’s expectations, we found that the inefficiency of labor and other
costs increases as staydec increases. This was contrary to the scarce literature (Zollinger and
Krannich 2002; Carter Leal et al. 2016) and our prior expectations. An explanation for this
finding is that these farmers have taken the decision to continue farming not only based on
their (low) productivity level (Bragg and Dalton 2004), but also based on the intrinsic rewards
provided by farming (independency, doing something worthwhile, or working outdoors)
(Zollinger and Krannich 2002; Carter Leal et al. 2016).
The betterlifecondcity resulted in higher livestock technical inefficiency, conform our
prior expectations, but had no significant effect on the technical inefficiency of the other
inputs. When a farmer believes that the farm does not provide good living conditions any
longer, s/he may (un)consciously decrease the effort put into farm activities (Zollinger and
Krannich 2002). It is not clear why this effect was only found for livestock and not the other
inputs.
The expectation that livingcosts would increase in the future resulted in lower technical
inefficiency for both labor and other costs, conform our expectations. This suggests that
farmers use their resources more efficiently to increase profit, which can then be saved to
afford a higher standard of living in the future.
Variables capturing the subsidies received by the farmer
Table 4.4 shows that subsidies, in general, decrease the input-specific technical
inefficiency of small livestock farmers, which is in agreement with our prior expectations and
with von Cramon-Taubadel and Saldias (2014). Prairie resulted in lower technical inefficiency
for both labor and livestock. Subsidies for machinery and animals also resulted in lower

Chapter 4 INPUT-SPECIFIC INEFFICIENCY ANALYSIS
94
technical inefficiency, but only for land. On the other hand, subsidies given to farmers for
either equipment acquisition or infrastructure showed no significant association with any
input-specific technical inefficiency. Although the effects were not significant, equipment
resulted in lower technical inefficiency for both land and labor, but higher input-specific
technical efficiency for livestock and other costs. Infrastructure increased the technical
inefficiency of all inputs. This suggests that the existing technology (current machinery and
infrastructure) is not a constraint for efficient production for these farmers.
Our findings suggest that resources used to subsidy either equipment or infrastructure
could have no effect or even increase farm inefficiency (Latruffe et al. 2005; Bojnec and
Ferto 2013). Therefore these resources could be reallocated to subsidies that decrease
input-specific technical inefficiency, such as prairie, and animals.
4.4 Conclusions and policy implications
This paper estimated the input-specific technical inefficiency of livestock farmers in
southern Chile and provides empirical evidence of the association of external variables with
technical inefficiency. We employed a nonparametric directional distance function to
estimate the input-specific technical inefficiency for a sample of small livestock farmers. It
was followed by a single truncated bootstrap procedure to examine the effect of external
variables on the inefficiency estimates.
Our study extends the scarce literature on input-specific technical inefficiency in
farming. Additionally, it provides insight in the effect of external variables on the efficient use
of four main inputs used in farming. Input-specific inefficiency analysis is a valuable tool for
farmers and decision makers, as the inefficiency is evaluated for each input, which provides
information that can be used to prioritize potential measures and policies to improve farm
efficiency.
Results from the first stage show input-specific technical inefficiencies of 26% for land,
29% for labor, 35% for other costs, and 37% for livestock. Our findings in the second stage
indicated that, in general, offincrel, cooperatives, age, famlab, successor, staydec, and
betterlifecondcity resulted in higher input-specific technical inefficiency. In contrast, building,
distance, agrieduc, livingcosts, machinery, prairie, and animals resulted in lower input-
specific technical inefficiency. Additionally, famsize showed a contradictory effect, i.e. it
resulted in higher technical inefficiency of other costs and in lower technical inefficiency of
land. These results also showed that the effect of external variables differs across inputs,
which is relevant when designing rural development policies. The complexity of the effect
across the different inputs requires additional research to provide a clearer picture of how
the effects of the external variables on inefficiency differ across inputs.

95
The findings of this study can be used to support and improve the development of new
rural policies and programs. Based on our results, we suggest the following
recommendations for policy development. Some of them can be developed by local or
regional agricultural institutions, but others require additional efforts from other
government organizations.
First, input-specific technical efficiencies provide guidance for targeting effective
support. Once inefficiencies have been measured, it is important to provide effective support
to increase the efficiency with which farmers operate. In this study, livestock showed the
lowest technical efficiency. Therefore, considering that animals are the core of the farming
system, intervention measures targeted to reduce the technical inefficiency of livestock will
be the most effective in improving productivity as a whole.
Second, we found that distance affects the specific technical inefficiencies of labor,
livestock and other costs. The common practice of improving the quality of the roads
decreases transport time, which in practical terms reduces distance. However, it implies that
farm inefficiency increases as well due to lower transport and opportunity costs. Farm
inefficiency will increase because of the increased possibilities for having an extra job,
obtaining technical assistance, or going to the market place. In addition, this may also have
an impact on the opportunity cost of labor, which in turn could affect the labor use of
farmers, in terms of own labor, family labor, and hired labor. Therefore, improving the
quality of roads requires the participation of other ministries, such as the Ministry of Public
Works, Ministry of Transport and Communications, the Ministry of Economy, Development
and Tourism, the Ministry of the Environment, the Ministry of Social Development, and the
Ministry of Education to identify and provide alternatives for farmers to continue farming.
Third, the positive effects we found for most of the characteristics of the farmer and
his/her family, i.e., age, famlab, successor, and staydec, highlight the lack of alternatives
available in rural areas. Hence, it is important to increase on-farm work or promote
alternative employment or activities for children, women, and young farmers, either inside
or outside their own farm.
Fourth, we found no effect of subsidies used for equipment or infrastructure, whereas
subsidies for machinery, prairie, and animals reduced technical inefficiency. Therefore,
subsidies for equipment and infrastructure could be reallocated to those subsidies that do
improve efficiency.

Chapter 4 INPUT-SPECIFIC INEFFICIENCY ANALYSIS
96
Acknowledgements
This research was financially supported by CONICYT (National Commission for Scientific
and Technological Research) of the Chilean Government through the BecasChile Program.
The authors would like to thank the farmers who kindly provided data for this study and the
agriculture advisors for helping with the data collection.

97
References
Arzubi, AA, Berbel, J (2001) Determinación de eficiencia usando DEA en explotaciones
lecheras de Argentina. In 'IV Congreso de la Asociación Española de Economía Agraria.
Valencia, España'.
Assaf, A, Matawie, KM (2010) Improving the accuracy of dea efficiency analysis: A bootstrap
application to the health care foodservice industry. Applied Economics 42, 3547-3558.
Avilez, JP, Escobar, P, von Fabeck, G, Villagran, K, García, F, Matamoros, R, García Martínez, A
(2010) Caracterización productiva de explotaciones lecheras empleando metodología
de análisis multivariado. Revista Científica-Facultad de Ciencias Veterinarias 20, 74-80.
Bahta, S, Malope, P (2014) Measurement of competitiveness in smallholder livestock
systems and emerging policy advocacy: An application to Botswana. Food Policy 49,
408-417.
Barrett, G, Caniggia, M, Read, L (2002) “There are More Vets than Doctors in Chiloé”: Social
and Community Impact of the Globalization of Aquaculture in Chile. World
Development 30, 1951-1965.
Bojnec, Š, Ferto, I (2013) Farm income sources, farm size and farm technical efficiency in
Slovenia. Post-Communist Economies 25, 343-356.
Boussofiane, A, Dyson, RG, Thanassoulis, E (1991) Applied data envelopment analysis.
European Journal of Operational Research 52, 1-15.
Bowlin, WF (1998) Measuring Performance: An Introduction to Data Envelopment Analysis
(DEA). The Journal of Cost Analysis 15, 3-27.
Bragg, L, Dalton, T (2004) Factors Affecting the Decision to Exit Dairy Farming: A Two-Stage
Regression Analysis. Journal of Dairy Science 87, 3092-3098.
Bravo-Ureta, BE, Pinheiro, AE (1993) Efficiency analysis of developing country agriculture: A
review of the frontier function literature. Agricultural and Resource Economics Review
22, 88-101.
Brümmer, B (2001) Estimating confidence intervals for technical efficiency: the case of
private farms in Slovenia. European Review of Agricultural Economics 28, 285-306.
Brummer, B, Loy, JP (2000) The technical efficiency impact of farm credit programmes: A
case study of Northern Germany. Journal of Agricultural Economics 51, 405-418.
Candemir, M, Koyubenbe, N (2006) Efficiency Analysis of Dairy Farms in the Province of Izmir
(Turkey): Data Envelopment Analysis (DEA). Journal of Applied Animal Research 29, 61-
64.
Carayannis, EG, Grigoroudis, E (2015) Using multiobjective mathematical programming to
link national competitiveness, productivity, and innovation. Annals of Operations
Research in press.
Chapter 4 INPUT-SPECIFIC INEFFICIENCY ANALYSIS
98
Carroll, J, Newman, C, Thorne, F (2007) Understanding the factors that influence dairy farm
efficiency in the Republic of Ireland. Teagasc, Ireland. Available at
https://www.researchgate.net/publication/255526038_Understanding_the_Factors_th
at_Influence_Dairy_Farm_Efficiency_in_the_Republic_of_Ireland [Accessed April 2015].
Carter Leal, LM, Oude Lansink, A, Saatkamp, H, 2016. Factors affecting farm technical
efficiency of small livestock farmers in southern Chile. Wageningen, the Netherlands.
Coelli, TJ, Rao, DSP (2005) Total factor productivity growth in agriculture: a Malmquist index
analysis of 93 countries, 1980–2000. Agricultural Economics 32, 115-134.
Chambers, RG, Chung, Y, Färe, R (1998) Profit, Directional Distance Functions, and Nerlovian
Efficiency. Journal of Optimization Theory and Applications 98, 351-364.
Dhungana, BR, Nuthall, PL, Nartea, GV (2004) Measuring the economic inefficiency of
Nepalese rice farms using data envelopment analysis. Australian Journal of Agricultural
and Resource Economics 48, 347-369.
Dyson, RG, Allen, R, Camanho, AS, Podinovski, VV, Sarrico, CS, Shale, EA (2001) Pitfalls and
protocols in DEA. European Journal of Operational Research 132, 245-259.
EC (2009) European Competitiveness Report 2008, European Commission – EC. European
Commission – EC, Brussels. Available at http://bookshop.europa.eu/en/european-
competitiveness-report-2008-pbNBAK08001/.
Erjavec, E, Rednak, M, Volk, T, Turk, J (2003) The transition from 'socialist' agriculture to the
common agricultural policy: The case of Slovenia. Post-Communist Economies 15, 557-
569.
Färe, R, Grosskopf, S, Lovell, CAK (2008a) 'Production Frontiers.' (Cambridge University Press:
New York, USA)
Färe, R, Grosskopf, S, Margaritis, D (2008b) Efficiency and Productivity: Malmquist and More.
In 'The Measurement of Productive Efficiency and Productivity Change.' (Eds HO Fried,
CA Knox Lovell, SS Schmidt.) pp. 522-621. (Oxford University Press, Inc.: New York, USA)
Fraser, I, Cordina, D (1999) An application of data envelopment analysis to irrigated dairy
farms in Northern Victoria, Australia. Agricultural Systems 59, 267-282.
Friedman, L, Sinuany-Stern, Z (1998) Combining ranking scales and selecting variables in the
DEA context: The case of industrial branches. Computers & Operations Research 25,
781-791.
Gardiner, B, Martin, R, Tyler, P (2012) 'Competitiveness, productivity and economic growth
across the european regions.' (Taylor and Francis: Covent Garden, UK)
Goetz, S, Debertin, D (2001) Why farmers quit: A county-level analysis. American Journal of
Agricultural Economics 83, 1010-1023.
Golany, B, Roll, Y (1989) An application procedure for DEA. OMEGA-International Journal of
Management Science 17, 237-250.
99
Hansson, H (2007) Strategy factors as drivers and restraints on dairy farm performance:
Evidence from Sweden. Agricultural Systems 94, 726-737.
Heinrichs, AJ, Jones, CM, Gray, SM, Heinrichs, PA, Cornelisse, SA, Goodling, RC (2013)
Identifying efficient dairy heifer producers using production costs and data
envelopment analysis. Journal of Dairy Science 96, 7355-7362.
Hennessy, T, Rehman, T (2008) Assessing the impact of the ‘decoupling’ reform of the
Common Agricultural Policy on Irish farmers’ off-farm labour market participation
decisions. Journal of Agricultural Economics 59, 41-56.
INDAP (2013a) '50 años de INDAP.' Available at http://www.indap.gob.cl/historia-de-
exito/50-anos-de-indap
INDAP (2013b) 'Comprometidos con el Mundo Rural, Programas de fomento 2010-2014.'
(Instituto de Desarrollo Agropecuario – INDAP, Ministerio de Agricultura, Gobierno de
Chile: Santiago, Chile)
INE, 2007. VII Censo Nacional Agropecuario y Forestal. Instituto Nacional de Estadística – INE,
Gobierno de Chile, Santiago, Chile.
Jaime, MM, Salazar, CA (2011) Participation in organizations, technical efficiency and
territorial differences: A study of small wheat farmers in Chile. Chilean Journal of
Agricultural Research 71, 104-113.
Kapelko, M, Horta, IM, Camanho, AS, Oude Lansink, A (2015a) Measurement of input-specific
productivity growth with an application to the construction industry in Spain and
Portugal. International Journal of Production Economics 166, 64-71.
Kapelko, M, Oude Lansink, A, upcoming. Dynamic Multi-Directional Inefficiency Analysis of
European Dairy Manufacturing Firms.
Kapelko, M, Oude Lansink, A, Stefanou, S, upcoming. Input-Specific Dynamic Productivity
Change: Measurement and Application to European Dairy Manufacturing Firms.
Kapelko, M, Oude Lansink, A, Stefanou, SE (2015b) Analyzing the impact of investment spikes
on dynamic productivity growth. OMEGA-International Journal of Management Science
54, 116-124.
Kelly, E, Shalloo, L, Geary, U, Kinsella, A, Thorne, F, Wallace, M (2012) The associations of
management and demographic factors with technical, allocative and economic
efficiency of Irish dairy farms. Journal of Agricultural Science 150, 738-754.
Kirner, L, Ortner, K, Hambrusch, J (2007) Using technical efficiency to classify Austrian dairy
farms. Die Bodenkultur 58, 15-24.
Lansink, AO, Pietola, K, Bäckman, S (2002) Efficiency and productivity of conventional and
organic farms in Finland 1994-1997. European Review of Agricultural Economics 29, 51-
65.

Chapter 4 INPUT-SPECIFIC INEFFICIENCY ANALYSIS
100
Lapar, ALM, Garcia, A, Aditto, S, Suriya, P (2005) Measuring cost efficiency in smallholder
dairy: empirical evidence from Northeast Thailand. In 'American Agricultural Economics
Association Annual Meeting. Providence, Rhode Island', 24 - 27 July 2005.
Latruffe, L (2010) 'Competitiveness, Productivity and Efficiency in the Agricultural and Agri-
Food Sectors.' (OECD Publishing: Paris, France)
Latruffe, L, Balcombe, K, Davidova, S, Zawalinska, K (2004) Determinants of technical
efficiency of crop and livestock farms in Poland. Applied Economics 36, 1255-1263.
Latruffe, L, Balcombe, K, Davidova, S, Zawalinska, K (2005) Technical and scale efficiency of
crop and livestock farms in Poland: does specialization matter? Agricultural Economics
32, 281-296.
Laureti, T, Viviani, A (2011) Competitiveness and productivity: A case study of Italian firms.
Applied Economics 43, 2615-2625.
Manevska-Tasevska, G, Hansson, H, Rabinowicz, E (2014) Input saving possibilities and
practices contributing to more efficient beef production in Sweden. Agricultural and
Food Science 23, 118-134.
Mathijs, E, Vranken, L (2001) Human capital, gender and organisation in transition
agriculture: Measuring and explaining the technical efficiency of Bulgarian and
Hungarian farms. Post-Communist Economies 13, 171-187.
MINAGRI, 1990. Ley Orgánica del Instituto de Desarrollo Agropecuario, Ministerio de
Agricultura – MINAGRI. Santiago, Chile.
Moreira, VH, Bravo-Ureta, BE (2010) Technical efficiency and metatechnology ratios for dairy
farms in three southern cone countries: A stochastic meta-frontier model. Journal of
Productivity Analysis 33, 33-45.
Moreira, VH, Bravo-Ureta, BE, Carrillo, BL, Vásquez, JA (2006) Technical efficiency measures
for small dairy farms in Southern Chile: A stochastic frontier analysis with unbalanced
panel data. Archivos de Medicina Veterinaria 38, 25-32.
Neyman, J (1934) On the Two Different Aspects of the Representative Method: The Method
of Stratified Sampling and the Method of Purposive Selection. Journal of the Royal
Statistical Society 97, 558-625.
Nganga, SK, Kungu, J, de Ridder, N, Herrero, M (2010) Profit efficiency among Kenyan
smallholders milk producers: A case study of Meru-South district, Kenya. African Journal
of Agricultural Research 5, 332-337.
O'Neill, S, Leavy, A, Matthews, A (2002) Measuring productivity change and efficiency on
Irish farms, Rural Economy Research Centre, Teagasc. Teagasc, Carlow, Ireland.
Available at
https://www.researchgate.net/profile/Alan_Matthews/publication/253356620_Measur
ing_Productivity_Change_and_Efficiency_on_Irish_Farms/links/54a13daa0cf256bf8bae
6a28.pdf.

101
OECD (2011) 'Fostering productivity and competitiveness in agriculture.' (Organisation for
Economic Cooperation and Development – OECD: Paris, France)
Otieno, DJ, Hubbard, L, Ruto, E (2012) Determinants of technical efficiency in beef cattle
production in Kenya. In 'International Association of Agricultural Economists (IAAE)
Triennial Conference. Foz do Iguacu, Brazil', 18 - 24 August 2012.
Porter, ME, Ketels, C, Delgado, M (2006) The Microeconomic Foundations of Prosperity:
Findings from the Business. In 'Global Competitiveness Report 2006 - 2007.' (Eds A
Lopez-Claros, ME Porter, X Sala-i-Martin, K Schwab.) (MacMillan, Palgrave: London, UK)
Porter, ME, Ketels, CHM (2003) 'UK competitiveness: Moving to the next stage.' (Economic
and Social Research Council: London, UK)
Pushkarskaya, H, Vedenov, D (2009) Farming exit decisions by age group: Analysis of tobacco
buyout impact in Kentucky. Journal of Agricultural and Applied Economics 41, 653-662.
Rakipova, AN, Gillespie, JM, Franke, DE (2003) Determinants of technical efficiency in
louisiana beef cattle. Journal of the ASFMRA 66, 99-107.
Simar, L, Wilson, PW (2007) Estimation and inference in two-stage, semi-parametric models
of production processes. Journal of Econometrics 136, 31-64.
Simar, L, Wilson, PW (2011) Two-stage DEA: Caveat emptor. Journal of Productivity Analysis
36, 205-218.
Simar, L, Wilson, PW (2015) Statistical Approaches for Non-parametric Frontier Models: A
Guided Tour. International Statistical Review 83, 77-110.
Singbo, A, Oude Lansink, A (2010) Lowland farming system inefficiency in Benin (West
Africa): directional distance function and truncated bootstrap approach. Food Security
2, 367-382.
Tangen, S (2003) An overview of frequently used performance measures. Work Study 52,
347-354.
Tangen, S (2005) Demystifying productivity and performance. International Journal of
Productivity and Performance Management 54, 34-46.
Tauer, LW, Mishra, AK (2006) Can the small dairy farm remain competitive in US agriculture?
Food Policy 31, 458-468.
Thanassoulis, E, Portela, M, Despić, O (2008) Data Envelopment Analysis: The Mathematical
Programming Approach to Efficiency Analysis. In 'The Measurement of Productive
Efficiency and Productivity Growth.' (Eds HO Fried, C Knox, S Schmidt.) (Oxford
University Press: New York, USA)
Uzmay, A, Koyubenbe, N, Armagan, G (2009) Measurement of efficiency using data
envelopment analysis (DEA) and social factors affecting the technical efficiency in dairy
cattle farms within the province of Izmir, Turkey. Journal of Animal and Veterinary
Advances 8, 1110-1115.
Chapter 4 INPUT-SPECIFIC INEFFICIENCY ANALYSIS
102
Vera, R (2006) Country Pasture/Forage Resource Profiles CHILE, Country Pasture Profiles,
Food and Agriculture Organization of the United Nations – FAO. Food and Agriculture
Organization of the United Nations – FAO, Rome, Italy. Available at
http://www.fao.org/ag/agp/AGPC/doc/Counprof/PDF%20files/Chile-English.pdf
http://www.fao.org/ag/agp/AGPC/doc/Counprof/Chile/cile.htm#10.
von Cramon-Taubadel, S, Saldias, R (2014) Access to credit and determinants of technical
inefficiency of specialized smallholder farmers in chile. Chilean Journal of Agricultural
Research 74, 413-420.
Zollinger, B, Krannich, R (2002) Factors Influencing Farmers' Expectations to Sell Agricultural
Land for Non-Agricultural Uses. Rural Sociology 67, 442-463.

103


Chapter 5
EVALUATION OF RURAL DEVELOPMENT PROGRAMS IN CHILE
L. M. Carter Leal, A.G.J.M. Oude Lansink, H.W. Saatkamp
Submitted to a peer reviewed international journal

Chapter 5 EVALUATION OF RURAL DEVELOPMENT PROGRAMS IN CHILE
106
Abstract
Agriculture plays an important role in the economy of rural areas. However, the low
competitiveness of agriculture has caused a vicious cycle of population decline in rural areas.
The Chilean government provides financial support through several rural development
programs to help small farmers to improve their market competitiveness and enhance family
income. Nevertheless, population decline in rural areas continues. Therefore, we
hypothesize that the current budget allocation among rural development programs, i.e.
Agricultural Development Institute (INDAP) programs, can be improved to increase the
effectiveness of each program in achieving the policy goals of improving competitiveness and
enhancing family income. The evaluation of the rural development programs consisted of
three main steps (1) identifying public support given to small farmers, (2) eliciting experts’
opinion to evaluate programs, whose responses were analyzed using a Multi criteria analysis,
and (3) developing recommendations for improvement, which were generated in a
workshop using a Nominal group technique. Our study shows that rural development policy
in Chile is strongly based on subsidies. It also shows a large variation in the allocated budget
among rural development programs, i.e. from 1% to 23%. In addition, we show that there is
a discrepancy between the allocation of the INDAP budget and the effectiveness of the rural
development programs in achieving the overall INDAP goal, as assessed by experts. Our
findings are useful for improving the effectiveness of rural development programs in Chile.
For instance, it indicates that reducing the number of INDAP programs or reallocating budget
from programs that focus on improving the quality of soil and/or prairies to programs that
focus on fostering social and organizational capital development would better facilitate the
achievement of INDAP goals. In a more general context, besides of the importance of the
specific results for Chilean rural development policy, the approach we present in this
research can be implemented in other contexts since is inexpensive, integrative, effective,
and low time consuming.
Keywords: small livestock farms, Latin America, Multi criteria analysis, Nominal group
technique.

107
5.1 Introduction
Agriculture plays an important role in the economy of rural areas, where farms and
households are both local producers and consumers (OECD 2006b). Despite its importance,
the low competitiveness of agriculture has created a vicious circle of decline in rural areas,
including emigration, aging, low education levels, low labor productivity, and overall low
levels of public service (David et al. 2000; Ramírez et al. 2001; OECD 2006b; Fawaz and
Vallejos 2011; Raggi et al. 2013; OECD 2014). Governments are increasingly aware of the
importance of a competitive agricultural sector and are developing new forms of regionally
based policy interventions to enhance productivity growth (OECD 2011; Gardiner et al. 2012;
INDAP 2014a). Accordingly, researchers and policy makers have developed long-term
strategies for farmers to sustain or rejuvenate the rural population (Chang et al. 2011).
However, these strategies have been unable to stop the global trend of migration from rural
areas (Apey and López 2011; Chang et al. 2011; Raggi et al. 2013).
The decline in rural areas is also observed in Chile, which has the highest income per
capita of all countries in Latin America (OECD 2014). Although the economy in rural areas has
moved from an agriculture-based to a services-oriented economy, agriculture still remains
crucial for rural areas in Chile (OECD 2014). Agriculture in Chile consists of two segments: (i)
a small share of large-scale, internationally competitive farms that account for the majority
of agricultural production and exports; and (ii) a large share of small sub-commercial farms
that account for a relatively small share of agricultural production (Vera 2006; OECD 2014).
Agricultural support policy in Chile focuses on the second segment, which accounts for 90%
of the total number of farms in the country (INDAP 2014a). The Agricultural Development
Institute (INDAP)1 provides programs targeted at the small farmers
2 in this segment.
The INDAP programs provide subsidies and loans to stimulate investments aimed at i)
increasing the output of a firm to achieve a minimum commercial size, or ii) improving the
skills of households, to either enhance their local employment opportunities or to relocate to
regions with better employment opportunities (INDAP 2014a).
Although the “Chilean government has sought to broaden the productive base of the
economy and to boost entrepreneurship and innovation through investments in education
and the reduction of product-market entry barriers” (OECD 2014), these investments are
apparently insufficient to make small farmers competitive and stop the migration from rural
areas (Oyarzún and Miranda 2011; WorldBank 2015; Carter Leal et al. 2016a). Studies on the
1 INDAP: Instituto de Desarrollo Agropecuario, established in 1962, belongs to the Ministry of Agriculture. 2 To receive this assistance, the farm’s size must not exceed 12 equivalent irrigated hectares (HRB) and the farmer’s
main income must be provided by farming (MINAGRI, 1990). A HRB is a measurement unit that uses soil and climate
variables to establish a production potential equivalent throughout the country.

Chapter 5 EVALUATION OF RURAL DEVELOPMENT PROGRAMS IN CHILE
108
stay-exit decision of small livestock farmers in southern Chile have identified potential
reasons for the current lack of success in reducing migration from rural areas. Specific
characteristics of farmers and their families, diversification, and social aspects of the rural
society are key issues that increase the likelihood to stay in farming (Carter Leal et al.
2016a,b,c). These studies have also highlighted the relevance of promoting on- or off-farm
work for all family members, and the necessity of reallocating agricultural subsidies.
Previous research has identified key issues for improving the effectiveness of rural
development policy. Given the continuing population decline in rural areas despite the
investments made, we hypothesize that the current budget allocation among rural
development programs provided by INDAP is inconsistent with the effectiveness of each
program in achieving the policy goals. Testing this hypothesis requires an evaluation of the
effectiveness of rural development programs in achieving the two INDAP goals: improving
the competitiveness of small farmers and increasing family incomes (MINAGRI 1990). These
two goals are seen as the tools for stopping migration from rural areas.
An evaluation process seeks to improve future decision-making (OECD 2009); hence it
helps policy makers in the formulation and reorientation of rural development programs
(Terluin and Roza 2010). Evaluating rural development programs is highly complex (OECD
2006a), and is hindered by technical difficulties, such as defining the target or vague policy
objectives. There are also socio-political and institutional difficulties, such as the integration
of scientific and lay/local knowledge, or the reluctance among policy makers to carry out
evaluations when results might demonstrate that policies have not delivered (Juntti et al.
2009; Prager et al. 2015).
These difficulties are widely recognized and an array of approaches, methods, and tools
to conduct evaluations of rural development programs have been used in developed
countries since the seventies (Terluin and Roza 2010; Jitea 2011; Carof et al. 2013; Prager et
al. 2015). However, a common framework that provides a theoretical and conceptual
context in which individual evaluation exercises can be embedded is lacking (Prager et al.
2015). Moreover, literature on the evaluation of rural development programs in Latin
America is scarce (Berdegué 2001; Pisani and Franceschetti 2011; Ramírez-Miranda 2014;
Llambí Insúa 2015). Although scarce, the existing literature highlights a few potential areas to
improve rural development programs. Pisani and Franceschetti (2011) indicated that “an
adequate implementation of policies between the regional and municipal levels is missing”
(pp 215) and that a territorial approach could be valuable for developing rural strategies in
Chile. In addition, Berdegué (2001) stated that policy and programs designed to improve the
productivity and technological and economic development of small farmers must work with
a broader set of rural organizations and groups.
The overall objective of this research was to evaluate the effectiveness of rural
development programs in Chile and to develop recommendations for improving rural

109
development programs. To achieve this objective we used widely accepted science-based
methods, which included the analysis of the effectiveness rural development programs and
the elicitation of experts’ opinions on potential improvements. The results of this study can
be used by policy makers to improve the effectiveness of rural development programs in
Chile. The remainder of this paper is structured as follows: Section 2 outlines the materials
and methods; Section 3 presents the results and discussion; and the main conclusions and
policy implications are presented in Section 4.
5.2 Materials and methods
Our approach to evaluating the effectiveness of rural development programs in Chile
involved (1) an ex-post evaluation of rural development programs, i.e. the extent to which
the objectives of rural development programs have been achieved; and (2) an investigation
of the opportunities to improve rural policy programs (Dunn 2004; Terluin and Roza 2010;
Prager et al. 2015). The ex-post evaluation used expert opinion, whereas stakeholders
identified the potential improvements in a participatory approach, using results from our
previous studies (Carter Leal et al. 2016a,b,c) as a baseline.
Before describing the methodology in detail, a brief description of the main features of
rural development programs in Chile is presented.
5.2.1 Main features of rural development programs in Chile
The overall INDAP goals are two: (1) improve the competitiveness of small farmers and
(2) enhance family incomes (MINAGRI 1990) to enable them to stay farming. To achieve
these two goals, INDAP has defined five objectives, as listed in Table 5.1.
Table 5.1. INDAP objectives.
INDAP objectives
1. Support the improvement of capabilities and skills to develop agricultural and rural enterprises
2. Development and strengthening of social capital
3. Strengthen organizational development
4. Expand and improve access to local, regional, national, and international markets
5. Facilitate access to capital (working capital and investments) to foster economic enterprises
Source: INDAP (www.indap.cl)
To achieve these five objectives, INDAP provides agricultural support to small farmers
through (i) 18 professional and technical advice programs and (ii) 13 financial programs.
Professional and technical advice programs provide subsidies that cover 50% to 100% of the
total project cost. These programs involve making investments (i) to increase the size of the

Chapter 5 EVALUATION OF RURAL DEVELOPMENT PROGRAMS IN CHILE
110
farm operation or (ii) to improve the skills of households and increase their employment
opportunities (OECD 2014). Financial programs provide loans to cover any remaining project
cost.
Although some of these programs were established as early as 1990 (INDAP 2014b), the
prioritization of programs and budget allocation is determined by the Government and
Ministry of Agriculture (MINAGRI), which can change every four years (INDAP 2014b). In
addition, monitoring of the existing INDAP programs is done by the same people who submit
the programs for approval to the INDAP budget office (INDAP 2013b). Programs are
evaluated randomly by the Chilean Budget Office (DIPRES); however these evaluations only
comprise administrative controls to check whether the assigned budget for a particular
program was spent, rather than an evaluation of the impact of the program (INDAP 2014b).
Eleven INDAP programs have been evaluated in the past decade, and only two programs
were evaluated between 2010 and 2014 (DIPRES 2015).
5.2.2 Approach for the evaluation of rural development programs in Chile
Our approach to rural development programs evaluation consisted of three main steps:
(1) identifying public support given to small farmers, (2) eliciting experts’ opinions to
evaluate programs, and (3) developing recommendations for improvement. Each step used
different methods as shown in Figure 5.1.
Figure 5.1. Methods used, sources of information, and outputs in each step of the approach
used for evaluating and improving the effectiveness of INDAP programs.
Inventory and description of public support programs
Step 1
Evaluating public support programs
Step 2
SIAC INDAP website
Collecting & analysis of secondary information
Description of INDAP programs
Elicitation of experts opinion
INDAP programs ranked based on experts’
opinion Multi-criteria analysis
Online survey “Perceptions about INDAP programs”
Recommendations to improve the
effectiveness of INDAP programs
Nominal group technique
Workshop
INDAP programs ordered by budget allocation
INDAP programs ordered by budget allocation
INDAP programs ranked based on experts’ opinion
Studies on characteristics of farmers, their families, and their
farms
Identifying recommendations
Step 3
Method(s) Source(s) of information Output(s)

111
Step 1. Inventory and description of INDAP programs
In this step, we identified and briefly described the support programs provided during
the last five years, i.e. from 2011 up to 2015. Furthermore, we collected information to
identify the budget allocated to each support program.
To identify support programs and budget allocation, we used two complementary
sources of secondary information: the Integral System of Citizen Service (SIAC) and the
INDAP website. SIAC provided the name, goal and scope, starting date (and ending date if
applicable), and budget of each program. The INDAP website3 provided the name, goals,
description, scope, benefits, requirements, and place to apply. Information on the budget
provided during the last three years was also available from the INDAP website. We focused
on agricultural subsidies, as this type of support is the predominant component of public
policy for rural development (OECD 2006b).
Step 2. Evaluating public support programs using Multi Criteria Analysis (MCA).
In this step, the INDAP programs are ranked using expert opinion. Experts’ responses
were elicited using an on-line questionnaire4. The questionnaire focused on professional and
technical advice programs, which accounted for 55.5% of the total INDAP budget. Financial
programs were excluded, as they focus solely on covering the costs that are not already
covered by the professional and technical advice programs. We included the programs that
accounted for 97% of the budget spent on subsidies, as grouped by the Budget Law. The
questionnaire consisted of two sections: a section where respondents were asked to score
the effectiveness of INDAP programs, and a section where respondents were asked to weight
the importance of the different INDAP objectives in achieving the overall INDAP goals. In
addition, the opportunity to suggest one additional objective was offered.
The experts’ responses were used in a MCA. MCA establishes preferences between
alternatives for an explicit set of objectives (and measureable criteria), to assess the extent
to which the objectives have been achieved (Munda 2004; Mourits et al. 2010; Gamper and
Turcanu 2015). An extensive review of the use of MCA in agricultural systems can be found
in Hayashi (2000).
We performed the MCA using the step-wise procedure suggested by Dodgson et al.
(2009) and Gamper and Turcanu (2015). This included the following steps: a) establishing the
decision context, aim and identification of stakeholders; b) identification of criteria; c)
identification of alternatives; d) scoring; e) weighing; f) calculating overall values; and g)
sensitivity analysis.
3 http://www.indap.gob.cl/programas 4This document is available upon request to authors.

Chapter 5 EVALUATION OF RURAL DEVELOPMENT PROGRAMS IN CHILE
112
Step a. The broad long list of experts was constructed using a web search among individuals
working in different institutions and in various different capacities in Chile, such as
government institutions, parliamentary committees, non-government organizations,
advisory firms, universities, and research centers. The web search resulted in a broad long
list of one hundred fifty potential experts involved in farming in Chile. After a first email
approach, thirty six experts responded. Some of them referred other experts in agriculture,
which resulted in an addition of another 32 experts, i.e. a final long list of 68 farming experts.
Out of this list, 37 were not considered to be experts on small livestock farming (most of
them were doing in administrative labor or working outside of the study area). Therefore,
the final list of experts in small livestock farming included 31 persons.
Complete answers were received from 21 experts: eight academics and researchers,
three agricultural advisors, three MINAGRI representatives, three INDAP representatives,
and four representatives of the Regional Government (GoRe). This study included three
administrative regions of southern Chile: La Araucanía, Los Ríos, and Los Lagos.
Consequently, at least one representative from government institutions for each of the three
regions were this study was developed was required.
Step b. This step aimed to facilitate the scoring process. Criteria can be either defined in an
iterative process (Gamper and Turcanu 2007; Mourits et al. 2010) or taken as given
(Dodgson et al. 2009). Within the scope of this research, it was not possible to conduct an
iterative process. Therefore, we used the formally stated INDAP objectives as proper criteria
to measure the outcomes of rural development programs in Chile (Dunn 2004). These
objectives are listed in Table 5.1.
Step c. The alternatives that contribute to the achievement of the INDAP objectives consisted
of the existing professional and technical advice INDAP programs.
Step d. Experts scored the expected performance of an INDAP program in achieving each
INDAP objective on a five-point Likert scale ranging from 0 (the program does not help in
achieving the INDAP objective at all) to 4 (the program fully (100%) supports the
achievement of the INDAP objective). Cronbach’s alpha test was used to test the internal
consistency of the scores for each INDAP objective (Lattin et al. 2003). A test statistic value of
0.7 was considered sufficient to conclude that internal consistency was satisfactory.
Step e. The weights for each of the INDAP goals were based on the results of the online
questionnaire. We considered only the responses given by policy makers, i.e. representatives
of INDAP, MINAGRI, and GoRe. We assumed that the experience and knowledge of policy
makers enable them to better appreciate the potential trade-offs among the objectives
(Dodgson et al. 2009). They were asked to allocate 100 points among the five INDAP
objectives, according to their relative importance in achieving the INDAP goals: improving

113
competitiveness of small farmers and increasing family income. We received complete
answers from eight policy makers.
Step f. The overall value for each INDAP program was calculated as the sum of the weighted
scores across the five objectives. Weighted scores were obtained by multiplying a program’s
score on an objective by the objective’s average weight. The programs were ranked and then
compared with the budget allocation among programs. A Spearman’s rank correlation was
computed to determine the correlation between these two rankings, i.e. INDAP budget
allocation versus expert assessment of effectiveness of INDAP programs.
Step g. To test the robustness of the MCA outcomes to changes in the weights for the
objectives, we recalculated the overall value using (1) the weights from all experts, and (2)
equal weights for all criteria (0.2 for each objective).
Step 3: Identifying recommendations for improving INDAP programs
The information collected in previous steps was the main input for a one-day workshop
with experts; the workshop was designed to generate recommendations to improve the
effectiveness of INDAP programs. In this workshop we sought to exploit the exchange of
information among participants whose areas of expertise differ; this provides better
judgment compared with individuals working separately (Dodgson et al. 2009).
Fourteen experts participated in the one-day workshop, which was held on August 3,
2015 in Valdivia, southern Chile, the heart of the study area. Two weeks before the
workshop, participants were asked to fill in the on-line survey described in Step 2.
Furthermore, one week before the workshop, the participants received a ‘brief description of
the methods used and the preliminary findings’ of our previous studies (Carter Leal et al.
2016b, 2016a, 2016c).
The workshop started with a session in which the experts were presented with the
results of our previous studies. The presentation also included an overview of the INDAP
budget allocation and the expert assessment of effectiveness of INDAP programs. The
remainder of the workshop was used to elaborate recommendations to improve the
effectiveness of INDAP programs. To this end, we used a problem-solving approach called
the nominal group technique (NGT), initially developed by Delbecq et al. (1975) and since
modified and adapted by others (see McMillan et al. (2014)).
NGT facilitates the generation of ideas in relation to problems, solutions, or both, which
are discussed and ranked in order of priority by individual participants. The technique
identifies satisfactory courses of action by sharing and combining the opinions of different
individuals, which have various backgrounds, positions, and perspectives. The process is
highly structured, to ensure equal participation and to avoid any individual dominating the
process. Furthermore, the method requires less time and resources than other consensus

Chapter 5 EVALUATION OF RURAL DEVELOPMENT PROGRAMS IN CHILE
114
methods, such as the Delphi technique (Motsenbocker and Hinson 2003; Boddy 2012;
McMillan et al. 2014). Although NGT has been widely used in areas such as health,
academics, consumer and market research, and extension, its use in agriculture is still limited
(Motsenbocker and Hinson 2003). We applied the four steps of the NGT as proposed by
Delbecq et al. (1975). In addition, we considered the time planning review done by McMillan
et al. (2014) as a reference for time allocation.
Before starting the NGT, experts were grouped into two teams of seven people, which
is the recommended group size for this technique (Delbecq et al. 1975; McMillan et al.
2014). At least one representative for each area of expertise was assigned to each group.
The time available for the workshop was limited, therefore we grouped INDAP programs into
three groups according to their main focus, before asking experts to elaborate
recommendations. Group 1 included programs that mainly focus on providing technical
advice and developing farmer skills. Group 2 included programs that mainly focus on
fostering and developing alternative businesses for specific target groups and improving the
basic knowledge and/or infrastructure of the farming system. Group 3 included programs
that focus on soil and prairie improvements (Table 5.2).
Table 5.2. INDAP professional and technical advice programs, grouped according to their main focus
area.
INDAP professional and technical advice programs
Group 1: focus on providing technical advice and developing farmer skills to improve production and
commercialization
Local Development Service for Rural Communities – PRODESAL (PDL)
Productive Articulations (Vertical-integration contract) (PA)
Services for Development of Productive and Entrepreneurial Abilities (DPEA)
Group 2: focus on fostering and developing alternative agribusinesses for specific target groups and improving
the basic knowledge and/or infrastructure of the farming system
Program for Development of Indigenous Territorial Development & Program Origins (ITD)
Program for Development of Investments (PDI)
Technical Advisory Services (SAT)
Training Program for Rural Women INDAP-PRODEMU (PDM)
Group 3: focus on soil and prairie improvements
System of Incentives for the Agro-ecological Sustainability of Agricultural Soils - Law N° 20,412 (IAS)
Irrigation (IP)
Supplementary prairies (SP)
The question used during NGT was: what alternatives, issues, or areas can be identified
for INDAP programs of group 1, 2, or 3 to improve their effectiveness in achieving INDAP
goals? This question was followed by the four steps of the NGT: writing down ideas (20
minutes), round-robin recording of ideas (30 minutes), discussion for clarification and

115
evaluation (30 minutes), and individual voting to prioritize ideas (10 minutes). This procedure
was performed for all three groups of INDAP programs and took one and a half hours for
each group. After the three sessions, each team of experts ended with three sets of ranked
recommendations to increase the effectiveness of the groups of INDAP programs in
achieving INDAP goals. To obtain a final set of recommendations, we selected the three most
preferred recommendations from each team for each group of INDAP programs. If one of
the most preferred recommendations was similar between teams, the next most preferred
recommendation was selected as a replacement.
5.3 Results and discussion
5.3.1 INDAP programs and resource allocation
The agricultural support programs provided by INDAP during the period from 2011 to
2015 are shown in Table 5.3, along with the average budget allocation for each program
during this period.

Chapter 5 EVALUATION OF RURAL DEVELOPMENT PROGRAMS IN CHILE
116
Table 5.3. INDAP programs and their budget allocation (average budget during the period 2011 to
2015).
INDAP item (as expressed in the Budget Law of INDAP) Acronym Budget
(€1,000)
Budget
%
% within
program type
Total Budget (as annual average from 2011 to 2015)
326,883.9 100.0
Professional and technical programs
181,315.4 55.5 100.0
1. Local Development Service for Rural Communities –
PRODESAL PDL 42,328.7 12.9 23.3
2. System of Incentives for the Agro-ecological
Sustainability of Agricultural Soils - Law N° 20,412 IAS 31,390.3 9.6 17.3
3. Program for Indigenous Territorial Development &
Program Origins ITD 30,244.7 9.3 16.7
4. Program for Development of Investments PDI 20,133.1 6.2 11.1
5. Irrigation IP 19,500.5 6.0 10.8
6. Technical Advisory Services SAT 15,247.6 4.7 8.4
7. Productive Articulations (Vertical-integration
contract) PA 9,530.8 2.9 5.3
8. Supplementary prairies SP 3,223.2 1.0 1.8
9. Training Program for Rural Women INDAP-
PRODEMU PDM 2,590.3 0.8 1.4
10. Services for Development of Productive and
Entrepreneurial Abilities DPEA 2,227.4 0.7 1.2
11. Others (PADIS, financial articulations, insurance,
software, emergencies, etc.) 4,898.9 1.5 2.7
Financial programs
92,403.4 28.3 100.0
12. Short-term loans
62,528.5 19.1 67.7
13. Long-terms loans
27,571.9 8.4 29.8
14. Revolving funds - Law 18,450
2,303.0 0.7 2.5
Administrative costs
53,165.0 16.2
Source: INDAP web site and Integral System of Citizen Service (SIAC) (INDAP 2014b).
Professional and technical advice programs account for 55.5% of the total INDAP
budget, whereas financial programs account for 28.3%. The remaining 16.2% of the budget is
used for administrative purposes. The large share of the budget given to professional and
technical advice programs (i.e. subsidies) confirms the findings of the OECD (2006b), that
subsidies are the predominant component of rural development programs. INDAP (2014a)
reported that 60% of its budget is used for subsidies and 40% for loans. However, we found
the share of the budget allocated to subsidies to be slightly higher (66%).
The last column of Table 5.3 shows the budget allocation for each program as a
percentage of the total budget allocated to the type of program: professional and technical
advice programs and financial programs. The variation in budget allocation among
professional and technical advice programs is large. For example, PDL, which mainly focuses
on providing technical advice to farmers, uses almost 25% of the budget. In contrast, the

117
programs that focus on providing support for women to develop agribusinesses (PDM) or
support for farmers to develop entrepreneurial skills (DPEA) use less than 2% of the budget.
The SAT and PA programs, which focus on increasing the competitiveness of existing
agribusiness, use 8.4% and 5.3% of the budget, respectively. The budget allocation among
financial programs indicates that most of this budget is used to provide short-term loans, i.e.
less than one year, and 30% is used to provide long-term loans.
We suggest that there are two main disadvantages of the current budget allocation
among INDAP programs. Firstly, only a very small share of the INDAP budget is allocated to
programs focusing on improving the quality of social capital, even though this is vital for rural
development and economic growth (Kinsella et al. 2010; Prager et al. 2015). Secondly,
although the INDAP programs are mid-term oriented (i.e. four years), farmers have to apply
for funds annually. Therefore, farmers cannot automatically rely on INDAP support when
making long-term decisions, which could constrain the effectiveness of INDAP programs.
Moreover, the support may also depend on the political situation. Farmers perceive a risk
that the program changes, or ceases to exist, every time a new government is elected. In this
regard, Shucksmith (2000) indicated that short-term programs are inadequate for long-term
development processes.
5.3.2 Valuation of the INDAP programs
Tables 5.4-5.6 and Figure 5.2 summarize the responses given by the experts for the
performance scores for each INDAP program (alternative) and the weights given to the
INDAP objectives (criteria).

Chapter 5 EVALUATION OF RURAL DEVELOPMENT PROGRAMS IN CHILE
118
Table 5.4. Performance scores, as the average across all the experts, of the INDAP programs for each
INDAP objective.
INDAP professional and technical advice programs
Performance scores for each INDAP
objective
1 2 3 4 5
1. Local Development Service for Rural Communities –
PRODESAL PDL 2.5 2.8 2.4 2.3 2.1
2. System of Incentives for the Agro-ecological
Sustainability of Agricultural Soils - Law N° 20,412 IAS 2.1 1.0 1.1 2.1 2.1
3. Program for Indigenous Territorial Development &
Program Origins ITD 2.5 2.6 2.0 1.9 1.8
4. Program for Development of Investments PDI 1.5 1.4 1.8 2.1 2.9
5. Irrigation IP 2.0 1.4 1.1 2.0 2.4
6. Technical Advisory Services SAT 2.8 2.1 2.1 2.8 2.0
7. Productive Articulations (Vertical-integration contract) PA 2.9 2.8 2.1 2.9 2.3
8. Supplementary prairies SP 2.0 1.4 1.1 2.0 2.1
9. Training Program for Rural Women INDAP-PRODEMU PDM 2.1 3.3 2.8 2.0 1.5
10. Services for Development of Productive and
Entrepreneurial Abilities DPEA 3.1 2.3 2.5 2.8 2.5
Note: Cronbach’s alpha values for criteria were: 1 = 0.88, 2 = 0.87, 3 = 0.88, 4 = 0.95, and 5 = 0.92.
The Cronbach’s alpha values for the performance scores in Table 5.4 were all greater
than 0.7. Hence, the performance scores are internally consistent and can be used for
making inferences. The results in Table 5.4 show that none of the programs scored extreme
values for any INDAP objective, i.e. either 0 or 4 points. The highest score was 3.3 and was
attributed to the PDM program for objective 2. This is consistent with our expectations, as
PDM is a program that aims to improve the capabilities and skills of female farmers to
develop agricultural and rural enterprises and objective 2 relates to developing and
strengthening social capital. The lowest score, i.e. 1.0, was attributed to IAS and was also for
objective 2. This result is also in line with our expectations, as IAS is a program that solely
aims to improve soil quality. Overall, the performance scores suggest that the experts
perceive most of the INDAP programs to support the achievement of INDAP objectives.
Nevertheless, considering a value of 2.0 as fairly neutral, there are several scores below 2.0
in Table 5.4, which suggests that these programs are relatively ineffective in achieving an
objective.
Table 5.5 shows the weights that were assigned to each INDAP objective by the policy
makers.

119
Table 5.5. Average weights for INDAP objectives.
INDAP objectives (criteria) Average weights
(sum=100)
1. Support the improvement of capabilities and skills to develop agricultural and rural
enterprises 22
2. Development and strengthening of social capital 20
3. Strengthen organizational development 23
4. Expand and improve access to local, regional, national, and international markets 16
5. Facilitate access to capital (working capital and investments) to foster economic
enterprises 19
The experts who were asked to provide weights also had the opportunity to suggest an
additional objective. However, none of the experts used this option, which could indicate
that experts perceive the INDAP objectives to be adequate.
The weights in Table 5.5 show that policy makers perceive the five objectives to be
relatively similar in importance. The objectives with the highest weights (23% and 22%) are
objectives 3 and 1, which focus on the development of organizational and personal
capabilities and skills, respectively. The objective with the lowest weight (16%) is objective 4,
which focuses on increasing access to local, regional, national, and international markets.
The latter outcome is unexpected, as one of the formally announced INDAP objectives is to
make small farmers competitive in world markets (MINAGRI 1990; INDAP 2013a). The results
suggest that policy makers place more priority on improving capabilities to develop rural
enterprises (personal or organizational). This is in line with results from Kinsella et al. (2010),
who stressed the importance of social capital for development and economic growth of rural
areas.
Table 5.6 shows the overall value for each INDAP program (computed as the weighted
sum of the performance scores across all INDAP objectives) and their final rank.
Table 5.6. Overall value for each INDAP program and their final rank.
INDAP professional and technical advice programs Overall
value
Final
rank
1. Local Development Service for Rural Communities – PRODESAL PDL 2.41 3
2. System of Incentives for the Agro-ecological Sustainability of Agricultural
Soils - Law N° 20,412 IAS 1.68 10
3. Program for Indigenous Territorial Development & Program Origins ITD 2.17 6
4. Program for Development of Investments PDI 1.90 7
5. Irrigation IP 1.75 8
6. Technical Advisory Services SAT 2.34 5
7. Productive Articulations (Vertical-integration contract) PA 2.56 2
8. Supplementary prairies SP 1.70 9
9. Training Program for Rural Women INDAP-PRODEMU PDM 2.35 4
10. Services for Development of Productive and Entrepreneurial Abilities DPEA 2.63 1

Chapter 5 EVALUATION OF RURAL DEVELOPMENT PROGRAMS IN CHILE
120
The results of the overall performance in Table 5.6 show that DPEA is ranked first with
an overall value of 2.63, whereas IAS is ranked tenth with an overall value of 1.68.
Table 5.6 shows that DPEA has the highest total performance score, i.e. 2.63 points,
even though this program received the smallest share of the INDAP budget, only 1.2% (Table
5.3). Similarly, the PA program, which aims to develop entrepreneurial skills, has the second
highest overall score, even though it accounts for only 5.3% of the budget. The IAS program,
which aims to improve soil quality, has the lowest overall score (1.68 points). This program
receives a relatively large share of the INDAP budget, 17.3% of the total budget. For many of
the programs, our results show a large discrepancy between the performance assessment
using expert opinion and the INDAP budget allocation.
Table 5.7 shows the INDAP programs and their ranking according to both the INDAP
budget allocation and the overall value from the performance assessment using expert
opinion.
Table 5.7. Ranking of INDAP programs according to their budget allocation and overall value from the
performance assessment using expert opinion.
INDAP professional and technical advice programs
Ranked by
INDAP
budget
Overall
value
1. Local Development Service for Rural Communities – PRODESAL PDL 1 3
2. System of Incentives for the Agro-ecological Sustainability of Agricultural
Soils - Law N° 20,412 IAS 2 10
3. Program for Indigenous Territorial Development & Program Origins ITD 3 6
4. Program for Development of Investments PDI 4 7
5. Irrigation IP 5 8
6. Technical Advisory Services SAT 6 5
7. Productive Articulations (Vertical-integration contract) PA 7 2
8. Supplementary prairies SP 8 9
9. Training Program for Rural Women INDAP-PRODEMU PDM 9 4
10. Services for Development of Productive and Entrepreneurial Abilities DPEA 10 1
Note: No significant correlation was found (Spearman’s coefficient rs = -0.382, P value = 0.276)
Table 5.7 shows a number of large differences between the ranking based on the
INDAP budget and the ranking from the performance assessment. The difference in ranking
for the IAS and DPEA programs is particularly notable. A Spearman rank correlation test of
the two rankings suggests that there is no significant correlation (Spearman’s coefficient rs =
-0.382, P value = 0.276) between the two rankings. With the exception of PDL, the top five
INDAP programs, which accounted for 80% of INDAP budget (Table 5.3), are the programs
assessed as being less effective in achieving the overall INDAP goals. This finding suggests
that the importance implicitly given to each INDAP program, as reflected in the budget

121
allocation, is inconsistent with the expert assessment of the importance of each program in
achieving the overall INDAP goals.
Figure 5.2. The aggregate INDAP budget allocation and the aggregate overall value from the
performance assessment for the ten INDAP programs.
Figure 5.2 provides a further illustration of the discrepancy between the importance of
the programs as reflected in the budget allocation and the performance as assessed by
experts. The x-axis shows the INDAP programs, in order of their budget allocation from
lowest to highest. The dashed line indicates aggregate budget allocation, whereas the dotted
line indicates the aggregate overall value from the performance assessment using expert
opinion. Figure 5.2 shows that the first five programs accounted for less than 20% of the
INDAP budget, i.e. DPEA, PDM, SP, PA, and SAT. These programs mainly focus on improving
the capabilities and skills of farmers to increase their competitiveness, with the exception of
SP. The remaining five programs accounted for 80% of the INDAP budget. These programs
focus mainly on either improving basic knowledge and infrastructure (i.e. PDI, ITD, and PDL),
or improving soil and prairie quality (i.e. IP and IAS). If the INDAP budget allocation was
consistent with the performance assessment using expert opinion, then the aggregate INDAP
budget allocation line would coincide with the aggregate overall value line.
0.0
0.1
0.2
0.3
0.4
0.5
0.6
0.7
0.8
0.9
1.0
0.0
0.1
0.2
0.3
0.4
0.5
0.6
0.7
0.8
0.9
1.0
DPEA PDM SP PA SAT IP PDI ITD IAS PDL
The aggregate INDAP budget allocation and the aggregate overall value for the ten INDAP programs
Aggregate INDAP budget allocation Aggregate overall value

Chapter 5 EVALUATION OF RURAL DEVELOPMENT PROGRAMS IN CHILE
122
The sensitivity analysis shown that only the ranking of PDM and SAT changed across the
different weight sets. The PDM shifted from the fourth rank (weights from policy makers
only) to the fifth rank (weights from all experts and equal weights), whereas SAT shifted from
the fifth rank (policy makers only) to the fourth rank (all experts and equal weights).
Therefore, we consider the MCA results to be robust to realistic changes in the weights for
the INDAP objectives.
5.3.3 Elaborating recommendations for improving the effectiveness of INDAP
programs
The NGT method was employed to generate recommendations for improving the
effectiveness of INDAP professional and technical advice programs. Twenty six
recommendations were developed by each team of experts for INDAP programs focusing on
providing technical advice and developing farmer skills to improve production and
commercialization (Group 1). Fourteen and seventeen recommendations were developed by
expert team 1 and 2, respectively, for INDAP programs focused on fostering and developing
alternative agribusinesses for specific target groups and improving the basic knowledge
and/or infrastructure of the farming system (Group 2). Nineteen and fifteen
recommendations were developed by expert team 1 and 2, respectively, for INDAP programs
focused on soil and prairie improvements (Group 3). All these ideas were openly discussed
and clarified by the experts before the silent voting process. The six most voted
recommendations were considered as the final ones for improving the effectiveness of
INDAP programs (Table 5.8).

123
Table 5.8. Set of most voted recommendations for improving the effectiveness of groups of INDAP
programs.
Group 1:
Recommendations for programs that focus on providing technical advice and developing farmer skills to improve
production and commercialization
1 Design/foster programs by age and cultural features (territorial approach), including programs for fostering
farm succession.
2 Foster diversification and added value, as key factors for increasing efficiency (productive and economy).
3 Implement participatory systems for intervention/generation of information, foster improvements, and a
better use of resources.
4 Design programs for fostering associations (anthropological and sociological) and organizational capabilities
for innovation and technology.
5 Promote associations between INDAP and public and private organizations, universities, rural schools, etc.
6 Design programs to support externalities.
Group 2:
Recommendations for programs that focus on fostering and developing alternative agribusinesses for specific
target groups and improving the basic knowledge and/or infrastructure of the farming system
1 Foster added value to raw material.
2 Improve technical and financial skills of advisors for making recommendations and follow-up.
3 Increase the scope and amount of money for investment and technical advice programs according to
producer capacity and long-term development plan.
4 Include social science specialists for development and evaluation of programs.
5 Foster investment using other financial resources for producers with good credit behavior.
6 Foster contract farming, ensuring working capital.
Group 3:
Recommendations for programs that focus on soil and prairie improvements
1 Review of technical guidelines, adjusting them by animal types and environmental conditions.
2 Define policies clearly, avoid paperwork.
3 Evaluation based on productive/economy levels, including long-term agreements.
4 Foster a territorial and participatory approach for programs.
5 Modify the Water Law.
6 Subsidies for mechanical work on farms.
Recommendations for the first group of programs mainly focus on fostering programs
to improve social capital in rural areas. The recommendations indicate that age, farm
succession, and cultural features are essential aspects for developing programs. The
recommendations also highlight the importance of stimulating participatory approaches for
intervention and generation of information for a better use of available resources. A
participatory approach has been mentioned by Pisani and Franceschetti (2011) as an
appropriate tool for developing rural strategies. The association with private and public
organizations is perceived by experts as valuable for increasing the effectiveness of these
programs. This finding is consistent with Berdegué et al. (2001), who mentioned that rural
development programs must work with a broad set of organizations and groups. In addition,
experts also recommended the diversification of production and adding value to raw

Chapter 5 EVALUATION OF RURAL DEVELOPMENT PROGRAMS IN CHILE
124
products, which could also be alternatives for counteracting externalities (also
recommended).
Recommendations for the second group of programs focus on three main aspects:
production system, advisor skills, and budget for investment. The recommendations in this
group suggest adding value to production and enhancing contract farming as tools to
increase income and ensure working capital. Among these recommendations, one
specifically addresses the need to improve the skills of advisors, in the areas of advice and
monitoring. This is an interesting finding, as it was recognized not only by policy makers and
researchers, but also by the advisors themselves. Advisors appear to be aware that their skill
levels are inadequate to help farmers become more competitive, either by fostering
alternative businesses or improving basic knowledge and infrastructure. The experts also
recommended that social science specialists be included when designing and evaluating rural
development programs. Finally, the experts recommended that the INDAP programs should
broaden their scope and increase investment, either public or private, based on a long-term
development and monitoring plan.
Recommendations for the third group of programs are mainly focused on redesigning
the technical parameters of these programs, considering a territorial and participatory
approach and long-term evaluation based on both productivity and economic parameters. In
addition, fostering subsidies for mechanical work on farms is recommended. The necessity
for modification of the Water Law was also mentioned. However, this suggestion is beyond
the scope of INDAP and should be addressed by the appropriate authority, i.e. Ministry of
Public Works.
The recommendations are in agreement with the most recent INDAP strategic plan,
INDAP (2014a) “Strategic Plan 2014 – 2018”: foster innovation, diversification, investment,
human capital development and associativity, and improve quality and added-value of
products, among others. Two recommendations in Table 5.8 are not addressed in this
strategic plan: the need for better training of advisors and the need to include social science
specialists when developing and evaluating rural development programs.
5.4 Conclusions and policy implications
This paper evaluated the INDAP professional and technical advice programs in Chile,
and made recommendations to improve their effectiveness. Firstly, we gathered publicly
available information on rural development programs and compared the budget allocation
among programs with an assessment of program performance using expert opinion. Next,
we used the results of this analysis along with recent studies on characteristics of small
125
farmers in Chile as the basis for a one-day workshop with experts to develop
recommendations for improving INDAP programs.
Our study used MCA to evaluate rural development programs and NGT to develop
recommendations to improve their effectiveness. We found the combination of these two
methods to be an inexpensive, integrative, effective, and low time-consuming way of
evaluating rural development programs. The structuring feature of the NGT application was
appreciated by the experts who contributed to this research and considered helpful for
developing recommendations to improve the effectiveness of INDAP programs.
Our study shows that rural development policy in Chile is strongly based on subsidies,
which account for 66% of the INDAP budget for support programs. The results also show a
large variation in the allocated budget among these programs, i.e. from 1% to 23%. Programs
that focus on improving the quality of social capital account for less than 20% of the INDAP
budget, whereas programs that aim to improve the basic knowledge and infrastructure and
the quality of soil/prairies account for 80% of the budget.
The MCA results show that experts perceive the programs that focus on improving the
quality of social capital as being more effective in achieving the INDAP goals. The experts
perceive that programs focusing on improving the quality of soil/prairies are less effective.
Hence, there is a discrepancy between the allocation of the INDAP budget during the last six
years and the effectiveness of the programs in achieving the overall INDAP goal, as assessed
by the experts.
Based on our results, we suggest the following six recommendations for improving the
effectiveness of rural development programs in Chile.
- Reduce the current number of professional and technical advice programs. This would
better facilitate the achievement of INDAP goals, as some programs contribute little to
the achievement of INDAP goals.
- Reallocate budget from programs that focus on improving the quality of soil/prairies to
programs that focus on fostering social and organizational capital development. For
example, some of the budget currently allocated to IAS could be reallocated to other
programs, such as DPEA, PA, and PDM.
- Design new programs that focus on fostering social and organizational capital
development. Since programs, such as DPEA and PA, are among the most effective
ways to achieve INDAP goals.
- Reduce the risk for farmers that is associated with the annual application for INDAP
funding. Decreasing the frequency with which farmers have to apply for funding would
make it easier for farmers to make long-term investment decisions and improve the
effectiveness of INDAP programs.
- Use a territorial and participatory approach when designing strategies for rural
development.

Chapter 5 EVALUATION OF RURAL DEVELOPMENT PROGRAMS IN CHILE
126
- Improve the advisors’ skill level in the areas of advice and monitoring.

127
Acknowledgements
This research was financially supported by CONICYT (National Commission for Scientific
and Technological Research) of the Chilean Government through the BecasChile Program.
The authors would like to thank the farmers who kindly provided data for this study and the
agriculture advisors for helping with the data collection.

Chapter 5 EVALUATION OF RURAL DEVELOPMENT PROGRAMS IN CHILE
128
References
Apey, A, López, I, 2011. Agricultura chilena, información social y productiva según tamaño
del productor y localización geográfica, VII Censo Nacional Agropecuario y Forestal,
2007. Oficina de Estudios y Políticas Agrarias – ODEPA, Ministerio de Agricultura,
Gobierno de Chile, Santiago, Chile.
Berdegué, JA (2001) Cooperating to compete: associative peasant business firms in Chile.
Wageningen University.
Berdegué, JA, Ramírez, E, Reardon, T, Escobar, G (2001) Rural nonfarm employment and
incomes in Chile. World Development 29, 411-425.
Boddy, C (2012) The Nominal Group Technique: an aid to Brainstorming ideas in research.
Qualitative Market Research: An International Journal 15, 6-18.
Carof, M, Colomb, B, Aveline, A (2013) A guide for choosing the most appropriate method for
multi-criteria assessment of agricultural systems according to decision-makers’
expectations. Agricultural Systems 115, 51-62.
Carter Leal, LM, Oude Lansink, A, Saatkamp, H, 2016a. Factors affecting farm technical
efficiency of small livestock farmers in southern Chile. Wageningen, the Netherlands.
Carter Leal, LM, Oude Lansink, A, Saatkamp, H, 2016b. Factors influencing the stay-exit
decision of small livestock farmers: Empirical evidence from southern Chile.
Wageningen, the Netherlands.
Carter Leal, LM, Oude Lansink, A, Saatkamp, H, 2016c. Improving competitiveness of small
livestock farmers: An empirical input-specific inefficiency analysis in southern Chile.
Wageningen, the Netherlands.
Chang, K, Langelett, G, Waugh, A (2011) Health, Health Insurance, and Decision to Exit from
Farming. Journal of Family and Economic Issues 32, 356-372.
David, M, Dirven, M, Vogelgesang, F (2000) The Impact of the New Economic Model on Latin
America’s Agriculture. World Development 28, 1673-1688.
Delbecq, A, van de Ven, A, Gustafson, D (1975) 'Group techniques for program planning a
guide to nominal group and Delphi processes.' Available at
http://books.google.com/books?id=1jhHAAAAMAAJ
DIPRES (2015) 'Evaluación de Programas.' Available at http://www.dipres.gob.cl/595/w3-
propertyvalue-
15504.html?rnd=0.2772&_q=offset%3D0%26limit%3D2000%26cid%3D10%2C20%26pv
id%3Dselforchild%3A15151%2C15162%2C15154%2C22293%26pvid1%3Dselforchild%3
A14572%26pvid2%3D3072
Dodgson, J, Spackman, M, Pearman, A, Phillips, L (2009) Multi-criteria analysis: a manual.
Department for Communities and Local Government: London Available at
http://eprints.lse.ac.uk/12761/.

129
Dunn, WN (2004) 'Public policy analysis : an introduction.' (Pearson/Prentice Hall: Upper
Saddle River, New Jersey, USA)
Fawaz, J, Vallejos, R (2011) Calidad de vida, ocupación, participación y roles de género: un
sistema de indicadores sociales de sostenibilidad rural (Chile). Cuadernos de Desarrollo
Rural 8, 45-68.
Gamper, C, Turcanu, C (2007) On the governmental use of multi-criteria analysis. Ecological
Economics 62, 298-307.
Gamper, C, Turcanu, C (2015) Multi-criteria analysis: a tool for going beyond monetization?
In 'The Tools of Policy Formulation Actors, Capacities, Venues and Effects.' ('Edward
Elgar Publishing, Inc.': Cheltenham, UK)
Gardiner, B, Martin, R, Tyler, P (2012) 'Competitiveness, productivity and economic growth
across the european regions.' (Taylor and Francis: Covent Garden, UK)
Hayashi, K (2000) Multicriteria analysis for agricultural resource management: A critical
survey and future perspectives. European Journal of Operational Research 122, 486-
500.
INDAP (2013a) '50 años de INDAP.' Available at http://www.indap.gob.cl/historia-de-
exito/50-anos-de-indap
INDAP, 2013b. Resolución Exenta No 042860. 00702013. Instituto de Desarrollo
Agropecuario – INDAP, Ministerio de Agricultura, Gobierno de Chile, Santiago. 042860:
4.
INDAP (2014a) 'Lineamientos Estratégicos 2014 - 2018 Por un Chile rural inclusivo.' (Instituto
de Desarrollo Agropecuario – INDAP, Ministerio de Agricultura, Gobierno de Chile:
Santiago, Chile)
INDAP, 2014b. Respuesta SIAC - INDAP. Instituto de Desarrollo Agropecuario – INDAP,
Ministerio de Agricultura, Gobierno de Chile, Santiago, Chile.
Jitea, IM (2011) Appropriate Methods for Evaluating the Agricultural Policies Consequences
at the Farm Level. Notulae Botanicae Horti Agrobotanici Cluj-Napoca 39, 126-133.
Juntti, M, Russel, D, Turnpenny, J (2009) Evidence, politics and power in public policy for the
environment. Environmental Science and Policy 12, 207-215.
Kinsella, J, Goetz, SJ, Partridge, MD, Deller, SC, Fleming, D (2010) Evaluating RD Policies for
Social and Human Capital Development. EuroChoices 9, 42-47.
Lattin, J, Carroll, J, Green, P (2003) 'Analyzing multivariate data.' (Thomson Brooks/Cole:
Pacific Grove, CA, USA)
Llambí Insúa, L (2015) Hogging territories and agricultural policies in Latin America in the
21st century: Process analysis and policy proposals1. Agroalimentaria 21, 61-78.
McMillan, SS, Kelly, F, Sav, A, Kendall, E, King, MA, Whitty, JA, Wheeler, AJ (2014) Using the
Nominal Group Technique: how to analyse across multiple groups. Health Services and
Outcomes Research Methodology 14, 92-108.
Chapter 5 EVALUATION OF RURAL DEVELOPMENT PROGRAMS IN CHILE
130
MINAGRI, 1990. Ley Orgánica del Instituto de Desarrollo Agropecuario, Ministerio de
Agricultura – MINAGRI. Santiago, Chile.
Motsenbocker, CE, Hinson, RA (2003) Forming a consensus in agricultural development
issues and constraints: Using the nominal group technique. Acta Horticulturae 621, 81-
87.
Mourits, MCM, van Asseldonk, MAPM, Huirne, RBM (2010) Multi Criteria Decision Making to
evaluate control strategies of contagious animal diseases. Preventive Veterinary
Medicine 96, 201-210.
Munda, G (2004) Social multi-criteria evaluation: Methodological foundations and
operational consequences. European Journal of Operational Research 158, 662-677.
OECD (2006a) 'The New Rural Paradigm: Policies and Governance.' (OECD Publishing: Paris,
France)
OECD (2006b) Policy Brief on "Reinventing Rural Policy". Organisation for Economic Co-
operation and Development - OECD, Paris, France. Available at
http://www.oecd.org/regional/regional-policy/37556607.pdf.
OECD (2009) Methods to monitor and evaluate the impacts of Agricultural Policies on Rural
development. Organisation for Economic Co-operation and Development - OECD, Paris,
France. Available at http://www.oecd.org/agriculture/44559121.pdf.
OECD (2011) 'Fostering productivity and competitiveness in agriculture.' (Organisation for
Economic Cooperation and Development – OECD: Paris, France)
OECD (2014) 'OECD Rural Policy Reviews: Chile 2014.' (OECD Publishing: Paris, France)
Oyarzún, E, Miranda, B (2011) La economía rural en Chile: entre la pobreza y el desarrollo.
Estudios de Economía Aplicada 29, 31-56.
Pisani, E, Franceschetti, G (2011) Territorial approaches for rural development in Latin
America: A case study in Chile. Revista de la Facultad de Ciencias Agrarias 43, 201-218.
Prager, K, Nienaber, B, Neumann, B, Phillips, A (2015) How should rural policy be evaluated if
it aims to foster community involvement in environmental management? Journal of
Rural Studies 37, 120-131.
Raggi, M, Sardonini, L, Viaggi, D (2013) The effects of the Common Agricultural Policy on exit
strategies and land re-allocation. Land Use Policy 31, 114-125.
Ramírez-Miranda, C (2014) Critical reflections on the New Rurality and the rural territorial
development approaches in Latin America. Agronomia Colombiana 32, 122-129.
Ramírez, E, Berdegué, J, Caro, J, Frigolett, D (2001) Estrategias de generación de ingresos de
hogares rurales en zonas de concentración de pobreza entre 1996 y 2000. In
'Estrategias para la superación de la pobreza rural: Visión desde distintas experiencias,
CEPAL. Naciones Unidas', July. Available at http://www.rimisp.org/wp-
content/uploads/2013/11/0127-000887-estrategiassecanopanel.pdf

131
Shucksmith, M (2000) Endogenous development, social capital and social inclusion:
Perspectives from LEADER in the UK. Sociologia Ruralis 40, 208-218.
Terluin, IJ, Roza, P (2010) Evaluation methods for rural development policy No. 2010-037
Available at http://edepot.wur.nl/138098.
Vera, R (2006) Country Pasture/Forage Resource Profiles CHILE, Country Pasture Profiles,
Food and Agriculture Organization of the United Nations – FAO. Food and Agriculture
Organization of the United Nations – FAO, Rome, Italy. Available at
http://www.fao.org/ag/agp/AGPC/doc/Counprof/PDF%20files/Chile-English.pdf
http://www.fao.org/ag/agp/AGPC/doc/Counprof/Chile/cile.htm#10.
WorldBank (2015) 'Indicadores de desarrollo mundial - Población rural.' Available at
http://databank.bancomundial.org/data/views/reports/tableview.aspx#


Chapter 6
GENERAL DISCUSSION

Chapter 6 GENERAL DISCUSSION
134
135
6.1 Introduction
Rural regions in Chile are shifting from an agriculture-based economy to a services-
oriented economy, where agriculture nevertheless remains a key economic factor for
development (OECD 2014). Accordingly, the Chilean government provides financial support
for fostering entrepreneurship among small farmers to enable them to become more
competitive in global markets (MINAGRI 1990; INDAP 2013a). Despite this support, a
declining number of farmers and an aging population are observed in rural areas (Apey and
López 2011; Oyarzún and Miranda 2011; WorldBank 2015).
Over the last decade, the Chilean government has increased its budget for rural
development programs by 77% (INDAP 2015). During the same period, a decline in rural
population of up to 40% has been observed in some areas (Oyarzún and Miranda 2011).
These conflicting observations raise the following question: why is the rural population
continuing to decrease in spite of the increased investment in rural development programs?
Part of the answer may lie in the focus of rural development programs. Most rural
development programs focus on increasing competitiveness (Tangen 2005; OECD 2011),
whereas the stay-exit decision in agriculture is also affected by the characteristics and
preferences of farmers and their families (Boehlje 1992; Pushkarskaya and Vedenov 2009;
Kinsella et al. 2010), and rural development policy (Prager et al. 2015). However, a full
answer to this question requires an in-depth understanding of the mechanisms driving the
stay-exit decision in farming and of how this knowledge can be used to improve rural
development policy.
To fill this current knowledge gap, the overall objective of this dissertation was to
provide technical and socioeconomic information that is useful for improving the
effectiveness of rural development programs, which are seen as the tool for stopping rural
migration. The technical and socioeconomic information is focused on providing a better
understanding of the factors underlying the stay-exit decision and economic development in
rural areas. This dissertation also shows how this knowledge can be used by policy makers to
redirect rural development policy and programs to improve their effectiveness in reducing
rural migration.
Four sub-objectives were derived from the overall objective and addressed in Chapters
2 to 5. Chapter 2 analyzed the role of socioeconomic variables in the stay-exit decision in
farming. The variables were identified based on efficiency theory, exit barrier theory, and
life-cycle theory. Efficiency theory is considered the main theory underlying the stay-exit
decision problem, whereas exit barrier theory and life-cycle theory are complementary
theories (Boehlje and Eidman 1984; Pushkarskaya and Vedenov 2009). A questionnaire
based on these three theories was developed and subsequently applied to a sample of small
livestock farmers in southern Chile to collect technical and socioeconomic information from

Chapter 6 GENERAL DISCUSSION
136
these farmers. The association of potential factors with the stay-exit decision was identified
using a probit model.
Chapter 3 used technical, economic, and social data from the questionnaire developed
in Chapter 2 to explore the scope for improving the technical efficiency (TE) of the sample
farms and to identify the variables influencing TE. In Chapter 3, data envelopment analysis
was used to estimate the TE with which these farmers operate. The association of potential
factors with farm TE was estimated using a truncated regression.
Chapter 4 explored in-depth the possibilities for improving the TE of each specific input.
A nonparametric directional input distance function was used to estimate the input-specific
technical inefficiency with which the farmers in the sample operate. This was followed by a
truncated bootstrap regression to identify the association of potential factors with the input-
specific technical inefficiency.
Chapter 5 analyzed the effectiveness of existing rural development programs in Chile.
The opinions of experts were elicited regarding the effectiveness of these programs in
achieving the main INDAP goals and then compared with the budget allocation among rural
development programs. Chapter 5 also presented recommendations from experts for
improving the effectiveness of rural development programs for small Chilean farmers. The
experts used the results from Chapters 2 to 4 as a basis for these recommendations.
This final chapter synthesizes the results from Chapters 2 to 5 and reflects on the
methods used in this dissertation. This chapter also details the implications for policy and
outlines directions for future research, and finishes with the main conclusions of this
dissertation.
6.2 Synthesis
This dissertation's core assertion is that a deeper understanding of the variables
underlying the stay-exit decision and their relation with rural development programs could
increase the effectiveness of rural development programs aimed at improving the
competitiveness of small livestock farmers and increasing farm income.
Throughout Chapters 2 to 4, many variables were associated with either the stay-exit
decision (Chapter 2), TE (Chapters 3 and 4), or both. From the results in Chapters 2 to 4, a set
of 18 variables were identified as key variables for influencing the likelihood to stay farming
and therefore as key variables for reducing rural migration. An overview of the association of
these variables with the stay-exit decision and TE is presented in Table 6.1, alongside the
INDAP programs that consider these variables in their definitions.
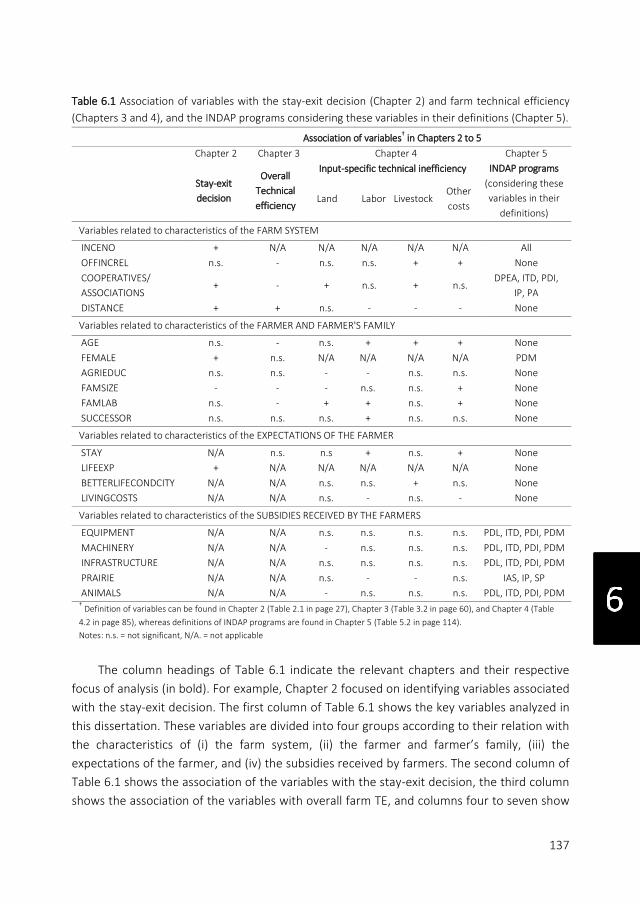
137
Table 6.1 Association of variables with the stay-exit decision (Chapter 2) and farm technical efficiency
(Chapters 3 and 4), and the INDAP programs considering these variables in their definitions (Chapter 5).
Association of variables† in Chapters 2 to 5
Chapter 2 Chapter 3 Chapter 4 Chapter 5
Stay-exit
decision
Overall
Technical
efficiency
Input-specific technical inefficiency INDAP programs
(considering these
variables in their
definitions)
Land Labor Livestock Other
costs
Variables related to characteristics of the FARM SYSTEM
INCENO + N/A N/A N/A N/A N/A All
OFFINCREL n.s. - n.s. n.s. + + None
COOPERATIVES/
ASSOCIATIONS + - + n.s. + n.s.
DPEA, ITD, PDI,
IP, PA
DISTANCE + + n.s. - - - None
Variables related to characteristics of the FARMER AND FARMER'S FAMILY
AGE n.s. - n.s. + + + None
FEMALE + n.s. N/A N/A N/A N/A PDM
AGRIEDUC n.s. n.s. - - n.s. n.s. None
FAMSIZE - - - n.s. n.s. + None
FAMLAB n.s. - + + n.s. + None
SUCCESSOR n.s. n.s. n.s. + n.s. n.s. None
Variables related to characteristics of the EXPECTATIONS OF THE FARMER
STAY N/A n.s. n.s + n.s. + None
LIFEEXP + N/A N/A N/A N/A N/A None
BETTERLIFECONDCITY N/A N/A n.s. n.s. + n.s. None
LIVINGCOSTS N/A N/A n.s. - n.s. - None
Variables related to characteristics of the SUBSIDIES RECEIVED BY THE FARMERS
EQUIPMENT N/A N/A n.s. n.s. n.s. n.s. PDL, ITD, PDI, PDM
MACHINERY N/A N/A - n.s. n.s. n.s. PDL, ITD, PDI, PDM
INFRASTRUCTURE N/A N/A n.s. n.s. n.s. n.s. PDL, ITD, PDI, PDM
PRAIRIE N/A N/A n.s. - - n.s. IAS, IP, SP
ANIMALS N/A N/A - n.s. n.s. n.s. PDL, ITD, PDI, PDM † Definition of variables can be found in Chapter 2 (Table 2.1 in page 27), Chapter 3 (Table 3.2 in page 60), and Chapter 4 (Table
4.2 in page 85), whereas definitions of INDAP programs are found in Chapter 5 (Table 5.2 in page 114).
Notes: n.s. = not significant, N/A. = not applicable
The column headings of Table 6.1 indicate the relevant chapters and their respective
focus of analysis (in bold). For example, Chapter 2 focused on identifying variables associated
with the stay-exit decision. The first column of Table 6.1 shows the key variables analyzed in
this dissertation. These variables are divided into four groups according to their relation with
the characteristics of (i) the farm system, (ii) the farmer and farmer’s family, (iii) the
expectations of the farmer, and (iv) the subsidies received by farmers. The second column of
Table 6.1 shows the association of the variables with the stay-exit decision, the third column
shows the association of the variables with overall farm TE, and columns four to seven show

Chapter 6 GENERAL DISCUSSION
138
the association of these variables with the input-specific technical inefficiencies. The last
column of Table 6.1 indicates the rural development programs provided by INDAP that
include the variable in their definition.
The discussion below focuses mainly on the key variables for increasing the likelihood to
stay farming, as shown in Table 6.1.
6.2.1 Variables related to characteristics of the farm system
Farm income
Table 6.1 shows that farm income (INCENO) is positively associated with the decision to
stay farming (second column), which is in agreement with previous studies (Boehlje 1992;
Goetz and Debertin 2001; Pushkarskaya and Vedenov 2009; Zhan et al. 2012). Farm income
(INCENO) was not included as an external variable in the analyses in Chapters 3 and 4
because it is directly related to TE. The results of Chapters 3 and 4 indicate that farm TE, and
indirectly farm income, can be improved by decreasing the use of inputs or increasing the
size of the operation (not shown in Table 6.1). Table 6.1 (third to seventh columns) also
shows that many other variables are associated with the TE with which these farmers
operate, and therefore also with farm income.
The last column of Table 6.1 shows that all INDAP programs include farm income in
their definition (Chapter 5). Most of the other variables (third to seventh columns of Table
6.1) associated with TE, and therefore indirectly with farm income, are not included in the
definitions of INDAP programs. Participation in cooperatives and female farmers are the only
other variables relating to characteristics of the farm system, the farmer and farmer’s family,
and farmer expectations that are included in the definitions of INDAP programs.
Off-farm income
Although off-farm income (OFFINCREL) is not directly associated with the decision to
stay farming (Chapter 2), it could indirectly affect this decision (Chapters 3 and 4). Off-farm
income is negatively associated with TE (third column of Table 6.1), which is probably due to
a redistribution of farm labor in favor of off-farm activities (Goetz and Debertin 2001; Bragg
and Dalton 2004). The in-depth analysis in Chapter 4 shows that off-farm income is positively
associated with the input-specific inefficiency of livestock and other costs (sixth and seventh
columns of Table 6.1). This suggests that farmers compensate their absence from the farm
by using additional inputs, such as purchased feed and hired labor. In addition, other costs
might increase because the person replacing the farmer might not use the available inputs as
efficiently, possibly because hired labor is less skilled or because hired labor does not benefit
directly from higher farm profits (Latruffe et al. 2005; Latruffe 2010). These findings suggest
that the farmers in the sample use off-farm income to complement their farm income,

139
rather than investing it in the farm (Jaime and Salazar 2011). The last column of Table 6.1
shows that none of the INDAP programs include fostering off-farm income in their
definitions.
Participation in cooperatives
Participation in cooperatives or associations is positively associated with the decision to
stay farming (second column of Table 6.1), but negatively associated with TE (third, fourth,
and sixth columns of Table 6.1). The positive association with the stay decision may be
because participation provides assistance and regular transfer of knowledge to farmers
(Gasson et al. 1988; Fairweather and Keating 1994; Huffman and Feridhanusetyawan 2007),
which may be lost when a farmer exits farming. The negative association with TE (third
column of Table 6.1) is not consistent with most previous studies (O'Neill et al. 2002; Jaime
and Salazar 2011; Kelly et al. 2012).
Participation in cooperatives is positively associated with the input-specific inefficiency
in the use of land and livestock (fourth and sixth columns of Table 6.1). This result cannot be
placed in the context of other research, as the authors are unaware of any comparable
studies on input-specific inefficiency in livestock farming. Nevertheless, this finding could
indicate that the economic and commercial benefits provided by cooperatives to their
members reduce the incentive to operate efficiently, particularly in the use of land and
livestock.
Chapter 5 indicates that policy makers perceive promoting organizational development
as the most important objective for the achievement of INDAP goals. Five INDAP programs
feature participation in cooperatives or associations in their definition (last column of Table
6.1). DPEA and PA directly promote organizational development, whereas ITD, PDI, and IP
indirectly promote it by requiring a collective application for INDAP funds. The budget
allocated to INDAP programs directly promoting organizational development is very low;
DPEA receives only 1.2% of the total budget allocated to subsidies and PA only 5.3%.
These findings suggest that fostering participation in cooperatives or other kinds of
working/discussion groups increases the likelihood to stay farming. The budget allocated to
INDAP programs directly promoting organizational development should be increased, as
these programs are relevant to achieving INDAP goals, particularly increasing the likelihood
to stay farming. However, the types of benefits provided by these organizations can lead to
lower farm TE. Cooperatives may help to produce more, but not necessarily produce better
(Berdegué 2001). Therefore, these programs must be carefully designed to effectively
increase both the likelihood to stay farming and the TE of the farm.
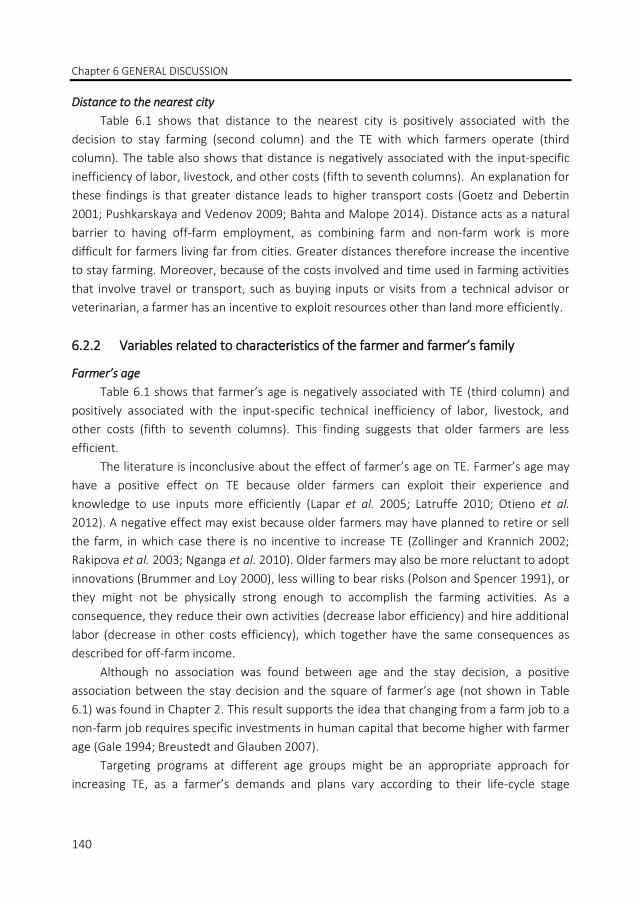
Chapter 6 GENERAL DISCUSSION
140
Distance to the nearest city
Table 6.1 shows that distance to the nearest city is positively associated with the
decision to stay farming (second column) and the TE with which farmers operate (third
column). The table also shows that distance is negatively associated with the input-specific
inefficiency of labor, livestock, and other costs (fifth to seventh columns). An explanation for
these findings is that greater distance leads to higher transport costs (Goetz and Debertin
2001; Pushkarskaya and Vedenov 2009; Bahta and Malope 2014). Distance acts as a natural
barrier to having off-farm employment, as combining farm and non-farm work is more
difficult for farmers living far from cities. Greater distances therefore increase the incentive
to stay farming. Moreover, because of the costs involved and time used in farming activities
that involve travel or transport, such as buying inputs or visits from a technical advisor or
veterinarian, a farmer has an incentive to exploit resources other than land more efficiently.
6.2.2 Variables related to characteristics of the farmer and farmer’s family
Farmer’s age
Table 6.1 shows that farmer’s age is negatively associated with TE (third column) and
positively associated with the input-specific technical inefficiency of labor, livestock, and
other costs (fifth to seventh columns). This finding suggests that older farmers are less
efficient.
The literature is inconclusive about the effect of farmer’s age on TE. Farmer’s age may
have a positive effect on TE because older farmers can exploit their experience and
knowledge to use inputs more efficiently (Lapar et al. 2005; Latruffe 2010; Otieno et al.
2012). A negative effect may exist because older farmers may have planned to retire or sell
the farm, in which case there is no incentive to increase TE (Zollinger and Krannich 2002;
Rakipova et al. 2003; Nganga et al. 2010). Older farmers may also be more reluctant to adopt
innovations (Brummer and Loy 2000), less willing to bear risks (Polson and Spencer 1991), or
they might not be physically strong enough to accomplish the farming activities. As a
consequence, they reduce their own activities (decrease labor efficiency) and hire additional
labor (decrease in other costs efficiency), which together have the same consequences as
described for off-farm income.
Although no association was found between age and the stay decision, a positive
association between the stay decision and the square of farmer’s age (not shown in Table
6.1) was found in Chapter 2. This result supports the idea that changing from a farm job to a
non-farm job requires specific investments in human capital that become higher with farmer
age (Gale 1994; Breustedt and Glauben 2007).
Targeting programs at different age groups might be an appropriate approach for
increasing TE, as a farmer’s demands and plans vary according to their life-cycle stage

141
(Boehlje 1992). Developing programs that enhance the participation of farmers and their
relatives at different ages could be a promising approach for increasing the effectiveness of
INDAP programs. In addition, programs targeted at young farmers, female farmers, and a
farmer’s spouse and children could help to motivate young people to continue farming,
while also promoting the transfer of the farm to a successor.
Family size
Table 6.1 shows that family size is negatively associated with the likelihood to stay
farming (second column), in contrast to the effect reported in other studies (Breustedt and
Glauben 2007; Chang et al. 2011). This finding could be explained by the lack of
opportunities in large families for all family members to work at the farm. Consistent with
this reasoning, Table 6.1 also shows that family size is negatively associated with the TE of
the farm (third column). However, the in-depth analysis of input-specific inefficiency shows
that this effect is more complex; Table 6.1 shows that family size is negatively associated
with the input-specific inefficiency of land (fifth column) and positively associated with the
input-specific inefficiency of other costs (seventh column). These results indicate that an
extra family member has a dual effect. An extra family member can provide an incentive to
use land more efficiently, as family members benefit directly from farm profits (Latruffe et al.
2005; Uzmay et al. 2009; Latruffe 2010; Singbo and Oude Lansink 2010). An extra family
member can also lead to extra costs to operate the farm, which could explain its positive
association with the inefficiency of other costs.
Family labor
This variable is not associated with the stay-exit decision, but it is negatively associated
with overall TE (third column of Table 6.1). In addition, it is positively associated with the
input-specific technical inefficiency of land, labor, and other costs (fourth, fifth, and seventh
columns of Table 6.1). Farming is recognized as providing the opportunity to be self-
employed and have more family members work on the farm (Latruffe et al. 2005; Latruffe
2010; Chang et al. 2011). However, our findings suggest that the marginal effect of having an
additional family member working at the farm becomes smaller or even negative as the
number of family members increases, which supports the idea of hidden unemployment on
the farm (Hansson 2007). Hence, designing programs to foster non-agricultural jobs at the
farm for family members may increase the competitiveness of the whole farm, which in turn
contributes to achieving the goals of the INDAP programs.
Other variables
Other variables related to characteristics of the farmer and farmer’s family, such as
gender, educational background of the farmer, and presence of a successor also show an

Chapter 6 GENERAL DISCUSSION
142
association with either the stay-exit decision (Chapter 2) or TE (Chapters 3 and 4). Female
farmer is positively associated with the decision to stay farming (second column of Table
6.1). This result could be explained by the managerial role of wives/mothers in the family
farm (Baylina and Salamaña 2006; Charatsari et al. 2013). Gender was not included in the
analyses of TE (Chapters 3 and 4) because it was not significant in any of the models. INDAP
has recognized the importance of women for rural development (INDAP 2014a) and provides
a specific program focused on rural women, PDM (last column of Table 6.1). This program
accounted for 1.4% of the INDAP budget allocated to subsidies (Chapter 5).
Formal agricultural education is negatively associated with the input-specific technical
inefficiency of land and labor (fourth and fifth columns of Table 6.1). This suggests that
farmers with better knowledge on farming exploit their resources more efficiently (Avilez et
al. 2010; Latruffe 2010; Nganga et al. 2010; Jaime and Salazar 2011; Otieno et al. 2012;
Bahta and Malope 2014; von Cramon-Taubadel and Saldias 2014).
The presence of a successor is positively associated with the input-specific inefficiency
of labor (fifth column of Table 6.1). This suggests that a farmer delegates some farm
activities to a successor who is often not as interested in farming; this lack of interest was
mentioned by respondents during the survey.
Chapter 5 shows that developing personal capabilities and skills and strengthening
social capital are relevant for the achievement of INDAP goals. However, programs tailored
towards different target groups appear to be lacking. PDM is the only program that focuses
on a specific target group, but this program focuses only on increasing the TE of female
farmers, rather than increasing the likelihood to stay farming. Developing programs that
focus on different target groups could be valuable for achieving the INDAP goals. Older
farmers, female farmers, and the family members of young farmers are examples of
promising target groups.
6.2.3 Variables related to characteristics of farmer expectations
Having a positive expectation about future farming life (LIFEEXP) is positively associated
with the decision to stay farming (second column of Table 6.1), which is in agreement with
Zollinger and Krannich (2002) (Chapter 2). This variable was not included in the analyses of
TE because it is correlated with the expectation to stay farming (STAY). Instead, two other
variables were defined and used to capture expectations: the belief that the city provides
better conditions of living (BETTERLIFECONDCITY) and the belief that living costs will rise in
the future (LIVINGCOSTS). These two variables were excluded from the overall TE analysis
(Chapter 3) because the model performed better without them.
The belief regarding better living conditions in the city is associated with a higher input-
specific technical inefficiency of livestock (sixth column of Table 6.1). A likely explanation is

143
that this belief could (un)consciously decrease the effort put into farm activities (Zollinger
and Krannich 2002). The expectation of higher living costs is associated with lower input-
specific technical inefficiency of both labor and other costs (fifth and seventh columns of
Table 6.1), improving these input-specific efficiencies can be seen as a way for farmers to
increase their farm income to afford a higher standard of living in the future (Chapter 4).
The expectation regarding the decision to stay farming was include in the TE analysis
(Chapter 3) and the input-specific technical inefficiency analysis (Chapter 4). The stay-
decision is not associated with overall TE, but is associated with a higher specific technical
inefficiency of labor and other costs (fifth and seventh columns of Table 6.1). This suggests
that the stay decision makes farmers less efficient in using labor and other costs (Chapter 4).
However many factors influence the decision to stay farming, and this decision is also based
on the intrinsic rewards provided by farming, e.g. doing something worthwhile or working
outdoors (Zollinger and Krannich 2002). None of the INDAP programs explicitly include the
likelihood to stay farming in their definitions, although this is an implicit goal of INDAP
(Chapter 5).
None of the INDAP programs include the expectations of the farmer in their definitions
(Chapter 5). However, expectations are partially based on the current experiences of the
farmer, which are related to variables such as farm income, non-farm income, and
participation in cooperatives. Hence, expectations of the farmer may be indirectly influenced
by INDAP programs.
6.2.4 Variables related to subsidies received by the farmer
Table 6.1 shows that subsidies provided for machinery and animals are negatively
associated with the input-specific technical inefficiency of land (fourth column); whereas
subsidies given for prairie are negatively associated with the input-specific technical
inefficiency of labor and livestock (fifth and sixth columns). All INDAP programs are focused
on increasing the farm efficiency (Chapter 5). Table 6.1 shows that PDL, ITD, PDI, and PDM
provide funds for improving the quality of equipment, machinery, infrastructure, and animals
(last column); whereas IAS, IP, and SP provide funds for improving the quality of the prairie
(last column).
Although subsidies are generally expected to increase TE (von Cramon-Taubadel and
Saldias 2014), a negative effect on TE is also possible (Zhu et al. 2011). The results of this
study show that subsidies given for prairie, i.e. the programs IAS, IP, and SP, are negatively
associated with the input-specific inefficiency of labor and livestock, whereas subsidies given
for machinery and animals, i.e. the programs PDL, ITD, PDI, and PDM, are negatively
associated with the input-specific technical inefficiency of land. The finding that subsidies
given for equipment or infrastructure have no association with efficiency has also been

Chapter 6 GENERAL DISCUSSION
144
reported by Latruffe et al. (2005) and Bojnec and Ferto (2013), who indicated that these kind
of subsidies could even decrease overall TE. Hence, this finding suggests that these resources
could be reallocated to subsidies that have a positive association with TE, such as those
provided for prairie, machinery, and animals.
6.3 Approach and methods
In this study, the identification of potential variables associated with the stay-exit
decision was based on three theories: efficiency theory, exit barrier theory, and life-cycle
theory (Boehlje and Eidman 1984; Pushkarskaya and Vedenov 2009). Although efficiency
theory is considered the main theoretical framework to explain the stay-exit decision
(Boehlje and Eidman 1984; Pushkarskaya and Vedenov 2009), it assumes a rational decision
maker that has access to all required information to make a decision, an assumption that is
unlikely to be fulfilled. Using the other two theories enables the inclusion of the obstacles
and the biological life cycle of the farmer that limit the rational behavior assumed by
efficiency theory (Karakaya 2000; Pushkarskaya and Vedenov 2009).
The second column of Table 6.1 shows that the stay-exit decision is associated with
variables related to characteristics of (i) the farm system, (ii) the farmer and farmer’s family,
and (iii) the expectations of the farmer. This suggests that the stay-exit decision is also
explained by variables that are not directly related to the efficiency of the farm
(Pushkarskaya and Vedenov 2009). Many of the variables that explain why farms continue
operating even while realizing a very low profit or loss, such as sunk costs (Chang et al.
2011), and the variables associated with human capital, such as characteristics of the farmer
and the farmer’s family (Boehlje 1992; Gale 1994), could not have been tested without the
inclusion of exit barrier theory and life-cycle theory. Using these three theories together
provides a science-based framework that enables the inclusion of a broad set of variables
that may be associated with the stay-exit decision.
Using the variables identified in the three theories, a farmer questionnaire was
developed to collect the technical and socioeconomic data needed to identify the
association of the variables with the stay-exit decision of small livestock farmers (Chapter 2)
and with the TE with which these farmers operate (Chapters 3 and 4). The evaluation of
current INDAP programs included the elicitation of expert opinion and the identification of
recommendations for improving their effectiveness (Chapter 5).

145
6.3.1 Farmer questionnaire
The questionnaire was specifically designed for this study to collect information that is
not available from any public organization in Chile. It included both qualitative and
quantitative close-ended questions that covered the following areas: technical and economic
information, characteristics of the farmer and farmer’s family, satisfaction level, and
expectations of the farmer. Although this questionnaire enabled the collection of good
quality data, access to the farmers was difficult and time consuming because legal formalities
prevented INDAP from sharing the personal information of their users. The application of the
questionnaire could be extended and facilitated by modifying the current regulations, so that
information on INDAP users is available for scientific purposes.
6.3.2 Sampling and distribution of the questionnaire
This study was conducted in three administrative regions in southern Chile: La
Araucanía, Los Ríos, and Los Lagos. This area accounts for 60% of bovine producers, who
manage 63% of all beef cattle and 91% of all dairy cows in Chile (INE 2007). It is also the
region where 45% of INDAP users are located (INDAP 2013b, 2015). The study area was
selected because one of the research centers involved in this research is located here. The
optimum sample size per region was computed using a stratified random sampling method,
using the number of hectares as a proxy for farm size (Neyman 1934). The questionnaire was
applied by the farmers’ own agriculture advisors, to increase the likelihood that farmers
would participate and provide personal information. This study did not include INDAP users
that had already exited farming in previous years; inclusion of these farmers could have
offered additional insights into the stay-exit decision.
This study used cross sectional data because of time and financial constraints. In
general, cross sectional studies are carried out at a single point in time and give no indication
of the sequence of events. This type of data cannot provide insight in the causality of
relations within farms, however it does enable the identification of positive or negative
associations of the studied variables with either the stay-exit decision or farm TE. Panel data
could be valuable for reflecting causality over time between the studied variables and either
the stay-exit decision or farm TE.
6.3.3 Representativeness of sample
The sample in this study consisted of INDAP users focused on livestock production, for
whom at least basic information about their farming system was available in production-level
registers. The sample represented approximately 9% of these INDAP users in the study area,

Chapter 6 GENERAL DISCUSSION
146
which was considered to be representative1. The representativeness of the sample was also
confirmed by presenting and discussing the results of Chapters 2 to 4 with experts and policy
makers, who indicated that these findings were in line with their expectations about the
population in the study area. Although the results are applicable to small livestock farmers in
these regions, the extent to which the results can be generalized to a larger population could
be increased. As the production potential of land differs within and between farms, the
representativeness of the sample could be improved by (i) using equivalent irrigated
hectares instead of hectares as a proxy for farm size, or (ii) including other regions in the
study. The first option would require a more detailed database than can currently be
obtained from INDAP. The second option would entail additional costs to be covered by the
researchers. This cost could be eliminated if Chilean legislation would facilitate sharing
information for scientific purposes.
6.3.4 Probit model
The methodology used in Chapter 2 enabled the identification of variables associated
with the farmer’s decision to stay. Although many probit studies do not provide a measure of
the model fit (Hoetker 2007), Chapter 2 reported two measures of the goodness-of-fit: the
significance-of-fit (McFadden’s pseudo-R2) and the proportion of correct predictions (Count
R2). These measures facilitate a better interpretation of results and comparison with other
studies. Therefore, this model enables the identification of the effects of the studied
variables on the stay decision, which are measured in marginal terms (Verbeek 2012).
6.3.5 Efficiency analyses
In Chapters 3 and 4 the efficiency was computed using a nonparametric method called
data envelopment analysis. This approach was selected because it constructs the frontier as
a linear piecewise function from empirical observations on inputs and outputs, without the
necessity of assuming any a priori functional relationship between them, or any restrictive
assumption regarding input remuneration (Coelli and Rao 2005; Simar and Wilson 2007; Färe
et al. 2008; Assaf and Matawie 2010; Heinrichs et al. 2013). Furthermore, the frontier nature
of the production function allows any productive inefficiency to be captured (Singbo and
Oude Lansink 2010). Although there are several parametric approaches that can be used for
analyzing TE, their application is complicated by the requirements or assumptions, such as
the need to assume a functional form or the large number of observations required (Bravo-
Ureta et al. 2007; Kelly et al. 2012; Bojnec and Ferto 2013). Moreover, nonparametric
approaches have been shown to provide similar results to parametric techniques, even
1 Only a small difference in the variance of the farm size was found for the Los Lagos region, which is attributable to
the larger size of this region and because the bigger farms are located in more remote areas.
147
considering that stochastic environment is captured by the latter (Latruffe et al. 2004;
Murillo-Zamorano 2004).
Chapter 4 computed the directional input distance function to estimate the TE of the
inputs used by farmers in the sample. This approach was recently adopted to explore the
efficiency with which any input is used (Kapelko and Oude Lansink upcoming; Kapelko et al.
upcoming). In the light of the findings in Chapters 3 and 4, we can confirm that this approach
is useful as an in-depth technique to estimate input-specific (in)efficiency.
In Chapters 3 and 4, the effect of a set of external variables on TE was determined using
a bootstrap truncated regression (Simar and Wilson 2015). Although the literature describes
a wide range of methods to introduce external variables into the efficiency analysis (Simar
and Wilson 2007), truncated regression is the only well-defined, statistically coherent, and
meaningful method (Simar and Wilson 2011). This is because efficiency estimates are
truncated at one by construction (Simar and Wilson 2015), but also because this method
accounts for both the heterogeneity in the distribution of inefficiency and the separability
between the production set and the covariates (Simar and Wilson 2007; Singbo and Oude
Lansink 2010).
6.3.6 Assessment of rural development policy
The multi criteria analysis used in Chapter 5 to evaluate rural development policy
identified the contribution of INDAP programs to the achievement of INDAP goals. The
economic benefits for INDAP users could not be evaluated because this information was
unavailable. Given the scope of this research and the available resources, the results of this
study could be improved by including farmers in the evaluation of INDAP programs and
developing indicators to evaluate the effectivity of INDAP programs. An alternative method
to multi criteria analysis is cost benefit analysis, in which the costs and benefits are
quantified in monetary terms (Atkinson, 2015). However, this methodology requires the
monetarization of all relevant effects, which was not feasible in this research.
The nominal group technique used in the workshop in Chapter 5 was appreciated by the
experts, who considered it helpful for developing recommendations to improve the
effectiveness of INDAP programs. Although there are alternative techniques to facilitate the
generation of ideas in relation to a problem, such as Delphi technique or brainstorming, the
highly structured process in the nominal group technique ensures equal participation and
requires less time and resources than other techniques (Motsenbocker and Hinson 2003;
Boddy 2012; McMillan et al. 2014).
Chapter 6 GENERAL DISCUSSION
148
6.4 Policy implications
INDAP has two stated goals: (1) improve the competitiveness of small farmers and (2)
enhance family income (MINAGRI 1990). These two goals encompass an implicit aim of
stopping migration from rural areas. INDAP provides several programs to achieve these goals
(INDAP 2014b). The continuing population decline in rural areas suggests that the programs
designed to achieve these two goals are inadequate to stop migration from these areas. New
programs that directly foster the likelihood to stay farming may be needed to stop the
population decline in rural areas.
The results of the research in this dissertation provide the general impression that
some INDAP programs are less effective in achieving INDAP goals. This suggests possibilities
for reducing the current number of professional and technical advice programs and
reallocating budget from less effective programs to programs that are more effective in the
achievement of INDAP goals. As an example, budget currently allocated to programs that
focus on improving the quality of soil/prairies, such as IAS, could be reallocated to programs
that focus on fostering social and organizational capital development, such as DPEA, PA, and
PDM (Chapter 5).
INDAP programs do not focus on the stay decision directly (Chapter 5), but they foster
this decision indirectly by increasing the income provided by the farm (Chapter 2). However,
many of the other variables shown in Chapters 2, 3, and 4 to be associated with both the
stay decision and farm TE are not addressed by any INDAP program, such as off-farm
income, farmer’s age, family size, and family labor. Hence, reducing the budget allocated to
INDAP programs that only enhance farm income and reallocating it to new INDAP programs
that also consider these other variables could increase the effectiveness of INDAP programs
in achieving INDAP goals.
Chapter 5 shows that policy makers perceive the programs that focus on improving the
quality of social and organizational capital, i.e. DPEA and PA, are most effective in achieving
INDAP goals. In addition, Chapter 2 indicates that this type of program is positively
associated with the decision to stay farming. Hence, designing new programs that focus on
these issues could increase the achievement of INDAP goals. Nevertheless, results from
Chapters 3 and 4 indicate that participation in cooperatives or associations is negatively
associated with the TE with which farmers operate. Therefore INDAP programs, such as
DPEA and PA, must be carefully designed to foster both TE and the decision to stay farming.
Similarly, although ITD, PDI, and IP directly focus on fostering TE, farmers can apply for funds
as individuals or as a group, i.e. cooperatives. When farmers apply as a group, these
programs will also require careful attention to ensure a positive effect on TE and the stay
decision.
149
Reducing the input-specific technical inefficiency of livestock is the most effective way
of improving productivity as a whole (Chapter 4). Although several INDAP programs provide
subsidies to invest in equipment, machinery, infrastructure, prairie, and animals (Chapter 5),
only subsidies for prairies are associated with a lower technical inefficiency of livestock
(Chapter 4). Therefore, reallocating INDAP budget to programs improving the quality of
prairies, such as IAS, IP, and SP, could be an effective way to improve the TE with which
farmers operate.
The results found in Chapters 2 to 4 for distance to the nearest city suggest that the
common practice of improving the quality of roads, which in practical terms reduces
transport time, has a negative association with both the decision to stay farming and farm
TE. The results in Chapters 2 to 4 for farmer’s age, family labor and presence of a successor
highlight the lack of alternatives available in rural areas for children, women, and young
farmers, both inside and outside their own farm. Hence, the process to identify and provide
alternatives for farmers and their families to continue farming requires the participation of
many public organizations in addition to the Ministry of Agriculture: the Ministry of Public
Works, the Ministry of Transport and Communications, the Ministry of Economy,
Development and Tourism, the Ministry of the Environment, the Ministry of Social
Development, and the Ministry of Education. For instance, developing programs that
enhance generational transfers of the farm could improve both the decision to stay farming
and farm technical efficiency.
6.5 Implications for future research
6.5.1 Knowledge gap for policy
This research focused on small livestock farmers in southern Chile, who were both
INDAP users and had at least basic information available about their farming system.
Promising directions for future research on the stay-exit decision include extending the
analysis to all INDAP users, independent farmers, and farmers that already exited farming.
Although this approach would add to the complexity of the study, it could improve the
understanding of the stay-exit decision. Including all INDAP users in the analysis would
require the agreement of INDAP to provide access to this information.
Chapter 5 evaluated the effectiveness of INDAP programs based on the opinions of
policy makers. Including the opinions of farmers could offer additional insights for improving
the effectiveness of INDAP programs. Including farmers or a representative group of farmers
was not possible in this study because of farmers’ availability and monetary constraints.
Future research that includes farmers’ opinions, collected by INDAP advisors or specialized
Chapter 6 GENERAL DISCUSSION
150
researchers, could be valuable for improving the effectiveness of INDAP programs in
achieving INDAP goals.
A further promising line for future research is the development of a long-term
monitoring plan to evaluate the economic impact of INDAP programs on farming, as regular
evaluation of this impact is currently lacking.
6.5.2 Knowledge gap for science
This dissertation focused on the role of socioeconomic factors and rural development
policy in the stay-exit decision. Although this dissertation considered the main three theories
involved in the stay-exit decision problem, these theories do not differentiate the effect of
public support on the studied variables. Hence, future research that extends the conceptual
framework based on these three theories to include the role played by public support would
be valuable for furthering the understanding of the stay-exit decision.
This study used cross sectional data, obtained from a farm questionnaire specifically
designed for this study. This data could be easily and regularly collected by INDAP to provide
panel data that would better enable the identification of causal relations between external
variables and the stay-exit decision and TE.
Although input-specific inefficiency analysis is still a relatively new and developing
technique in the field of farming, it is valuable because it enables the exploration of the
efficiency with which any input is used (Kapelko and Oude Lansink upcoming; Kapelko et al.
upcoming). Fostering its use and further development will help farmers focus their efforts to
improve efficiency and assist policy makers in the design of effective policies to improve the
competitiveness of farmers in world markets.
6.6 Main conclusions
The main conclusions of this dissertation are:
- The main stated aim of all INDAP programs is to increase the income provided by the
farm, which in turn is positively associated with the decision of small livestock farmers
to stay farming (Chapters 2 and 5).
- The income provided by off-farm activities has no relation with the decision to stay
farming, but is associated with lower farm TE (Chapters 2, 3, and 4).
- Participation in cooperatives or other types of associations is positively associated with
the decision to stay farming; INDAP programs that promote social and organizational
development, such as DPEA and PA, are also seen by policy makers as the most
effective programs to achieve INDAP goals (Chapters 2 and 5).

151
- INDAP programs that promote social and organizational development, such as DPEA
and PA, must be carefully (re)designed because they are associated with lower farm TE
(Chapters 3 and 4).
- The common practice of improving the quality of roads, which in turn reduces transport
time, is associated with both a lower probability to stay farming and lower farm TE
(Chapters 2, 3, and 4).
- Farmer’s age and family labor have no association with the likelihood to stay farming,
but are associated with lower farm TE (Chapters 2, 3, and 4).
- Female farmer and having a positive expectation regarding future farming life are
positively associated with the decision to stay farming (Chapter 2).
- Agricultural education of the farmer is negatively associated with the input-specific
technical inefficiency of land and labor (Chapter 4).
- Family size is negatively associated with the decision to stay farming and with lower
farm TE, and is also associated with lower input-specific technical inefficiency of land
and higher input-specific technical inefficiency of other costs (Chapters 2, 3, and 4).
- The presence of a successor is positively associated with the input-specific technical
inefficiency of labor (Chapter 4).
- The motivation of the farmer to stay farming has no relation with overall farm TE, but is
associated with higher input-specific technical inefficiency of labor and other costs
(Chapters 3 and 4).
- Subsidies for both machinery and animals are associated with lower input-specific
technical inefficiency of land; whereas subsidies for prairie are associated with lower
input-specific technical inefficiency of labor and livestock. Subsidies for equipment or
infrastructure have no effect on the technical inefficiency of any input (Chapters 4 and
5).

Chapter 6 GENERAL DISCUSSION
152
References
Apey, A, López, I, 2011. Agricultura chilena, información social y productiva según tamaño
del productor y localización geográfica, VII Censo Nacional Agropecuario y Forestal,
2007. Oficina de Estudios y Políticas Agrarias – ODEPA, Ministerio de Agricultura,
Gobierno de Chile, Santiago, Chile.
Assaf, A, Matawie, KM (2010) Improving the accuracy of dea efficiency analysis: A bootstrap
application to the health care foodservice industry. Applied Economics 42, 3547-3558.
Avilez, JP, Escobar, P, von Fabeck, G, Villagran, K, García, F, Matamoros, R, García Martínez, A
(2010) Caracterización productiva de explotaciones lecheras empleando metodología
de análisis multivariado. Revista Científica-Facultad de Ciencias Veterinarias 20, 74-80.
Bahta, S, Malope, P (2014) Measurement of competitiveness in smallholder livestock
systems and emerging policy advocacy: An application to Botswana. Food Policy 49,
408-417.
Baylina, M, Salamaña, I (2006) El lugar del género en la geografía rural. Boletin de la
Asociacion de Geografos Espanoles 41, 99-112.
Berdegué, JA (2001) Cooperating to compete: associative peasant business firms in Chile.
Wageningen University.
Boddy, C (2012) The Nominal Group Technique: an aid to Brainstorming ideas in research.
Qualitative Market Research: An International Journal 15, 6-18.
Boehlje, M (1992) Alternative models of structural change in agriculture and related
industries. Agribusiness 8, 219-231.
Boehlje, M, Eidman, V (1984) 'Farm management.' (Wiley: New York, USA)
Bojnec, Š, Ferto, I (2013) Farm income sources, farm size and farm technical efficiency in
Slovenia. Post-Communist Economies 25, 343-356.
Bragg, L, Dalton, T (2004) Factors Affecting the Decision to Exit Dairy Farming: A Two-Stage
Regression Analysis. Journal of Dairy Science 87, 3092-3098.
Bravo-Ureta, BE, Solís, D, Moreira López, VH, Maripani, JF, Thiam, A, Rivas, T (2007) Technical
efficiency in farming: A meta-regression analysis. Journal of Productivity Analysis 27, 57-
72.
Breustedt, G, Glauben, T (2007) Driving Forces behind exiting from farming in western
Europe. Journal of Agricultural Economics 58, 115-127.
Brummer, B, Loy, JP (2000) The technical efficiency impact of farm credit programmes: A
case study of Northern Germany. Journal of Agricultural Economics 51, 405-418.
Coelli, TJ, Rao, DSP (2005) Total factor productivity growth in agriculture: a Malmquist index
analysis of 93 countries, 1980–2000. Agricultural Economics 32, 115-134.
Chang, K, Langelett, G, Waugh, A (2011) Health, Health Insurance, and Decision to Exit from
Farming. Journal of Family and Economic Issues 32, 356-372.

153
Charatsari, C, Papadaki-Klavdianou, A, Michailidis, A, Partalidou, M (2013) Great
expectations? Antecedents of women farmers' willingness to participate in agricultural
education programmes. Outlook on Agriculture 42, 193-199.
Fairweather, J, Keating, N (1994) Goals and management styles of New Zealand farmers.
Agricultural Systems 44, 181-200.
Färe, R, Grosskopf, S, Lovell, CAK (2008) 'Production Frontiers.' (Cambridge University Press:
New York, USA)
Gale, H (1994) Longitudinal Analysis of Farm Size over the Farmer's Life Cycle. Review of
Agricultural Economics 16, 113-123.
Gasson, R, Crow, G, Errington, A, Hutson, J, Marsden, T, Winter, D (1988) The farm as a
family business: a review. Journal of Agricultural Economics 39, 1-41.
Goetz, S, Debertin, D (2001) Why farmers quit: A county-level analysis. American Journal of
Agricultural Economics 83, 1010-1023.
Hansson, H (2007) Strategy factors as drivers and restraints on dairy farm performance:
Evidence from Sweden. Agricultural Systems 94, 726-737.
Heinrichs, AJ, Jones, CM, Gray, SM, Heinrichs, PA, Cornelisse, SA, Goodling, RC (2013)
Identifying efficient dairy heifer producers using production costs and data
envelopment analysis. Journal of Dairy Science 96, 7355-7362.
Hoetker, G (2007) The use of logit and probit models in strategic management research:
Critical issues. Strategic Management Journal 28, 331-343.
Huffman, W, Feridhanusetyawan, T (2007) Migration, Fixed Costs, and Location-Specific
Amenities: A Hazard Analysis for a Panel of Males. American Journal of Agricultural
Economics 89, 368-382.
INDAP (2013a) '50 años de INDAP.' Available at http://www.indap.gob.cl/historia-de-
exito/50-anos-de-indap
INDAP (2013b) 'Comprometidos con el Mundo Rural, Programas de fomento 2010-2014.'
(Instituto de Desarrollo Agropecuario – INDAP, Ministerio de Agricultura, Gobierno de
Chile: Santiago, Chile)
INDAP, 2014a. Resolución No 2469, Convenio Marco INDAP-PRODEMU Instituto de
Desarrollo Agropecuario – INDAP, Ministerio de Agricultura, Gobierno de Chile,
Santiago, Chile.
INDAP, 2014b. Respuesta SIAC - INDAP. Instituto de Desarrollo Agropecuario – INDAP,
Ministerio de Agricultura, Gobierno de Chile, Santiago, Chile.
INDAP, 2015. INDAP en cifras. Instituto de Desarrollo Agropecuario – INDAP, Ministerio de
Agricultura, Gobierno de Chile, Santiago, Chile.
INE, 2007. VII Censo Nacional Agropecuario y Forestal. Instituto Nacional de Estadística – INE,
Gobierno de Chile, Santiago, Chile.

Chapter 6 GENERAL DISCUSSION
154
Jaime, MM, Salazar, CA (2011) Participation in organizations, technical efficiency and
territorial differences: A study of small wheat farmers in Chile. Chilean Journal of
Agricultural Research 71, 104-113.
Kapelko, M, Oude Lansink, A, upcoming. Dynamic Multi-Directional Inefficiency Analysis of
European Dairy Manufacturing Firms.
Kapelko, M, Oude Lansink, A, Stefanou, S, upcoming. Input-Specific Dynamic Productivity
Change: Measurement and Application to European Dairy Manufacturing Firms.
Karakaya, F (2000) Market exit and barriers to exit: Theory and practice. Psychology and
Marketing 17, 651-668.
Kelly, E, Shalloo, L, Geary, U, Kinsella, A, Thorne, F, Wallace, M (2012) The associations of
management and demographic factors with technical, allocative and economic
efficiency of Irish dairy farms. Journal of Agricultural Science 150, 738-754.
Kinsella, J, Goetz, SJ, Partridge, MD, Deller, SC, Fleming, D (2010) Evaluating RD Policies for
Social and Human Capital Development. EuroChoices 9, 42-47.
Lapar, ALM, Garcia, A, Aditto, S, Suriya, P (2005) Measuring cost efficiency in smallholder
dairy: empirical evidence from Northeast Thailand. In 'American Agricultural Economics
Association Annual Meeting. Providence, Rhode Island', 24 - 27 July 2005.
Latruffe, L (2010) 'Competitiveness, Productivity and Efficiency in the Agricultural and Agri-
Food Sectors.' (OECD Publishing: Paris, France)
Latruffe, L, Balcombe, K, Davidova, S, Zawalinska, K (2004) Determinants of technical
efficiency of crop and livestock farms in Poland. Applied Economics 36, 1255-1263.
Latruffe, L, Balcombe, K, Davidova, S, Zawalinska, K (2005) Technical and scale efficiency of
crop and livestock farms in Poland: does specialization matter? Agricultural Economics
32, 281-296.
McMillan, SS, Kelly, F, Sav, A, Kendall, E, King, MA, Whitty, JA, Wheeler, AJ (2014) Using the
Nominal Group Technique: how to analyse across multiple groups. Health Services and
Outcomes Research Methodology 14, 92-108.
MINAGRI, 1990. Ley Orgánica del Instituto de Desarrollo Agropecuario, Ministerio de
Agricultura – MINAGRI. Santiago, Chile.
Motsenbocker, CE, Hinson, RA (2003) Forming a consensus in agricultural development
issues and constraints: Using the nominal group technique. Acta Horticulturae 621, 81-
87.
Murillo-Zamorano, LR (2004) Economic efficiency and frontier techniques. Journal of
Economic Surveys 18, 33-45.
Neyman, J (1934) On the Two Different Aspects of the Representative Method: The Method
of Stratified Sampling and the Method of Purposive Selection. Journal of the Royal
Statistical Society 97, 558-625.

155
Nganga, SK, Kungu, J, de Ridder, N, Herrero, M (2010) Profit efficiency among Kenyan
smallholders milk producers: A case study of Meru-South district, Kenya. African Journal
of Agricultural Research 5, 332-337.
O'Neill, S, Leavy, A, Matthews, A (2002) Measuring productivity change and efficiency on
Irish farms, Rural Economy Research Centre, Teagasc. Teagasc, Carlow, Ireland.
Available at
https://www.researchgate.net/profile/Alan_Matthews/publication/253356620_Measur
ing_Productivity_Change_and_Efficiency_on_Irish_Farms/links/54a13daa0cf256bf8bae
6a28.pdf.
OECD (2011) 'Fostering productivity and competitiveness in agriculture.' (Organisation for
Economic Cooperation and Development – OECD: Paris, France)
OECD (2014) 'OECD Rural Policy Reviews: Chile 2014.' (OECD Publishing: Paris, France)
Otieno, DJ, Hubbard, L, Ruto, E (2012) Determinants of technical efficiency in beef cattle
production in Kenya. In 'International Association of Agricultural Economists (IAAE)
Triennial Conference. Foz do Iguacu, Brazil', 18 - 24 August 2012.
Oyarzún, E, Miranda, B (2011) La economía rural en Chile: entre la pobreza y el desarrollo.
Estudios de Economía Aplicada 29, 31-56.
Polson, R, Spencer, D (1991) The technology adoption process in subsistence agriculture: The
case of cassava in Southwestern Nigeria. Agricultural Systems 36, 65-78.
Prager, K, Nienaber, B, Neumann, B, Phillips, A (2015) How should rural policy be evaluated if
it aims to foster community involvement in environmental management? Journal of
Rural Studies 37, 120-131.
Pushkarskaya, H, Vedenov, D (2009) Farming exit decisions by age group: Analysis of tobacco
buyout impact in Kentucky. Journal of Agricultural and Applied Economics 41, 653-662.
Rakipova, AN, Gillespie, JM, Franke, DE (2003) Determinants of technical efficiency in
louisiana beef cattle. Journal of the ASFMRA 66, 99-107.
Simar, L, Wilson, PW (2007) Estimation and inference in two-stage, semi-parametric models
of production processes. Journal of Econometrics 136, 31-64.
Simar, L, Wilson, PW (2011) Two-stage DEA: Caveat emptor. Journal of Productivity Analysis
36, 205-218.
Simar, L, Wilson, PW (2015) Statistical Approaches for Non-parametric Frontier Models: A
Guided Tour. International Statistical Review 83, 77-110.
Singbo, A, Oude Lansink, A (2010) Lowland farming system inefficiency in Benin (West
Africa): directional distance function and truncated bootstrap approach. Food Security
2, 367-382.
Tangen, S (2005) Demystifying productivity and performance. International Journal of
Productivity and Performance Management 54, 34-46.
Chapter 6 GENERAL DISCUSSION
156
Uzmay, A, Koyubenbe, N, Armagan, G (2009) Measurement of efficiency using data
envelopment analysis (DEA) and social factors affecting the technical efficiency in dairy
cattle farms within the province of Izmir, Turkey. Journal of Animal and Veterinary
Advances 8, 1110-1115.
Verbeek, M (2012) 'A guide to modern econometrics.' (John Wiley & Sons, Ltd.: Chichester,
UK)
von Cramon-Taubadel, S, Saldias, R (2014) Access to credit and determinants of technical
inefficiency of specialized smallholder farmers in chile. Chilean Journal of Agricultural
Research 74, 413-420.
WorldBank (2015) 'Indicadores de desarrollo mundial - Población rural.' Available at
http://databank.bancomundial.org/data/views/reports/tableview.aspx#
Zhan, J, Wu, Y, Zhang, X, Zhou, Z (2012) Why do farmers quit from grain production in China?
Causes and implications. China Agricultural Economic Review 4, 342-362.
Zhu, X, Karagiannis, G, Oude Lansink, A (2011) The impact of direct income transfers of CAP
on greek olive farms' performance: Using a non-monotonic inefficiency effects model.
Journal of Agricultural Economics 62, 630-638.
Zollinger, B, Krannich, R (2002) Factors Influencing Farmers' Expectations to Sell Agricultural
Land for Non-Agricultural Uses. Rural Sociology 67, 442-463.

157


SUMMARY
ACKNOWLEDGEMENTS
CURRICULUM VITAE
TRAINING AND SUPERVISION PLAN

SUMMARY
160
161
Summary
Rural regions in Chile are shifting from an agriculture-based economy to a services-
oriented economy, where agriculture nevertheless remains a key economic factor for
development (OECD 2014). Accordingly, the Chilean government provides financial support
for fostering entrepreneurship among small farmers to enable them to become more
competitive in global markets (MINAGRI 1990; INDAP 2013). Despite this support, a
declining number of farmers and an aging population are observed in rural areas (Apey and
López 2011; Oyarzún and Miranda 2011; WorldBank 2015).
Over the last decade, the Chilean government has increased its budget for rural
development programs by 77% (INDAP 2015). During the same period, a decline in rural
population of up to 40% has been observed in some areas (Oyarzún and Miranda 2011).
These conflicting observations raise the following question: why is the rural population
continuing to decrease in spite of the increased investment in rural development programs?
Part of the answer may lie in the focus of rural development programs. Most rural
development programs focus on increasing competitiveness (Tangen 2005; OECD 2011),
whereas the stay-exit decision in agriculture is also affected by the characteristics and
preferences of farmers and their families (Boehlje 1992; Pushkarskaya and Vedenov 2009;
Kinsella et al. 2010), and rural development policy (Prager et al. 2015). However, a full
answer to this question requires an in-depth understanding of the mechanisms driving the
stay-exit decision in farming and of how this knowledge can be used to improve rural
development policy.
To fill this current knowledge gap, the overall objective of this dissertation was to
provide technical and socioeconomic information that is useful for improving the
effectiveness of rural development programs, which are seen as the tool for stopping rural
migration. The technical and socioeconomic information is focused on providing a better
understanding of the factors underlying the stay-exit decision and economic development in
rural areas. This dissertation also shows how this knowledge can be used by policy makers
to redirect rural development policy and programs to improve their effectiveness in
reducing rural migration.
Chapter 2 analyzed the role of socioeconomic variables in the stay-exit decision in
farming. The variables were identified from the main theory involved in the stay-exit
decision problem, efficiency theory, and two complementary theories: exit barrier theory
and life-cycle theory. A questionnaire based on these three theories was developed and
applied in southern Chile to collect technical and socioeconomic information from 212 small
livestock farmers. A probit model was used to identify the variables that affect the likelihood
to stay farming. The results show that 12 out of 30 parameters were significant (P<0.10),
with an extremely good fit of the model (McFadden pseudo-R2 = 0.25, Count R
2 = 75.9%).

SUMMARY
162
The following variables were positively associated with the stay decision: female farmer,
positive expectation about future farming life, capacity of farm income to cover the
expenses of the whole family, mixed production, participation in an association, and
distance to the nearest city. Six variables were negatively associated with the stay decision:
existence of a defined retirement age, existence of a defined sale price for the farm, a mixed
farm focused on livestock production, the possibility to make own decisions, age squared,
and the number of people living at the farm. In developing countries, rural development
policies that aim to improve the likelihood to stay farming traditionally address the technical
characteristics of farming. The empirical findings in Chapter 2 suggest that farmer
characteristics (gender and family size), the farming system (multivariate production and
efficiency), and social aspects of rural society (associations and protection of agricultural
products) are also important aspects that should be considered in rural development
policies.
Chapter 3 used technical, economic, and social data from the questionnaire developed
in Chapter 2 to explore the scope for improving the technical efficiency (TE) of farms and to
identify the variables influencing TE. Data envelopment analysis was used to estimate the TE
with which 147 small livestock farmers operate. The relation of potential external variables
with TE was estimated using a bootstrap truncated regression model. The results show that
farmers could reduce their input use by 30% and still produce the same level of output
(TE=0.70). A large percentage (69%) of farmers in the sample could improve their TE by
increasing the size of their operation. Results in Chapter 3 suggest that rural policy programs
should consider off-farm income, farmer participation in a cooperative, farmer age, family
size, family labor, and distance as key external variables to improve the competitiveness of
these farmers.
Chapter 4 explored in-depth the possibilities for improving TE. The input-specific
technical inefficiency of a sample of small livestock farmers in southern Chile was analyzed
using a nonparametric directional input distance function, followed by a single truncated
bootstrap procedure to identify the association of technical inefficiency with a set of
external variables. Results from Chapter 4 show that input use can be reduced by 26% to
37%, while still obtaining the same quantity of output. External variables, such as farm
characteristics, characteristics of the farmer and family, farmer expectations, and
government subsidies, affect the technical inefficiency of input use. The effects of the
external variables varied across inputs. The results of Chapter 4 suggest that policies should
specifically consider interventions targeted at reducing the inefficiency of livestock. They
also suggest that both distance and alternative on-farm work for family members play an
important role in farm productivity. Lastly, these results indicate that subsidies should be
reallocated to increase productivity.

163
Chapter 5 hypothesized that the current budget allocation among rural development
programs is inconsistent with the effectiveness of each program in achieving the policy goals
of improving competitiveness and enhancing family income. This chapter identified the rural
development programs provided to small farmers in Chile and elicited the opinion of experts
regarding the effectiveness of these programs in achieving the main INDAP goals. Multi
criteria analysis was used to analyze the responses from the experts. Finally,
recommendations for improving the effectiveness of INDAP programs were developed in a
workshop using a nominal group technique. Results in Chapter 5 show that rural
development policy in Chile is strongly based on subsidies and that there is a large variation
in the allocated budget among rural development programs, i.e. from 1% to 23%. The
results also show a discrepancy between the allocation of the INDAP budget and the
perceived effectiveness of the rural development programs in achieving the overall INDAP
goal, as assessed by experts. The results from Chapter 5 suggest that the achievement of
INDAP goals would be facilitated by reducing the number of INDAP programs or reallocating
budget from programs that focus on improving the quality of soil/prairies to programs that
focus on fostering social and organizational capital development.
In the general discussion (Chapter 6) the results from Chapter 2 to 5 were synthesized
and discussed in a wider context. This chapter also reflected on the research approach and
methods used in this dissertation, elaborated implications for policy makers, and outlined
directions for future research. On the basis of the research chapters the following main
conclusions are drawn:
- The main stated aim of all INDAP programs is to increase the income provided by the
farm, which in turn is positively associated with the decision of small livestock farmers
to stay farming (Chapters 2 and 5).
- The income provided by off-farm activities has no relation with the decision to stay
farming, but is associated with lower farm TE (Chapters 2, 3, and 4).
- Participation in cooperatives or other types of associations is positively associated with
the decision to stay farming; INDAP programs that promote social and organizational
development, such as DPEA and PA, are also seen by policy makers as the most
effective programs to achieve INDAP goals (Chapters 2 and 5).
- INDAP programs that promote social and organizational development, such as DPEA
and PA, must be carefully (re)designed because they are associated with lower farm TE
(Chapters 3 and 4).
- The common practice of improving the quality of roads, which in turn reduces transport
time, is associated with both a lower probability to stay farming and lower farm TE
(Chapters 2, 3, and 4).

SUMMARY
164
- Farmer’s age and family labor have no association with the likelihood to stay farming,
but are associated with lower farm TE (Chapters 2, 3, and 4).
- Female farmer and having a positive expectation regarding future farming life are
positively associated with the decision to stay farming (Chapter 2).
- Agricultural education of the farmer is negatively associated with the input-specific
technical inefficiency of land and labor (Chapter 4).
- Family size is negatively associated with the decision to stay farming and with lower
farm TE, and is also associated with lower input-specific technical inefficiency of land
and higher input-specific technical inefficiency of other costs (Chapters 2, 3, and 4).
- The presence of a successor is positively associated with the input-specific technical
inefficiency of labor (Chapter 4).
- The motivation of the farmer to stay farming has no relation with overall farm TE, but is
associated with higher input-specific technical inefficiency of labor and other costs
(Chapters 3 and 4).
- Subsidies for both machinery and animals are associated with lower input-specific
technical inefficiency of land; whereas subsidies for prairie are associated with lower
input-specific technical inefficiency of labor and livestock. Subsidies for equipment or
infrastructure have no effect on the technical inefficiency of any input (Chapters 4 and
5).

165
Acknowledgements
Finally it’s done!!! A journey plan that started in my childhood: “some years abroad for
having a taste of other cultures” I said to myself several times and many years ago. Today, I
can say that I accomplished this goal, which came along with a PhD degree. Now, seated in
my current work place and trying to remember when this plan started to be a plan or either
how many people were involved on it; a deep feeling caught me, some tears blurred my
sight, and a profound breath did make me realize of two things. Firstly, that these years
abroad were not planned. Secondly, that so many people have been around me and
supporting me since I left my parents city when I was 18 years old. I hereby I would like to
express my gratitude to them.
First of all, I would like to thank my promotor Prof. Dr Alfons Oude Lansink and my co-
promotor Dr Helmut Saatkamp for the support they gave me before, during, and after my
four years in the Business Economics Group (BEC). Alfons, thank you very much for all your
guidance and support when writing papers, but many thanks for cheering me up in those
moments when Helmut demanded me things that, until nowadays, I have no clue about
what he was asking me for.
Secondly, to my daily supervisor, Helmut... thanks for your patience when reading my
paper drafts, thanks also for strongly criticizing them. I knew that was your way to encourage
me for improving my work, which, coincidently, is also my own way to encourage my
students. More than once, I told you: “Don’t worry, I understood you and your ways, because
(I believe) we are pretty similar”. Dear Helmut, thank you very much for your support during
these years. I will never forget your clear supportive attitude during the workshop we did in
Valdivia, Chile. Thank you very much for the awesome dinners we had at your own place
with Éva and Jamal.
I would like to thank Jeanette, Ilona, and Anne for their invaluable support. Thank you
very much dear Jeanette for always being there when I needed a word. You were the only
BEC member who saw me (almost) crying after having a meeting with my supervision team
where the output was not the expected one. Thanks for being there. Mooie Ilona, thanks for
all your help with small, yet too important, details for me. Thanks for teaching me some
Dutch words as well. Anne... who or what can be moved without Anne’s approval? Thanks
Anne for being there as well. Thanks for being that Spanish lifeguard when my English was
not enough for explaining myself.
Thanks to my colleagues at the BEC, but especially to my closest friends: Tamara
Bergstra, Éva Gocsik, Farahnaz Pashaei Kamali (my dearest Iranian sister and paranymph 1!),
Tariku Beyene, Xuezhen Guo, and João Augusto Rossi Borges. Clearly the life with you guys
was full of funny moments, enjoyable time together in and out of office: beach volley, beers
(otherwise, cider or wine), travels, awesome dinners, and so on. Thanks you all for giving me

ACKNOWLEDGEMENTS
166
the chance to know you... I’m “the king of the paranymphs” (by Pashaei Kamali 2015)
because of you all. I was honored (several times) with such an offer! (except Tariku who is
still too young for defending his thesis. Btw: “Ahí teníh”) Thanks for that my friends, I hope
we continue in touch for long, long time.
Thanks also to colleagues of the WASS PhD council: Sabina Super, Albert Aalvanger,
Lotte van der Zanden, and Paul Rotering for making the days shorter and full of activities
around the PhD issues.
A hug thanks to my mates of WaHo. I think the time was never enough to enjoy the
time together, either in the battle field, in the canteen, even in the shower... such funny
times we had together guys. I will never forget you buddies, how I could do it? If one of you
gave me a really bad pass that I broke my finger when trying to save that ball. Especially
thanks Adam Folta, Jeroen Hendrinks, Anna Solcerová, and Olga Solcerová for those beach
volley match that we used to have during “summer” days. Cheers to you guys!!!
I would like to thank my landlord and his lovely family, who made me feel at home,
even considering the 13,000 kms distance from my home country. Thanks to Robert Jan van
Oosten and Femke Brouwer, and their children Floris Jan and Art Jan.
I also met a lot of new Chilean friends in Wageningen (with some Dutch extensions):
Loreto Amador and Henk van Dijk, Mauricio Opazo and Grace Gómez, and their children
“Patito” and Maite; Manuel Toledo and Daphne Geelen, Daniela Bustos and Labrita; Andrés
Schlageter; Silvia Vega; Pamela Bachmann; Nikolas Stüdemann; and (my Chilean putative
sister) Marcia Bodero (and paranymph 2!). Thanks to all of them for their friendship and for
those good, and sometimes all night long, parties we had.
Almost landing in Chile, now it is time to say thank you to my own work place, the
Faculty of Veterinary Sciences of the Universidad Austral de Chile (UACh), and to my
colleagues at Animal Science Institute (CIAN). Thanks for giving me these four years for doing
my PhD training. Thanks also for always facilitating my field work using some spare office,
printer, phone, etc. at CIAN. Especially thanks to titular professor José de la Vega Malinconi
for encouraging me to do my best in my own way, for cheering me up when I was going in
another way, the one no one follows (as usual), and for increasing my self-confidence in a
world where the values are in a continuing change. Thanks also to titular professor Dr Néstor
Tadich for supporting my permission, as Faculty Dean, to do my PhD training. Thank you José
and Néstor for your accurate and wise advices. I would also like to thank Ricardo Vidal, a
former university teacher, for always believing in me, and for pushing me to become my own
leader, for going out of the shadow of other leaders. Thanks Ricardo. Finally, I would like to
thank Dr Rubén Pulido, current Faculty Dean, and Dr Carmen Gallo, current CIAN chair, for
giving to me all the facilities to finish my PhD training and to smoothly resume my academic
activities at CIAN.

167
I want to thank CONICYT (National Commission for Scientific and Technological
Research) of the Chilean Government through the BecasChile Program for providing me the
funds to pursue this PhD project. I would like to thank INDAP (Agricultural Development
Institute) for providing me the access to farmers. Yet I would like to especially thank the
farmers who kindly provided data for this study and the agriculture advisors for helping with
the data collection, as well.
I would like to say thank to my closest friends in Chile and my lovely family. Thanks Juan
Tarumán, Erma Navarro, Patricia Monckton, Francisca Castro, and Stephanie Ellis (R.I.P.).
Thanks aunt Mili, my uncle Aldo (R.I.P.), my cousins Alejandra, Claudia, and Valeria for
sending me messages and keeping in touch with encouraging talks. My dear and beloved
sister (the real and the only one) Carmen Pamela, no words to say how much I love you and
how much I owe you... just writing this 1.5 line made my tears came out. Thanks nephews
Luis Matias (Mati) and Ignacio (Igna), you were always worried about my feelings and
counting down the days to be together again. I remember, as it was yesterday when, Mati
sadly said: “Uncle you will come back when I am 12 years old” or when Igna said several
times: “I miss you uncle, when are you coming?” Thanks to my brother in law, Luis Contreras,
for taking care of my family while I was abroad and for giving good thoughts about living far
away from home. Thanks to Felipe, the youngest Carter in our family (1 year old), for being
the entertainment of the whole family.
Last but not least, I would like to thank my mom Lucinda del Carmen, such a sweet and
strong woman. I will never understand (or at least try to do it) how easily you put yourself
aside to ensure the welfare of your entire family. You have been always at my side, giving
good advices, tasty meals, and nice gifts, but also putting the borders... You have been my
favorite accomplice! Thanks for that Lucy. Dad, Luis Alberto Hernán, you have been a good
father, a bit of a fool but always there. You have that particularity, a kind of sixth sense,
which makes you contact me when I am in some “crucial” situation. There are no words to
describe our Carter2 relationship. Thanks mom and dad for teaching me that we have to do
our best, be responsible, and that we cannot fail. Thanks for allowing me to fly with my own
wings!
Thanks to you all...

169
Curriculum vitae
Luis Miguel Carter Leal was born on October 9, 1980 in Temuco, Chile. In 1999, he
moved 160km south of his hometown to study veterinary medicine in the Faculty of
Veterinary Sciences of the Universidad Austral de Chile (UACh), in Valdivia (Chile). In his
veterinary medicine thesis, he analyzed the effects of long distance transport on the meat
quality in lambs. In 2006, he entered the Master of Business Administration at the same
University. During his MBA, he analyzed the human resource productivity in Chilean dairies.
In the meantime, he also worked in implementation of animal welfare strategies in beef
cattle in Chile project, and worked, for some months, as a meat grader in slaughterhouses in
Rockhampton and Beenleigh, Queensland, Australia.
Since 2007, the author has been working at UACh’s Animal Sciences Institute (CIAN),
focusing mainly on the development and evaluation of innovative farming projects that
combine high efficiency standards, animal welfare, and human capital. In 2009, he started to
work as instructor professor at CIAN, teaching rural economy, farm management, and
preparation and evaluation of projects courses. In 2011, he was granted an abroad PhD
scholarship from the Chilean Government through the BecasChile program. In 2012, he
enrolled in the PhD of Business Economics Group, Wageningen School of Social Sciences
(WASS) at Wageningen University (WU), Wageningen, the Netherlands. His PhD research
analyzed stay-exit decisions of small sized livestock farmers in Southern Chile to support
government rural policy aimed at increasing the likelihood of farmers staying on their
agribusinesses. In this way, Luis aimed to contribute to improving the living conditions in
rural Chile.
During his PhD training, besides of completing his education program, Luis was a WASS
PhD council member, where he was the representative for the WASS Education Committee.
In addition, Luis was an active player of WaHo volleyball club at WUR and he was also the
finance director of the 9th
Encuentros Chile Conference, which took place in Rotterdam in
2015. Luis also was a director of the Chilean Student Association in Wageningen University –
AIECh.
In March 2016, Luis resumed his work at CIAN, UACh.


171
Training and Supervision Plan
Luis Miguel Carter Leal
Wageningen School of Social Sciences (WASS)
Name of the learning activity Department/Institute Year ECTS*
A) Project related competences
Economic Models, AEP30806 WASS 2012 6
Advanced Agricultural Business Economics, BEC
30306
WASS 2012 6
Quantitative Data Analysis: Multivariate
Techniques, YRM 60306
WASS 2012 3
Writing Research Proposal WASS 2012 6
Advanced Econometrics, AEP 60306 WASS 2014 6
B) General research related competences
WASS Introduction Course WASS 2012 1
Workshop with Policy-makers Valdivia-CHILE 2015 1
C) Career related competences/personal development
Mobilising your-scientific-network WGS 2012 1
Techniques for Writing and Presenting a Scientific
Paper
WGS 2012 1.2
Participation PhD meetings Business Economics
Group (BEC), WUR
2012-
2015
4
Finance Director and organizer of the Conference
“Encuentros Chile Global Rotterdam 2015”
Encuentros Chile Global
Rotterdam
2014-
2015
1
WASS PhD Council Member, organization of PhD
Days and Career events; Representative for the
WASS Education Committee
WASS 2014-
2016
6
Total 42.2
*One credit according to ECTS is on average equivalent to 28 hours of study load.

Colophon
The research described in this thesis was financially supported by CONICYT (National
Commission for Scientific and Technological Research) of the Chilean Government
through the BecasChile Program.
Financial support from Wageningen University for printing this thesis is gratefully
acknowledged.
Cover photo and design The author
Lay-out The author
Printed by Digiforce / Proefschriftmaken.nl, Vianen