improving the built environment...improving the built environment moisture monitoring in exterior...
TRANSCRIPT

IMPROVING THE BUILT ENVIRONMENT
Moisture Monitoring in Exterior Walls
August 2011
Lois B. Arena Steven Winter Associates, Inc.
© 2011 Steven Winter Associates, Inc. All rights reserved.

Overview of Presentation
Project Summary
Reasons for research
Questions to be answered
Modeling
Field Testing Analysis
© 2011 Steven Winter Associates, Inc. All rights reserved.

Project Summary
Evaluate potential for moisture problems in 3 new wall assemblies
Modeling – this year WUFI THERM
Field Monitoring – beginning 2012 Brick rehab High‐R walls: R‐40 & 60 Code walls: hybrid insulation w/ spray foam & fiberglass
© 2011 Steven Winter Associates, Inc. All rights reserved.

Reasons for Research
Changes in construction due to: Drastic increase in retrofit activities
Programs like PH & NZEH challenges
Increased use of hybrid insulation strategies
New insulation products Code changes
© 2011 Steven Winter Associates, Inc. All rights reserved.

Reasons for Research
Changes include: Increased use of foam insulation
Increasing thickness & R‐value of walls
Increased use of hybrid insulation strategies
Changes in vapor retarder/barrier strategies
© 2011 Steven Winter Associates, Inc. All rights reserved.

Research Focus
Assemblies Brick walls with interior insulation;
Super insulated walls at least 12” thick: R‐40 and R‐60;
Code built walls using spray foam insulation and fiberglass batts.
© 2011 Steven Winter Associates, Inc. All rights reserved.

Research Focus
Climate zones 4A, 5A, 6A and 7 experience both cooling and heating seasons considerable humidity during the summer
© 2011 Steven Winter Associates, Inc. All rights reserved.

Questions to be Answered
How does WUFI modeling compare to actual monitored moisture levels?
What combinations of building and insulation products produce a durable, efficient wall assembly?
Do any of the monitored wall systems show moisture accumulating? If so, where?
© 2011 Steven Winter Associates, Inc. All rights reserved.

Questions to be Answered
If high moisture conditions exist, are levels and durations long enough to risk mold and/or decay?
If high levels of moisture occur, can the cause be determined?
Can differences in modeling and monitoring be explained?
Are the R‐values specified in Table 601.3.1 of the 2009 IRC sufficient to prevent condensation?
© 2011 Steven Winter Associates, Inc. All rights reserved.

Modeling ‐WUFI
Table 1. 2009 IRC Code Wall Assemblies to be Evaluated in WUFI
Climate Zone Medium Density (MD) SPF Insulation (R-value)1
Cavity R-value (2009 IRC)2
4 2.5 – 7.4 R13 Marine 43 3.75 – 8.6 R20
5 7.5 – 12.4 R20 6 11.25 – 14.5 R20 7 15 – 18.25 R21
1Lower R-value in each range is based on the minimum R-value of 2lb foam required by the 2009 IRC, Table R601.3.1 Class III Vapor Retarders.2Climate Zone 4 (A & B) assume 2x4 wall cavity, all others are 2x6.3Marine 4 is moisture regime C.
© 2011 Steven Winter Associates, Inc. All rights reserved.

Modeling ‐WUFI
Table 1. Brick Wall and High-R Walls to be Evaluated in WUFI
Wall Type
Vapor Retarder
Cavity Insulation
Cavity Insulation Thickness (inches)
Spray Foam Thickness3
(inches)
Sheathing Type
Sheathing Thickness4
(inches)
Brick Wall
None, 0.1, 1.0
Fiberglass 2-5 0.5 - 2 n/a n/a Cellulose 2-5 0.5 - 2 n/a n/a
R-40+1
None, 0.1, 1.0
Fiberglass 5-8 2-4 OSB 0.5 --
XPS
2-4
Cellulose 5-8 2-4 OSB 0.5 --
XPS
2-4
R-60+2
None, 0.1, 1.0
Fiberglass 8-12 4-6 OSB 0.5 -- XPS 4-6
Cellulose 8-12 4-6 OSB 0.5 -- XPS 4-6
1Evaluated in Climate Zones 4 & 5 2Evaluated in Climate Zones 6-8 3Spray foam will be evaluated in 1” increments4 XPS will be evaluated in 1” increments
© 2011 Steven Winter Associates, Inc. All rights reserved.

Modeling ‐ THERM
WUFI can only analyze continuous components
Want to analyze condensation potential due to thermal bridging at framing members ‐THERM
Image from THERM
© 2011 Steven Winter Associates, Inc. All rights reserved.

Field Testing
Short Term moisture content of components using a hand held moisture meter
Adjust values in WUFI if necessary
Long Term RH & Temp at critical interfaces Moisture content – OSB, brick, studs Climatic conditions
© 2011 Steven Winter Associates, Inc. All rights reserved.

Failure Criteria
Moisture Content (MC) Condensation
Mold growth
Critical water content Rot/decay Freeze‐thaw cycles
© 2011 Steven Winter Associates, Inc. All rights reserved.

MC & Condensation Potential
Moisture Content (MC) of OSB < 20%
Condensation Potential – graph interior air dew point temp vs. surface temp Several interfaces will be analyzed – OSB/foam, foam/cavity insulation, interior surface of brick
THERM – framing/OSB, framing/insulation
© 2011 Steven Winter Associates, Inc. All rights reserved.

Moisture Content
Representative City
Wall ID
Climate Zone
FG insulation thickness (in)
MD SPF Ins. Thick (In)
Vapor Barrier Perm rating
Avg. MC in OSB %
Nashville, TN 4A‐1 4A 2.6 0.4 None 12.4 4A‐2 4A 2.2 0.6 None 12.0 4A‐3 4A 1.8 0.9 None 11.6 4A‐4 4A 1.4 1.1 None 11.4 4A‐5 4A 2.6 0.4 1.0 10.8 4A‐6 4A 2.2 0.6 1.0 10.8 4A‐7 4A 1.8 0.9 1.0 10.7 4A‐8 4A 1.4 1.1 1.0 10.6
© 2011 Steven Winter Associates, Inc. All rights reserved.
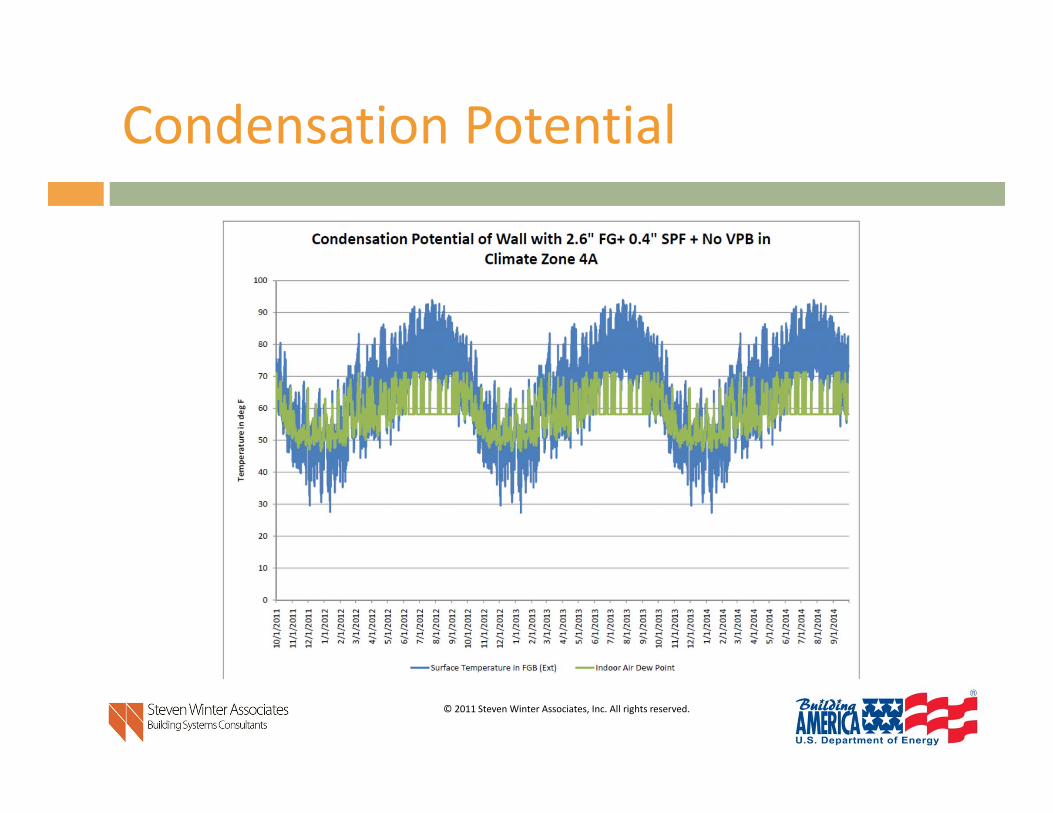
Condensation Potential
© 2011 Steven Winter Associates, Inc. All rights reserved.
Mold Growth
Following conditions must be met: Temperature is between 32o and 122oF, Relative humidity is above 70%, Food is present for the mold, There is sufficient time for germination and growth to occur,
Other factors such as pH value, salt content of the substrate, light, oxygen content, surface condition and biotic influences must be favorable for growth
© 2011 Steven Winter Associates, Inc. All rights reserved.

Mold Growth
Table 1. Critical Humidity (RH %) Levels for Mold Growth and Decay on Different Materials.
Material Mold Growth Decay
Pine sapwood >80-95 >90
Particle Board >80-95 >90
Gypsum Board >80-95 >95
Fiber board >80-95 >95
Wall papers >75-95 >90
Different coatings >75-95 -
(Table reproduced from ASTM MNL 40)
© 2011 Steven Winter Associates, Inc. All rights reserved.

Mold Growth
ASHRAE Standard 160 4A -Wall1: 24Hour Mo ving Averag e
O ct 11 Dec 11 Feb 12 Apr 12 J un 12 Aug12 Oc t 12 Dec 12 Feb 13 May 13 J ul 13 Sep1 3 Nov13 Jan 14 Mar 14 May 14 J ul 14 Sep1 40
20
40
60
80
100
120
T em
pera
tur e
(F)
O ct 11 Dec 11 Feb 12 Apr 12 J un 12 Aug12 Oc t 12 Dec 12 Feb 13 May 13 J ul 13 Sep1 3 Nov13 Jan 14 Mar 14 May 14 J ul 14 Sep1 4 0
20
40
60
80
100
120
Rel
ativ
e Hu
m id
ity(%
)
Tem perature Re lative Hum id i ty
performance criteria: 30–day running average: surface RH<80% & temp 41oF to 104oF
7–day running average: surface RH<98% & temp 41oF to 104oF
24‐h running average: surface RH< 100% & temp 41oF to 104oF
© 2011 Steven Winter Associates, Inc. All rights reserved.
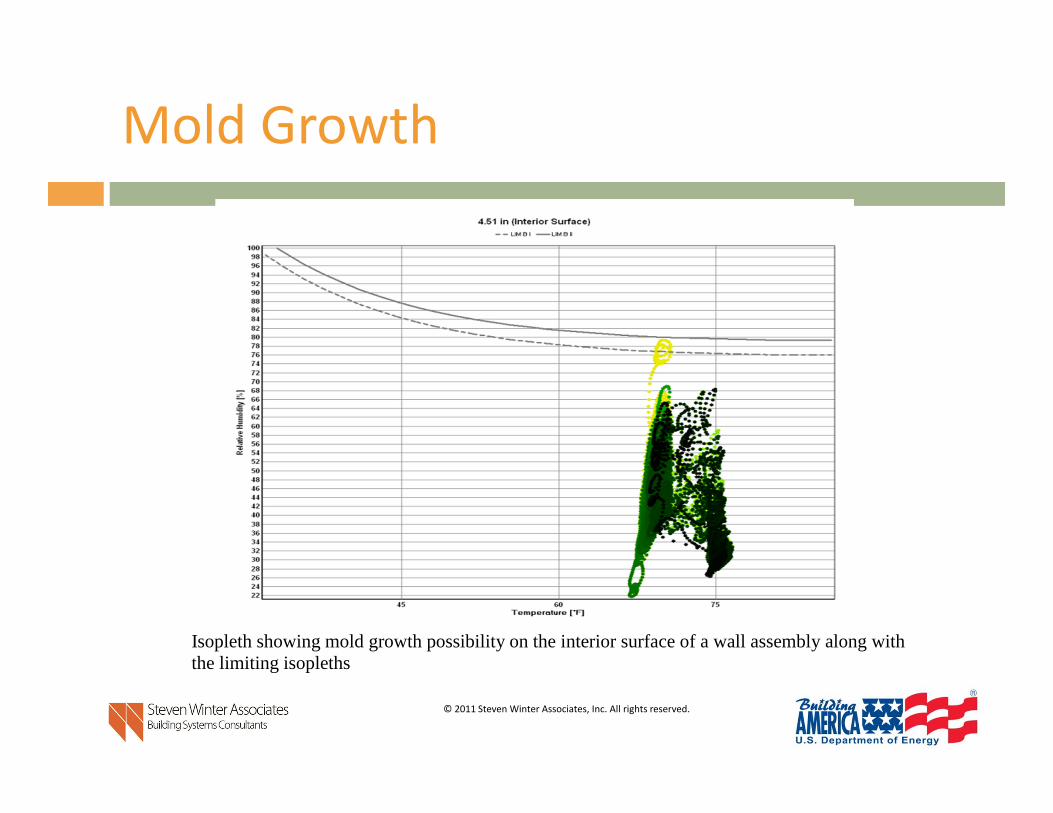
Mold Growth
Isopleth showing mold growth possibility on the interior surface of a wall assembly along with the limiting isopleths
© 2011 Steven Winter Associates, Inc. All rights reserved.

Critical Water Content
© 2011 Steven Winter Associates, Inc. All rights reserved.

Rot/Decay
Typical conditions for decay/rot in building materials: RH ‐ 90‐95% coincident with
Temperature range of 41oF to 104oF.
© 2011 Steven Winter Associates, Inc. All rights reserved.

Freeze‐Thaw Damage
Two factors influence frost damage MC on freezing – critical level for brick 90%
Number of freeze thaw cycles – higher number of cycles, more potential for freeze‐thaw damage
© 2011 Steven Winter Associates, Inc. All rights reserved.
u.Thank yo IMPROVING THE BUILT ENVIRONMENT
Questions?
© 2011 Steven Winter Associates, Inc. All rights reserved.

u.
Thank yo IMPROVING THE BUILT ENVIRONMENT
Thank You.
© 2011 Steven Winter Associates, Inc. All rights reserved.