improving solid waste management in the dar-es …
TRANSCRIPT

IMPROVING SOLID WASTE
MANAGEMENT IN THE DAR-ES-SALAAM
COASTAL BELT, TANZANIA
John Donald Maziku
Degree Thesis for a Bachelor of Natural Resources Degree Programme in Integrated Coastal Zone Management
Raseborg 2014

i
BACHELOR’S THESIS
Author: John Donald Maziku
Degree Programme: Natural Resource Management
Specilization: Integrated Coastal Zone Management
Supervisor: Maria Söderström
Title: Improving Solid Waste Management in the Dar-es-Salaam Coastal Belt, Tanzania
Date 9.6.2014 Number of pages: 140 Appendices: 4
_________________________________________________________________________________
Abstract
The aim of the study was to understand the factors which influence the state of solid waste
management in the Dar-es- Salaam Coastal Belt, Tanzania. The research used semi-structured
and structured interviews, group discussions, field observations and review of various
literatures as the major methods of the study. Questionnaires were used for interviews. Results
showed poor community awareness (except students and beach goers) of solid waste
management and its significance; and of how waste management functions in the
municipality. Results on the factors influencing solid waste generation were: waste generation
increased with increase of population; habits of domestic food preparation generated food
leftovers as waste; over use of plastic bags and containers; reliance on waste disposal rather
than waste prevention. Results on factors influencing inadequate solid waste collection were:
unplanned (squatter) settlements which are not easily accessible; inadequate waste collection
facilities and equipment, lack of motivation within waste collection companies and lack of
enforcement of municipal bylaws. The situation can be improved by providing environmental
and waste management education, enforcement of waste management bylaws and enactment
of national solid waste management legislation and strategy based on the waste management
hierarchy as it is in the European Union and South Africa.
___________________________________________________________________________
Key words: Solid waste management, coastal belt, community based organizations, non-
governmental organization
___________________________________________________________________________
ii
Acknowledgement
First of all I thank the Almighty God for giving me life, good health and University education.
Also I thank my supervisor Maria Söderström for her valuable guidance in the preparation of
my thesis. I too thank Anna Granberg, Head of the Degree programme, Integrated Coastal
Zone Management, for her encouragement and academic advice. I salute all the staff members
of the University and my fellow students for their cooperation which created for me an
enabling learning environment.
I do thank also Mr. Sabi Salula, Permanent Secretary in the Vice President’s Office in
Tanzania, for giving me the privilege of doing my internship in this prestigious State office. I
also thank Dr. Julius Ningu, Director of Environment-Vice President’s Office, for receiving
me in the Division of Environment as an intern. I too thank all the Directors, Assistant
Directors, Principal Officers in the Division of Environment for giving me the assistance I
needed.
I am also grateful to all the environmental experts of the Dar-es-Salaam City municipalities;
Mr. Pearson Kabantega (Ilala), Mr.Katongori Chacha (Temeke) and Mr. Mohamed Msangi
(Kinondoni); and Mr. Richard Kishere, the Pugu-Kinyamwezi Dump Site Manager, who
provided me with essential data for my thesis.
I cannot forget my beloved father and mother Donald and Cecilia Maziku through whom I
was brought to life, for persistently giving me moral, material and financial support
throughout my studies; and my beloved sister Kasana and brother Dominic Maziku for
encouraging me throughout my academic journey. May God bless them and give them long
life.

iii
Table of Contents
Abstract ....................................................................................................................................... i
Acknowledgement....................................................................................................................... ii
Table of Contents .......................................................................................................................iii
List of tables ................................................................................................................................ v
List of figures ............................................................................................................................. vi
1. Introduction ............................................................................................................................. 1
2. Aim of the Research ................................................................................................................ 3
2.1 Objectives of the Research ................................................................................................ 3
3. Waste Management-Related Concepts Defined...................................................................... 3
3.1 Definitions of Solid Waste Management- Related Terms in European Union Legislation3
3.2 Definitions of Solid Waste Management- Related Terms in the Policy and Legislation
Framework of South Africa .............................................................................................. 5
3.3 Definitions of Solid Waste Management- Related Terms in the Policy and Legislation
Framework of Tanzania .................................................................................................... 7
4. The Challenges of Solid Waste Management ....................................................................... 10
5. Solid Waste Management Policy, Legislation and Strategy Frameworks of the EU
(Finland), South Africa and Tanzania ........................................................................ 11
5.1 Solid Waste Management in the European Union .......................................................... 12
5.2 Waste Management Hierarchy (European Union Act on waste management) ............... 13
5.3 Waste Management Practices In the European Union (Case study of the Helsinki
Region in Finland) .......................................................................................................... 14
6. Solid Waste Management in South Africa ............................................................................ 20
6.1 Challenges facing Waste Management in South Africa ................................................. 20
6.2 Waste Management Legislation Framework in South Africa ......................................... 21
6.3 Environmental Management Policy for South Africa, 1998 ........................................... 21
6.5 The National Environmental Management: Waste Act (NEMWA) 2008, Act No. 59 of
2008 ................................................................................................................................ 26
6.6 National Waste Management Strategy (NWMS), No.344, 2012, South Africa ............. 27
6.7 Waste Management Practices in South Africa ................................................................ 27
7. Solid Waste Management in Tanzania .................................................................................. 28
7.1 The Challenge of Waste Management in Dar-es-Salaam ............................................... 29
iv
7.2 Environmental Policies in Tanzania ............................................................................... 30
7.3 National Environmental Policy 1997, Tanzania ............................................................. 31
7.4 National Health Policy 2007, Tanzania .......................................................................... 33
7. 5 Sustainable Industrial Development Policy, 1996, Tanzania......................................... 33
8. Legislation Related to Municipal Solid Waste Management in Tanzania ............................ 33
8.1 Environmental Management Act 2004, Act No. 20 of 2004, Tanzania .......................... 34
8.2 Local Government (Urban Authorities) Act No. 8 of 1982, Tanzania and By-Laws ..... 35
9. Waste Management Practices in Tanzania ............................................................................ 37
10. Material and Methods ......................................................................................................... 39
10.1 Area of Study ................................................................................................................ 39
10.2 Study Population and Study Sample ............................................................................. 42
10.3 Sampling and Data Collecting Methods ....................................................................... 43
11.1 Objective 1: People’s Awareness of Solid Waste Management ................................... 50
11.2 Objective 2: Factors Which Influence Solid Waste Generation, Collection and their
Trends ............................................................................................................................. 70
11.3 Factors affecting solid waste generation and collection in Dar-es-Salaam
Municipalities ................................................................................................................. 75
12. Discussion ........................................................................................................................... 85
13 .Conclusion .......................................................................................................................... 95
14. Recommendations ............................................................................................................... 99
References ............................................................................................................................... 101
Appendices .............................................................................................................................. 105

v
List of tables
Table 1: Population Distribution over Dar-es-salaam Municipalities-2012 ............................. 41
Table 2: Responses from civil society groups on whether they were satisfied with the waste
management services ................................................................................................ 53
Table 3: Responses from Civil Society Groups on whether they were doing anything to reduce
the problem of solid waste ........................................................................................ 54
Table 4: Respondents’ views on why the waste problem continued being experienced .......... 56
Table 5: Responses on whether civil society groups have ever experienced any problem
associated with waste ................................................................................................ 57
Table 6: Responses of Civil society groups on awareness of how waste management functions
in the City Municipalities? ....................................................................................... 58
Table 7: Response on the awareness of where one is supposed to put the waste ..................... 59
Table 8: Respondents’ awareness of where the waste ends after being discharged into the
drains ........................................................................................................................ 61
Table 9: Responses on awareness of whether waste bring harm to the aquatic animals or
plants ......................................................................................................................... 62
Table 10: Respondents’ kinds of relationship with the Indian Ocean ...................................... 64
Table 11: Responses on the kinds of problems found in the Indian Ocean .............................. 65
Table 12: Responses on what should be done to improve the waste situation in the Indian
Ocean ........................................................................................................................ 66
Table 13: The extent the respondents value the Indian Ocean.................................................. 67
Table 14: Responses on whether respondents do anything to improve the Indian Ocean. ....... 68
Table 15: Means through which respondents get informed of what exists in the Ocean......... 69
Table 16: Solid Waste Composition in Dar-es-Salaam: ........................................................... 71
Table 17: State of Solid Waste Generation and Collection in Dar-es-Salaam City:1994-2007 72
Table 18: Solid waste generation and collection in Dar-es-salaam City Municipalities in 201074

vi
List of figures
Figure 1: Part of Dar –es- Salaam coastal City, Tanzania (Left) and Solid waste deposited on a
Dar- es-Salaam Coastal Belt (beach) (Right). Photo: ...............................................viii
Figure 2: The Waste Management Hierarchy ........................................................................... 13
Figure 3: Sorting waste at the generation point in people’s premises in Ekenäs, Finland.
Photo: John Maziku 4.6.2014 ................................................................................... 15
Figure 4: Waste paper container in Ekenäs, Finland. Photo: John Maziku 4.6.2014 .............. 17
Figure 5: Household metal waste container at a collection point in Ekenäs, Finland. Photo:
John Maziku 4.6.2014 .............................................................................................. 18
Figure 6: Glass container at a waste collection point in Ekenäs, Finland. Photo: John Maziku
4.6.2014 .................................................................................................................... 19
Figure 7: Waste energy projects in Finland .............................................................................. 20
Figure 8: Pathway in a squatter area at Buguruni Kwamyamani (left) and Posta area (right) in
Ilala Municipality, Dar-es-Salaam. Photo: John Maziku November, 2013.............. 29
Figure 9: Msimbazi River bank with waste dumped on its slopes (Left) and mixed waste
dumped into Msimbazi River (Right). Photo: John Maziku November 2013.......... 32
Figure 10: Collection point with a mixture of waste at Jamhuri Street in Ilala Municipality,
Dar-es-Salaam. Photo: John Maziku, November 2013. ........................................... 37
Figure 11: KIKUTA Recycling Station at Gongo la Mboto Ward; Ilala Municipality, Dar-es-
Salaam. Photo: John Maziku November 2013. ........................................................ 38
Figure 12: Scavengers at Pugu Kinyamwezi Dumpsite. Photo: John Maziku November 2013.38
Figure 13: Locations and Administrative setup of Dar –es- Salaam with insert showing the
location within Tanzania. ......................................................................................... 40
Figure 14: A Pile of waste mixed with water at Kivukoni Fish Market. Photo: John Maziku
November, 2013. ...................................................................................................... 53
Figure 15: A street in Oysterbay (Left) and a street in Masaki in Kinondoni Municipality,
Dar- es-Salaam (Right) without waste bins. Photo: John Maziku, November, 201360
Figure 15 (a): Trend of Solid Waste Generation in Dar-es-Salaam City: 1994 - 2007 ........... 73
Figure 15 (b): Trend of Solid Waste Collection in Dar-es-Salaam City: 1994 - 2007 ............. 73
Figure 15 (c): Relationship between Solid Waste Generation and Solid Waste Collection ..... 74
Figure 16: Squatter area at Buguruni Kwa Mnyamani in Ilala Municipality, Dar-es-Salaam.
Photo: John Maziku November 2013. ...................................................................... 76

vii
Figure 17: Hand-drawn carts at Buguruni Malapa waste collection point, Ilala Municipality,
Dar-es-Salaam. Photo: John Maziku November 2013. ............................................ 76
Figure 18: Un-official waste collection point at Magomeni-Kanisani, in Kinondoni
Municipality, Dar-es-Salaam. Photo: John Maziku November 2013. ...................... 77
Figure 19: Beach at Ocean Road area, in Dar-es-Salaam without any waste bins. Photo: John
Maziku November 2013. .......................................................................................... 78
Figure 20: A mixture of waste swept on the Ocean Road Beach, Dar-es-Salaam. Photo: John
Maziku November 2013. .......................................................................................... 81
Figure 21: Collection of Solid Waste in some areas of Dar es Salaam use modern transport
equipment. Photo: John Maziku November 2013. ................................................... 83
Figure 22: Scavengers at Pugu Kinyamwezi Dumpsite, Dar-es-Salaam. Photo: John Maziku
November, 2013. ...................................................................................................... 84

viii
Figure 1: Part of Dar –es- Salaam coastal City, Tanzania (Left) and Solid waste deposited on a Dar-
es-Salaam Coastal Belt (beach) (Right). Photo: John Maziku, November 2013.

1
1. Introduction
Municipal Solid Waste (MSW) is a worldwide problem which countries in Europe, Asia,
Africa and elsewhere have been experiencing for a long time (Jatput, R., Prasad, G. &
Chopra, A.K., 2009; Ngoc, U.N. & Schnitzes, H. 2009). When solid waste is not
efficiently and effectively managed it results into serious environmental pollution which
has harmful effects upon people’s health, animals, biodiversity and the environment.
Although there are many human activities across the Western part of the Indian Ocean
bordering Dar-es-Salaam City which take place within and outside the Ocean that might
cause negative effects to the ecosystems and beaches the land activities might be the major
source of pollution to the Ocean. Things such as pesticides and fertilizers from urban
agriculture conducted within the City and the old and modern sewage systems which
discharge sewage waters directly into the Ocean could be harmful to Dar-es-Salaam
Coastal Belt. According to Mrs. Rogathe Kisanga, Principal Chemist, Division of
Environment, Vice President’s Office, Tanzania (personal communication in November,
2013) the official width of the coastal belt in Tanzania extends 60 meters wide inland
along the coast line.
In addition, one of the greatest land-based sources of pollution in the Dar-es-Salaam
Coastal belt which affects the Indian Ocean is marine litter. Marine litter in the Dar-es-
Salaam Coastal Belt appears in different forms of solid waste such as plastics, papers,
glasses, metals, and other kinds of organic waste (Figure 1). Such solid waste is generated
by the high city population and much of it gets swept into the ocean via rivers and streams,
floods, unauthorized dumping into valleys and open drainage systems, surface fishing
activities and irresponsible recreational activities on beaches (Lukambuzi, (2006), staff of
the National Environment Management Council (NEMC), Tanzania in her unpublished
Consultancy Final Report: “National Overview and Assessment on Marine Litter Related
Activities in Tanzania” as an input to the UNEP/Regional Seas Programme on the
management of marine litter in the Western Indian Ocean region.
Improving the Dar-es-Salaam coastal and marine environment is essential because of the
importance of the Indian Ocean to the economy and society of the Dar-es-Salaam City and
2
that of Tanzania in general. The livelihood of many people of Dar-es-Salaam depends on
the Indian Ocean in many ways. For example, the Indian Ocean is a source of food from
aquatic animals such as fish of different species; source of income for fisherman and fish
mongers and provides sandy beaches for tourism and recreation.
In view of such environmental threats posed by municipal solid waste the government of
Tanzania has since a long time taken various policies, and legislative and institutional
initiatives to deal with the problems of the environment including that of solid waste
management including marine littering. While this has been taking place the state of the
Indian Ocean particularly in Dar-es-Salaam City is yet to be clearly known because to-date
there has not been any serious researches on what, how, when and to what extent the
Indian Ocean on the Tanzanian side has been affected by land based marine littering.
Looking at the stress which marine ecosystems in the Indian Ocean experience from
various sources of pollution, particularly land based of the nature of municipal solid waste
(marine litter) type and also its negative effects on people’s health, livelihood, the
environment, beauty of the beaches, economy and tourism, I was highly motivated to
undertake this research on solid waste management in the coastal city of Dar-es-Salaam.
The major aim was to know the reason behind the worsening situation of these problems
despite the government initiatives to reduce the effects of land based sources of pollution
to the Ocean.
The European Union (EU), for instance, also focuses its attention generally on solid waste
management and on marine litter which takes the form of minute plastic materials as a
special type of pollution which has affected central Pacific, the North East Atlantic and
Greece (European Environment Agency, 2010). The litter is found both floating in the
water and at the bottom of the sea floor. The very small plastic particles (as cited by the
European Environment Agency (2010) from Van Franeker et al., 2005, Gregory, 2009)
have been found to cause reproductive, breathing problems to sea animals and birds.
Definitely these similar phenomena cannot be excluded in the Indian Ocean part of the
Dar-es-Salaam Coastal Belt. Countries in Africa such as the Republic of South Africa,
Kenya and others have been taking similar initiatives towards environmental management.
3
2. Aim of the Research
The aim of the research was to understand the factors which influence the state of solid
waste management in the Dar-es- Salaam (City) Coastal Belt.
2.1 Objectives of the Research
The specific objectives of the research were as follows:-
(1) To find out people’s awareness of solid waste management and its significance on
the Dar-es-Salaam (City) Coastal Belt and its environment at large.
(2) To find out factors influencing solid waste generation and collection and their
trends in the Dar- es- Salaam (City) Coastal Belt.
3. Waste Management-Related Concepts Defined
Solid waste management worldwide is guided by and undertaken according to a specific
waste management policy and legal framework of a particular country. The waste
management policies and legislation which, besides other things, define the relevant
concepts which govern the waste management process in a particular country or region. It
is not surprising, therefore, as rightly observed by Kaseva and Mbuligwe (2003) that the
definition of the concept of solid waste and impliedly the definitions of other relevant
waste management concepts differ from country to country. Because this study has also
made a quick comparative survey of the policy and legislation frameworks of three
countries- the European Union (EU), the Republic of South Africa (RSA) and the United
Republic of Tanzania (URT), it is logical also to explore some definitions of concepts that
are related to waste management in the three regions.
3.1 Definitions of Solid Waste Management- Related Terms in European Union
Legislation
Within the legal framework of the European Union there are various directives concerning
waste management which also include definitions of relevant concepts. Specifically,
Directive 2008/98/EC of the European Parliament and the Council establishes the legal
framework for managing waste in the European Union. Also Directive 2008/98/EC lays
down basic concepts and definitions which should apply in the waste management process
within the European Union member countries. Some of the relevant terms used in this Act

4
such as waste, waste management and waste management hierarchy have been defined as
follows:-
“Waste: any substance or object which the holder discards or intends or is required to
discard (Directive 2008/98/EC).” However, the following substances are excluded from
the meaning of waste as used in this piece of legislation:-
- “gaseous effluents;
- radioactive elements;
- decommissioned explosives;
- faecal matter;
- waste waters;
- animal by-products;
- carcasses of animals that have died other than by being slaughtered
- elements resulting from mineral resources” (Directive 2008/98/EC).
The definition of waste restricts the idea of a substance or object to be discarded to a
particular person’s point of view. An object regarded by one person as waste could be
something still useful to someone else. Hence in this sense where waste ends with a
particular person (individual or organization) recycling or reuse takes over.
Another concept, “Waste management,” has been defined in the Directive 2008/98/EC
(Waste Framework Directive) as “the collection, transport, recovery and disposal of waste,
including the supervision of such operations and the after-care of disposal sites, and
including actions taken as a dealer or broker.”
On the other hand the term, “waste management hierarchy” (or simply waste hierarchy) is
defined in the Directive 2008/98/EC as the treatment of waste in line with the following
hierarchy which is listed in order of priority:
Prevention;
preparing for reuse;
recycling;
other recovery, notably energy recovery;
disposal.(Directive 2008/98/EC)

5
These terms expressing the activities which comprise the waste management hierarchy are
in turn defined in the Directive as follows:-
“Prevention” has been defined as the “measures taken before a substance, material or product has
become waste.”
“Recovery” is defined as “any operation the principal result of which is waste serving a useful
purpose.”
“Recycling” has been defined as “any recovery operation by which waste materials are
reprocessed into products, materials or substances whether for the original or other purposes”
(Directive 2008/98/EC).
The other two terms in the Waste Framework Directive; recovery and disposal, were not
defined.
3.2 Definitions of Solid Waste Management- Related Terms in the Policy and
Legislation Framework of South Africa
The National Environmental Management: Waste Act (NEMWA), 2008, Act No. 59 of
2008 provides a good number of solid waste management terms which it defines and
therefore provides good guides in the undertaking of solid waste management plans. The
following is a selection of such terms and their respective definitions:-
"Business waste" means waste that emanates from premises that are used wholly or mainly for
commercial, retail, wholesale, entertainment or government administration purposes;
"By-product" means a substance that is produced as part of a process that is primarily intended to
produce another substance or product and that has the characteristics of an equivalent virgin
product or material;
"Disposal" means the burial, deposit, discharge, abandoning, dumping, placing or release of any
waste into, or onto, any land;
"Domestic waste" means waste, excluding hazardous waste, that emanates from premises that are
used wholly or mainly for residential, educational, health care, sport or recreation purposes;

6
"General waste" means waste that does not pose an immediate hazard or threat to health or to the
environment, and includes—
domestic waste;
building and demolition waste;
business waste: and
inert waste;
"Hazardous waste" means any waste that contains organic or inorganic elements or compounds
that may, owing to the inherent physical, chemical or toxicological characteristics of that waste,
have a detrimental impact on health and the environment;
"Incineration" means any method, technique or process to convert waste to Hue gases and
residues by means of oxidation;
"recovery" means the controlled extraction of a material or the retrieval of energy from waste to
produce a product;
"recycle" means a process where waste is reclaimed for further use, which process involves the
separation of waste from a waste stream for further use and the processing of that separated
material as a product or raw material;
"re-use" means to utilise articles from the waste stream again for a similar or different purpose
without changing the form or properties of the articles;
"storage" means the accumulation of waste in a manner that does not constitute treatment or
disposal of that waste;
"treatment" means any method, technique or process that is designed to change the physical,
biological or chemical character or composition of a waste; or remove, separate, concentrate or
recover a hazardous or toxic component of a waste; or destroy or reduce the toxicity of a waste, in
order to minimise the impact of the waste on the environment prior to further use or disposal:
"waste" means any substance, whether or not that substance can be reduced, re-used, recycled and
recovered- that is surplus, unwanted, rejected, discarded, abandoned or disposed of; which the
generator has no further use of for the purposes of production; that must be treated or disposed of;
or that is identified as a waste by the Minister by notice in the Gazette, and includes waste
generated by the mining, medical or other sector, but—a by-product is not considered waste; and
any portion of waste, once re-used, recycled and recovered, ceases to be waste;

7
"waste management activity" means any activity listed in Schedule 1 or published by notice in the
Gazette under section 19, and includes—
the importation and exportation of waste;
the generation of waste, including the undertaking of any activity or process
that is likely to result in the generation of waste:
the accumulation and storage of waste;
the collection and handling of waste;
the reduction, re-use, recycling and recovery of waste;
the trading in waste;
the transportation of waste;
the transfer of waste;
the treatment of waste; and
the disposal of waste;
"Waste management services" means waste collection, treatment, recycling and disposal services;
"Treatment" means any method, technique or process that is designed to change the physical,
biological or chemical character or composition of a waste; or remove, separate, concentrate or
recover a hazardous or toxic component of a waste; or destroy or reduce the toxicity of a waste”
(National Environmental Management: Waste Act (NEMWA), 2008, Act No. 59 of 2008).
These definitions of waste management-related terms can be good basis for making
comparisons with similar terms in other countries such as the European Union and
Tanzania within the same discipline of Waste Management.
3.3 Definitions of Solid Waste Management- Related Terms in the Policy and
Legislation Framework of Tanzania
Taking the Environmental Management Act, 2004 as a sample from the existing
Tanzanian waste management policy and legislation framework, one can be able to
explore the meaning of some of the waste management-related terms contained and
defined in the Act. The following are a few terms and their definitions as found and
defined in the Environmental Management Act, 2004.

8
‘‘Hazardous waste'' means any solid, liquid, gaseous or sludge waste which by reason of its
chemical reactivity, environmental or human hazardousness, its infectiousness, toxic explosiveness
and corrosiveness is harmful to human health, life or environment;
''Industrial waste'' means waste emanating from processing industries or non-processing industries
that is the source of energy, water, treatment plants or communication and includes any other solid
waste referred to under Part. IX;
''solid waste disposal'' means the final stage in solid waste management system;
''solid waste'' means non-liquid materials arising from domestic, street, commercial, industrial and
agricultural activities; and includes refuse or garbage, non-liquid materials arising from
construction and demolition activities, garden trimmings and mining operations, dead animals and
abandoned cars scraps;
''solid waste management'' means an essential service that is provided to protect the environment
and public health, promote hygiene, recover materials, avoid waste, reduce waste quantities,
decrease emission and residuals and prevent the spread of diseases.
‘‘Waste'' means any matter whether liquid, solid, gaseous or radioactive, which is discharged,
emitted or deposited in the environment in such volume, composition or manner likely to cause an
alteration of the environment, and includes such waste as may be prescribed under this Act;”
(Environmental Management Act 2004, Act No. 20, 2004, Tanzania).
Definitions of “waste” and “waste management” compared among the European
Union, South African and Tanzanian legislations:
The comparison of definitions of terms in the environmental management policy and
legislation framework of the European Union, South Africa and Tanzania can be quite
interesting to see the possible similarities and differences too. Take a small example of the
definitions of “waste” and “waste management” among the three countries;
The Waste Framework Directive of the European Union, Directive 2008/98/EC, has a very
narrow concept of waste: “Waste: any substance or object which the holder discards or
intends or is required to discard.” However the following are excluded from the meaning
of waste as used in this piece of legislation:-
9
- gaseous effluents;
- radioactive elements;
- decommissioned explosives;
- faecal matter;
- waste waters;
- animal by-products;
- carcasses of animals that have died other than by being slaughtered
- elements resulting from mineral resources” (Directive 2008/98/EC).
On the other hand the term “waste management” is defined in the European Union
Directive 2008/98/EC as; “the collection, transport, recovery and disposal of waste,
including the supervision of such operations and the after-care of disposal sites, and
including actions taken as a dealer or broker.”
According to the South African National Environmental Management: Waste Act
(NEMWA) 2008, Act No. 59 of 2008, waste has been defined as follows:-
"waste" means any substance, whether or not that substance can be reduced, re-used, recycled and
recovered—that is surplus, unwanted, rejected, discarded, abandoned or disposed of; which the
generator has no further use of for the purposes of production; that must be treated or disposed of;
or that is identified as a waste by the Minister by notice in the Gazette (Official Government
Newspaper), and includes waste generated by the mining, medical or other sector, but—a by-
product is not considered waste; and any portion of waste, once re-used, recycled and recovered,
ceases to be waste.”
In the South African National Environmental Management: Waste Act, 2008, “Waste
management activity” includes-
“the importation and exportation of waste;
the generation of waste, including the undertaking of any activity or process
that is likely to result in the generation of waste:
the accumulation and storage of waste;
the collection and handling of waste;
the reduction, re-use, recycling and recovery of waste;
the trading in waste;
the transportation of waste;

10
the transfer of waste;
the treatment of waste; and
the disposal of waste;” (National Environmental Management: Waste Act
(NEMWA) 2008, Act No. 59 of 2008).
On the other hand the Environmental Management Act 2004, Act No. 20, 2004, Tanzania
defines waste and solid waste management as follows:-
''Waste'' means any matter whether liquid, solid, gaseous or radioactive, which is discharged,
emitted or deposited in the environment in such volume, composition or manner likely to cause an
alteration of the environment, and includes such waste as may be prescribed under this Act;”
''Solid waste management'' means an essential service that is provided to protect the environment
and public health, promote hygiene, recover materials, avoid waste, reduce waste quantities,
decrease emission and residuals and prevent the spread of diseases.”
From the above cited waste management-related legislations of the European Union,
South Africa and Tanzania, similar terms relatively mean differently among the respective
legislations.
4. The Challenges of Solid Waste Management
Most countries in the world, both developing and developed, acknowledge the significance
of solid waste management though they may differ in the kinds of concerns they
emphasize. In many African countries including Tanzania there is concern for solid waste
management due to the harmful effects of improper and inefficient waste management
system on people’s health, animals, biodiversity and the environment. The ineffective
solid waste management system has serious effects on sanitation, health and vector-borne
diseases such as malaria and worms, as well as diarrhea, tuberculosis and cholera (Mbuya,
2009; Palfreman, 2011; Oberlin, 2012; Jones & Mkoma, 2013).
In the European Union (EU) the major concern about solid waste management is the
extremely large amount of household waste which is generated and discarded by the 500
million people every year. The solid waste amounts to about half a tone per household a

11
year, 360 million tons of waste from manufacturing and 900 million tons of waste from
construction and 95 million tons of waste from water and energy supply; altogether the EU
generated 3 million tons of waste every year (European Union, 2010). These figures have
definitely increased by the year 2014.
The EU’s concern with the amount of waste generated annually is threefold; the pollution
which it causes to the environment and the effect to climate change due to the greenhouse
gas emissions and the waste in terms of material. Besides this there is a lot of waste
material which is hazardous and harmful to the population and therefore needs to be
properly managed (European Union, 2010).
Also the EU has focused its attention on marine litter in the form of minute plastic
materials as a special type of pollution which has affected central Pacific, the North East
Atlantic and Greece (European Environment Agency, 2010). The litter is found both
floating in the water and at the bottom of the sea floor. The European Environment
Agency (SOER, 2010) has reported (according to Van Franeker et al., 2005, Gregory,
2009) that minute plastic particles have been found to cause health problems to sea
animals and birds such as reproductive and breathing problems (European Environment
Agency, SOER 2010).
Waste management in the European Union (EU) is not only a big challenge but also it is
necessary in order to minimize pollution; minimise losses of valuable material which
Europe as a big importer of raw materials cannot continue to bear in the form of material
waste losses (European Union, 2010).
5. Solid Waste Management Policy, Legislation and Strategy
Frameworks of the EU (Finland), South Africa and Tanzania
The waste problem is universal and attracts the attention of every government to manage
its waste for various reasons; one being to protect the health and welfare of its citizens.
The European Union, African countries and other countries in the world have taken
different measures to deal with the waste problem including municipal solid waste.
12
Indeed, the focus of this study was to investigate the factors which influence the state of
solid waste management in the coastal belt of the City of Dar-es-Salaam, Tanzania.
Also the study took an overview comparative survey of the solid waste management
policy, legislation and strategy frameworks of the European Union (EU), Republic of
South Africa (RSA) and the United Republic of Tanzania (URT) Tanzania. The choice of
the three regions (units of countries) for comparing their waste management policies,
legislations and practices was to get a variety of learning experiences from different
countries with different cultures and levels of socio-economic development. It was
basically assumed that the three countries (Tanzania inclusive) undertook solid waste
management somewhat differently in terms of legislation and practices. Therefore, the
comparative study was expected to generate learning experiences which the researcher
could find useful particularly in proposing strategies for improving the solid waste
management in the City of Dar -es- Salaam and its Coastal Belt.
In the Tanzanian context the study was undertaken with the objective of comparing the
solid waste management legislation and practices within the three Dar-es-Salaam City
Municipalities of Kinondoni, Ilala and Temeke. The purpose was to identify factors which
influence the efficiency of solid waste management in the respective municipalities. Again
the learning experiences from this comparative experience could provide useful findings
for making suggestions for improving the solid waste management situation in the Dar-es-
Salaam City as a whole and in its constituent three municipalities.
5.1 Solid Waste Management in the European Union
Solid waste management in the European Union is dealt with through various legislation
and policies which are directed at various challenges.
The EU has been taking waste management seriously through developing policies and
strategies which are geared toward the reduction of negative environmental and health
impacts of the big amounts of waste generated and aims at making the EU resource
efficient (European Union, 2011). The EU waste management policy has developed over
the past 30 years or by means of action plans and legislation which aim at reducing the

13
negative impacts of waste on the environment and human health and instead create a
resource – efficient and energy economy (European Union, 2010).
5.2 Waste Management Hierarchy (European Union Act on waste management)
The European Union Waste framework Directive –2008/98/EC is based on the current and
modern approach to waste management which focuses at waste prevention rather than
waste disposal and also emphasizes on waste recycling. It aims at the prevention of the
harmful effects of waste generation. This Directive embraces a hierarchy of five steps of
waste management. These are:
- Prevention- as the most preferred option;
- Preparing for re-use; then
- Recycling; followed by
- Other forms of recovery; notably energy recovery; finally
- Disposal. (Figure 2).
Prevention
Re-use
Recycling
Recovery
Disposal
Figure 2: The Waste Management Hierarchy
The Commission Communication in December 2005 put forward a Thematic Strategy on
the prevention and recycling of waste COM (2005) 666. The strategy puts up guidelines
for EU action and describes how waste management can be enforced. The thematic
strategy aims at reducing the negative impacts of waste on the environment (European
Commission- COM (2005) 666.

14
The relevant Act for land fill waste is the Council Directive 1999/31/EC enacted on 26
April, 1999. This directive lays down strict requirements for landfills for preventing and
reducing the negative effects on the environment especially on surface water ground
water, soil, air and human health. According to the Act the landfills are divided into:-
- Landfills for hazardous waste.
- Landfills for non-hazardous waste.
- Landfills for inert waste. (Council Directive 1999/31/EC on landfill of waste).
Council Directive 2000/76/EC of the European Parliament and of the Council enacted on
4th
December, 2000 lays down measures to prevent or reduce air, water and soil pollution
caused by the incineration of waste and reducing risk on the health of human beings. The
directive imposes strict operating conditions and technical requirement waste incineration
plants (Directive 2000/76/EC On the incineration of waste.
5.3 Waste Management Practices In the European Union (Case study of the Helsinki
Region in Finland)
Waste management practices in Finland have been selected for discussion among waste
management practices of other European Union member countries. Finland has a well
organized modern system of managing different kinds of waste including solid waste;
starting from sorting, collection and treatment. All waste is sorted at the generation point
and are recycled according to the type and nature of the particular waste (Figure 3). In the
capital area it is compulsory for all bio waste to be collected from all residential properties
which contain more than 10 housing units and from those properties which generate more
than 50 kg of bio waste per week. Collection of bio waste from smaller properties is not
compulsory. However, the practice in Finland is that bio waste is not taken at collection
points. The treatment of different types of waste is discussed here under. (Helsingin
seudun ympäristöpalvelut – HSY, 2014).

15
Figure 3: Sorting waste at the generation point in people’s premises in Ekenäs, Finland. Photo:
John Maziku 4.6.2014
Bio Waste
There are different types of bio waste such as: (1) Professional kitchen bio waste and (2)
packing bio waste. Professional kitchen bio waste includes all food remains such as
spoiled food, tea leaves with filter bags, small bones, egg cartons, peels etc. Packing bio
waste which are good include the bio waste used for packing that is capable of
decomposting such as newspapers, paper bags, bio waste bags bought from stores, card
board packing excluding milk cartons and other plastic coated cartons (Helsingin seudun
ympäristöpalvelut – HSY, 2014).
Garden Waste and Brushwood
In Finland under garden waste and brushwood classification are included grass, leaves,
fallen apples, chipped brush wood with a diameter of less than 20 cm. In sorting apples
should be separated from garden waste and placed in different containers. During autumn
in Finland apples are received by Sortti stations at the same fee as garden waste. In the
Helsinki region bio waste and garden waste are treated by decomposting at the Ämmässuo
Waste Treatment Centre in Espoo. Also brushwood of specific standard measurement is
collected separately and is applied as raw material for decomposing and for conditioning
soil (Helsingin seudun ympäristöpalvelut – HSY, 2014).
16
Clothes and Textiles
In Finland there are specific regional collection points for clothes and textiles, for
example, Emmaus, Helsinki Metropolitan Area Re- Use Centre and FIDA Second hand
Charity Shop. These shops receive exclusively clothes which are in good condition. Most
of these clothes are sent to Africa, others are sold by wholesale internally and the rest
particularly those in poor condition are used as rag in industry (Helsingin seudun
ympäristöpalvelut – HSY, 2014).
Energy Waste and Mixed Waste
Energy waste can only be recovered as material for energy production and not for
recycling. Plastics can be used as energy waste but it is not all plastic which serves as
energy waste. Energy plastics should not contain aluminium or PVC. For example, plastic
products are classified and differentiated by codes 01, 02, 03, 04, 05, 06 and 07 to indicate
the kinds of plastics and plastic packaging used. The specific codes involve all types of
plastic and plastic packaging used for food stuffs, plastic sacks, plastic bags, disposable
cardboard and plastic plates and cups, photographs and negatives, CD and DVD discs and
cases. All products containing PVC (those marked with code 03) and aluminium such as
foil-lined potato chips and juice cartons, coffee bags and containers, ink cartridges and
VHS and C cassettes cannot be used as energy waste (Helsingin seudun ympäristöpalvelut
– HSY, 2014).
In Finland energy waste is not provided at collection points. Housing companies may
order energy waste from HSY Waste Management customer service. Companies like
Sortti Stations and the Munkinmäki Waste Stations receive energy waste for a fee.
In the occasion where sorting of waste is not done, the mixed waste is usually taken to
landfill. In the year 2014 the mixed waste power plant in Vaasa is expected to generate
electricity and energy for human consumption .However, several other power plants have
been built and some are still under constructions to decrease the use of landfills and to
increase energy recovery from waste (Helsingin seudun ympäristöpalvelut – HSY, 2014).
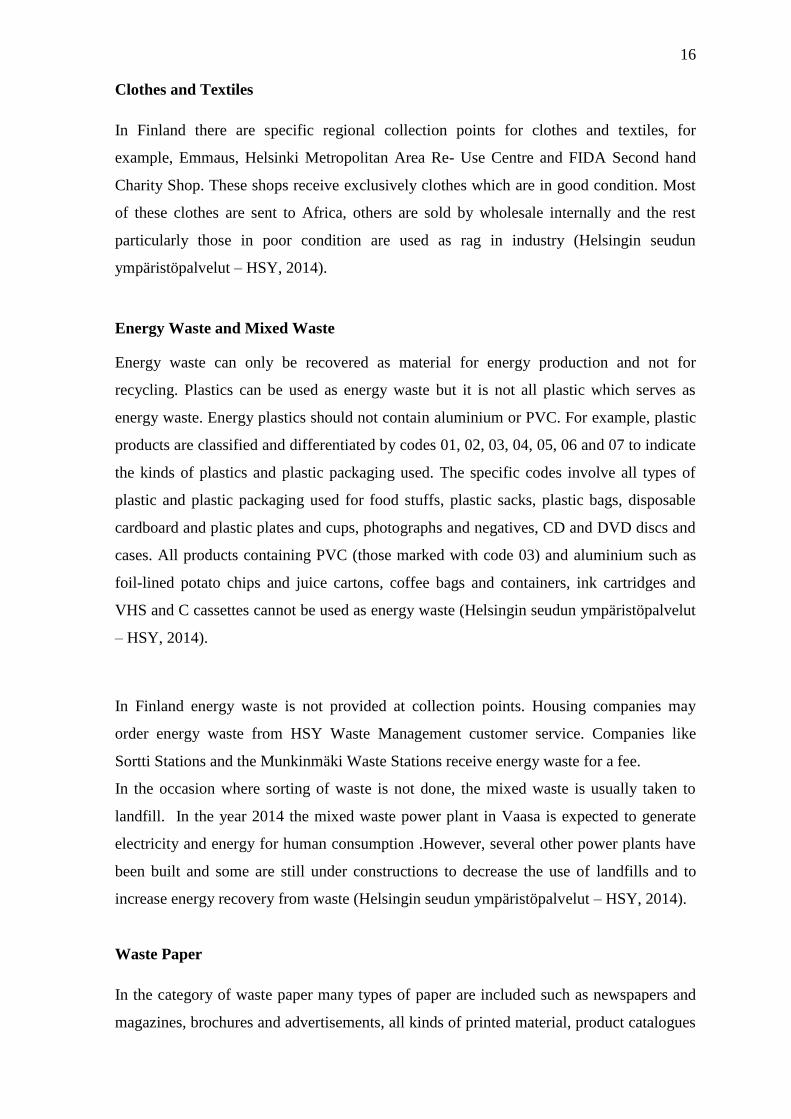
Waste Paper
In the category of waste paper many types of paper are included such as newspapers and
magazines, brochures and advertisements, all kinds of printed material, product catalogues
17
and phone books, paper bags including any other type of paper which is delivered at home
or office that is recyclable (Figure 4). According to the waste management regulations of
Finland recyclable paper should not be put in mixed waste containers. However, the
collection and reuse of paper are activities that come under producer liability (Helsingin
seudun ympäristöpalvelut - HSY, 2014).
Figure 4: Waste paper container in Ekenäs, Finland. Photo: John Maziku 4.6.2014
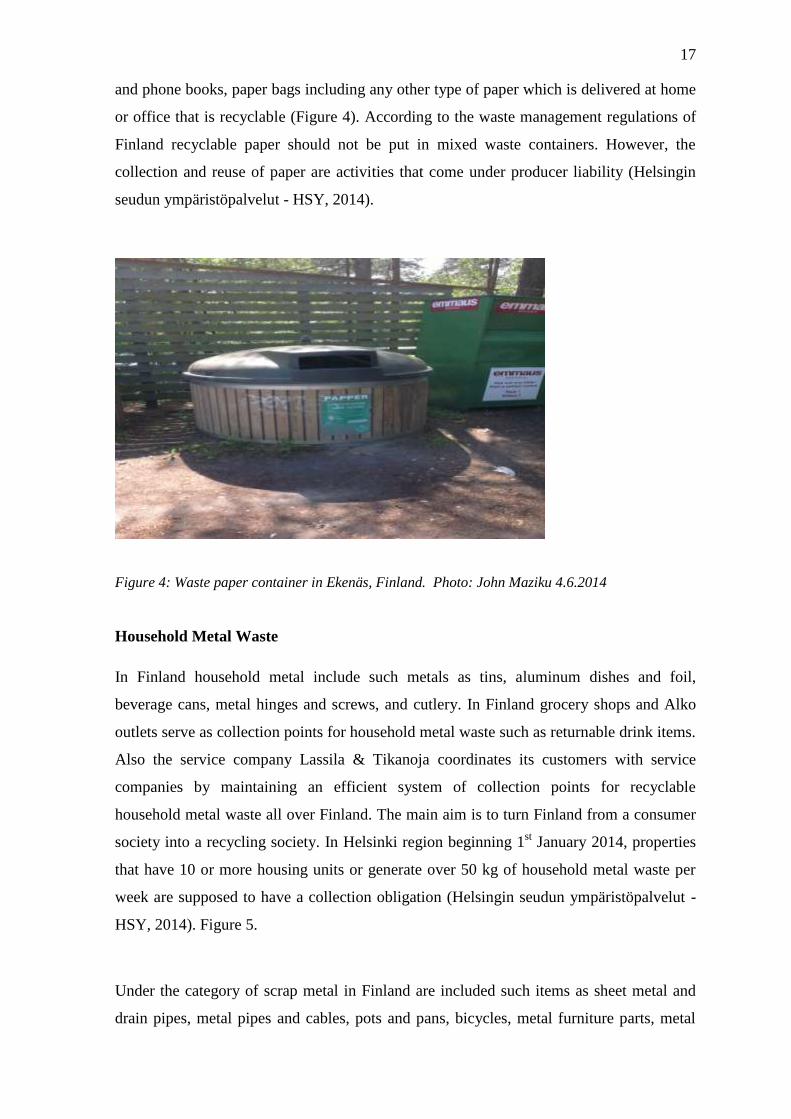
Household Metal Waste
In Finland household metal include such metals as tins, aluminum dishes and foil,
beverage cans, metal hinges and screws, and cutlery. In Finland grocery shops and Alko
outlets serve as collection points for household metal waste such as returnable drink items.
Also the service company Lassila & Tikanoja coordinates its customers with service
companies by maintaining an efficient system of collection points for recyclable
household metal waste all over Finland. The main aim is to turn Finland from a consumer
society into a recycling society. In Helsinki region beginning 1st January 2014, properties
that have 10 or more housing units or generate over 50 kg of household metal waste per
week are supposed to have a collection obligation (Helsingin seudun ympäristöpalvelut -
HSY, 2014). Figure 5.
Under the category of scrap metal in Finland are included such items as sheet metal and
drain pipes, metal pipes and cables, pots and pans, bicycles, metal furniture parts, metal

18
machines and devices, and wood burning stoves. In the Helsinki region Sortti stations and
Munkinmäki Waste Station are used as collection points for scrap metals. During spring
season in Helsinki, Helsingin seudun ympäristöpalvelut`s vehicles go around the city
collecting scrap metal that are used as raw materials for manufacturing new metal products
(Helsingin seudun ympäristöpalvelut - HSY, 2014).
Figure 5: Household metal waste container at a collection point in Ekenäs, Finland. Photo: John
Maziku 4.6.2014
Glass
Different types of glass for example coloured glass and clear glass are sorted and put in
separate containers (Figure 6). The type of recyclable glass may include glass bottles and
jars and these are used for making new glass containers, glass wool and glass foam glass
(Helsingin seudun ympäristöpalvelut - HSY, 2014).
In the Helsinki region there are three kinds of collection points for returnable bottles;
grocery shops, Alko outlets and voluntary collection points in streets (Helsingin seudun
ympäristöpalvelut - HSY, 2014).

19
Figure 6: Glass container at a waste collection point in Ekenäs, Finland. Photo: John Maziku
4.6.2014
Electrical Equipment
All types of electronic waste such as large and small home appliances, for example
washing machines, refrigerators, freezers, electric stoves, computers, laptops, printers,
video cameras and the like are collected for re-use. The activity undertaken for electronic
waste that are taken for re-use is done separately to ensure that all the components of the
materials of the devices such as harmful substances like mercury and lead are recovered
for re-use. The task of collection and re-use are under producer liability (Helsingin seudun
ympäristöpalvelut - HSY, 2014).
All kinds of hazardous waste such as unused medicines, fluorescent lights, used car
batteries, sulphuric acids throughout Finland are treated by Ekokem. Ekokem is a
company which is owned by the state and municipalities and treats 100,000 tons of
hazardous waste per year. Ekokem is the only company which treats hazardous waste in
Finland (Helsingin seudun ympäristöpalvelut- HSY, 2014; Berninger et al, 2010).
Municipal Waste Incineration Practice
In Finland about one third of all the municipal waste generated is incinerated. Currently,
Finland has nine waste power plants in use (Jätelaitosyhdistys, 2014). Figure 7.

20
Figure 7: Waste energy projects in Finland
Source: Jätelaitosyhdistys, 2014.
The growth of the total capacity of the waste incineration plants is shown as individual
projects. The red line indicates the capacity for municipal waste. The rest of the capacity is
for the construction and production waste (Jätelaitosyhdistys, 2014).
6. Solid Waste Management in South Africa
In the Republic of South Africa (RSA) there have been many challenges regarding waste
management in general and solid waste management in particular. In the effort to deal
with the challenges of waste management the South African government has identified the
challenges themselves and has been enacting various waste management legislations and
undertaking a number of waste management strategies to meet the identified waste
management challenges (National Waste Management Strategy, No. 344 of 2012).
6.1 Challenges facing Waste Management in South Africa
The challenges facing waste management in South Africa are well stated in the National
Waste Management Strategy, No. 344 of 2012. The challenges are many; these are:
South-West Finland
Eastern Finland Waste
energplant The Tammerkoski Power
Vantaa WtE plant
Ekokem WtE plant 2
West energy waste power plant
Laanila ekovoimalaitos
Ekokem WtE plant
Oriketo WtE plant
YKJ (WtE plant
Korkeakoski WtE plant
Kor
21
population and economic growth which give rise to increased generation of amounts of
waste, historical backlog of waste services in local areas which were formally
marginalized and increased complexity of waste streams arising from urbanisation an
industrialization. Other challenges of waste management are the lack of policy and
regulatory environment that promotes the waste management hierarchy and its economic
potential, the absence of recycling infrastructure, highly underpriced waste management
thus making waste disposal the most preferred alternative. Moreover, posing as another
challenge is the small number and very expensive waste treatment options hence making
land fill to be the most affordable practice and in many cases these landfills are not
compliant (National Waste Management Strategy, No. 344 of 2012).
6.2 Waste Management Legislation Framework in South Africa
In order to meet the challenges facing waste management in the Republic of South Africa
several pieces of legislation have been enacted over a period of time and form the basis for
managing waste. Among such legislation are the following:-
(1) Environmental Management Policy 1998.
(2) The National Environmental Management Act (NEMA) 1998, Act No. 107, 1998.
(3) The National Environmental Management: Waste Act (NEMWA) 2008, Act No. 59
of 2008.
(4) National Waste Management Strategy No. 344, 2012.
6.3 Environmental Management Policy for South Africa, 1998
In May 1998 the Ministry of Environmental Affairs and Tourism issued the White Paper
on Environmental Management Policy for South Africa. The purpose of the policy was to
serve as an overarching (umbrella) framework policy that governs and guides all
government institutions in formulating specific subsidiary and sectoral policies and
strategies in all matters dealing with day to day management of the environment. The
policy establishes an integrated and holistic environmental management system which
aims at, resource efficient, people-centred, participatory, and environmentally sustainable,
social economic development. The White Paper on Environmental Management Policy
1998, South Africa sets out principles, and strategic goals which are necessary to ensure
22
the environmental policy is realized (Environmental Management Policy 1998, South
Africa).
The South African environmental management policy sets out a number of fundamental
principles which the government and all its institutions are required to use in making
decisions, legislation, regulations and enforcement on matters concerning environmental
management. Examples of the policy principles are the accountability principle to the
government, function allocation principle to government institutions, cradle to grave
principle of environmental management; polluter pays principle, waste avoidance and
minimization principle, to mention only a few (Environmental Management Policy 1998,
South Africa).
.
The national Department of Environmental Affairs and Tourism as the government central
coordinating organ is charged by the national environmental policy with the responsibility
for developing the National Environmental Strategy and Action Plan (Environmental
Management Policy 1998, South Africa).
The Environmental Management Policy 1998, South Africa also lays down the
environmental management structural framework for the implementation of the
environmental policy, strategies and regulations as it is spelled out by the South African
Constitution. There are four constitutional levels: 1) the national legislative powers- power
to amend the constitution and make laws concerning the environmental management. 2)
National executive powers- have the power to intervene in provinces where it thinks there
is need. 3) Provincial Legislative and executive powers and 4) Local Government. All the
four levels interact in environmental management, thus including waste management
(Environmental Management Policy 1998, South Africa).
Principles for Environmental Management
The environmental management policy 1998, South Africa sets a number of principles to
use in making decisions, legislation, regulation and enforcement such as government
accountability, allocation of functions necessary for achieving the policy objectives,
capacity building and education to enable the people participate effectively both in
sustainable development and resource use (Environmental Management Policy 1998,
South Africa). Other principles are the principle of custodianship the government which
23
has the responsibility to protect the environment in order that the present and future
generation benefit. This principle obliges the government, besides other things, to address
itself to pollution control and waste management (Environmental Management Policy,
1998, South Africa).
Another principle included in the Environmental Management Policy 1998, South Africa
which is relevant to this research is the principle of waste avoidance and minimization.
This principle requires waste management to minimize and avoid the creation of waste at
source particularly toxic and hazardous waste encourages waste recycling, separation at
source and also safe disposal of unavoidable waste (Environmental Management Policy,
1998, South Africa).
Strategic Goals and Objectives of the Environmental Management Policy
In order for the government to achieve its vision for environmental management the policy
requires the policy goals and objective be translated into the National Environmental
Strategy and Action Plans. The environmental management policy identifies 7 strategic
goals for achieving environmental sustainability and integrated environmental
management; these are:-
1) Effective Institutional Framework and Legislation
2) Sustainable resource use and impact management
3) Holistic and integrated planning and management
4) Participation and partnership in Environmental Governance
5) Empowerment and environmental education
6) Information management for sustainable development
7) International Cooperation (Environmental Management Policy, 1998, South
Africa).
Even though all the strategic goals are relevant here in our stud, goal 2; sustainable
resource use and impact management is of immediate relevance to our study particularly
to the following supporting objectives:-
24
a) Sustainable resource use both renewable and non-renewable,
b) Conservation of biodiversity
c) Coastal zone management
d) Environmental resource economies
e) Integrated pollution and waste management (Environmental Management Policy,
1998, South Africa).
Numbers (d) and (e) are of special significance in this study. Under environmental
resource economics among the elements included there are two which are immediate
relevance, namely: reduce the waste stream to a level which is safe to the environment and
human health, and promote the application of more efficient technology that lead to
reduction in the use of resources, waste reduction and pollution (Environmental
Management Policy, 1998, South Africa).
In the area of integrated pollution and waste management the goals are very relevant in
this study; such as prevention, reduction and management of pollution of the environment,
and setting targets to minimize waste generation at source. Also other waste management
goals which are relevant to this study are the promotion of a hierarchy of waste
management practices such as reduction of waste at source, re-use and recycling with safe
disposal as the last resort as they directly related to the research subject – improving solid
waste management (Environmental Management Policy 1998, South Africa). One of the
important areas in the Environmental Management Policy, 1998, South Africa is its
intention to promote the waste management hierarchy (Environmental Management Policy
1998, South Africa).
6.4 National Environmental Management Act (NEMA) 1998, Act No. 107, 1998
The National Environmental Management Act (NEMA) 1998, Act No. 107, 1998 is a
fundamental environmental legislation upon which all other subsidiary environmental
legislation in the Republic of South Africa are based (City of Johannesburg Integrated
2011, 2011). The National Environmental Management Act, 1998 is, therefore, a basic
and general environmental legislation which aims at promoting cooperative environmental

25
governance in South Africa, establishes broad decision making principles of
environmental management, sets up institutions for promoting cooperative governance and
coordinates all environmental functions by state organs (Environmental Management
Policy, 1998, South Africa). The National Environmental Management Act, 1998
essentially translates the objectives of the South African Constitution whereby it aims at
establishing a framework of good environmental management and integrating all the
development activities in order to obtain among other things prevention of pollution and
ecological degradation and promote environmental conservation (Environmental
Management Policy, 1998, South Africa).
The National Environment Management Act 1998, Act No, 107, 1998 Chapter I Section 4,
among other things, seeks for sustainable development in conserving the ecosystems and
biodiversity by observing the following:-
i) Minimise or avoid actions causing disturbance or loss of the ecosystem and
biodiversity.
ii) Avoid, minimize or remedy pollution and degradation of the environment;
iii) Avoid waste but where it cannot be completely avoided it should be minimized and
reused or recycled where possible or else it should be disposed in a responsible
way.
iv) Use and exploit non-renewable natural resources in a responsible and equitable
manner and they should not be used up completely (National Environment
Management Act 1998, Act No, 107, 1998).
These objectives or requirements are quite in line with the waste hierarchy requirements
which are well specified in European Union Directive Waste (Directive 2008/98/EC -
Waste Framework Directive).

26
6.5 The National Environmental Management: Waste Act (NEMWA) 2008, Act No.
59 of 2008
The National Environmental Management: Waste Act (NEMWA), No. 59 of 2008 or
simply the Waste Act, 2008 is a subsidiary act of the National Environment Management
Act (NEMA), No. 107, 1998; and its major role is to regulate all waste management
within the Republic of South Africa while also defining the different roles and
responsibilities of the different sectors of the government entrusted with its
implementation (City of Johannesburg Integrated Waste Management Plan 2011 (2011),
South Africa).
The objectives of the Waste Act, 2008 are quite many; among them being minimization of
consumption of natural resources, implementation of the waste management hierarchy and
obtaining ecologically sustainable development. Furthermore, the Waste Act, 2008 aims at
prevention of ecological degradation and pollution, promotion of effective waste delivery,
enhancement of people’s awareness regarding the impact of waste on their health and
wellbeing and the provision of compliance and enforcement and the provision of national
standards and norms for waste management (National Environmental Management: Waste
Act (NEMWA), No. 59 of 2008).
Section 6 (1) of the Waste Act, 2008 provides for the establishment of a national waste
management strategy as a means to achieve the objectives of the Act. The waste
management strategy could also include waste reduction targets, provide national norms
and standards, provincial norms and standards and waste service standards and also bind
all relevant persons and state organs responsible for its implementation (National
Environmental Management: Waste Act (NEMWA), No. 59 of 2008).
The Waste Act, 2008 also focused at the establishment of a national waste information
system for purposes of effective management of waste and for providing information to
different state organs, individuals and other organizations who may require. Moreover, the
Waste Act provided for compliance and enforcement requirements and conditions to
ensure its effectiveness (National Environmental Management: Waste Act (NEMWA),
No. 59 of 2008).
27
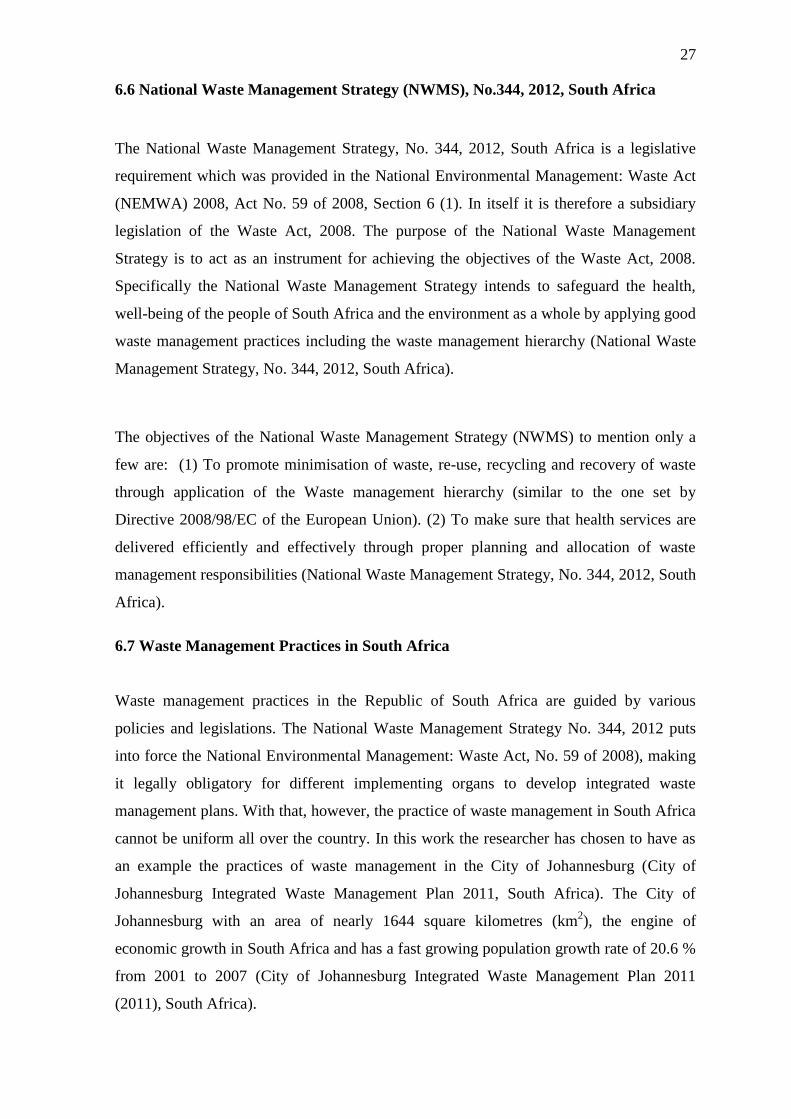
6.6 National Waste Management Strategy (NWMS), No.344, 2012, South Africa
The National Waste Management Strategy, No. 344, 2012, South Africa is a legislative
requirement which was provided in the National Environmental Management: Waste Act
(NEMWA) 2008, Act No. 59 of 2008, Section 6 (1). In itself it is therefore a subsidiary
legislation of the Waste Act, 2008. The purpose of the National Waste Management
Strategy is to act as an instrument for achieving the objectives of the Waste Act, 2008.
Specifically the National Waste Management Strategy intends to safeguard the health,
well-being of the people of South Africa and the environment as a whole by applying good
waste management practices including the waste management hierarchy (National Waste
Management Strategy, No. 344, 2012, South Africa).
The objectives of the National Waste Management Strategy (NWMS) to mention only a
few are: (1) To promote minimisation of waste, re-use, recycling and recovery of waste
through application of the Waste management hierarchy (similar to the one set by
Directive 2008/98/EC of the European Union). (2) To make sure that health services are
delivered efficiently and effectively through proper planning and allocation of waste
management responsibilities (National Waste Management Strategy, No. 344, 2012, South
Africa).
6.7 Waste Management Practices in South Africa
Waste management practices in the Republic of South Africa are guided by various
policies and legislations. The National Waste Management Strategy No. 344, 2012 puts
into force the National Environmental Management: Waste Act, No. 59 of 2008), making
it legally obligatory for different implementing organs to develop integrated waste
management plans. With that, however, the practice of waste management in South Africa
cannot be uniform all over the country. In this work the researcher has chosen to have as
an example the practices of waste management in the City of Johannesburg (City of
Johannesburg Integrated Waste Management Plan 2011, South Africa). The City of
Johannesburg with an area of nearly 1644 square kilometres (km2), the engine of
economic growth in South Africa and has a fast growing population growth rate of 20.6 %
from 2001 to 2007 (City of Johannesburg Integrated Waste Management Plan 2011
(2011), South Africa).
28
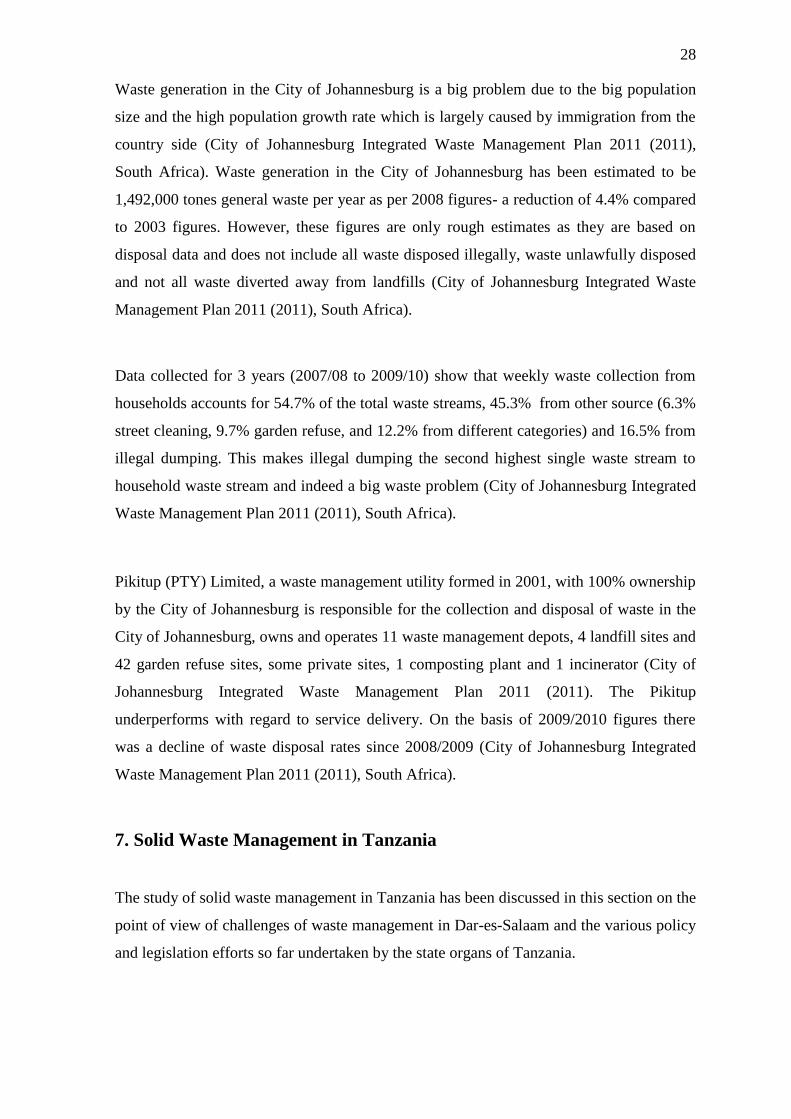
Waste generation in the City of Johannesburg is a big problem due to the big population
size and the high population growth rate which is largely caused by immigration from the
country side (City of Johannesburg Integrated Waste Management Plan 2011 (2011),
South Africa). Waste generation in the City of Johannesburg has been estimated to be
1,492,000 tones general waste per year as per 2008 figures- a reduction of 4.4% compared
to 2003 figures. However, these figures are only rough estimates as they are based on
disposal data and does not include all waste disposed illegally, waste unlawfully disposed
and not all waste diverted away from landfills (City of Johannesburg Integrated Waste
Management Plan 2011 (2011), South Africa).
Data collected for 3 years (2007/08 to 2009/10) show that weekly waste collection from
households accounts for 54.7% of the total waste streams, 45.3% from other source (6.3%
street cleaning, 9.7% garden refuse, and 12.2% from different categories) and 16.5% from
illegal dumping. This makes illegal dumping the second highest single waste stream to
household waste stream and indeed a big waste problem (City of Johannesburg Integrated
Waste Management Plan 2011 (2011), South Africa).
Pikitup (PTY) Limited, a waste management utility formed in 2001, with 100% ownership
by the City of Johannesburg is responsible for the collection and disposal of waste in the
City of Johannesburg, owns and operates 11 waste management depots, 4 landfill sites and
42 garden refuse sites, some private sites, 1 composting plant and 1 incinerator (City of
Johannesburg Integrated Waste Management Plan 2011 (2011). The Pikitup
underperforms with regard to service delivery. On the basis of 2009/2010 figures there
was a decline of waste disposal rates since 2008/2009 (City of Johannesburg Integrated
Waste Management Plan 2011 (2011), South Africa).
7. Solid Waste Management in Tanzania
The study of solid waste management in Tanzania has been discussed in this section on the
point of view of challenges of waste management in Dar-es-Salaam and the various policy
and legislation efforts so far undertaken by the state organs of Tanzania.

29
7.1 The Challenge of Waste Management in Dar-es-Salaam
Solid waste Management has been a big problem in municipal centers in Tanzania
including Dar-es-Salaam (State of the Environment Report -2008, Tanzania). The
challenge of solid waste management began to worsen in the mid 1980s’ when generally
social service delivery started to deteriorate (Jones and Mkoma, 2013). Several reasons
have been given for the continued deterioration of the waste management situation in the
Dar-es-Salaam City among them being the extreme rapid growth of the city population
resulting from up country immigration, the ever growing high population density and
unplanned human settlements (Mbuya, 2009; Jones & Mkoma, 2013;). Figure 8. The solid
waste does have negative effect not only on people but also to marine creatures as well
(Mbuya, 2009; Palfreman, 2011).
Figure 8: Pathway in a squatter area at Buguruni Kwamyamani (left) and Posta area (right) in
Ilala Municipality, Dar-es-Salaam. Photo: John Maziku November, 2013.
The seriousness of the solid waste management situation in Dar-es-Salaam has continued
to worsen in spite of the Government efforts to try to solve it through administrative
reforms. In 1994 the Government made reforms by liberalizing the function of waste
collection to private campaigns. The reforms initially resulted into positive effect in solid
waste collection. Due to these reforms it is estimated that solid waste collection increased
from less than 5% in 1992 to nearly 40% in 2000 and together with this about 50% of the
entire solid waste of about 2500 tones generated per day was being managed (Palfreman,
2011 as referred to from Dar-es-Salaam City Council).

30
The liberalization of the solid waste management went hand in hand with the subdivision
of Dar-es- Salaam administrative responsibilities for solid waste management into three
municipalities – Kinondoni, Temeke and Ilala Municipal Councils and the Dar-es-Salaam
City Council as the lead partner. The private sector in the form of private companies
Community Based Organization (CBOs), Non-Government Organization (NGO) and
Community groups were contracted/engaged in the solid waste management business
(Palfreman, 2011).
In spite of the initial positive effects of the liberalization efforts of the Government of
Tanzania, it has been reported that approximately 3100 tons of solid waste are generated
per day but out of this only about 39% of it is legally discharged (Palfreman, 2011). This
deteriorating situation is partly attributed to the unplanned high rate of population increase
in the city which stands at 5.6% in Dar-es-Salaam City (2012 Tanzania Population and
Housing Census, 2012, National Bureau of Statistics, Tanzania). There seems to be a
correlation between population growth and solid waste disposal in Dar-es-Salaam. As the
population in Dar-es- Salaam increases also waste generation increases and the problem of
waste collection also becomes more complex (Mbuya, 2009; Palfreman, 2011; Jones &
Mkoma, 2013).
However, in the meantime the Government of Tanzania has been taking a number of
initiatives in terms of formulation of a number of policies and legislation at the central and
local levels that are intended to manage the environment in general and solid waste in
particular (National Environmental Action Plan (NEAP) 2013-2018 (2013).
7.2 Environmental Policies in Tanzania
There are a number of environmental policies which govern solid waste management in
Tanzania and in Dar es Salaam City in particular and the most relevant among them
include the following:-
The National Environmental Policy 1997, Tanzania
The National Health Policy 1990, Tanzania.

31
The Sustainable Industrial Development Policy 1996, Tanzania.
7.3 National Environmental Policy 1997, Tanzania
The National Environmental Policy (NEP), 1997, Tanzania was established in 1997 under
the Vice President’s Office. The National Environmental Policy gives a broad definition
of the term “environment” such that it includes “air, land and water; plant and animal life
including human life. The social, economic recreational, cultural and aesthetic conditions
and factors that influence the lives of human beings and their communities; buildings,
structures, machines or other devices made by man; any solids, liquids, gases, odour, heat,
sound, vibration or radiation resulting directly or indirectly from the activities of man; and
any combination of the foregoing and the inter-relationships between two or more of
them” (National Environmental Policy, 1997, Tanzania). This definition of the
environment includes “solids” as being one among many of the elements of the
environment. In this general way solid waste are also included elements of the
environment (National Environmental Policy (NEP), 1997, Tanzania).
The National Environmental Policy (NEP), 1997, Tanzania identifies and addresses six (6)
major environmental problems which need to be urgently addressed; land degradation;
lack of accessible, good quality water in urban and rural areas; pollution of the
environment; loss of wildlife habitats and biodiversity; deterioration of aquatic systems;
and deforestation (National Environmental Policy -NEP, 1997, Tanzania).
Among the issues which the National Environmental Policy (NEP), 1997, Tanzania
elaborates, among others, is solid waste pollution in towns as it affects the health of the
people. The NEP also points out that pollution and poor management has threatened the
productivity of lake, river; coastal and marine waters (National Environmental Policy -
NEP, 1997). As regards municipal waste, approximately 10,000 tons of municipal solid
wastes are daily being generated all over the country (National Environment Action Plan –
NEAP, 2013-2018, 2013, Tanzania).

32
In Dar es Salaam, for instance, the 4 major rivers; Mpiji River, Msimbazi River, Kizinga
River and Mzinga River discharge their waters into the Indian Ocean carrying loads of
domestic solid waste that are usually dumped by city residents in the poor settlement areas
(Figure 9). The waste pollutes beaches and likely harm marine life (Lukambuzi, 2006 –
unpublished).
Figure 9: Msimbazi River bank with waste dumped on its slopes (Left) and mixed waste dumped
into Msimbazi River (Right). Photo: John Maziku November 2013.
The overall objective of the National Environmental Policy (NEP), 1997, Tanzania is to
ensure there is security, sustainable and equitable use of resources in order to meet the
basic needs of the present and future generations while avoiding environmental
degradation, health and safety risks. The National Environmental Policy (NEP), 1997 has
a number of specific objectives amongst being the conservation of biological diversity of
the ecosystem; raising people’s awareness of the importance of environment and its
linkage with development; to promote community participation in matters regarding the
environment; and promote international cooperation in matters concerning environment
(National Environmental Policy- NEP, 1997, Tanzania).
In this regard the objectives of National Environmental Policy (NEP), 1997, Tanzania
address every general issue; they do not directly point to specific Municipal Solid Waste
issues. However, it is important to note that the National Environment Policy is sectoral
cross-cutting in nature; it addresses all the sectors of the social economy which in turn are
obliged to include and implement it in their specific policies and plans (National
Environmental Policy - NEP, 1997, Tanzania).

33
7.4 National Health Policy 2007, Tanzania
The National Health Policy 2007, Tanzania, with regard to environmental health, aims at
protecting community health through enhancing sustainable environmental health and
thereby intends to achieve the following:-
a) Make sure that the community abides to health standards;
b) Improve waste management system together with the disposal of hospital wastes;
c) Undertake on-going health education providers on the significance of
environmental health in their places of work;
d) Review and make laws and procedures for the conservation and protection of the
environment (National Environment Action Plan, 2013-2018, 2013, Tanzania).
7. 5 Sustainable Industrial Development Policy, 1996, Tanzania
The Sustainable Industrial Development Policy, 1996 aims at promoting industrial
development which is environmentally friendly and ecologically sustainable while at the
same time aims at establishing an incentive system which encourages the conservation of
the environment, promotes the application of the integration of preventative environmental
strategy to industrial processes, products and services (National Environment Action Plan
(2013-2018) 2013, Tanzania).
8. Legislation Related to Municipal Solid Waste Management in
Tanzania
There are two legislations that form the backbone of the legal and institutional framework
for sustainable management of the environment in general and for municipal solid waste
management; these are:-
(a) The Environmental Management Act 2004, Act No. 20 of 2004, Tanzania and
(b) Local Government (Urban Authorities) Act No. 8 of 1982, Tanzania.

34
8.1 Environmental Management Act 2004, Act No. 20 of 2004, Tanzania
The overall objective of the Environmental Management Act 2004, Act No. 20 of 2004,
Tanzania, is to provide for and promote the enhancement, protection, conservation and
management of the environment. The Environmental Management Act 2004, Act No. 20
of 2004, Tanzania, among other things, includes the following provisions which are
directly relevant to the management of the environment:
(i) The legal framework for the overall management of the environment giving power
and responsibilities for various organs and enforcement mandate.
(ii) Establishes the administrative and institutional framework for the management of
the environment (Part II Sections 11 – 41).
Part XI of the Environmental Management Act 2004, Act No. 20 of 2004, Tanzania,
dwells on waste management. Part (a) deals with solid waste and places the responsibility
for solid waste management to local government authorities. The role of the Local
Government Authorities is to ensure minimization of the solid waste in their areas of
jurisdiction. The Environmental Management Act 2004, Act No. 20 of 2004, Tanzania
also gives mandate to the Local Government Authorities to involve the private sector and
Non-governmental Organizations (NGOs) in solid waste management activities
(Environmental Management Act 2004, No. 20 of 2004, Tanzania).
Section (b) of Part XI of the Environmental Management Act 2004, Act No. 20 of 2004,
Tanzania deals with the management of litter. “Litter” under Section 120 of the Act is
defined as “any refuse, rubbish, animal remains, glass, metal, plastics, garbage, debris,
dirt, filth, urine, rubble, ballots, stones, earth, sewage or waste matter or any other things
of like nature.” In the Environmental Management Act 2004, Act No. 20 of 2004,
Tanzania the handling of litter is entrusted to every individual who has a public place
under one’s control (Environmental Management Act 204, Act No. 20 of 2004, Tanzania).
The Environmental Management Act 2004 under Part XI gives Local Government
Authorities the responsibilities among other things to undertake solid waste management.
Hence the Local government (Urban Authorities) Act No. 8 of 1982, Tanzania) entrusts to
urban authorities the responsibility, among other things, the responsibilities to ensure that
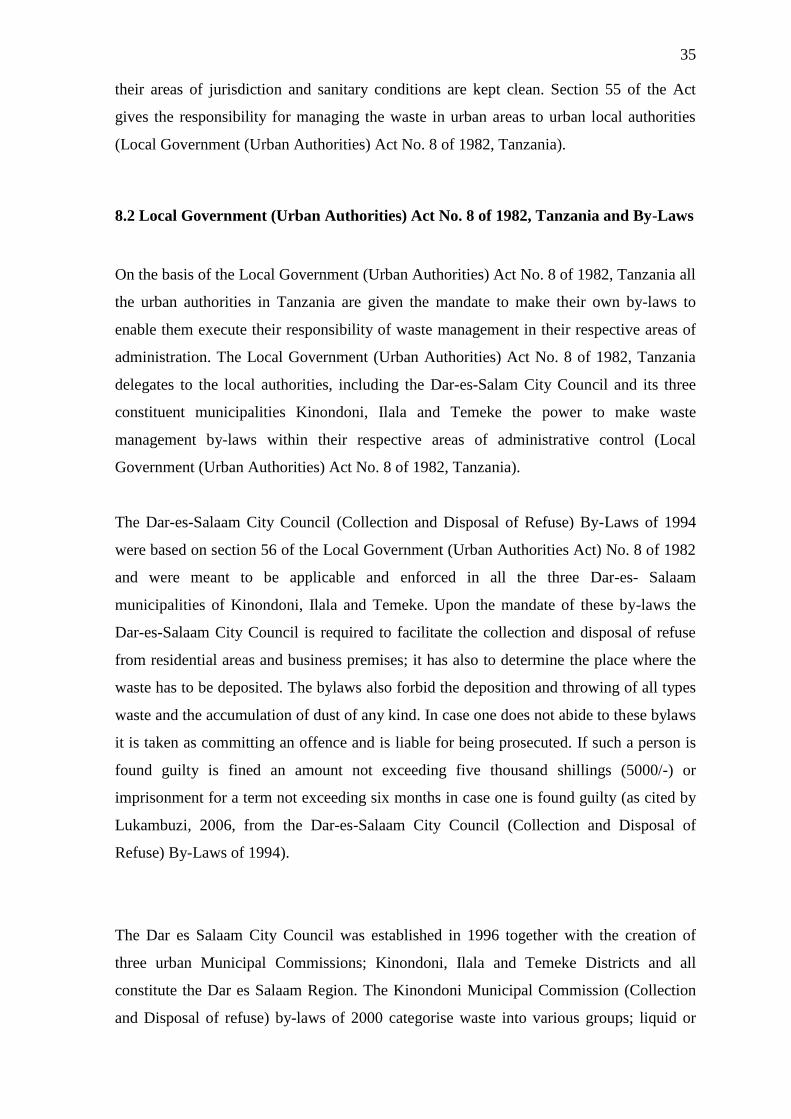
35
their areas of jurisdiction and sanitary conditions are kept clean. Section 55 of the Act
gives the responsibility for managing the waste in urban areas to urban local authorities
(Local Government (Urban Authorities) Act No. 8 of 1982, Tanzania).
8.2 Local Government (Urban Authorities) Act No. 8 of 1982, Tanzania and By-Laws
On the basis of the Local Government (Urban Authorities) Act No. 8 of 1982, Tanzania all
the urban authorities in Tanzania are given the mandate to make their own by-laws to
enable them execute their responsibility of waste management in their respective areas of
administration. The Local Government (Urban Authorities) Act No. 8 of 1982, Tanzania
delegates to the local authorities, including the Dar-es-Salam City Council and its three
constituent municipalities Kinondoni, Ilala and Temeke the power to make waste
management by-laws within their respective areas of administrative control (Local
Government (Urban Authorities) Act No. 8 of 1982, Tanzania).
The Dar-es-Salaam City Council (Collection and Disposal of Refuse) By-Laws of 1994
were based on section 56 of the Local Government (Urban Authorities Act) No. 8 of 1982
and were meant to be applicable and enforced in all the three Dar-es- Salaam
municipalities of Kinondoni, Ilala and Temeke. Upon the mandate of these by-laws the
Dar-es-Salaam City Council is required to facilitate the collection and disposal of refuse
from residential areas and business premises; it has also to determine the place where the
waste has to be deposited. The bylaws also forbid the deposition and throwing of all types
waste and the accumulation of dust of any kind. In case one does not abide to these bylaws
it is taken as committing an offence and is liable for being prosecuted. If such a person is
found guilty is fined an amount not exceeding five thousand shillings (5000/-) or
imprisonment for a term not exceeding six months in case one is found guilty (as cited by
Lukambuzi, 2006, from the Dar-es-Salaam City Council (Collection and Disposal of
Refuse) By-Laws of 1994).
The Dar es Salaam City Council was established in 1996 together with the creation of
three urban Municipal Commissions; Kinondoni, Ilala and Temeke Districts and all
constitute the Dar es Salaam Region. The Kinondoni Municipal Commission (Collection
and Disposal of refuse) by-laws of 2000 categorise waste into various groups; liquid or

36
solid waste, domestic refuse or trade waste; hazardous or bulk waste (as cited by
Lukambuzi, 2006). Also the bylaws give waste management responsibilities to other
entities other than Kinondoni Municipal Commission; these are the Municipal
Commission’s registered agents or contractors. In case one fails to comply with these by-
laws it is taken as a criminal offense and if found guilty is liable for being fined not more
than Tshs. 50,000/= or up to twelve (12) months jail or both (as cited by Lukambuzi,
2006). Ilala Municipal Council by-laws were made under section 80 of the Local
Government (Urban Authorities) Act, 1982, are similar to the bylaws of Kinondoni and
Temeke municipalities and are used for solid waste collection and disposal in the Ilala
Municipal Council (as cited by Lukambuzi, 2006).
The Temeke Municipal Commission bylaws on solid waste management (collection and
disposal of refuse) by-laws, 2002 made under section 80 and 81 of the Local Government
(Urban Authorities Act), 1982 categorise waste into three groups: "bulk waste," "bundle
waste," and "domestic refuse” whereby the three terms are defined as follows:-
"Bulk waste" includes large appliances, machines, furniture, and other solid waste (Including
construction or demolition debris or dead animals with weights or volumes greater than those
allowed for bundle waste or dustbins);
"Bundle waste" includes tree parts, shrubs, bush trimmings, news papers, magazines, cartons or
solid waste securely tied as a package not exceeding one meter in length or 1 kg in weight;
"Domestic refuse" means normal household waste produced on any residential building used
wholly as a private dwelling.
"Hazardous wastes" means waste whole is toxic, flammable, corrosive, radioactive, explosive or
otherwise dangerous in accordance with the Tanzania Environmental Protection Agency, and shall
also include motor oil, diesel, fuel, gasoline (petrol), paint, solvents, dry cell and batteries,
pesticides and infectious or medical wastes from hospitals and clinics, metallic and/or oily sludge
or solvents from commercial and industrial establishments, asbestos materials, pesticides,
radioactive wastes, and the like (Temeke Municipal Commission (Solid Waste Management)
(Collection and Disposal of Refuse) By-Laws, 2002).
Operation wise the Temeke Municipal Council provides solid waste management services
through registered contractors and provides directives on management of the different
kinds of refuse to all responsible entities. And also provides for the payment of waste

37
collection fees by the households or occupiers to the Authority or authorized agents and is
responsible for disposal fees for persons and agents who transport wastes to dumping sites.
If one does not comply to the requirements of the by-laws and if found guilty can be fined
not more than Tshs. 50,000/= or be imprisoned for up to twelve (12) months or both
(Temeke Municipal Commission (Solid Waste Management) (Collection and Disposal of
Refuse) By-Laws, 2002).
9. Waste Management Practices in Tanzania
In Tanzania sorting is not done at the generation points because of the poor environmental
education which people have as well as money to buy various waste bags for the
separation of waste. Collection points usually take every mixture of waste regardless of
the types of waste involved. Though recycling is not well stated in the law it is encouraged
to some extent; the Division (Ministry) of Environment supports the recycling system
hundred percent under sustainable industrial development policy (as stated by Mrs.
Kisanga, Principal Chemist in the Division of Environment, Vice President’s Office,
Tanzania, 2013). Figure 10.
Figure 10: Collection point with a mixture of waste at Jamhuri Street in Ilala Municipality, Dar-
es-Salaam. Photo: John Maziku, November 2013.
In Tanzania there is no law or policy which states clearly how recycling should be done. In
Dar-es –Salaam City which is the largest and commercial city in Tanzania, recycling of
bio waste is done only by Ilala Municipality with the help of a Germany organization
called Bremen Overseas Research and Development Association (BORDA). The two
municipalities of Kinondoni and Temeke do not undertake recycling (According to verbal

38
communication with Mr. Bernado, Environmental Engineer at KIKUTA Waste Recycling
Station, Gongo la Mboto; Dar-es-Salaam, in November, 2013). Figure 11.
Figure 11: KIKUTA Recycling Station at Gongo la Mboto Ward; Ilala Municipality, Dar-es-
Salaam. Photo: John Maziku November 2013.
Recycling of plastic bottles and cans is done privately by scavengers in the streets and at
the Pugu Kimyamwezi Dump Site. It is estimated that 350-400 scavengers go every day to
the Dumpsite and the numbers fluctuate daily (as stated by Mr. Kishere, The Pugu
Kinyamwezi Dump Site Manager in January, 2014). Figure 12. The scavengers are
undertaking the recycling activity voluntarily for their daily bread. Likewise recycling of
other goods such as tires, batteries, scrap metal are also done by individuals with private
companies in a small scale and large scale. There are lots of challenges in collection points
which are inadequate in the city.
Figure 12: Scavengers at Pugu Kinyamwezi Dumpsite. Photo: John Maziku November 2013.

39
10. Material and Methods
10.1 Area of Study
The study was undertaken in Dar-es-Salaam City between early September and December,
2013. This was the period during which the researcher undertook field practical at the Vice
President’s Office, Division of Environment.
The city is situated along the western shores of the Indian Ocean at the extreme Eastern
part of Tanzania. The City has been described as one of the fastest growing cities in Sub
Saharan Africa and it is also the largest administrative, commercial, industrial and cultural,
educational and transportation city in Tanzania (Dar-es-Salaam City Environment Outlook
2011, (2011).
The City is located in the Eastern part of Tanzania mainland between latitude 6ᵒ36´and
7ᵒ0´ South. On the East it borders the Indian Ocean with a long stretch of sandy beach and
shore line which is covered dunes, tidal swamps and coastal plain. To the North, West and
South it is surrounded by the Coast Region. The city covers a total surface area of 1,800
square kilometres (km²). It comprises about 0.9% of the entire area of mainland Tanzania
(Dar-es-Salaam City Environment Outlook 2011 (2011).
The city consists of three municipalities; Temeke with land surface area of 652 km2
(46.8%), Kinondoni having 531 km2
(38.1%) and Ilala having 210 km2
(15.1%) (Dar-es-
Salaam City Environment Outlook, 2011 (2011). Administratively Dar –es-Salaam city is
run by four Local Government Authorities which are the Dar- es-Salaam City Council and
three Municipal Councils of Temeke, Kinondoni and Ilala (Dar-es-Salaam City
Environment Outlook 2011, (2011). Figure 13.
The Dar-es-Salaam coastal and marine ecosystem comprising mangrove forests, sandy
beaches, estuaries, coral reefs and sea grass beds and also rich in many types of marine
and fresh water resources has suffered over the past several decades of serious degradation
because of pollution and over exploitation by human activities. This has lead to the

40
disruption of the ecological balance of the ecosystem, reduction of natural resources, loss
of habitat and biodiversity and in turn this has negatively affected human life and social
economic development (Dar-es-Salaam City Environment Outlook 2011, (2011).
The City has sandy beaches stretching along the coast line which serve as places for
recreation and tourist attraction and also has four major rivers; Mpiji, Msimbazi, Kizinga
and Mzinga rivers and several streams which are severely polluted and yet are sometimes
used as sources of water by poor households in squatter settlements and for irrigation of
vegetable farms. The rivers and streams are badly polluted by untreated solid and liquid
wastes discharged from industrial, commercial and domestic sources (Dar-es-Salaam City
Environment Outlook 2011, (2011).
Figure 13: Locations and Administrative setup of Dar –es- Salaam with insert showing the
location within Tanzania.
Source: Dar - es Salaam City Environment Outlook 2011 (2011), Second Draft, Division
of Environment, Vice President’s Office, United Republic of Tanzania, Dar-es-
Salaam.

41
Population
The city has a total population of 4,364,541 distributed over the three constituent
municipalities as shown in Table 1.
Table 1: Population Distribution over Dar-es-salaam City Municipalities-2012
S/N District/Council Total Male Female Household
Size
0 Total 4,364,541 2,125,786 2,238,755 4.0
1 Kinondoni
Municipal
1,775,049 860,802 914,247 4.0
2 Ilala Municipal 1,220,611 595,928 624,683 4.0
3 Temeke
Municipal
1,368,881 669,056 699,825 3.9
Source: 2012 Population and Housing Census Report (2012), National Bureau of
Statistics, Tanzania, Dar-es-Salaam.
According to the 2012 Population and Housing Census Report (2012) Tanzania the Dar-
es-Salaam City had the highest population among the 30 Administrative Regions of
Tanzania (25 in Mainland Tanzania and 5 in Zanzibar) and accounts for 10 % of the total
mainland population (2012 Tanzania Population and Housing Census Report, Tanzania).
The City has the highest population density in the country numbering 3,133 persons per
square kilometre in relation to the overall country’s average population density of 51
persons per square kilometre. Moreover, the City has an average annual population growth
rate of 5.6% of the Dar-es- Salaam compared to the National average population annual
growth rate of 2.7% in 2012. While the overall average population annual growth rate of
Tanzania shows a declining trend of 3.2% in 2002 to 2.7% in 2012, the Dar-es-Salaam
City growth rate shows an increasing trend of 4.3% between 1988 to 2002 and to 5.6%
between 2002 and 2012 (2012 Population and Housing Census Report, Tanzania (2012).
According to the relative distribution of population in the three Municipalities of Dar –es-
Salaam City as shown in table 1 above, Kinondoni Municipality ranks the highest in
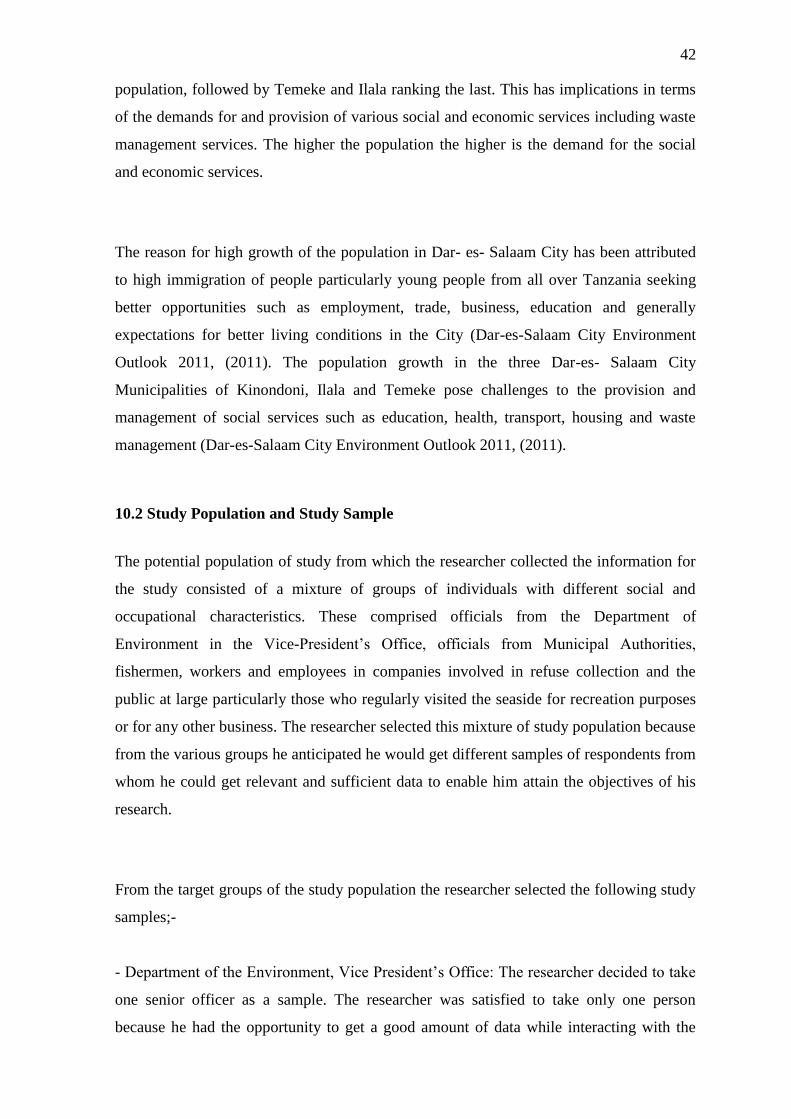
42
population, followed by Temeke and Ilala ranking the last. This has implications in terms
of the demands for and provision of various social and economic services including waste
management services. The higher the population the higher is the demand for the social
and economic services.
The reason for high growth of the population in Dar- es- Salaam City has been attributed
to high immigration of people particularly young people from all over Tanzania seeking
better opportunities such as employment, trade, business, education and generally
expectations for better living conditions in the City (Dar-es-Salaam City Environment
Outlook 2011, (2011). The population growth in the three Dar-es- Salaam City
Municipalities of Kinondoni, Ilala and Temeke pose challenges to the provision and
management of social services such as education, health, transport, housing and waste
management (Dar-es-Salaam City Environment Outlook 2011, (2011).
10.2 Study Population and Study Sample
The potential population of study from which the researcher collected the information for
the study consisted of a mixture of groups of individuals with different social and
occupational characteristics. These comprised officials from the Department of
Environment in the Vice-President’s Office, officials from Municipal Authorities,
fishermen, workers and employees in companies involved in refuse collection and the
public at large particularly those who regularly visited the seaside for recreation purposes
or for any other business. The researcher selected this mixture of study population because
from the various groups he anticipated he would get different samples of respondents from
whom he could get relevant and sufficient data to enable him attain the objectives of his
research.
From the target groups of the study population the researcher selected the following study
samples;-
- Department of the Environment, Vice President’s Office: The researcher decided to take
one senior officer as a sample. The researcher was satisfied to take only one person
because he had the opportunity to get a good amount of data while interacting with the

43
other employees during office hours as he was doing his field internship at the office. The
researcher sought general information regarding environmental management, policy
matters and waste management in general including challenges.
- Officials from Temeke, Ilala and Kinondoni Muncipal Authorities: The researcher
selected a sample of 1 (one) environmental officer from each municipality.
- Fishermen: The researcher selected a sample of 10 fishermen from whom he obtained
information regarding waste management in general at their place of work- the Kivukoni
Fish Market.
- The public at large: 30 Beach goers at Koko Beach recreation area and 20 students of a
higher learning institution (the Institute of Finance Management) who frequently hold
group discussions at the Ocean Road seaside during times of examinations periods. The
researcher sought information about their awareness concerning waste management in
general and at the beach along the Indian Ocean.
- Six (6) employees and workers from waste management companies and civil- based
organizations: all dealing with waste management. The aim was to get their perceptions of
the state of the environment in Dar-es-Salaam and how effective solid waste management
was being undertaken.
10.3 Sampling and Data Collecting Methods
The researcher used mainly two methods in selecting his sample from the major groups of
possible population groups: (a) purposive (non-probability) sampling method and (b)
probability sampling method. The researcher was obliged to use the purposive (non-
probability) sampling method in the Division of Environment; Vice President’s Office,
Tanzania where he was serving as an intern. One senior officer who was regarded to
possess the necessary information which the researcher required was assigned to respond
to all his needs for data on environmental issues within the Division. As a result the officer
was the only respondent who was available for interview.
In a similar manner, the researcher after getting permission to undertake research from the
Municipal Director of each of the three Dar-es-Salaam Municipalities, one environmental

44
expert was assigned to the researcher to respond to all his information requirements. In all
the three City Municipalities the three municipal environmental officers dealing with
waste collection were assigned for him to form his sample. The criteria for the Municipal
authorities to appoint the environmental officers to the researcher was their expertise their
possession of information on environmental and waste management which the searcher
was seeking.
The researcher selected the three groups of the civil community; the beach goers,
fishermen and students of the Institute of Finance Management (IFM) using the purposive
sampling method. The criterion used to select them was their close familiarity with the
Indian Ocean and the beaches and therefore the knowledge regarding the solid waste
situation. The beach goers visited the beach for recreation such as fresh sea breeze and for
swimming; the fishermen earned their living through fishing far away into the Indian
Ocean and washed their fish at Kivukoni Fish Market which was on the coastline. The
students often frequently visited the beach near their Institute for holding study
discussions along the seaside. As for selecting who to interview in each of the three groups
of the civil society the researcher used random selection method.
The researcher applied four methods for collecting primary (first hand) data for the study;
semi-structured individual interviews, group discussions, field observations, stakeholder
consultations and presentations with Ministry officials and questionnaires were used in
order to obtain primary data. Also unstructured interview was used with employees and
workers of a waste management company and a Civil-Based Organisation (CBO) dealing
with waste collection. The purpose of the interview was to understand how those
organizations performed the task of waste management (collection) and the challenges
they faced in undertaking the task.
Semi-structured interviews were administered to the Chief Chemist in the Division of
Environment, Vice-President’s Office, Tanzania and to the environmental officers in three
Dar-es-Salaam municipalities of Kinondoni, Ilala and Temeke. The interviews were based
on an interview guide prepared in advance by the researcher. The researcher administered
the questionnaires face to face orally to each respondent. The questions in the
questionnaires were both closed questions and open-ended questions.
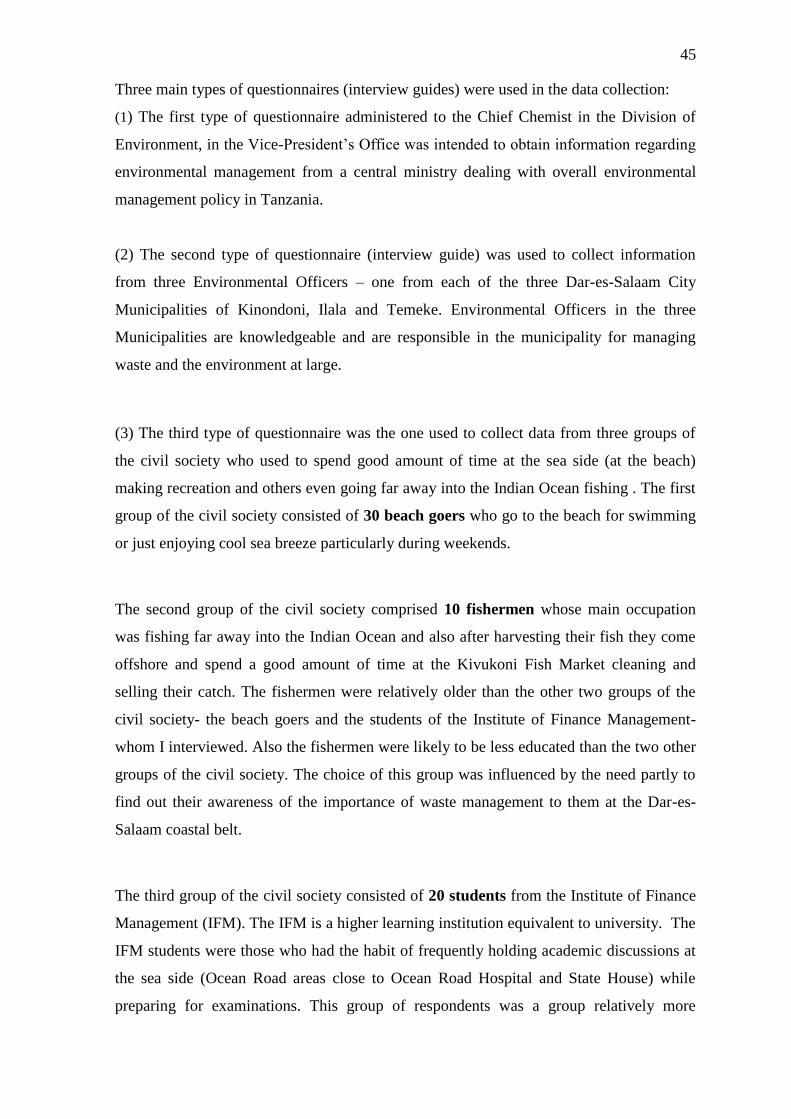
45
Three main types of questionnaires (interview guides) were used in the data collection:
(1) The first type of questionnaire administered to the Chief Chemist in the Division of
Environment, in the Vice-President’s Office was intended to obtain information regarding
environmental management from a central ministry dealing with overall environmental
management policy in Tanzania.
(2) The second type of questionnaire (interview guide) was used to collect information
from three Environmental Officers – one from each of the three Dar-es-Salaam City
Municipalities of Kinondoni, Ilala and Temeke. Environmental Officers in the three
Municipalities are knowledgeable and are responsible in the municipality for managing
waste and the environment at large.
(3) The third type of questionnaire was the one used to collect data from three groups of
the civil society who used to spend good amount of time at the sea side (at the beach)
making recreation and others even going far away into the Indian Ocean fishing . The first
group of the civil society consisted of 30 beach goers who go to the beach for swimming
or just enjoying cool sea breeze particularly during weekends.
The second group of the civil society comprised 10 fishermen whose main occupation
was fishing far away into the Indian Ocean and also after harvesting their fish they come
offshore and spend a good amount of time at the Kivukoni Fish Market cleaning and
selling their catch. The fishermen were relatively older than the other two groups of the
civil society- the beach goers and the students of the Institute of Finance Management-
whom I interviewed. Also the fishermen were likely to be less educated than the two other
groups of the civil society. The choice of this group was influenced by the need partly to
find out their awareness of the importance of waste management to them at the Dar-es-
Salaam coastal belt.
The third group of the civil society consisted of 20 students from the Institute of Finance
Management (IFM). The IFM is a higher learning institution equivalent to university. The
IFM students were those who had the habit of frequently holding academic discussions at
the sea side (Ocean Road areas close to Ocean Road Hospital and State House) while
preparing for examinations. This group of respondents was a group relatively more
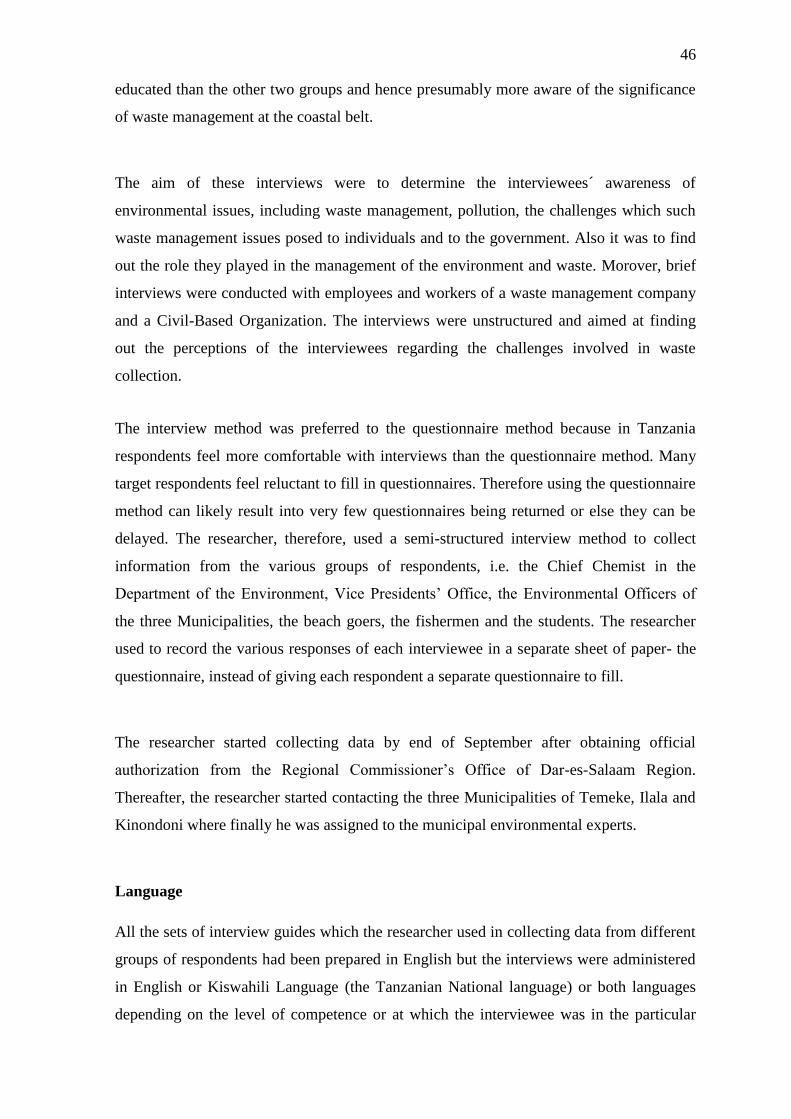
46
educated than the other two groups and hence presumably more aware of the significance
of waste management at the coastal belt.
The aim of these interviews were to determine the interviewees´ awareness of
environmental issues, including waste management, pollution, the challenges which such
waste management issues posed to individuals and to the government. Also it was to find
out the role they played in the management of the environment and waste. Morover, brief
interviews were conducted with employees and workers of a waste management company
and a Civil-Based Organization. The interviews were unstructured and aimed at finding
out the perceptions of the interviewees regarding the challenges involved in waste
collection.
The interview method was preferred to the questionnaire method because in Tanzania
respondents feel more comfortable with interviews than the questionnaire method. Many
target respondents feel reluctant to fill in questionnaires. Therefore using the questionnaire
method can likely result into very few questionnaires being returned or else they can be
delayed. The researcher, therefore, used a semi-structured interview method to collect
information from the various groups of respondents, i.e. the Chief Chemist in the
Department of the Environment, Vice Presidents’ Office, the Environmental Officers of
the three Municipalities, the beach goers, the fishermen and the students. The researcher
used to record the various responses of each interviewee in a separate sheet of paper- the
questionnaire, instead of giving each respondent a separate questionnaire to fill.
The researcher started collecting data by end of September after obtaining official
authorization from the Regional Commissioner’s Office of Dar-es-Salaam Region.
Thereafter, the researcher started contacting the three Municipalities of Temeke, Ilala and
Kinondoni where finally he was assigned to the municipal environmental experts.
Language
All the sets of interview guides which the researcher used in collecting data from different
groups of respondents had been prepared in English but the interviews were administered
in English or Kiswahili Language (the Tanzanian National language) or both languages
depending on the level of competence or at which the interviewee was in the particular
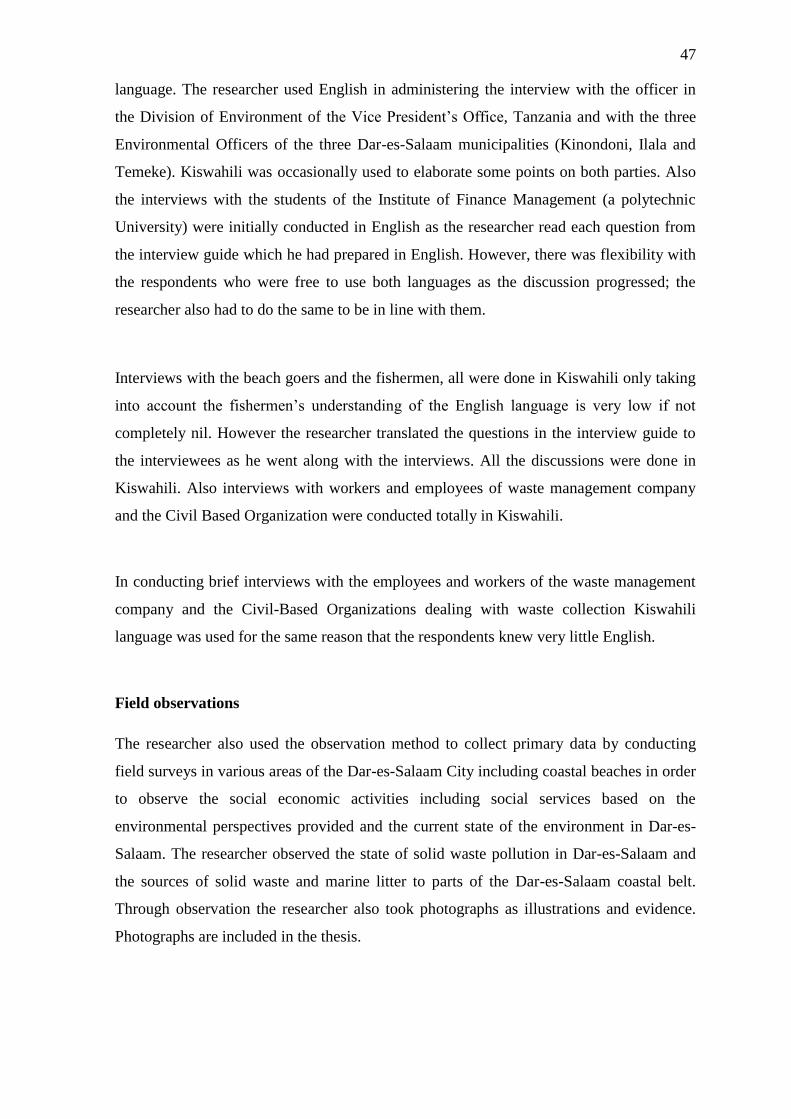
47
language. The researcher used English in administering the interview with the officer in
the Division of Environment of the Vice President’s Office, Tanzania and with the three
Environmental Officers of the three Dar-es-Salaam municipalities (Kinondoni, Ilala and
Temeke). Kiswahili was occasionally used to elaborate some points on both parties. Also
the interviews with the students of the Institute of Finance Management (a polytechnic
University) were initially conducted in English as the researcher read each question from
the interview guide which he had prepared in English. However, there was flexibility with
the respondents who were free to use both languages as the discussion progressed; the
researcher also had to do the same to be in line with them.
Interviews with the beach goers and the fishermen, all were done in Kiswahili only taking
into account the fishermen’s understanding of the English language is very low if not
completely nil. However the researcher translated the questions in the interview guide to
the interviewees as he went along with the interviews. All the discussions were done in
Kiswahili. Also interviews with workers and employees of waste management company
and the Civil Based Organization were conducted totally in Kiswahili.
In conducting brief interviews with the employees and workers of the waste management
company and the Civil-Based Organizations dealing with waste collection Kiswahili
language was used for the same reason that the respondents knew very little English.
Field observations
The researcher also used the observation method to collect primary data by conducting
field surveys in various areas of the Dar-es-Salaam City including coastal beaches in order
to observe the social economic activities including social services based on the
environmental perspectives provided and the current state of the environment in Dar-es-
Salaam. The researcher observed the state of solid waste pollution in Dar-es-Salaam and
the sources of solid waste and marine litter to parts of the Dar-es-Salaam coastal belt.
Through observation the researcher also took photographs as illustrations and evidence.
Photographs are included in the thesis.

48
Stakeholder consultations
Also the researcher held several consultations and discussions with various key
stakeholders such as scavengers, the Heads of Community Based Organizations some
NGO workers in order to get their perceptions on the state of the environment and waste
management in Dar-es-Salaam City and the challenges involved and possible management
actions that could be taken to ensure sustainable environmental management within the
City.
Presentations- Conferences and Meetings
By attending a number of conferences within a Ministry of Environment in Tanzania as an
intern the researcher was able to gather important information regarding issues concerning
environmental management in Dar-es-Salaam. Also the researcher participated in a one
week seminar for book review titled “The State of the Environment Report 2008-Draft.”
The conference and seminars and discussions in the Department of the Environment in the
Vice Presidents’ Office made his understanding and awareness of the environment and
pollution in Tanzania particularly in Dar-es-Salaam. He was also able to get articles from
the website on solid waste management.
Literature study
The literature study method was also used for collecting data (already available data) on
the environment, waste management and legislation from various sources such as books,
online articles from the internet and reports from the Municipalities. The articles were on
the European Union, South Africa, East Africa including Tanzania and other countries in
the areas of environmental and waste management. The data obtained on solid waste
generation and collection was for the whole Dar-es-Salaam City and they were not
grouped according to the three municipal authorities. Moreover the data was limited to the
period from 1994 to 2007. More current data was not available from any of the
municipalities.
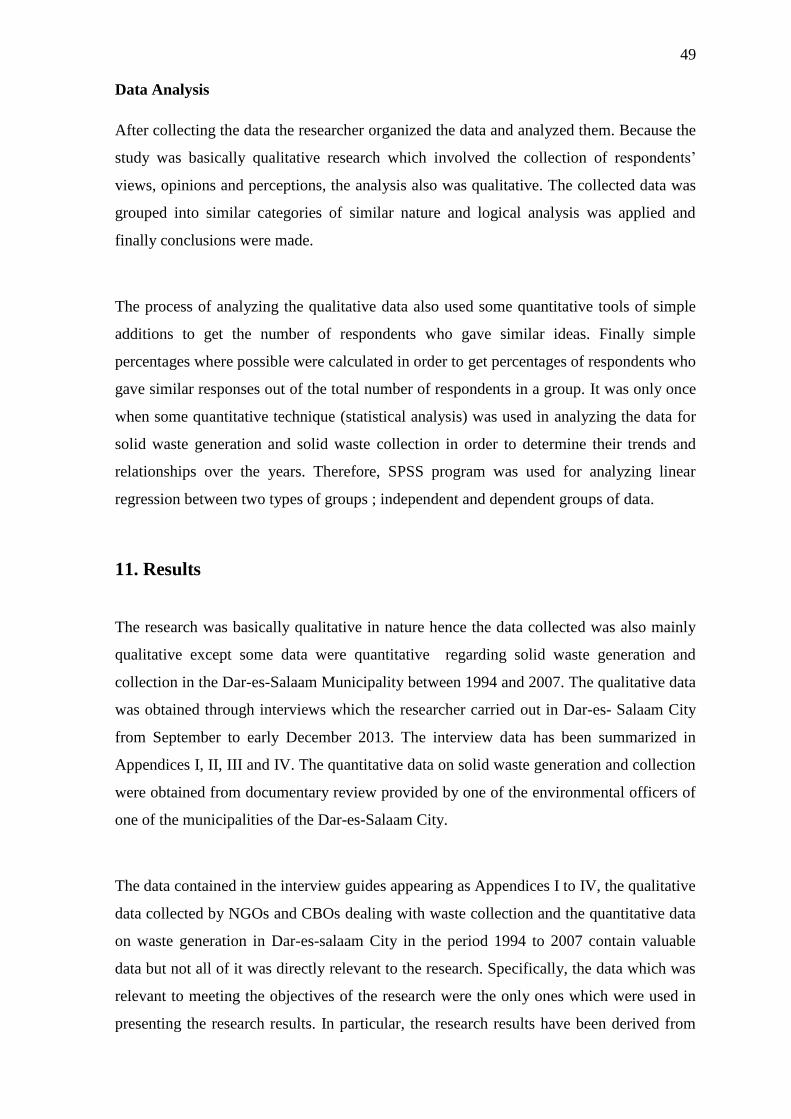
49
Data Analysis
After collecting the data the researcher organized the data and analyzed them. Because the
study was basically qualitative research which involved the collection of respondents’
views, opinions and perceptions, the analysis also was qualitative. The collected data was
grouped into similar categories of similar nature and logical analysis was applied and
finally conclusions were made.
The process of analyzing the qualitative data also used some quantitative tools of simple
additions to get the number of respondents who gave similar ideas. Finally simple
percentages where possible were calculated in order to get percentages of respondents who
gave similar responses out of the total number of respondents in a group. It was only once
when some quantitative technique (statistical analysis) was used in analyzing the data for
solid waste generation and solid waste collection in order to determine their trends and
relationships over the years. Therefore, SPSS program was used for analyzing linear
regression between two types of groups ; independent and dependent groups of data.
11. Results
The research was basically qualitative in nature hence the data collected was also mainly
qualitative except some data were quantitative regarding solid waste generation and
collection in the Dar-es-Salaam Municipality between 1994 and 2007. The qualitative data
was obtained through interviews which the researcher carried out in Dar-es- Salaam City
from September to early December 2013. The interview data has been summarized in
Appendices I, II, III and IV. The quantitative data on solid waste generation and collection
were obtained from documentary review provided by one of the environmental officers of
one of the municipalities of the Dar-es-Salaam City.
The data contained in the interview guides appearing as Appendices I to IV, the qualitative
data collected by NGOs and CBOs dealing with waste collection and the quantitative data
on waste generation in Dar-es-salaam City in the period 1994 to 2007 contain valuable
data but not all of it was directly relevant to the research. Specifically, the data which was
relevant to meeting the objectives of the research were the only ones which were used in
presenting the research results. In particular, the research results have been derived from

50
the data obtained from the various sources (including the various groups of respondents)
mostly as contained in the Appendices I, II, III and IV. The research results have been
presented here below in relation to the specific objectives of this research.
11.1 Objective 1: People’s Awareness of Solid Waste Management
The purpose of this research objective was to find out whether people in Dar-es-Salaam
understood the importance of solid waste management to the Dar-es-Salaam Coastal belt
and to its environment at large. Results from interview responses of an official from the
Department of the Environment in the Vice President’s Office, three groups of the Civil
Society and Municipal Environmental Officers provide the following information about
people’s awareness of different aspects of the significance of solid waste management
within the Dar-es-Salaam City Coastal belt and on its environment as a whole:-
Results from the Department of the Environment
Response results from the designated officer in the Department of the Environment in the
Vice President’s Office- the organ responsible for environmental legislation and policy
formulation in Tanzania to question number 3 on whether the “Ministry” had any plans to
educate the people concerning waste management and to question 5 on people’s awareness
about the environment revealed that already a campaign with the slogan, “everybody
should clean his premises” had been launched on the 12th
February, 2011. However, it was
informed that the campaign was poorly implemented. Also the response to question 5
reveals poor environmental awareness among the people Dar-es-Salaam City. Interview
results to question 3 and 5 are obtained in Appendix I: Results on Questionnaire to the
Division of the Environment, Vice President’s Office.
Results from Municipal Environmental Officials of Kinondoni, Ilala and Temeke:
Environmental officers in the Municipalities are responsible for the overall management of
the environment within the administrative boundaries of the respective municipalities.
Results from interview responses of three Environmental Officers of Kinondoni, Ilala and
Temeke Municipalities on question 4, “What challenges do you face in solving and
implementing your waste management plan?” Two of the environmental officers out of 3
(= 66%) stated the absence/ lack of community awareness about environmental

51
management and the side effects of waste. As examples, of the lack of awareness of
people regarding waste management: people in the municipalities threw their food
leftovers and some peelings into the flood drains along the city street roads- actions which
blocked the drains and caused city roads to flood with water mixed with waste.
Interview results from Municipal Environmental Officers also reveal that many inhabitants
of Ilala Municipality had their latrine pipes connected to discharge their liquid wastes into
the Msimbazi River. Finally the river discharge it´s water into the Indian Ocean and
pollute it. Also it was noted that community members were reluctant to pay waste
collection fees. Appendix II: Results to questionnaire on solid waste management in Dar-
es-salaam coastal City by environmental officers of Kinondoni, Ilala and Temeke
Municipalities, contains all the responses from the interviewed municipal environmental
officers to the questions.
Results from the Civil Society Groups in Dar-es-Salaam
The Civil Society in this study was represented by 30 Beach Goers aged 20 to 25 years, 10
Fishermen aged 30 to 50 years and 20 IFM Students aged 20 to 25 years who were
selected purposely because of their close familiarity with the coastline as they frequently
visited the beach; one group recreated at the beach, another earned its living in the ocean
through fishing and the other frequently spent time studying at the beach. The three groups
were expected to give their views regarding the significance of solid waste management to
the Dar-es-Salaam City in general and to its coastal belt in particular through answering
several interview questions as detailed here under. The full tabulation and analysis of the
responses are summarized in Appendix III: Results on questionnaire to Civil Society
Groups (beach goers, fishermen and students).
Question 1: Are you satisfied with the waste management services given by the
municipalities?
Results from responses by beach goers, fishermen and students to this question are
summarised in Table 2.
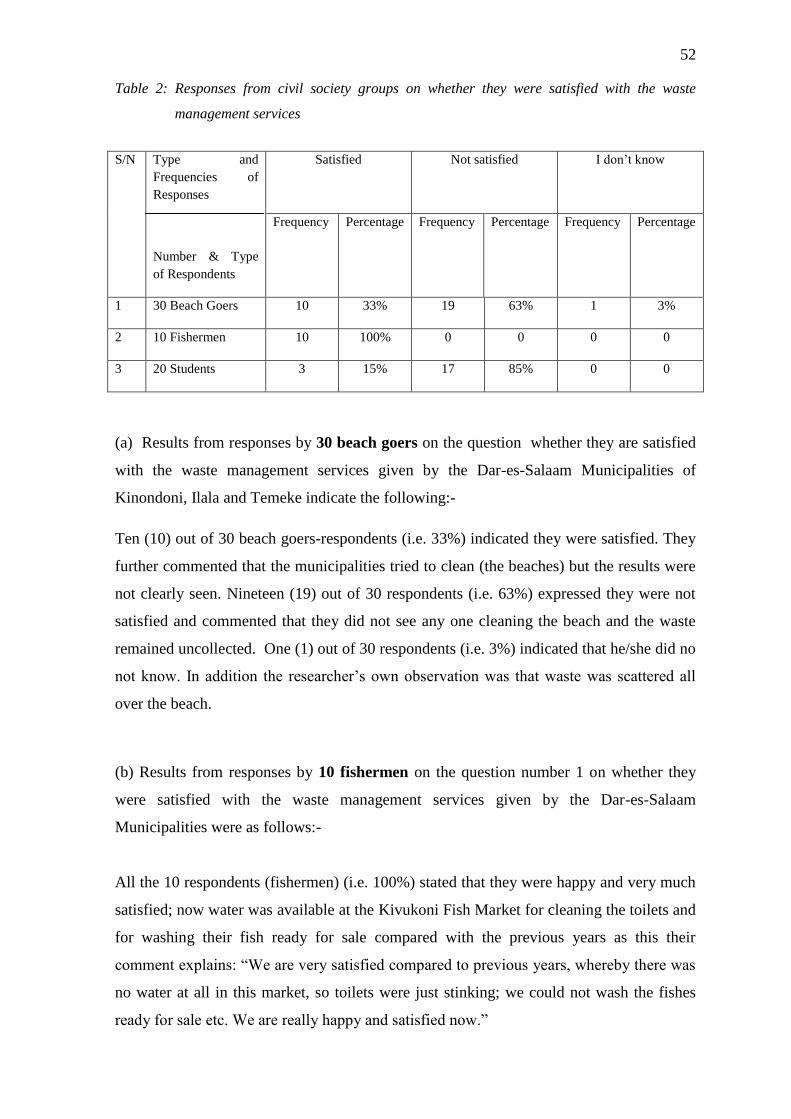
52
Table 2: Responses from civil society groups on whether they were satisfied with the waste
management services
S/N Type and
Frequencies of
Responses
Number & Type
of Respondents
Satisfied
Not satisfied
I don’t know
Frequency Percentage
Frequency Percentage
Frequency Percentage
1 30 Beach Goers 10 33% 19 63% 1 3%
2 10 Fishermen 10 100% 0 0 0 0
3 20 Students 3 15% 17 85% 0 0
(a) Results from responses by 30 beach goers on the question whether they are satisfied
with the waste management services given by the Dar-es-Salaam Municipalities of
Kinondoni, Ilala and Temeke indicate the following:-
Ten (10) out of 30 beach goers-respondents (i.e. 33%) indicated they were satisfied. They
further commented that the municipalities tried to clean (the beaches) but the results were
not clearly seen. Nineteen (19) out of 30 respondents (i.e. 63%) expressed they were not
satisfied and commented that they did not see any one cleaning the beach and the waste
remained uncollected. One (1) out of 30 respondents (i.e. 3%) indicated that he/she did no
not know. In addition the researcher’s own observation was that waste was scattered all
over the beach.
(b) Results from responses by 10 fishermen on the question number 1 on whether they
were satisfied with the waste management services given by the Dar-es-Salaam
Municipalities were as follows:-
All the 10 respondents (fishermen) (i.e. 100%) stated that they were happy and very much
satisfied; now water was available at the Kivukoni Fish Market for cleaning the toilets and
for washing their fish ready for sale compared with the previous years as this their
comment explains: “We are very satisfied compared to previous years, whereby there was
no water at all in this market, so toilets were just stinking; we could not wash the fishes
ready for sale etc. We are really happy and satisfied now.”

53
However, according to the researcher’s observations, the situation at the fish market
looked filthy. There was a pile up of plastic bags, packaging materials, plastic bottles,
paper boxes, and coconut shells (solid waste) and all mixed with water and mud. Figure
14.
Figure 14: A Pile of waste mixed with water at Kivukoni Fish Market. Photo: John Maziku
November, 2013.
(c) Results from responses by 20 students of the Institute of Finance Management (IFM)
to question number 1 on whether they were satisfied with the waste management services
given by the Dar-es-Salaam Municipalities were as follows:-
Three (3) student respondents out of 20 (i.e. 15%) were satisfied adding that every
morning they used to see people cleaning the place but thereafter in the afternoon waste
accumulated because there were no waste bins. “We normally see people cleaning in the
morning whenever we come; but the problem is the people who pass by usually throw
plastic bottles and plastic bags because there are no waste bins around as you see now.
People clean every morning but after some time in the afternoon waste accumulates.”
Seventeen (17) student respondents out of 20 (i.e. 85%) answered they were dissatisfied
with the waste management services and claimed that they did not see anyone cleaning the
place. Table 2 displays the responses of the three groups of the civil society.

54
The overall results from the three groups of Civil Society which were interviewed show
that on the average 38% were satisfied with the management services as opposed to a
majority of 60% of the respondents (i.e. 60) who were not satisfied.
Question 2: If no (If you are not satisfied with the waste management services), what
are you doing in your small ways to reduce the problem?
This question intended to find out the awareness of the sampled section of the Civil
Society of its role in improving the quality of solid waste management on the coast belt.
Results from responses by the sampled groups of the Civil Society to the question based
on the 4 alternative answers; (i) I try not to pollute the environment whenever I am here,
(ii) It is not my responsibility, (iii) I don’t know and (iv) Other, are shown in Table 3.
(a) Response results to the interview question from 30 beach goers showed that 7 (i.e.
23%) tried not to pollute the environment whenever they were at the beach; none (i.e. 0%)
felt that it was not his/her responsibility to do something to reduce the problem. Twenty
three (23) (i.e. 77%) of the respondents responded under “Other” category of responses
with such a typical remark, “Anyone who comes here will automatically be compelled to
pollute the environment because there are no waste bins.”
Table 3: Responses from Civil Society Groups on whether they were doing anything to reduce the
problem of solid waste
S/N Type and
frequencies
of
Responses
Number of
respondents
I try not to pollute
the environment
whenever I am here
It is not my
responsibility
I don’t know
Other
Frequency Percen
tage
Frequency Perce
ntage
Frequency Perce
ntage
Frequenc
y
Percen
tage
1 30 Beach
Goers
7 23% 0 0 27 73% 0 0
2 10
Fishermen
10 100% 0 0 0 0 0 0
3 20 Students 12 60% 1 5% 0 0 7 35%

55
(b) Response results from all the 10 (i.e. 100%) fishermen expressed that they tried not to
pollute the environment whenever they were at the coast belt.
(c) Twelve (12) out of 20 (i.e. 60%) students responded that they tried not to pollute the
environment whenever they were at the beach. Also some of them added these comments:
“I educate people at home; I clean the environment where I live; I am ready to walk with a
plastic bottle from morning to evening if I don’t see waste bins.”
One (1) out of 20 (i.e. 5%) student respondents felt it was not his/her responsibility to do
anything to reduce the pollution problem at the Coast belt. In addition the respondent
added these comments to justify his stand: “It is not my responsibility. It is the
responsibilities of the Municipality because they are paid for it from our own taxes and
they do nothing. For example; when Obama (President of the United States of America)
came here, the beach was very clean; not even a single plastic bag; and it was the
Municipality which was doing that.”
These comments imply that this particular respondent felt that the Municipality was not
fulfilling its own responsibility of keeping the environment and the coastal belt clean;
giving as an example the state of the beach during President Obama’s visited to Dar-es-
Salaam when the Municipality kept the beach very clean.
Under the third suggested option of responses, “I don’t know,” there was no student who
responded to this. On the other hand 7 (i.e. 35%) of the student respondents put their
answers under the fourth alternative category of responses, i.e. “Other,” and gave these
comments: “I don’t pollute at all in the street; I only clean where I live; there are no waste
bins throughout the city; people are not yet civilized.” These comments are very similar to
the responses of the 12 students whose responses fell under the first option of responses-
“I try not to pollute the environment whenever I am here.”
Question 3: Why do we still experience the waste problems in our society/ Dar-es-
Salaam?
This question is intended to find out from the three groups of Civil Society (30 beach
goers, 10 fishermen and 20 students) what they perceived to be the reasons for the waste

56
problems to continue to exist in the City of Dar-es-Salaam. Hence, the question was
intended to find out the respondents’ awareness of the reasons for the problem of waste to
continue being experienced in the City of Dar-es- Salaam and its Coastal belt. Interview
results are summarized in Table 4.
Table 4: Respondents’ views on why the waste problem continues to be experienced
N/A Number & Types of Respondents Type of Response
1 30 Beach Goers No waste bins in the whole city not only here at the beach*
2 10 Fishermen (It seems they do not see any problem of waste)
3 20 Students -No waste bins throughout the city. People are not yet
civilized.
All the 30 (i.e. 100%) beach goers (respondents) pointed to the absence of waste bins not
only at the beach but also in the whole city.” Similarly, all the 20 (100%) student
respondents gave similar reasons that there were no waste bins throughout the city and
people were not yet civilized. On the other hand, all the (10) ten (100%) fishermen
respondents were silent. Possibly they did not see any waste problem in Dar-es-Salaam
City and at the coastline in the same way as they expressed they were satisfied with the
waste management services given by the Dar-se-Salaam Municipalities in question 1.
Question 4: Have you ever experienced any problem associated with waste?
The intention for this question was to find out the respondents’ experiences, hence their
awareness, regarding problems brought about by waste as a way of testing their awareness
of the harmful effects of waste to individuals and society. The respondents were required
to give any one of the three suggested alternative answers: (i) Yes, (ii) No (iii) I don’t
know. The respondents were 30 beach goers, 10 fishermen and 20 students. Table 5
displays the responses.

57
Table 5: Responses on whether civil society groups have ever experienced any problem associated
with waste
S/N
Type and
Frequencies of
Responses
Number & Type
of Respondents
Yes
No
I don’t know
Frequency Percentag
e
Frequency Percentag
e
Frequency Percentage
1 30 Beach Goers 22 73% 8 27% 0 0%
2 10 Fishermen 6 60% 4 40% 0 0%
3 20 Students 2 10% 18 90% 0 0%
Twenty two (22) (i.e. 73%) of 30 beach goers agreed (said Yes) to have experienced
problems with waste that it causes diseases such as cholera and typhoid. Specifically, they
gave these experiences as examples of the effects of waste: “I got typhoid when I was in
school; I have seen some people suffering from cholera; I got stomach ache when I ate
food which was not good.” Eight (8) (i.e. 27%) of the beach goers answered “No” to the
question; that is they had never experienced any problem associated with waste. Six (6)
(i.e. 60%) of the 10 fishermen respondents agreed they had experienced problems with
regard to waste (i.e. answered “Yes”) without further elaboration. The remaining 4 (i.e.
40%) of the fishermen answered they had not experienced any problem with waste
(answered “No”).
Results from the interviews with 20 students show that 2 (i.e. 10%) of the respondents
agreed (said “Yes”) to have experienced problems with waste. One of the respondents said
he saw one man where he used to live who was suffering from cholera. Eighteen (18), that
is 90% of the student respondents denied (answered “No”) to have experienced any
problem with waste. Interview results are summarized in Table 5.

58
Question 5: Do you know how waste management is functioning in the City
Municipalities?
The question was intended to find out whether the respondents (the Civil Society groups)
were aware of how waste management was functioning in the Dar-es-Salaam City
Municipalities. Table 6 displays all the responses to the question.
Table 6: Responses of Civil society groups on awareness of how waste management functions in
the City Municipalities?
S/N
Type and
Frequencies of
Responses
Number & Type
of Respondents
Yes
No
I don’t know
Frequency Percentage
Frequency Percentage
Frequency Percent
age
1 30 Beach Goers 0 0% 27 90% 3 10%
2 10 Fishermen 10 100% 0 0% 0 0%
3 20 Students 4 20% 16 80% 0 0%
Interview results show that among 30 beach goers twenty seven (27) (i.e. 90%) answered
“No” to the question; that is they were not aware how waste management was functioning
in the Municipalities. One of the respondents commented, “Though I usually see waste
management vehicles and people cleaning around the City; still there is always waste
scattered around.” Three (3) respondents which are equal to 10% of the respondents
indicated that they did not know how waste management was functioning in the Dar-es-
Salaam City Municipalities. The 27 respondents who said “no” and the 3 respondents who
said “I don’t know” expressed almost the same thing that they were not aware of how
waste management was functioning in the Dar-es-Salaam City Municipalities. This makes
100% of the beach goers being ignorant of how waste management functioned in the Dar-
es-Salaam City. Also results show that 10 fishermen (100%) expressed that they were

59
aware of how waste management was functioning in the Dar-es-Salaam City
Municipalities.
Results show that 4 out of 20 student interview-respondents (20%) indicated a “Yes”
response to the question. That is they knew how waste management was functioning in the
Dar-es-Salaam City Municipalities. The remaining 16 of the student respondents (i.e. 80
%) by saying “No,” means they were not aware.
Question 6: Do you know where you are supposed to put your waste?
Question 6 was intended to find out the awareness of the three groups of Civil Society
where they were supposed to deposit their waste. Interview results are summarized in
Table 7.
Table 7: Response on the awareness of where one is supposed to put the waste
S/N
Type and
Frequencies of
Responses
Number & Type
of Respondents
Yes
No
I don’t know
Frequency
Percentage
Frequency
Percentage
Frequency
Percentage
1 30 Beach Goers 30 100% 0 0% 0 0%
2 10 Fishermen 10 100% 0 0% 0 0%
3 20 Students 20 100% 0 0% 0 0%
All the 30 beach goers (i.e. 100%) gave a “Yes” response to the question; meaning that
they knew where they were supposed to put their waste. However, they indicated the
problem of where to put the waste: “The problem is, there are no waste bins throughout
the City. Though they started putting waste bins in the City unfortunately people remove
them.”

60
Also the interview results show that all the 10 fishermen (i.e. 100%) gave a “Yes”
response to question 6; thus indicating they were aware of where they were supposed to
put their waste. To illustrate their awareness they added these comments: “When we
remove fish scales and intestines we usually throw them back to the ocean. The other
types of waste we usually put them in waste collection places around the market areas.”
However, according to the researcher’s observation, the fish market lacked open skip
buckets for putting the waste. As a result, other solid waste streams were only dumped
around the market floor.
Results about the responses of 20 student respondents to question 6 reveal that all the
twenty respondents (100%) provided a “Yes” response. This meant that the student
respondents were aware where they were supposed to put the waste. However, they also
pointed to the same problem of lack of waste bins throughout the Dar-es-Salaam City to
put their waste.
Figure 15: A street in Oysterbay (Left) and a street in Masaki in Kinondoni Municipality, Dar-
es-Salaam (Right) without waste bins. Photo: John Maziku, November, 2013
Question 7: Do you know where your waste ends after being discharged into the
drains?
Question 7 was aimed at finding out the respondents’ awareness about the final destination
of the waste after being discharged into the drains. Table 8 summarizes the responses.

61
Table 8: Respondents’ awareness of where the waste ends after being discharged into the drains
S/N
Type and
Frequencies of
Responses
Number & Type
of Respondents
Yes
No
I don’t know
Frequency Percentage
Frequency Percentage
Frequency Percent
age
1 30 Beach Goers 26 87% 0 0% 4 13%
2 10 Fishermen 10 100% 0 0% 0 0%
3 20 Students 19 95% 1 5% 0 0%
Interview results from 30 beach goers-respondents indicate that 26 beach goers (i.e. 87%)
gave a “Yes” response to the question. Specifically these 26 respondents were clear with
where the waste ended and their effect. Hence those beach goers explained: “Some of
them (the waste) block the drains and some of them do come here (at the beach) during
rainy season especially those from the low lying areas such as Jangwani area.” However,
only 4 of the beach goers (13%) gave an “I don’t know response,” with an uncertain
explanation as this: “Perhaps (the waste go) into the streets” Hence the interview results
show that the majority of the beach goers-respondents were aware of the destination and
effects of the waste- they finally ended at the beaches during the rainy season and some of
them blocked the drains.
Results from the interviews of the 10 fishermen-respondents show that all 10 of them (i.e.
100%) provided a “Yes” response to the question. This meant that they knew where their
waste ended and their ultimate effects after being discharged into the drains. These
comments illustrate their awareness: “Here whenever we throw away something like fish
intestines they go directly into the ocean; but in the streets the waste usually block the
drains and make the water overflow during the rainy season and cause roads floods.”
Out of the 20 student respondents 19 of them (i.e. 95%) responded with a “Yes” and only
1 respondent, the equivalent of 5% of all the respondents, gave a “No” response. Hence

62
the majority of the student respondents not only know where the waste ended but also their
effects. These students’ comments illustrate: “They (wastes) block the drainage system
and cause floods during the rainy season.”
Question 8: Do you think these wastes will bring any harm to the aquatic animals or
plants?
This question was intended to find out from the respondents whether they were aware of
the harmful effects of the waste which are discharged or thrown into the ocean to the
aquatic animals or plants. Responses to the question are summarized in Table 9.
Table 9: Responses on awareness of whether waste bring harm to the aquatic animals or plants
S/N
Type and
Frequencies of
Responses
Number & Type
of Respondents
Yes
No
I don’t know
Frequency Percentage
Frequency Percentage
Frequency Percentage
1 30 Beach Goers 2 7% 28 93% 0 0%
2 10 Fishermen 2 20% 2 20% 6 60%
3 20 Students 20 100% 0 0% 0 0%
Out of the 30 beach goers who were asked only 2 of them, an equivalent of 7% of all the
respondents, answered “Yes.” They gave this explanation: “The industries which
discharge poisonous water into the ocean might kill the fish.” However, they were not sure
whether the poisonous substances could kill the fish.
Twenty eight (28) out of the 30 beach goers (i.e. 93%) who were interviewed gave a “No”
response to the question. They explained their response in the following terms:-
“As you see the plastic bags are outside the ocean; they are within the sandy beaches. It
seems the ocean is very active; it does not take in any type of waste. Whatever goes in is
usually brought out by the ocean waves particularly when the ocean water is coming again
to the coast at the time of high tide after disappearing.
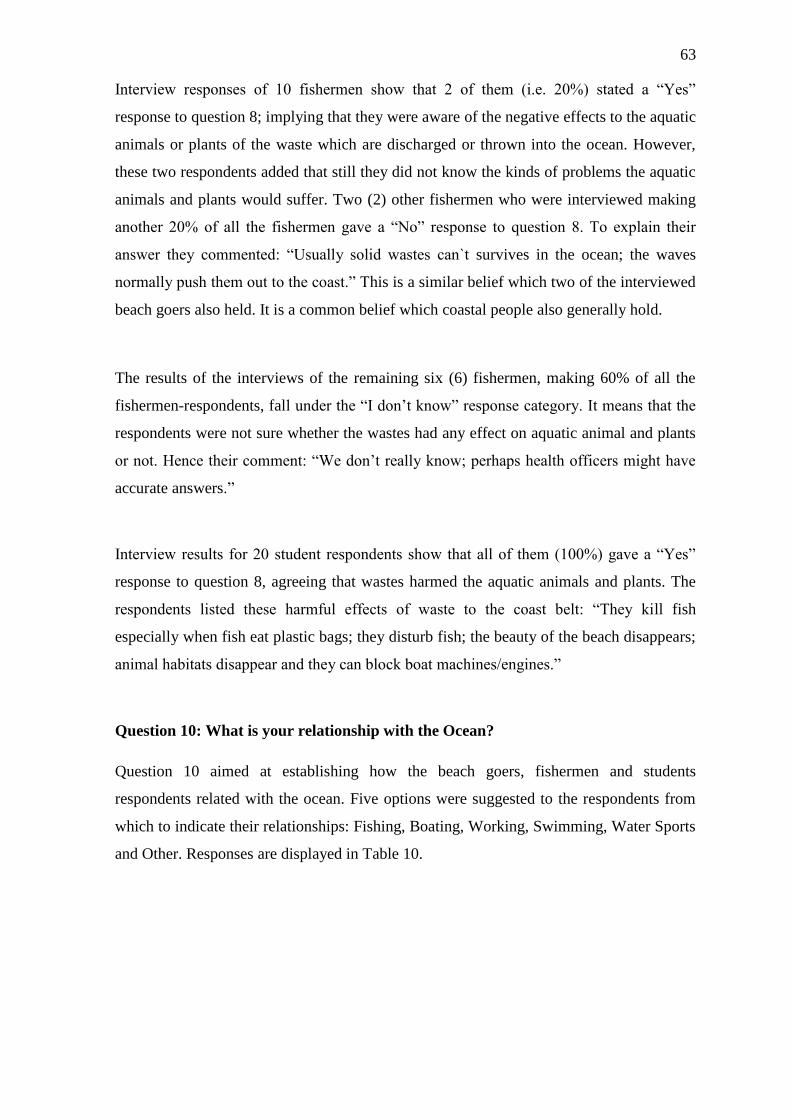
63
Interview responses of 10 fishermen show that 2 of them (i.e. 20%) stated a “Yes”
response to question 8; implying that they were aware of the negative effects to the aquatic
animals or plants of the waste which are discharged or thrown into the ocean. However,
these two respondents added that still they did not know the kinds of problems the aquatic
animals and plants would suffer. Two (2) other fishermen who were interviewed making
another 20% of all the fishermen gave a “No” response to question 8. To explain their
answer they commented: “Usually solid wastes can`t survives in the ocean; the waves
normally push them out to the coast.” This is a similar belief which two of the interviewed
beach goers also held. It is a common belief which coastal people also generally hold.
The results of the interviews of the remaining six (6) fishermen, making 60% of all the
fishermen-respondents, fall under the “I don’t know” response category. It means that the
respondents were not sure whether the wastes had any effect on aquatic animal and plants
or not. Hence their comment: “We don’t really know; perhaps health officers might have
accurate answers.”
Interview results for 20 student respondents show that all of them (100%) gave a “Yes”
response to question 8, agreeing that wastes harmed the aquatic animals and plants. The
respondents listed these harmful effects of waste to the coast belt: “They kill fish
especially when fish eat plastic bags; they disturb fish; the beauty of the beach disappears;
animal habitats disappear and they can block boat machines/engines.”
Question 10: What is your relationship with the Ocean?
Question 10 aimed at establishing how the beach goers, fishermen and students
respondents related with the ocean. Five options were suggested to the respondents from
which to indicate their relationships: Fishing, Boating, Working, Swimming, Water Sports
and Other. Responses are displayed in Table 10.

64
Table 10: Respondents’ kinds of relationship with the Indian Ocean
S/N Number &
Types of
Respondents
30 Beach Goers
10 Fishermen
20 Students
Types &
Frequencies of
Responses
Frequency Percentage
Frequency Percentage
Frequency Percentage
1 Fishing 10 100%
3 15%
2 Boating
3 Working
4 Swimming 22 73% 6 30%
5 Water Sports
6 Other 8 27% 11 55%
Interview results from 30 beach goers respondents reveal that 22 of them (73%) used the
Indian Ocean for swimming recreation and 8 of the beach goers (27%) use it for “other
purposes” specified as recreational purposes other than swimming- e.g. sea breeze, outing.
Results also tell that all 10 fishermen respondents (100%) used the Indian Ocean for
fishing through which they earned their livelihood. Interview results for 20 student
respondents are of three types: Three (3) respondents (15%) used the ocean for fishing, 6
(30%) for swimming and 11 (55%) for recreational purposes such as fresh air, good
environment for conducting academic discussions. The results to this question show that
all the respondents in all the three civil society groups derived some benefits from the
Indian Ocean and its coast line.
Question 11: What problems do you think there are in the Indian Ocean?
This question intended the respondents to select any three of 5 suggested problems that
could have been in the Indian Ocean: (i) Eutrophication, (ii) overfishing/ illegal fishing,
(iii) industrial pollution and (iv) oil spills and (v) other. The purpose was to identify the
kinds of problems which respondents perceived to exist in the Indian Ocean. Responses
are summarized in Table 11.
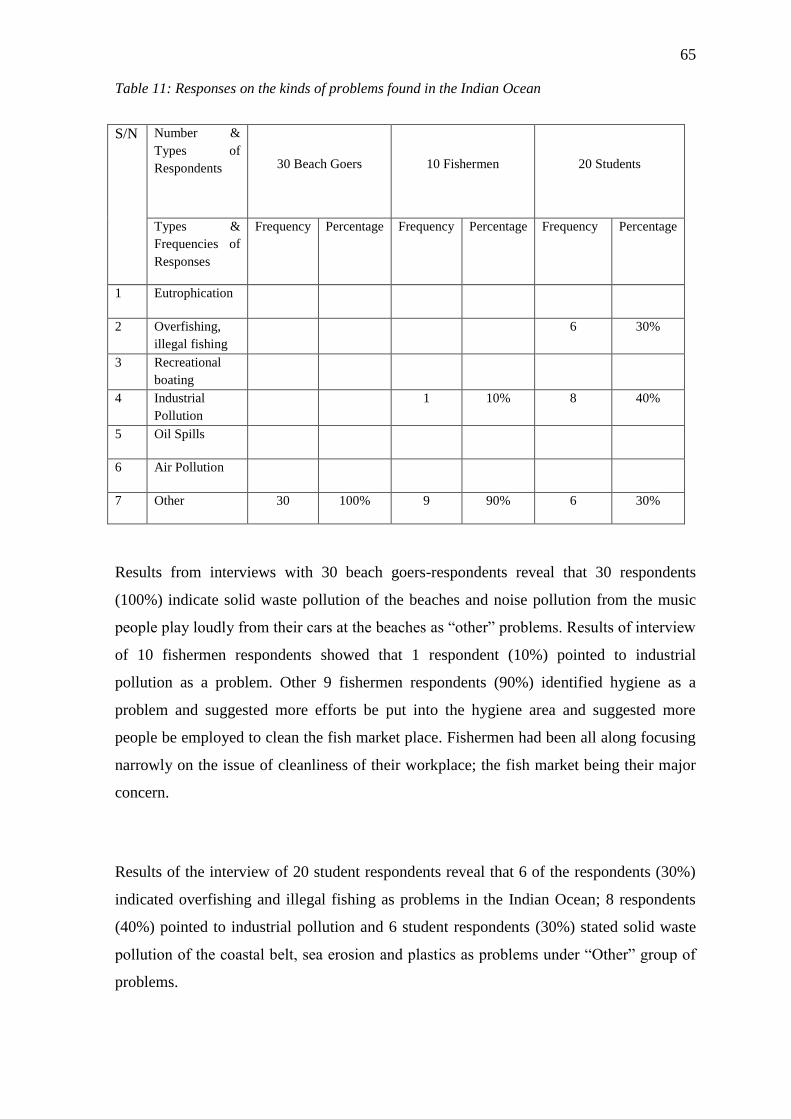
65
Table 11: Responses on the kinds of problems found in the Indian Ocean
S/N Number &
Types of
Respondents
30 Beach Goers
10 Fishermen
20 Students
Types &
Frequencies of
Responses
Frequency Percentage
Frequency Percentage
Frequency Percentage
1 Eutrophication
2 Overfishing,
illegal fishing
6 30%
3 Recreational
boating
4 Industrial
Pollution
1 10% 8 40%
5 Oil Spills
6 Air Pollution
7 Other 30 100% 9 90% 6 30%
Results from interviews with 30 beach goers-respondents reveal that 30 respondents
(100%) indicate solid waste pollution of the beaches and noise pollution from the music
people play loudly from their cars at the beaches as “other” problems. Results of interview
of 10 fishermen respondents showed that 1 respondent (10%) pointed to industrial
pollution as a problem. Other 9 fishermen respondents (90%) identified hygiene as a
problem and suggested more efforts be put into the hygiene area and suggested more
people be employed to clean the fish market place. Fishermen had been all along focusing
narrowly on the issue of cleanliness of their workplace; the fish market being their major
concern.
Results of the interview of 20 student respondents reveal that 6 of the respondents (30%)
indicated overfishing and illegal fishing as problems in the Indian Ocean; 8 respondents
(40%) pointed to industrial pollution and 6 student respondents (30%) stated solid waste
pollution of the coastal belt, sea erosion and plastics as problems under “Other” group of
problems.

66
Question 12: What should be done to improve the situation?
The question was aimed at gathering suggestions from the three groups of Civil Society
(beach goers, fishermen and students) interview respondents on the plans of action which
should be undertaken to improve the situation at the coastline. Four (4) alternative
strategies for improving the Dar-es-Salaam Coastal belt were suggested in the interview
guide: (i) To improve environmental laws and policies, (ii) To increase the amount of
Funds, (iii) Public involvement and (iv) Other. Table 12 summarises the responses to the
question.
Table 12: Responses on what should be done to improve the waste situation in the Indian Ocean
S/N Number &
Types of
Respondents
30 Beach Goers
10 Fishermen
20 Students
Types &
Frequencies
of Responses
Frequency Percentage
Frequency Percentage
Frequency Percentage
1 To improve
environmenta
l laws and
policies
2
10%
2 To increase
the amount
of Funds
3 15%
3 Public
involvement
8 27% 6 30%
4 Other 22 73% 10 100% 9 45%
Interview results of 30 beach goers-respondents reveal that 8 respondents (27%) selected
public involvement strategy to improve the situation. They commented, “It is everyone’s
responsibility to keep the environment clean.” Responses from the remaining 22 beach
goers-respondents (73%) proposed under “Other” group of strategies “to put waste bins
and make cleanliness from time to time.” Responses from all 10 fishermen-respondents
(100%) suggested under “Other” response category that many environmental workers
should get employment and concentrate with this area (the fish market) only, because it is
so sensitive as you see by yourself.”

67
Interview results of 20 students have given these results: Two (2) student respondents
(10%) selected the improvement of environmental laws and policies. They further
elaborated: “People must be educated to know the laws if ever they (do) exist; strict laws
must be formulated.” Three (3) of the student respondents (15%) suggested the increase of
the amount of funds; and 9 (45%) suggested two strategies; to increase police patrols over
illegal fishing and the City Municipalities should clean the environment effectively.
Question 13: How do you value the Indian Ocean? You may rank from 1-5, 1 is the
least important of all and 5 the most important one.
This question intended to find out the extent to which the various groups of civil society
valued the Indian Ocean as an indication of their value attachment to it and their intention
to keep it clean. The respondents were required to state their scores on a five point
valuation scale: 1 to 5 (1 = least important; 5 = most important). Table 13 displays the
responses.
Table 13: The extent the respondents value the Indian Ocean
S/N Rank 1 2 3 4 5 Explanation to the score
Respondent
30 Beach goers x = 5 We value it; that’s why we come here
10 fishermen x = 5 Is the source of our livelihood
20 students x = 5 Because it is the source of employment to some
people(fisher men)
-We recreate here cause there is a very good ocean
breeze
-We get different kinds of Fish from this ocean (source
of food)
All the 30 beach goers respondents (100%) unanimously agreed to award it 5 points and
remarked, “We value it; that’s why we come here.” Also all the 10 fishermen (100%)
together gave it 5 points with a remark, “It is the source of our livelihood.” Similarly, all
the 20 students agreed among themselves to give a 5 point score. They added the
following explanations:-

68
“Because it is the source of employment to some people (fisher men); we get our
recreation here as there is a very good ocean breeze. We get different kinds of fish from
this ocean (source of food).”
Question 15: Do you do something to improve the state of the Ocean?
This question aimed at finding out whether the respondents took the function of improving
the condition of the Indian Ocean as a shared communal responsibility or as the sole
responsibility of the City municipalities? Responses are displayed in Table 14.
Findings from the responses of 30 beach goers reveal that none of them (0%) gave a “Yes”
response to the question. This implies that none of the beach goers did something to
improve the condition of the Indian Ocean.
Table 14: Responses on whether respondents do anything to improve the Indian Ocean.
S/N
Type and
Frequencies of
Responses
Number & Type
of Respondents
Yes
No
Other
Frequency Percentage
Frequency Percentage
Frequency Percentage
1 30 Beach Goers 0 0% 26 87% 4 13%
2 10 Fishermen 10 100% 0 0% 0 0%
3 20 Students 2 10% 18 90% 0 0%
On the state of the Indian Ocean: Twenty six (26) of the beach goers-respondents (87%)
gave a “No” response, specifically meaning that they never did anything to improve the
condition of the ocean. In elaborating their stand they gave they commented: “We only
come here during weekends, how we can do that? There are some people who are paid for
that, why should I bother myself.”
All the 10 fishermen respondents (100%) provided a “Yes” answer to the question. Also
they added these comments: We try to clean whenever we finish our activities over this

69
place, as well as reminding one another about it.” Two (2) student respondents out of 20
(i.e. 20%) gave a “Yes” response but throwing the responsibility to the people who live
outside the City Center- Temeke and Kinondoni Municipalities. Eighteen (18) student
respondents (90%) gave a “No” response with a comment that they could not say anything
without making research on the kind of problem there are in the Indian Ocean.
Question 16: How do you become aware of the problems that exist in the Indian
Ocean particularly in Dar es-Salaam?
This question aimed at finding out the means of communication by which the respondents
usually got informed of the problems of pollution which existed in the Indian Ocean,
particularly in Dar-es-Salaam. This could help in selecting the most efficient and effective
means of communication which could be used to sensitize people regarding solid waste
management issues for the Dar-es-Salaam Coast Belt. Table 15 displays the responses by
respondents.
Table 15: Means through which respondents get informed of what exists in the Ocean
S/N Number & Types
of Respondents
30 Beach Goers
10 Fishermen
20 Students
Types &
Frequencies of
Responses
Frequency Percentage
Frequency Percentage
Frequency Percentage
1 Media/observation 20 67% 10 100% 16 80%
2 Internet
3 Friends 4 13% 10 100%
4 Studies and
observation
4 20 %
5 Other 6 20%
Media observation: Beach Goers: 20 (= 67%): If there are bad weather conditions such as
flooding from the Ocean, we usually get information via media. Four respondents 4 (=
13%) got informed sometimes through friends who tell them not to go to some places
within the beaches because of robbers who disturb visitors. Other 6 (= 20%): Some people
close to us tell them.

70
On the part of fishermen all 10 (= 100%) got informed through the media and observation
and also through friends. Students respondents 16 (80%) got informed through the media
and 4 (20%) through studying and observation.
From those responses the groups respondents from the civil society had different means of
getting information; the media, friends, observation and studying.
11.2 Objective 2: Factors Which Influence Solid Waste Generation, Collection and
their Trends
The purpose of research objective 2 was to explore solid waste generation and solid waste
collection in Dar-es-Salaam City and its Coast Belt (for the period from 1994 to 2007 in
order to) determine their trends. However, a number of issues regarding solid waste
management were explored before making comparison of the waste generation and waste
collection. Therefore, the following interview questions were posed to a number of
respondents: a senior official from the Department of Environment in the Vice President’s
Office, three Environmental Officers from the Dar-es-Salaam Municipalities of
Kinondoni, Ilala and Temeke and respondents of three Civil Society Groups provided. All
provided part of the information used to work out/ process Objective Number 2.
Types of Common Solid Waste in Dar-es-Salaam
Question 1: What are the most common waste does the city municipality generate
(bio wastes, metals, plastics…)?
The purpose of this interview question was to find out from the municipal environmental
officers the types of waste which are generated in the Dar-es-Salaam City. Results from
the environmental officers’ responses indicate the following kinds of waste which are
generated in the Dar-es-Salaam City:-
Bio waste (organic waste), office waste such as papers; metals, plastic bags, plastic bottles,
iron metals, lead, copper waste, used bus tickets and used cell-phone vouchers were the
most common types of waste generated in the municipality according to the responses of
71
the municipal environmental officers. It was further revealed from the interview results
with the municipal environmental experts that food waste accounted for greatest share of
the total solid waste generated in Dar-es-Salaam.
Also data obtained from Dar-es-Salaam City Council records shows the waste
composition in Dar-es Salaam consists mainly of kitchen waste, plastics (bottles and
bags), grass, wood, papers, ceramics and stones, leather and rubber (Table 16).
Table 16: Solid Waste Composition in Dar-es-Salaam
Waste Components Percentage by wet weight (%)
Kitchen waste 39
Grass/wood 10
Papers 8
Ceramic and stones 6
Metals 5
Plastics 16
Glass 2
Leather and rubber 6
Textiles 5
Others 3
Total 100
Source: Dar-es-Salaam City Council, 2014.
Trend of waste generation and collection
Results from the interview with a Senior Officer from the Division of the Environment in
the Vice President’s Office as was asked, “What has been the general situation regarding
waste of Dar- es-Salaam Coastal belt? Is it improving or deteriorating?”
Findings from the interview indicate that waste collection has been improving. The
following were the reasons given: “Because previously the government used to take care
of the waste management in Dar-es-Salaam. Now the new mechanisms used is to hire
private companies in order to take care of the Coastal belt and the environment at large.
Private companies seem to be more effective in doing the job. The regulations concerning
plastic bags were reviewed; right now the plastic bags allowed are the ones which are
more than 30 microns.” Appendix I.

72
A similar question was directed to municipal environmental officers of the Kinondoni,
Ilala and Temeke Dar-es-Salaam Cit Municipalities:”What is the state of the annual waste
generation in the Municipality since 1994? Is it increasing or decreasing?” The data
available and provided on the state and trend of solid waste generation and collection for
the whole city Dar-es-Salaam City was from 1994 to 2007 as shown in Table 17.
Table 17: State of Solid Waste Generation and Collection in Dar-es-Salaam City: 1994 – 2007
S/N Year Generation/Day (Tons) Collection/Day
(Tones)
Percentage (%)
1 1994 1500 185 12
2 1995 1620 230 14
3 1996 1772 260 15
4 1997 1850 300 16
5 1998 1980 380 20
6 1999 2144 454 21
7 2000 2200 354 16
8 2001 2300 476 21
9 2002 2400 719 30
10 2003 2600 792 30
11 2004 3091 849 27.5
12 2005 3156 900 28
13 2006 3350 1207 36
14 2007 3500 1406 40
Source: Dar-es-Salaam City Council, 2014.
The above data on waste generation and collection from year 1994 to 2007 in Dar-es-
Salaam City were analysed statistically with the purpose of obtaining their trends. It could
be observed among other things that there was a linear incremental trend in the daily waste
generation from 1994 to 2007 as it could be observed in figure 15 (a) where the correlation
was found to be highly significant (linear regression, F1, 12 = 322, p = 0.000). This
phenomenon could be attributed to myriads of factors including population growth.

73
Figure 15 (a): Trend of Solid Waste Generation in Dar-es-Salaam City:1994 - 2007
Similar phenomenon was observed in the solid waste collection recorded within the same
period (Figure 15 b) with daily collection increasing on annual basis (linear regression, F1,
12 = 105.6, p = 0.000) with relatively high significant coefficient of determination (R2=90).
Figure 15 (b): Trend of Solid Waste Collection in Dar-es-Salaam City:1994 - 2007
However, management intervention has seen a positive response in the solid waste
collection. As waste generation increases (Figure 15 c) and so does the waste collection
(Figure 15 c) by the municipality where the two variables were found to be highly
correlated (linear regression, F1, 12 = 162.4, p = 0.000) with very high coefficient of
determination (R2=93) as it could be observed from Figure 15 (c).
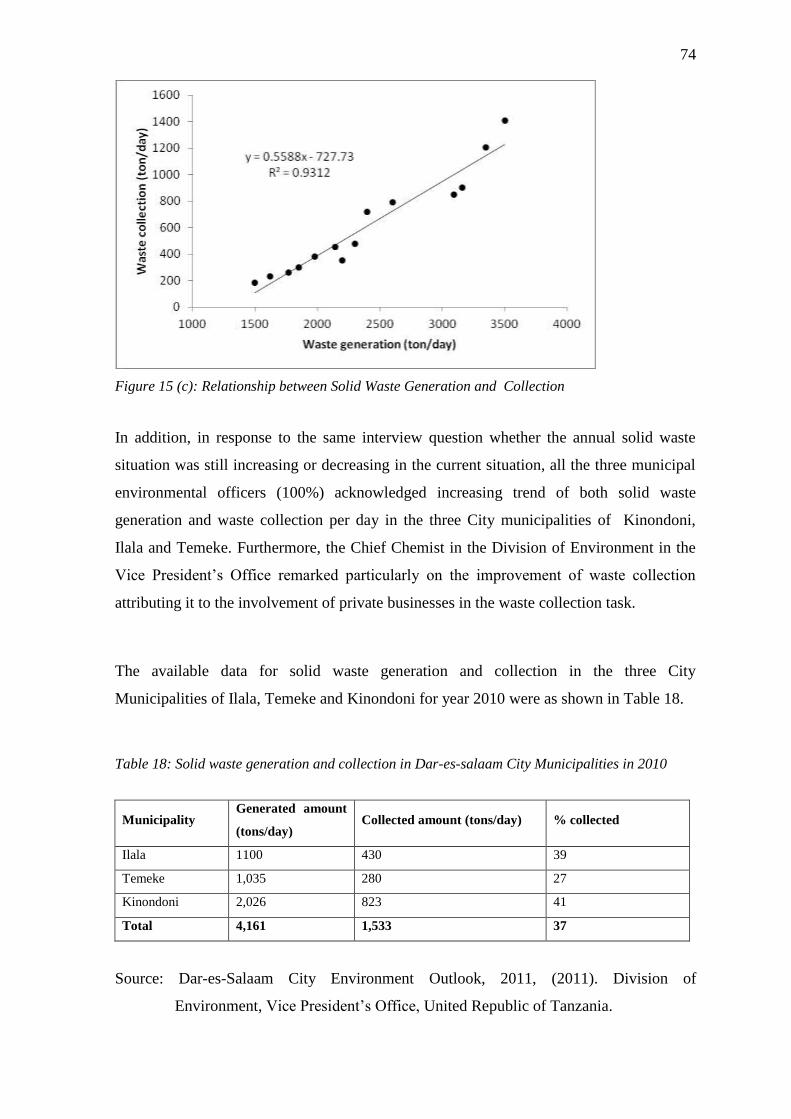
74
Figure 15 (c): Relationship between Solid Waste Generation and Collection
In addition, in response to the same interview question whether the annual solid waste
situation was still increasing or decreasing in the current situation, all the three municipal
environmental officers (100%) acknowledged increasing trend of both solid waste
generation and waste collection per day in the three City municipalities of Kinondoni,
Ilala and Temeke. Furthermore, the Chief Chemist in the Division of Environment in the
Vice President’s Office remarked particularly on the improvement of waste collection
attributing it to the involvement of private businesses in the waste collection task.
The available data for solid waste generation and collection in the three City
Municipalities of Ilala, Temeke and Kinondoni for year 2010 were as shown in Table 18.
Table 18: Solid waste generation and collection in Dar-es-salaam City Municipalities in 2010
Municipality Generated amount
(tons/day) Collected amount (tons/day) % collected
Ilala 1100 430 39
Temeke 1,035 280 27
Kinondoni 2,026 823 41
Total 4,161 1,533 37
Source: Dar-es-Salaam City Environment Outlook, 2011, (2011). Division of
Environment, Vice President’s Office, United Republic of Tanzania.

75
From the data in Table 18 one finds that among the three Dar-es-Salaam City
municipalities, Kinondoni generates the greatest amounts of solid wastes per day, followed
by Ilala and the least by Temeke Municipality.
11.3 Factors affecting solid waste generation and collection in Dar-es-Salaam
Municipalities
Results from the interviews with the official from the Division of Environment in the Vice
President’s Office, the Municipal Environmental Officers and one Civil Based
Organization dealing with waste collection in revealed a number of factors which directly
influence solid waste generation and collection in the City of Dar-es-Salaam. The
following are the major ones:-
(i) High population and population growth rate.
From the research results obtained the first municipality in the generation of largest
amounts of solid wastes is Kinondoni, the second is Temeke, and last is Ilala (Table 18).
One of the factors influencing the amount of waste generated is size of population within
the municipality. The higher the population in the municipality the greater the amount of
waste generated; this is because of the relatively greater economic, human and social
activities in a municipality with higher population. Relate Table 1 and Table 18.
(ii) Another reason that was given as a factor affecting solid waste collection was the state
of city physical planning. Where city planning is poor as the case is of Temeke and
Kinondoni municipalities compared to Ilala Municipality, collection is also relatively
poor. The situation is made worse by big sizes of Kinondoni and Temeke municipalities as
they generate more waste. Ilala Municipality is smaller, well planned and is within the
City centre where there are offices, ministries, shops, schools, colleges good restaurants
and hotels which are better and more efficiently served by waste collection companies.
(iii) Unplanned settlements which have grown as squatter areas
Dar-es-Salaam has many unplanned settlements with very high population density and
lack infrastructure such as roads and sewage systems. Waste collectors find it difficult to
access unplanned settlements (squatters) with trucks when collecting waste. Figure 16.

76
Figure 16: Squatter area at Buguruni Kwa Mnyamani in Ilala Municipality, Dar-es-Salaam.
Photo: John Maziku November 2013.
(iv) Shortage of facilities for waste management collection such as vehicles, waste
containers.
Municipal environmental Officers and waste collection Civil based organizations
personnel revealed there was inadequate equipment for solid waste collection such as
vehicles, motor bikes with trailers. Instead they used inefficient equipment such as hand-
drawn carts (mikokoteni). Figure 17.
Figure 17: Hand-drawn carts at Buguruni Malapa waste collection point, Ilala Municipality, Dar-
es-Salaam. Photo: John Maziku November 2013.
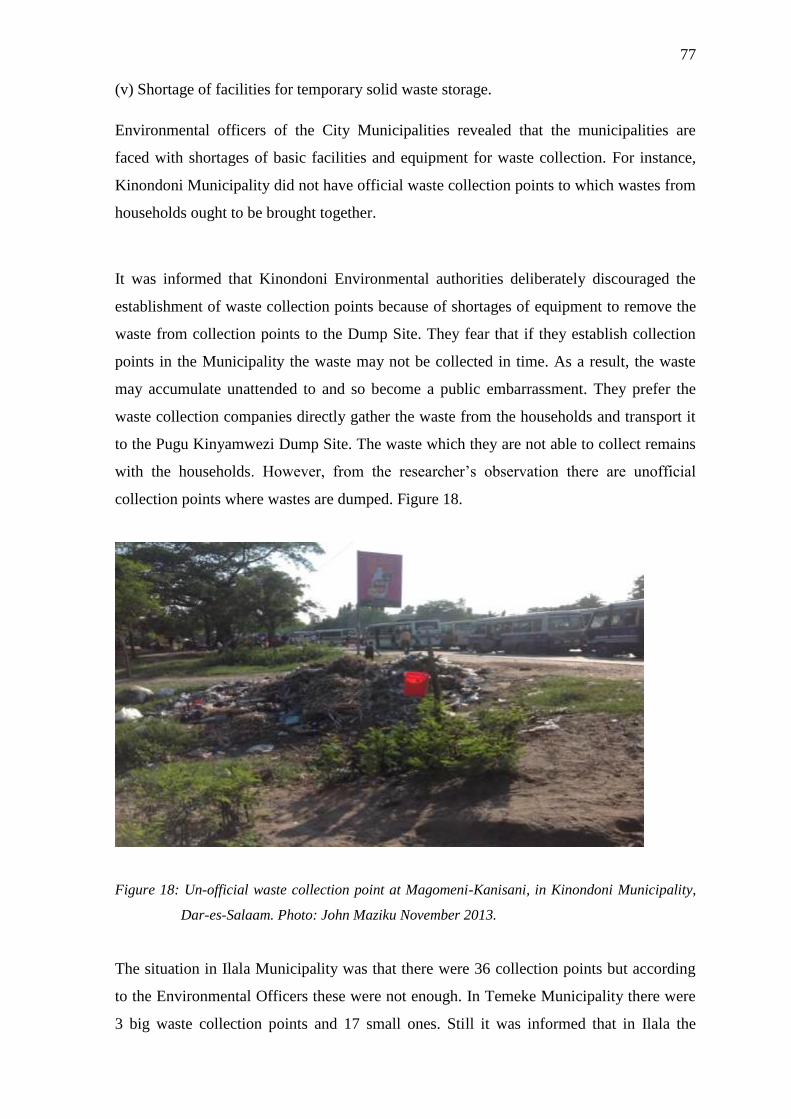
77
(v) Shortage of facilities for temporary solid waste storage.
Environmental officers of the City Municipalities revealed that the municipalities are
faced with shortages of basic facilities and equipment for waste collection. For instance,
Kinondoni Municipality did not have official waste collection points to which wastes from
households ought to be brought together.
It was informed that Kinondoni Environmental authorities deliberately discouraged the
establishment of waste collection points because of shortages of equipment to remove the
waste from collection points to the Dump Site. They fear that if they establish collection
points in the Municipality the waste may not be collected in time. As a result, the waste
may accumulate unattended to and so become a public embarrassment. They prefer the
waste collection companies directly gather the waste from the households and transport it
to the Pugu Kinyamwezi Dump Site. The waste which they are not able to collect remains
with the households. However, from the researcher’s observation there are unofficial
collection points where wastes are dumped. Figure 18.
Figure 18: Un-official waste collection point at Magomeni-Kanisani, in Kinondoni Municipality,
Dar-es-Salaam. Photo: John Maziku November 2013.
The situation in Ilala Municipality was that there were 36 collection points but according
to the Environmental Officers these were not enough. In Temeke Municipality there were
3 big waste collection points and 17 small ones. Still it was informed that in Ilala the

78
collection points were not sufficient compared to people´s needs. This limited the ability
of was collection. A smaller amount of waste could only be collected for final disposal.
(vi) Reluctance of community members to pay waste management fees
It was informed by the Municipal environmental officers that people in the municipalities
were reluctant to pay fee for waste collection services. This situation was worsened by
local politicians who encouraged their voters not to pay in order to gain popularity.
Similar results were obtained from one Head of a Civil Society Organization dealing with
waste collection whose response to my interview question regarding factors which are
hindering them from performing their waste collection tasks. He itemizes them as:
”- poor city planning squatter areas;
- people don’t want to pay the collection fees;
- political interference from councillors;
- people do discharge wastes into drains; and
- luck of funds.”
(vii) Lack of waste bins in the City.
The respondents from the Civil society groups complained that there were no waste bins at
the beach and throughout the city. The absence of waste bins encouraged littering in the
streets and at the beaches. The researcher also had similar observation.
Figure 19: Beach at Ocean Road area, in Dar-es-Salaam without any waste bins. Photo:
John Maziku November 2013.
79
(viii) Lack of community awareness on environmental management.
It was also revealed by the Municipal Environmental Officers that community awareness
was lacking among many people in the city about cleanliness.
(ix) Lack of Law Enforcement.
It was revealed from the findings that the Municipality authorities did not enforce the by-
laws on waste management. People were not obliged to comply; this was exacerbated by
political interference where by local municipal and ward politicians discouraged their
voters not to pay for the waste collection fees to the waste collectors.
(x) Lack of Motivation within Waste Collection Companies.
It was revealed from some employees of some waste collection companies that employees
were paid very low wages per month which could not adequately support them and their
families. Also the waste collectors were not given waste collection equipment and
protective facilities such as hand gloves and gum boots. This discouraged them. One of the
waste collectors remarked this: “Low wages, you can imagine I receive only Tsh
100,000/= per month, I do this job because I have no alternative. Another waste collector
said this: “We are not well equipped in order to protect ourselves against diseases; we are
told to change our names every month in order to be seen as new employees who are on
probation period. The guys are just avoiding Tanzanian law which says after sixth months
at work you should get permanent employment.” Appendix IV.
Another worker remarked: “I normally choose any available job to do, but we don’t get
any motivation; it’s really discouraging for sure, we don’t have zeal to do this job at all,
because of that.”
Volume of Waste Collected per day in the Coastal Belt
The Municipal Environmental Officers were asked to respond to question 8: What are the
total volumes of waste generated per day in the coastal belt in your municipality?
Appendix II.
80
One Municipal Environmental Officer from one Municipality declared that he did not
know the amount of waste generated per day in the coastal belt of the municipality. As a
result he remarked that this was a challenge. A second municipal environmental officer
from another municipality responded that it was difficult to know because they did not
separate the waste collected from the Coastal Belt from that collected from other areas. A
third municipal environmental officer acknowledged that they did not have separate data
regarding waste collected in the coastal belt because the solid waste collection contractors
within their municipality collected waste together without separating the waste from the
specific areas of origin. Hence as a whole all the 3 (100%) Municipal Environmental
Officers of three Dar-es-Salaam City Municipalities declared that they did not keep
separately the solid waste data for their respective coastal belts.
Sources of Solid Waste in the Coastal Belt
The Municipal Environmental Officers were also asked whether they knew about the
sources of the waste in their coastal belts municipalities, all three (100%) stated similar
sources: household (domestic) waste street waste, institutional (office) waste (papers),
industrial waste, market waste, such as the Bank of Tanzania (paper waste), market waste
e.g. Buguruni Market, fish market and other markets from other areas within the City.
Largest Kinds of Solid Waste within the Dar-es-Salaam Coast Belt
Results from responses by the three Municipal Environmental Officers to the interview
question, “What kinds of waste are the largest of all within the coast line in your
municipality?” were very similar. One environmental officer mentioned specifically
plastic bags as largest kind of waste in the coast line. The second environmental officer
identified four type of waste that are found in large quantities; organic waste (bio waste),
plastic bottles with their covers, plastic bags, some kinds of papers and cans. The third
environmental officer stated similar kinds of waste found in his municipality coastal belt
particularly at the beaches, namely domestic and industrial solid waste such as plastic
bottles and cans, plastic bags and pieces of trees. Figure 20.

81
Figure 20: A mixture of waste swept on the Ocean Road Beach, Dar-es-Salaam.
Photo: John Maziku November 2013.
Largest Polluter in the Dar-es-Salaam Coastal Belt
The three municipal officers were asked the question “Who is the greatest polluter in the
coast belt within your municipality?” Results from their responses indicate that rivers
which discharge their water in the Indian Ocean are the largest polluters of the coast line.
Also from the researcher’s observations pollution of the coast line from the river
discharges is highest during rainy season when there are floods in the streets causing
wastes to be drifted into the drains and rivers and finally are deposited into the coast line.
Results from the researcher’s observations at the Dar-es-Salaam beaches plastic bags,
plastic water and soft drink bottles, soft drink cans and paper packaging materials are
found scattered all over the place particularly in some public beaches especially during
weekends when there are a lot of visitors who come for recreation. The situation is made
worse with the absence of waste bins on the beaches thus making pollution inevitable.
Organisation of Collection and Disposal of Solid Waste in Dar-Es-Salaam
Response results from the Municipal Environmental Officers to the interview question,
“How do you collect these waste, are they sorted or mixed together?” provided the
following information regarding collection and disposal of solid wastes in the three Dar-
es-Salaam City municipalities of Kinondoni, Ilala and Temeke:-
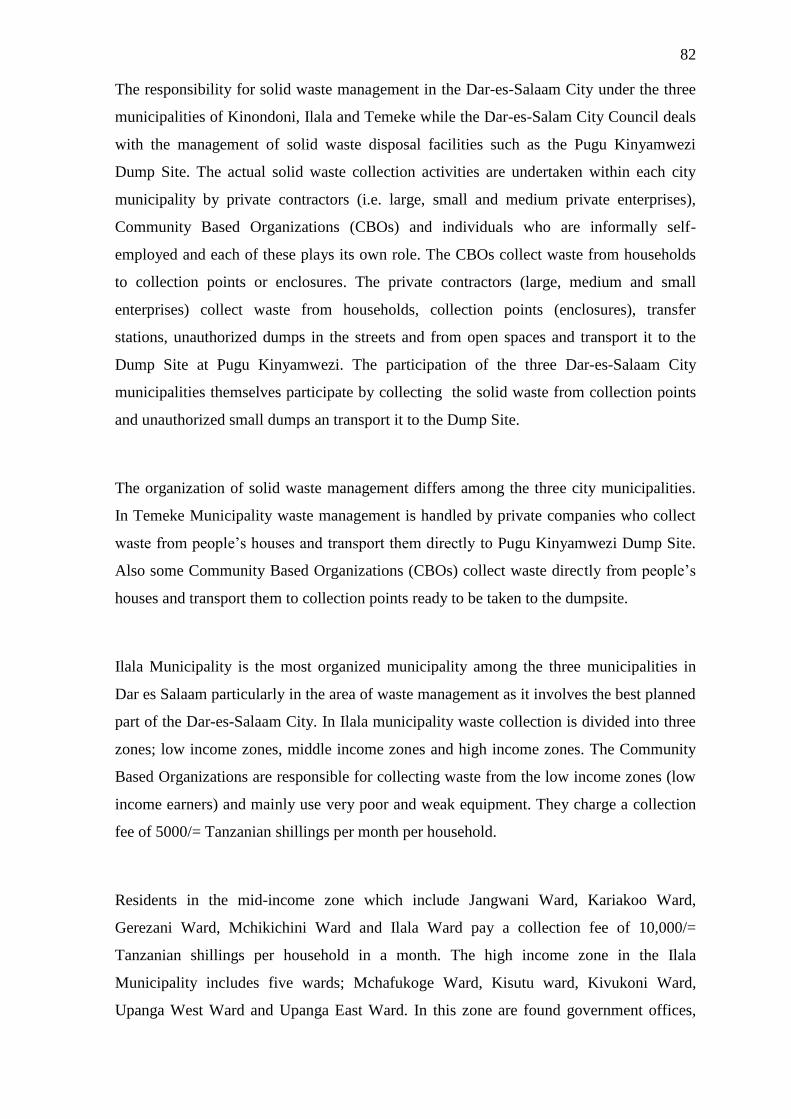
82
The responsibility for solid waste management in the Dar-es-Salaam City under the three
municipalities of Kinondoni, Ilala and Temeke while the Dar-es-Salam City Council deals
with the management of solid waste disposal facilities such as the Pugu Kinyamwezi
Dump Site. The actual solid waste collection activities are undertaken within each city
municipality by private contractors (i.e. large, small and medium private enterprises),
Community Based Organizations (CBOs) and individuals who are informally self-
employed and each of these plays its own role. The CBOs collect waste from households
to collection points or enclosures. The private contractors (large, medium and small
enterprises) collect waste from households, collection points (enclosures), transfer
stations, unauthorized dumps in the streets and from open spaces and transport it to the
Dump Site at Pugu Kinyamwezi. The participation of the three Dar-es-Salaam City
municipalities themselves participate by collecting the solid waste from collection points
and unauthorized small dumps an transport it to the Dump Site.
The organization of solid waste management differs among the three city municipalities.
In Temeke Municipality waste management is handled by private companies who collect
waste from people’s houses and transport them directly to Pugu Kinyamwezi Dump Site.
Also some Community Based Organizations (CBOs) collect waste directly from people’s
houses and transport them to collection points ready to be taken to the dumpsite.
Ilala Municipality is the most organized municipality among the three municipalities in
Dar es Salaam particularly in the area of waste management as it involves the best planned
part of the Dar-es-Salaam City. In Ilala municipality waste collection is divided into three
zones; low income zones, middle income zones and high income zones. The Community
Based Organizations are responsible for collecting waste from the low income zones (low
income earners) and mainly use very poor and weak equipment. They charge a collection
fee of 5000/= Tanzanian shillings per month per household.
Residents in the mid-income zone which include Jangwani Ward, Kariakoo Ward,
Gerezani Ward, Mchikichini Ward and Ilala Ward pay a collection fee of 10,000/=
Tanzanian shillings per household in a month. The high income zone in the Ilala
Municipality includes five wards; Mchafukoge Ward, Kisutu ward, Kivukoni Ward,
Upanga West Ward and Upanga East Ward. In this zone are found government offices,
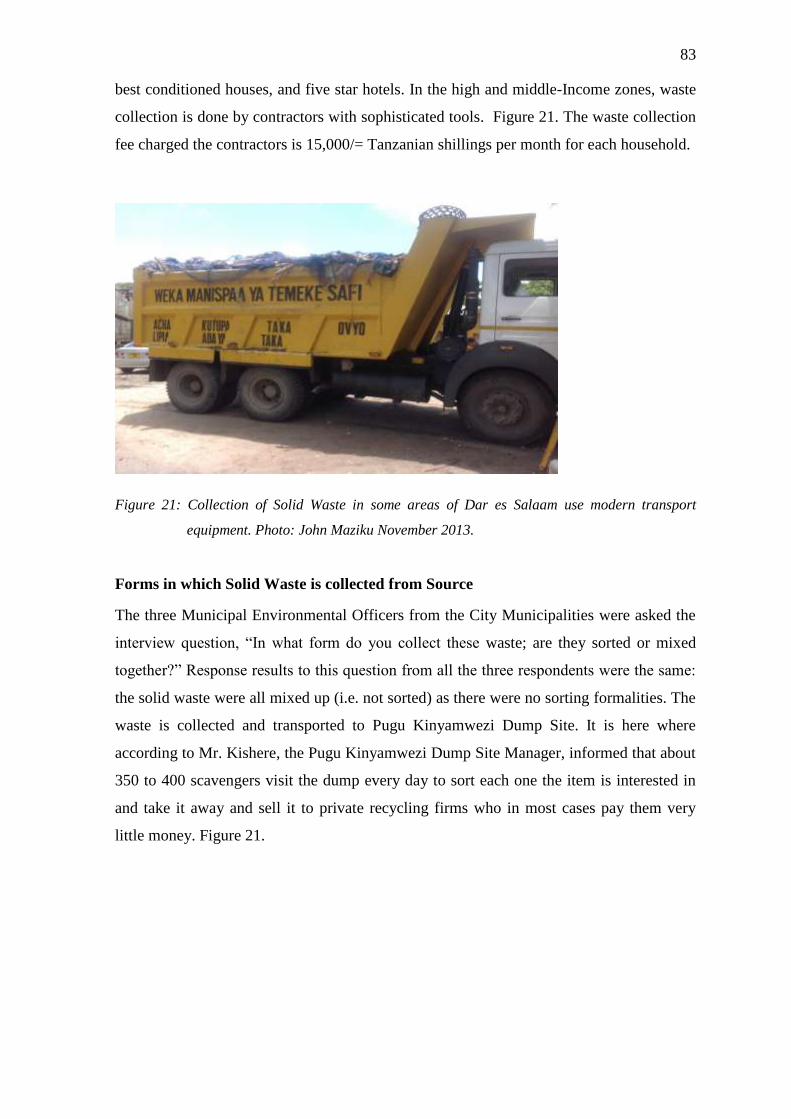
83
best conditioned houses, and five star hotels. In the high and middle-Income zones, waste
collection is done by contractors with sophisticated tools. Figure 21. The waste collection
fee charged the contractors is 15,000/= Tanzanian shillings per month for each household.
Figure 21: Collection of Solid Waste in some areas of Dar es Salaam use modern transport
equipment. Photo: John Maziku November 2013.
Forms in which Solid Waste is collected from Source
The three Municipal Environmental Officers from the City Municipalities were asked the
interview question, “In what form do you collect these waste; are they sorted or mixed
together?” Response results to this question from all the three respondents were the same:
the solid waste were all mixed up (i.e. not sorted) as there were no sorting formalities. The
waste is collected and transported to Pugu Kinyamwezi Dump Site. It is here where
according to Mr. Kishere, the Pugu Kinyamwezi Dump Site Manager, informed that about
350 to 400 scavengers visit the dump every day to sort each one the item is interested in
and take it away and sell it to private recycling firms who in most cases pay them very
little money. Figure 21.
84
Figure 22: Scavengers at Pugu Kinyamwezi Dumpsite, Dar-es-Salaam. Photo: John Maziku
November, 2013.
Recycling Policy
Do you have any recycling policy, or recycling system which helps a bit to deal with
wastes? For example:- Plastic bottles, cans etc. If no, do you have a master plan to put it
down?
Interview responses from Mrs. Kisanga, Principal Chemist in the Division of Environment
in the Vice President’s Office clearly reveal that there was no recycling policy in Tanzania
though the Ministry fully supported the recycling system hundred percent under the
Sustainable Industrial Development Policy.
Also in response to the question, “Are there some waste re -use strategies currently being
implemented such as composting?” According to the Kinondoni Municipal Environmental
Officer, they had a plan which was expected to start by January 2014 with the help of
Belgium technical cooperation. Ilala Municipality did not have such a plan but they
already had two composting stations; one at Gongo la Mboto known as Kikuta Waste
Management Station; and a second one at Buguruni Malapa waste collection site under the
assistance of Bremen Overseas Research and Development Association. The Ilala
Environmental officer also informed that in their Municipalities there are small recycling
businesses undertaken by individual entrepreneurs who re-use old car tires for making

85
slippers, sandals, mats for cleaning feet; and make use of tin, or metal related materials
for making oil lamps known as ”vibatari.”.
12. Discussion
Objective 1: To Find Out People’s Awareness of Solid Waste Management and its
Significance to the Dar-es-Salaam City Coastal Belt and its
Environment at Large.
The results obtained from this study about people’s awareness of solid waste management
and the effects of waste are divided into two parts. On one hand the results from
environmental experts (respondents) i.e. the Principal Chemist in the Division of
Environment in the Vice President’s Office and the Municipal Environmental Officers
informed that there was inadequate awareness among the City community about
environmental and waste management and side effects of waste. To illustrate this point it
was pointed out that people throw their food leftovers and peelings into the drains and
eventually block the drains and when it rains and this causes roads to flood with water
from the drains. Also partly due to lack of awareness many inhabitants of Ilala
Municipality have their latrines pipes connected such that they discharge their liquid
wastes into the Msimbazi River. Finally, the river discharge it´s water into the Indian
Ocean and thus polluting it to affect human health and the aquatic animals and plants.
On the other hand, a somewhat different picture regarding the awareness of the people of
Dar-es-Salaam regarding solid waste management and the effects of waste is given by the
results obtained from the three groups of civil society which frequently spent a good
amount of time at the beach and or in the Indian Ocean. These are the beach goers,
fishermen and students. There are several aspects of awareness regarding solid waste
management about which interview results were obtained.
(i) Experience with problems associated with waste
Seventy three (73%) of the beach goers had experienced problems with waste that it
causes diseases such as cholera and typhoid. Sixty per cent (60%) of the fishermen
respondents also agreed they had experienced health problems due to waste.

86
(ii) Awareness regarding how satisfactory the waste management services provided
by City municipalities
The results reveal that sixty three per cent (63%) of the beach goers and 85% of the
student respondents were not satisfied because both did not see anybody clean the beach
and as a result there were a lot of waste in the form of plastic bottles and plastic bags
scattered all over the beach. Even the 33% of the fishermen and 15% of the students who
expressed to have been satisfied with the waste management services of the municipality
in the end they remarked that whatever efforts the municipality made to clean the beach,
all the same at the end of the day there was a lot of solid waste scattered all over the place.
The major reason they gave was the absence of waste bins. This joins the group which
expressed to be satisfied with the unsatisfied group.
However, the fishermen were different because all of them (100%) responded to be
satisfied with the services provided by the municipalities. The reality is that the fishermen
viewed the issue of waste management services very narrowly; in terms of availability of
water to wash the fish they catch and to clean the toilets at the Kivukoni Fish Market. But
according to the researcher’s observation there was a lot of solid waste piled up which was
mixed with water at the fish market. But this did not bother the fishermen.
(iii) Action taken by those who were not satisfied with the waste management
services to reduce the waste problem
The question behind intended to find out the awareness of the Civil Society groups of their
responsibility to share in improving the quality of solid waste management on the coast
belt with the Municipalities.
Response results reveal that 23% of the beach goers, 60% of the student respondents and
100% of the fishermen all tried not to pollute the environment whenever they were at the
beach/sea side. However, the fishermen had a narrow perception of the waste problem
taking merely the handling of the fish intestines which they always threw away the fish
intestines back into the sea. Thirty five percent (35%) of the student respondents tried not
to pollute the environment but they also remarked about the absence of waste bins. On the
87
other hand 77% of the beach goers expressed they were compelled to pollute the
environment because there were no waste bins.
It can be generalised therefore that the civil society particularly students and beach goers
were aware of their responsibility of keeping the environment (the beach) clean. This may
indicate the level of education of the beach goers and students is relatively high enough.
The fishermen are usually relatively less educated hence less aware of situations.
(iv) Awareness of where one is supposed to put one’s waste
The question behind was to find out whether the respondents were aware of where they
were supposed to put the waste they generated. Response results revealed that 100% of the
beach goers and 100% of the students knew that they were supposed to keep their waste in
waste bins but they remarked that there were no waste bins at the beach and in the entire
City. Although the response result from the fishermen indicated that all of them (i.e.
100%) were aware of where they were supposed to put their waste, they had a very narrow
perception of waste. The fishermen regarded waste only the fish intestines which they
removed from the fish they caught and the place where they were supposed to put those
intestine was to throw them back into the ocean. The reason for such narrow perception of
waste management could have been due to low level of education. Usually fishermen are
relatively of low education.
(v) Awareness of where one’s waste ends after being discharged into the drains
This question was intended to find out whether the respondents were aware where the
waste finally ended after being discharged into the drains. From the interview results it has
been revealed that 87% of the beach goers, 95% of the students and 100% of the fishermen
were aware that the waste blocks the drainage system and makes the water overflow
during rainy season causing floods into the City roads and some of it is carried down into
the beaches and into the ocean. On the Dar-es-Salaam beaches the wastes washed into the
ocean are clearly seen as they are scattered all over.
(vi) Reasons for continuing to experience the waste problems in Dar-es-Salaam City
Awareness of the reasons for continuing to experience the waste problems in our Dar-es-
Salaam can be a step toward finding solution for improving the situation. A hundred per

88
cent (100%) of the beach goers and 100% of the student respondents pointed to the
absence of waste bins at the beach and in the whole city being the main reason for the
continued presence of the problem of waste in Dar-es-Salaam City. The behavior of the
people of dumping solid wastes along road sides and in flood drains and rivers is another
cause.
(vii) Awareness of the functioning of waste management in the City municipalities
The issue here was to find out whether the three groups of the civil society were aware of
how the waste management in the city municipalities functioned.
According to the results obtained 90% of the beach goers and 80% of the students
respondents declared they did not know how waste management system functioned in the
Dar-es-Salaam City Municipalities. This implies that the lack of awareness of how waste
management functioned is a big weakness to the system. If the waste management system
is to function effectively every individual in the municipality is supposed to know it and
fully participate in the activities such as gathering and storing the waste into bags ready for
collection and providing payment for the waste management services.
(viii) Awareness of whether the solid waste brings any harm to the aquatic animals or
plants
Response results from the civil society groups reveal that 60% of the fishermen
respondents expressed incomplete awareness as they only accepted that the waste harmed
the aquatic animals and plants but they did not know how. Ninety three (93%) of the beach
goers denied that the waste did cause any harm to the animals and plants. They explained
their answer by saying that all the waste which is swept into the ocean eventually is
thrown out by the ocean because the ocean does not accept any solid waste. All the student
respondents (100%) expressed that waste had a number of harmful effects; they kill the
fish especially when fish eat plastic bags; they disturb the fish, destroy the beauty of the
beaches, animal habitats disappear and they can block boat engines. This observation by
the student respondents is in line with what was recognized by the Abidjan and Nairobi
Conventions as reported by Mbuya (2009) that solid waste dumped into the ocean ruins
coastal habitats, kills biodiversity, endangers navigation and negatively affects tourism
and recreation.

89
Objective 2: To Find Out Factors Influencing Solid Waste Generation and Collection
and their Trends in the Dar-es-Salaam City Coastal Belt and Its
Environment
(i) Types of Common Solid Waste in Dar-es-Salaam City
The research results identified 10 common types of solid waste found in the Dar-es-
Salaam municipality with the four ranking topmost in percentages wet weight being
kitchen waste (39%), plastics (16%), glass/wood (10%) and papers (8%). It was revealed
from the interviews results with environmental experts from the municipalities that food
waste took the greatest share of the total waste in Dar-es-Salaam and even in other towns
and municipalities in Tanzania. The reason given was that people were not cost conscious
with food and they did not have refrigerators to preserve their food. Plastics take the
second place mainly because much of the containers to hold soft drinks, cosmetics and
different types of containers such as buckets and plastic bags add to the problem of solid
waste as they get disposed.
(ii) Solid waste generation and waste collection
Solid waste generation in Dar-es-Salaam City has been increasing year after year in terms
of tons per day (as shown in Table 3). Figure 2 (a) also illustrates the rising trend of the
solid waste generation in Dar-es-Salaam from 1994 to 2007.
Solid waste collection in the Dar-es-Salaam city has also been increasing year after year
(Table 3 and Figure 2 (b) illustrate). Even though solid waste generation and collection
from 2008 to 2013 were not available from the City municipalities still some reliable
observations can be made based on the available data.. However, comparing the daily
solid waste generation and solid waste collection, daily waste collection does not keep
pace with generation. A smaller percentage of solid is collected daily.
(iii) Solid waste generation and waste collection in the three Dar-es-Salaam City
Municipalities
Solid waste management in the City of Dar-es-Salaam is the responsibility of the three
municipalities of Kinondoni, Ilala and Temeke. From the research results obtained the first

90
municipality in the generation of largest amounts of solid waste is Kinondoni, the second
is Temeke, and last is Ilala (Table 4). The reason is the population density within the first
two municipalities is higher than the last one, Ilala (Table 1). Another reason which was
given is the City planning of the Temeke and Kinondoni is poor physical planning
compared to Ilala Municipality. Ilala Municipality is small and well planned and is within
the City center where there are offices, ministries, shops, schools, colleges and good
restaurants and hotels.
(iv) Constraints of Solid Waste Collection in Dar-es-Salaam Municipalities
From the results it has been revealed that solid waste collection in the Dar-es-Salaam
municipalities is faced with many challenges. Although daily solid waste collection
increases year after year, it does not cope with the increased amounts of daily waste
generation (Table 3 and Table 4). The following are the main challenges which hinder
effective solid waste generation:-
(a) Shortage and lack of waste management facilities and equipment. Interview results
have revealed that facilities such as vehicles and waste containers are in short supply
making the entire waste management activity inefficient and ineffective to undertake
leaving most of the waste uncollected daily.
(b) Lack of waste bins in the entire City up to the coastal beaches where people could
deposit their waste and easily be collected. Results from groups of Civil Society Groups
interviewed, beach goers and students complained of the absence of waste bins at the
beaches and throughout the City of Dar-es-Salaam. They reported to have failed to find a
place to deposit their waste and often times in desperation some were forced to through
away their wastes and pollute the environment.
(c) Dar-es- Salaam city has unplanned settlements which have grown as squatters areas
with high population density and lack of infrastructure. Dar-es-Salaam has an average
annual population growth rate of 5.6% and a population density of compared to the
National average population annual growth rate of 2.7% and a population density of 3,133
persons per square kilometre - highest in the country in 2012 in relation to the overall
average in 2012 country population density of 51 persons per square kilometre (2012

91
Tanzania Population and Housing Census). This makes collection of waste very difficult
as many of the settlements are not easily accessible.
(d) According to the results obtained from both the environmental officers and the daily
collection rate is low is also due to the reluctance of community members to paying waste
management fees to the for waste collection services. This is because of low awareness
and lack of willingness to pay the set fees for waste collection services.
(e) Political interference by local politicians to maintain political influence. There is
political interference from councillors who are siding with people who do not want to pay
collection fees claiming that it is too expensive to afford.
(f) Lack of community awareness on environmental management. There is low
community awareness on environmental management on environmental cleanliness and
communal responsibility. According to the results obtained from the environmental
officers, community awareness was lacking in Dar-es-Salaam. However, the results from
the beach goers and students, this is a little different. The respondents showed good
awareness. The reason could be because of their relatively higher level of education.
(g) Poor city planning and infrastructures are among the obstacles to the real
environmental development. Due to poor city planning people build their settlements
anyhow such that they create squatter areas. It is difficult to collect waste from such areas.
People also build their houses in wetlands such as the Jangwani area in Dar –es Salaam
where it is impossible to collect waste.
(h) Absence of separate data for waste generation and waste collection in the coastal belt.
Interview results obtained from the municipal environmental officials revealed that even
though each City Municipality was responsible for solid waste management within its
specific part of the Dar-es-Salaam Coastal Belt there has not been any data available for
this important component of the City environment. The waste collection companies do not
separate the waste collected from the coastal areas with that from other areas of the city.
They mix it up and transport it to the Pugu Kinyamwezi Dump Site. This is a challenge for
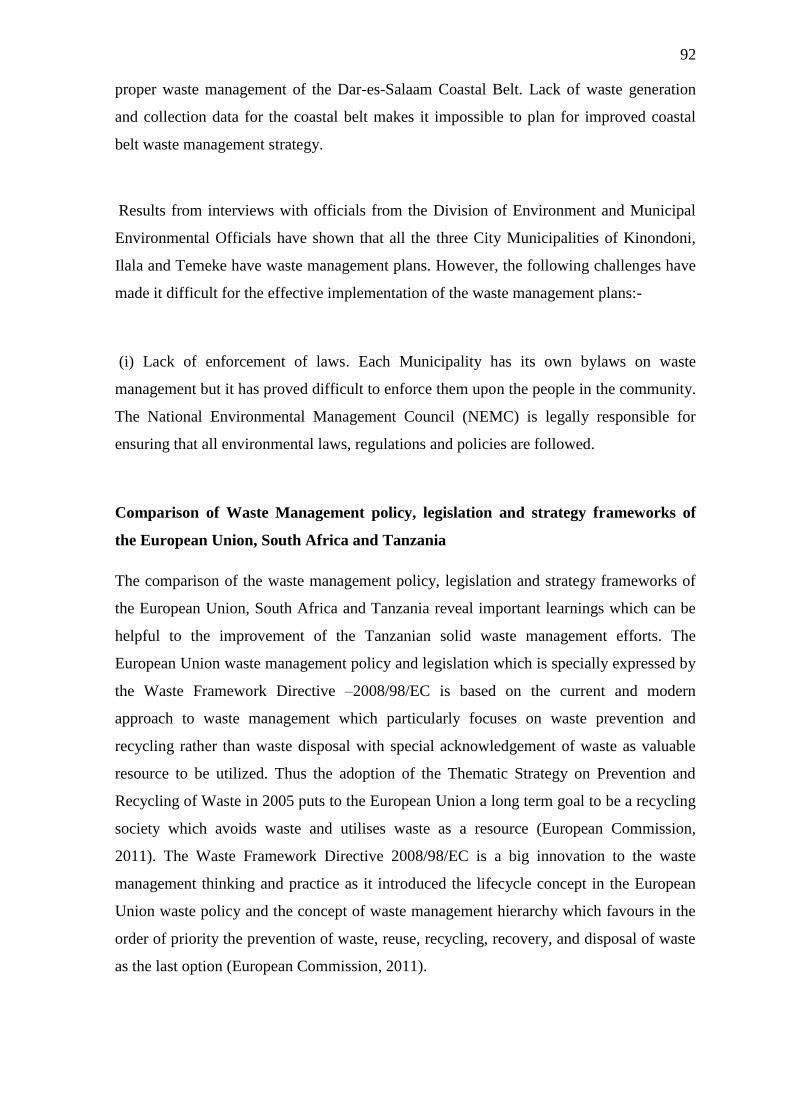
92
proper waste management of the Dar-es-Salaam Coastal Belt. Lack of waste generation
and collection data for the coastal belt makes it impossible to plan for improved coastal
belt waste management strategy.
Results from interviews with officials from the Division of Environment and Municipal
Environmental Officials have shown that all the three City Municipalities of Kinondoni,
Ilala and Temeke have waste management plans. However, the following challenges have
made it difficult for the effective implementation of the waste management plans:-
(i) Lack of enforcement of laws. Each Municipality has its own bylaws on waste
management but it has proved difficult to enforce them upon the people in the community.
The National Environmental Management Council (NEMC) is legally responsible for
ensuring that all environmental laws, regulations and policies are followed.
Comparison of Waste Management policy, legislation and strategy frameworks of
the European Union, South Africa and Tanzania
The comparison of the waste management policy, legislation and strategy frameworks of
the European Union, South Africa and Tanzania reveal important learnings which can be
helpful to the improvement of the Tanzanian solid waste management efforts. The
European Union waste management policy and legislation which is specially expressed by
the Waste Framework Directive –2008/98/EC is based on the current and modern
approach to waste management which particularly focuses on waste prevention and
recycling rather than waste disposal with special acknowledgement of waste as valuable
resource to be utilized. Thus the adoption of the Thematic Strategy on Prevention and
Recycling of Waste in 2005 puts to the European Union a long term goal to be a recycling
society which avoids waste and utilises waste as a resource (European Commission,
2011). The Waste Framework Directive 2008/98/EC is a big innovation to the waste
management thinking and practice as it introduced the lifecycle concept in the European
Union waste policy and the concept of waste management hierarchy which favours in the
order of priority the prevention of waste, reuse, recycling, recovery, and disposal of waste
as the last option (European Commission, 2011).

93
The European Union through the Waste Framework Directive has set up specific
provisions in the legislation which aim at maximizing waste prevention efforts within each
individual EU member states’ waste prevention programmes. Furthermore, The Waste
Framework Directive established minimum standards for recycling activities in the
member states, sets collection reuse, recycling and recovery targets and these are often
reviewed and revised (European Commission, 2011).
Through the application of targets to the Landfill Directive substantial waste in particular
bio waste has been recovered from land fill to recycling. All these efforts have
encouraged the development of reuse markets, recycling and energy recovery industries.
The waste management policy and legislation of the European Union have resulted in
considerable stabilization of waste generation and has resulted in the reduction of the
impacts of waste on people’s health and environment. Also the waste management policy
and legislation have resulted into an increase in the availability of raw materials through
material recovery and sustained waste management and recycling industries (European
Commission, 2011).
On the other hand the South African waste management policy and legislation framework
has similar features of the waste management policy and legislation framework of the
European Union. To start with the Environmental Management Policy for South Africa,
1998; this is the framework policy that governs and guides all government institutions in
formulating specific subsidiary and sectoral policies and strategies in all matters dealing
with day to day management of the environment and provides a number of principles, and
strategic goals which are necessary to ensure the environmental policy is realized. It is
interesting to learn that the Environmental Management Policy for South Africa, 1998
promotes the hierarchy of waste management practices such as reduction of waste at
source, re-use and recycling with safe disposal as the last resort just as is included in the
Waste Framework Directive of the European Union.
Also there is the National Environmental Management Act (NEMA), No. 107, 1998,
South Africa which is another fundamental environmental legislation upon which all other
pieces of subsidiary environmental legislation in South Africa are based. The objectives of
the National Environmental Management Act (NEMA), No. 107, 1998, South Africa are
in line with the waste management hierarchy provisions as also expressed by the Waste
Framework Directive- 2008/98/EC.
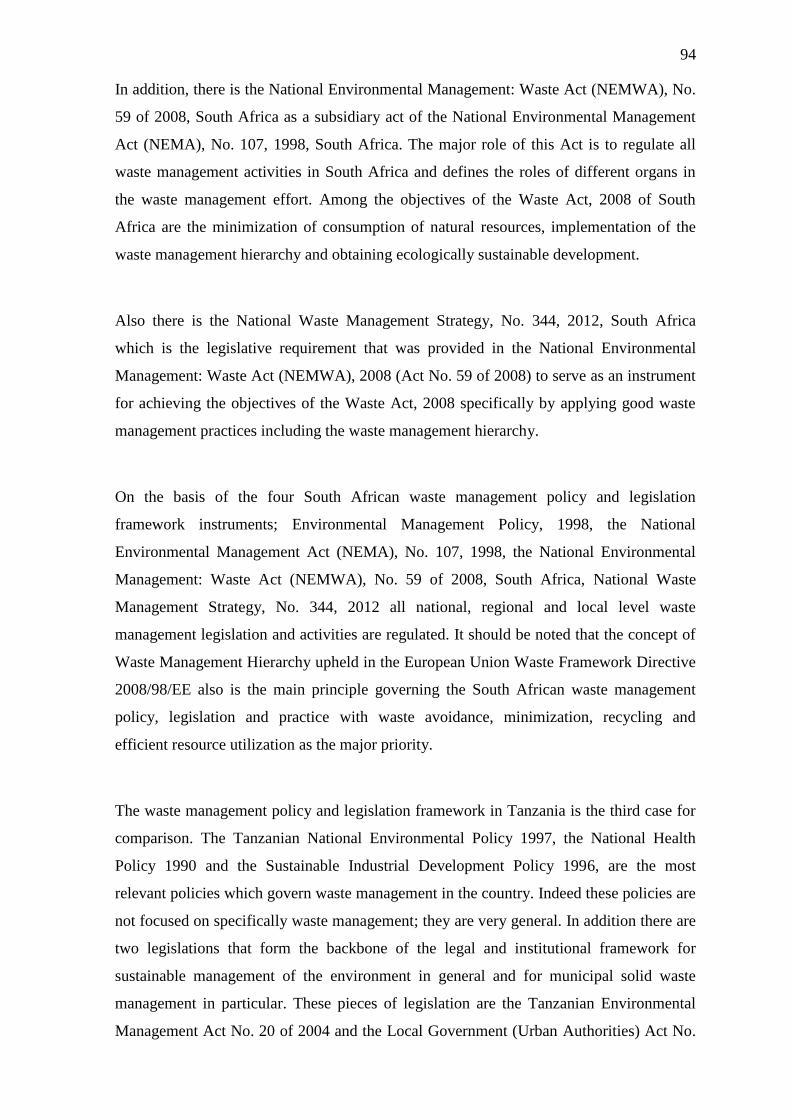
94
In addition, there is the National Environmental Management: Waste Act (NEMWA), No.
59 of 2008, South Africa as a subsidiary act of the National Environmental Management
Act (NEMA), No. 107, 1998, South Africa. The major role of this Act is to regulate all
waste management activities in South Africa and defines the roles of different organs in
the waste management effort. Among the objectives of the Waste Act, 2008 of South
Africa are the minimization of consumption of natural resources, implementation of the
waste management hierarchy and obtaining ecologically sustainable development.
Also there is the National Waste Management Strategy, No. 344, 2012, South Africa
which is the legislative requirement that was provided in the National Environmental
Management: Waste Act (NEMWA), 2008 (Act No. 59 of 2008) to serve as an instrument
for achieving the objectives of the Waste Act, 2008 specifically by applying good waste
management practices including the waste management hierarchy.
On the basis of the four South African waste management policy and legislation
framework instruments; Environmental Management Policy, 1998, the National
Environmental Management Act (NEMA), No. 107, 1998, the National Environmental
Management: Waste Act (NEMWA), No. 59 of 2008, South Africa, National Waste
Management Strategy, No. 344, 2012 all national, regional and local level waste
management legislation and activities are regulated. It should be noted that the concept of
Waste Management Hierarchy upheld in the European Union Waste Framework Directive
2008/98/EE also is the main principle governing the South African waste management
policy, legislation and practice with waste avoidance, minimization, recycling and
efficient resource utilization as the major priority.
The waste management policy and legislation framework in Tanzania is the third case for
comparison. The Tanzanian National Environmental Policy 1997, the National Health
Policy 1990 and the Sustainable Industrial Development Policy 1996, are the most
relevant policies which govern waste management in the country. Indeed these policies are
not focused on specifically waste management; they are very general. In addition there are
two legislations that form the backbone of the legal and institutional framework for
sustainable management of the environment in general and for municipal solid waste
management in particular. These pieces of legislation are the Tanzanian Environmental
Management Act No. 20 of 2004 and the Local Government (Urban Authorities) Act No.
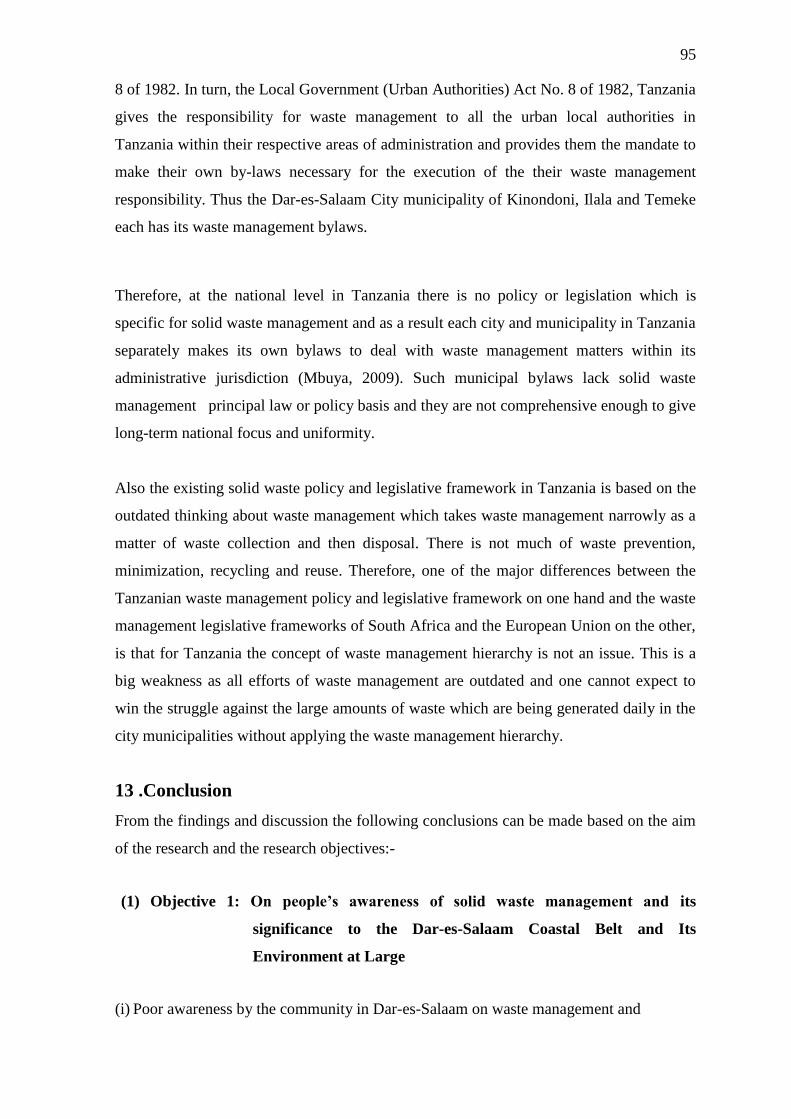
95
8 of 1982. In turn, the Local Government (Urban Authorities) Act No. 8 of 1982, Tanzania
gives the responsibility for waste management to all the urban local authorities in
Tanzania within their respective areas of administration and provides them the mandate to
make their own by-laws necessary for the execution of the their waste management
responsibility. Thus the Dar-es-Salaam City municipality of Kinondoni, Ilala and Temeke
each has its waste management bylaws.
Therefore, at the national level in Tanzania there is no policy or legislation which is
specific for solid waste management and as a result each city and municipality in Tanzania
separately makes its own bylaws to deal with waste management matters within its
administrative jurisdiction (Mbuya, 2009). Such municipal bylaws lack solid waste
management principal law or policy basis and they are not comprehensive enough to give
long-term national focus and uniformity.
Also the existing solid waste policy and legislative framework in Tanzania is based on the
outdated thinking about waste management which takes waste management narrowly as a
matter of waste collection and then disposal. There is not much of waste prevention,
minimization, recycling and reuse. Therefore, one of the major differences between the
Tanzanian waste management policy and legislative framework on one hand and the waste
management legislative frameworks of South Africa and the European Union on the other,
is that for Tanzania the concept of waste management hierarchy is not an issue. This is a
big weakness as all efforts of waste management are outdated and one cannot expect to
win the struggle against the large amounts of waste which are being generated daily in the
city municipalities without applying the waste management hierarchy.
13 .Conclusion
From the findings and discussion the following conclusions can be made based on the aim
of the research and the research objectives:-
(1) Objective 1: On people’s awareness of solid waste management and its
significance to the Dar-es-Salaam Coastal Belt and Its
Environment at Large
(i) Poor awareness by the community in Dar-es-Salaam on waste management and

96
negative effects of waste to people’s health, aquatic animals, beauty of the city and the
Ocean beaches.
(ii) Lack of facilities (e.g. waste bins) to in the greater part of the Dar-es-Salaam City and
at the coastal beaches for individuals with awareness to put their waste.
(iii) The poor awareness of people is reinforced by poor enforcement of laws which leaves
those who do not comply to the waste management laws of the Municipalities to go
without being punished.
(iv) Awareness of beaches goers and students is relatively higher than the general
awareness in Dar-es-Salaam community as expressed by the Government officials.
Hence the following challenges regarding awareness among the community:
- How to improve the awareness among the population regarding the importance of waste
and environmental management in general to individuals, economy and society.
- Inadequate and/or unavailability of waste bins in the greater part of the city.
- Non-enforcement of waste management by-laws by the Municipalities.
- Poor solid waste management at the public beaches and entire coastal line.
(2) Objective 2: On factors influencing solid waste generation and collection and
their trends in the Coastal Belt and its environment as a whole
There has been an increasing trend of both solid waste generation and solid waste
collection in the City of Dar-es-Salaam and its costal belt as a whole since year 1994 up to
the time the study was undertaken.
(a) Factors which have influenced the increase of solid waste generation in the Coastal belt
including the City Municipalities.
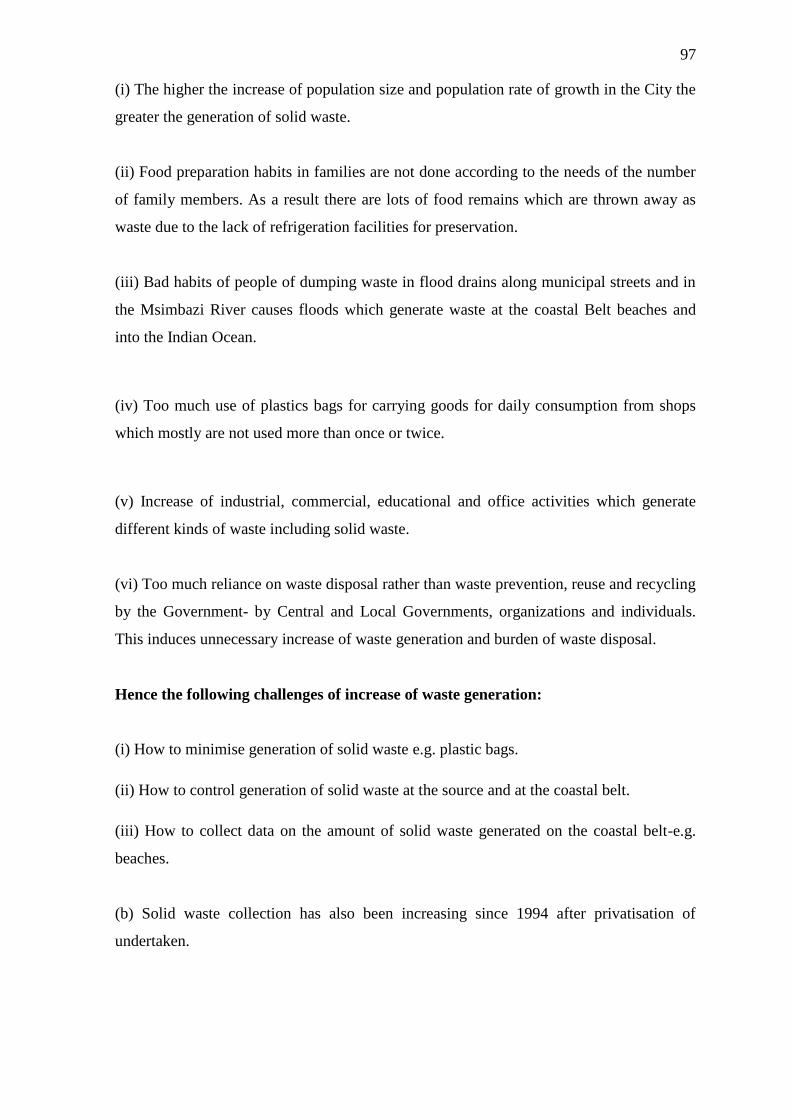
97
(i) The higher the increase of population size and population rate of growth in the City the
greater the generation of solid waste.
(ii) Food preparation habits in families are not done according to the needs of the number
of family members. As a result there are lots of food remains which are thrown away as
waste due to the lack of refrigeration facilities for preservation.
(iii) Bad habits of people of dumping waste in flood drains along municipal streets and in
the Msimbazi River causes floods which generate waste at the coastal Belt beaches and
into the Indian Ocean.
(iv) Too much use of plastics bags for carrying goods for daily consumption from shops
which mostly are not used more than once or twice.
(v) Increase of industrial, commercial, educational and office activities which generate
different kinds of waste including solid waste.
(vi) Too much reliance on waste disposal rather than waste prevention, reuse and recycling
by the Government- by Central and Local Governments, organizations and individuals.
This induces unnecessary increase of waste generation and burden of waste disposal.
Hence the following challenges of increase of waste generation:
(i) How to minimise generation of solid waste e.g. plastic bags.
(ii) How to control generation of solid waste at the source and at the coastal belt.
(iii) How to collect data on the amount of solid waste generated on the coastal belt-e.g.
beaches.
(b) Solid waste collection has also been increasing since 1994 after privatisation of
undertaken.
98
Factors which have influenced the increase of solid waste collection:
(i) Relative efficiency of solid waste collection by private contractors and
participation of the community.
(ii) There are no data which shows how much waste is being collected from the beaches
(coastal belt)
Challenges facing solid waste collection leading to relatively smaller percentage of
waste being collected than generated:-
(i) Poor infrastructures such as unplanned settlements (squatters) with no roads to reach
them.
(ii) Lack of transfer stations in the municipalities from collection points before dumping
them to the disposal sites.
(iii) Shortage and lack of waste management facilities and equipment –e.g. vehicles, waste
containers are in short supply making the entire waste management activity inefficient and
ineffective to undertake, leaving a lot of waste uncollected.
(iv) No sorting of waste either at the household level or at the collection points.
(v) Reluctance of community members to pay waste collection fees due to low awareness,
lack of willingness to pay the set fees and political influence.
(vi) Shortage of waste management experts to manage the waste management activities.
(vii) Too much waste being collected against a bigger amount of waste being generated
daily.
(viii) A great amount of waste is thrown away (wasted) which could be turned into useful
resources.
(ix) Inadequate government budget allocations for waste management from the Central
Government.
99
(x) Shortage of well trained waste management experts to plan and monitor waste
management activities.
14. Recommendations
(a) General Recommendations
(i) Formulation of national legislation specifically addressing solid waste management for
the whole country to replace the existing waste legislations which are formed by each
municipality and other local authorities.
This should follow the example shown by the European Union and the Republic of South
Africa.
(ii)There is need to formulate a national long term solid waste management strategy for
the whole country to address the challenges facing not only the Dar-es-Salaam
municipalities but the entire country. The strategy should have a long term plan of
implementation with specific targets addressing the challenges.
(iii)The solid waste legislation should be built upon the concept of waste management
hierarchy as practiced by the European Union and the Republic of South Africa. It can
help municipalities to direct their efforts on waste prevention, waste recycling rather than
waste disposal as the usual practice in Tanzanian municipalities.
(iv) The formulated national solid waste legislation and national solid waste strategy
should guide the various implementing organs including sector ministries and
municipalities in formulating their specific by-laws, plans and regulations.
(b) Specific recommendations
1) Provide education to people of all ages, children and adults about environmental and
solid waste management and their importance through formal education and seminars.
2) Strict enforcement of existing laws on environmental and solid waste management and
entrusting the responsibility to the Municipal police.

100
3) Increase of budget allocation by the Government to buy facilities and equipment for
waste management
4) Complete abolition of utilization of plastic bags; instead the Government should
encourage alternative shopping bags particularly those which use decomposable materials
such as baskets and containers made from bamboo and palm leaves materials.
4) Purify tap water to make it clean and safe to drink in order to reduce the production of
bottled water which generates a lot of plastic bottles.
5) The Government to convince private waste collectors to improve the wages and other
employment conditions of their staff and workers.
6) To establish waste recycling and alternative use industries to absorb some of the waste
materials and create employment.
7) Establish well planned satellite cities around the big City of Dar-es-Salaam in order to
reduce the population concentration.
8) Rehabilitate the squatter areas and construct passable roads.
9) Legally binding agreement should be made by the Municipalities with waste collection
companies and Civil Based Organisations (CBOs) on better and morale raising terms of
employment reached between the companies and CBOs on one side and the employees on
the other.

101
References
2012 Tanzania Population and Housing Census (2012), National Bureau of Statistics,
United Republic of Tanzania, Dar-es-Salaam. http://www.nbs.go.tz/sensa/new.html
(retrieved: 28.11.2013).
Berninger, K, Heikkilä, L, Zdravko, K, Orjala, M. & Teräväinen, T. (2010), Waste
Management and Recycling in Finland (w.p).
http://www.asrm.ro/evenimente/evak/WasteManagement_final.pdf. (Accessed:
12.4.2014).
City of Johannesburg Integrated Waste Management Plan 2011 (2011). City of
Johannesburg, South Africa. joburg-archive.co.za/2011/pdfs /iwm_plan2011.pdf
(retrieved: 28:4.2014).
Dar - es - Salaam City Environment Outlook 2011, (2011), Second Draft, Vice President’s
Office, Division of Environment, United Republic of Tanzania, Dar-es-Salaam.
Directive 1999/31/EC of 26 April 1999 on the landfill of waste.
http://eur-lex.europa.eu/LexUriServ/LexUriServ.do?uri=CELEX:31999L0031:EN:HTML
(retrieved: 28.2.2014).
Directive 2000/76/EC of the European Parliament and of the Council of December 2000
on the incineration of waste. www.eec.europa.eu/policy-documents/directive-2000-76-ec-
incineration (retrieved: 3.3.2014).
Directive 2006/12/EC (Waste Disposal Directive). Directive of the European Parliament
and of the Council of 2006 on waste disposal. http://eur-lex.europa.eu/legal-
content/EN/TXT/?uri=CELEX:32006L0012 (retrieved: 16.2.2014).
Directive 2008/98/EC (Waste Framework Directive). Directive of the European
Parliament and of the Council. http://eur-lex.europa.eu/legal-
content/EN/ALL/?uri=CELEX:32008L0098 (retrieved: 16.2.2014).
102
Environmental Management Act 2004, Act No. 20, 2004, Tanzania. www.dlist-
asclme.org/.../environmental-management-act2004-tanzania (retrieved: 14.3.2014).
Environmental Management Policy (White Paper), South Africa, 1998.
http://www.gov.za/documents/download.php?f=70436 (retrieved: 16.3.2014).
European Commission - COM (2011). Report from the Commission to the European
Parliamant, the Council, the European Economic and Social Committee and the
Committee of Regions, on the Thematic Strategy on the Prevention and Recycling of
Waste. http://ec.europa.eu/environment/waste/strategy.htm (retrieved: 30.3.2014).
European Commission- COM (2005) 666. Taking sustainable use of resources forward - A
Thematic Strategy on the prevention and recycling of waste. http://eur-lex.europa.eu/legal-
content/EN/TXT/?uri=CELEX:52005DC0666 (retrieved: 13.3.204).
European Environment Agency, SOER, (2010). The European Environment - State and
Outlook 2010: Maritime and Coastal Environment, European Environment Agency,
Copenhagen. Available at www.eea.europa.eu/soer (retrieved: 28.3.2014).
European Environment Agency (2011). Waste Opportunities- Past and Future climate
benefits from better municipal waste management in Europe.
http://www.eea.europa.eu/publication/waste-opportunities-84-past (retrieved: 20.3.2014).
European Environment Agency (2013). Report No.2/2013 Managing Municipal Solid
Waste- a review of achievements in 32 European Countries. Copenhagen.
http://www.eea.europa.eu/publications/managing-municipal-solid-waste (retrieved:
26.3.2014).
European Union, SOER, (2010). Being Wise with Waste: The European Union’s
Approach to Waste Management.
http://www.ec.europa.eu/environment/waste/pdf/WASTE%20BROCHURE.pdf (retrieved:
20.3.2014).
103
Eurostat 2012e, Reference Metadata in Euro SDMX Metadata Structure (ESMS);
http://epp/eirpstat/ec/eirp[a/em/cache/Ity_SDDS/EN/env_Wasmun_esms.htm (retrieved
19.3.2014).
Helsinginseudun ympäristöpalvelut (HSY) (2014). Waste Management.
http://www.hsy.fi/en/wastemanagement/recycling_and_waste_sorting/biowaste/Pages/pac
kingbiowaste.aspx (retrieved: 12.4.2014).
HSY Waste Management customer service (2014).
http://www.jly.fi/energia5.php?treeviewid=tree3&nodeid=5 (retrieved: 12.4.2014).
Jatput, R., Prasad, G. & Chopra, A.K. (2009). Scenario of solid waste management in
present Indian context. Caspian J. Env. Sci. (2009), 7(1), 45 –53.
Jätelaitosyhdistys (2014).
http://www.jly.fi/energia5.php?treeviewid=tree3&nodeid=5 (retrieved: 12.4.2014).
Jones, T.E. & Mkoma, R.N. (2013). Reflections on 20 years of Solid Waste Management
Reforms in Tanzania: The Case Study of the Sustainable Dar-es-Salaam Project. The
Macrotheme Review (2) 4, Summer (2013), 122 – 136.
Kaseva, M. E. & Mbuligwe S. E. (2005). Appraisal of solid waste collection following
private sector involvement in Dar es Salaam city, Tanzania, Habitat International, 29
(2005), 353–366.
Kaseva, M. E. & Gupta, S. K. (1996). Recycling - an environmentally friendly and income
generating activity towards sustainable solid waste management. Case study- Dar es
Salaam City, Tanzania. Resource Conservation and Recycling, Volume 17, (Issue 4),
(October 1996), 299-309.
Local Government (Urban Authorities) Act No. 8 of 1982, Tanzania.
http://www.tic.co.tz/media/The_local_government_urban_authorities_act_8-1982.pdf
(retrieved: 17.3.2014).
104
Lukambuzi, L., (2006) (Staff of the National Environment Council (NEMC) Tanzania).
National Overview and Assessment on Marine Litter Related Activities in Tanzania
(unpublished Final Consultancy Report), Dar-es-Salaam.
Mbuya, E.(2009).Solid waste management in Dar-es-Salaam: Privatizing and improving
revenue collection. http://www.ioiusa.net/articles/view/141601/#-edn1 (retrieved: 20.2.
2014).
National Environmental Action Plan (NEAP) 2013-2018 (2013), Tanzania.
http://www.vpo.go.tz/userfiles/NEAP%20B5.pdf (retrieved: 29.3.2014).
National Environmental Management Act (NEMA) 1998, Act No. 107, 1998, South
Africa. www.saflii.org/za/legis/num_act/nema1998331.pdf (retrieved: 15.3.2014).
National Environmental Management: Waste Act (NEMWA) 2008, Act No. 59 of 2008,
South Africa.
http://www.saflii.org/za/legis/hist_reg/nemwa59o2008rangnr344837/nemwa59o2008rang
nr344a4m2012910.html (retrieved: 15.3.2014)
National Environmental Policy, 1997, Tanzania.
www.tzonline.org/pdf/nationalenvironmentalpolicy.pdf (retrieved: 12.4.2014)
National Waste Management Strategy, No. 344 of 2012, South Africa.
https://www.environment.gov.za/sites/default/files/gazetted_notices/waste_strategy_establ
ishment.pdf (retrieved: 16.4.2014).
Ngoc, U.N. & Schnitzes, H. 2009. Sustainable Solutions for Solid Waste Management in
South Asian Countries, Waste Management 29 (6), 1982-1995.
Oberlin, A.S. (2013). Involvement in Community Based Organisation in household Waste
Management in Dar-es-Salaam, ARPN Journal of Science and Technology, IJRMEC,
(VOL. 2), (Special Issue, ICESR 2012),195 – 206.

105
Palfreman, J. (2011), Waste Management and Recycling in Dar-es-Salaam.
http://www.scribd.com/joshpalfreman (retrieved: 13.2.2014).
State of the Environment Report, 2006 (2006). Division of Environment, Vice President’s
Office, United Republic of Tanzania, Dar-es-Salaam.
Sustainable Industrial Development Policy (1996 – 2020) (1996), Tanzania.
http://www.tzonline.org/pdf/sustainableindustrial.pdf (retrieved: 13.3.2014)
Temeke Municipal Commission (Solid Waste Management) (Collection and Disposal of
Refuse) By-Laws, 2002. http://www.faolex.fao.org/docs/pdf/tan34434.pdf (retrieved:
8.3.2014)

106
Appendices
Appendix I
RESULTS FROM QUESTIONNAIRE FOR THE DIVISION OF ENVIRONMENT-
VICE PRESIDENT’S OFFICE
S/N QUESTION RESPONSES COMMENTS Classify the kind of
problem/objective
addressed
1 What has been
the general
situation
regarding waste
of Dar –es-
Salaam Coastal
belt? Is it
improving or
deteriorating. If
it is improving,
what are the
mechanisms
used?
It is improving
but not very
well
-Because
previously the
government used to
take care of the
waste management
in Dar –es-Salaam.
Now the new
mechanisms used is
to hire private
companies in order
to take care of the
Coastal belt and the
environment at
large. Private
companies seem to
be more effective
in doing the job
-The regulations
concerning plastic
bags were
reviewed, right
now the plastic
bags allowed are
the ones which
have 30 microns
State of waste
management
2 Do you have
some foreseen
challenges due
to demographic
changes? If
there are, do
you have any
plan to combat
them? (What
There are lots
of them
because of the
following :-
-The
population in
Dar- es-Salaam
is growing very
rapidly, the
The plan to combat
them:
-People who built
their houses within
60 m are removed
from the areas
close to the river
Bank such as
Msimbazi river and
Challenges

107
are the
mechanisms
used)
problems are
poor City
planning and
infrastructures
are among the
obstacles to the
real
environmental
development.
For example
the liquid waste
infrastructures
as well as solid
wastes.
-People do
build their
houses to the
wetlands such
as Jangwani
area in Dar -
es- Salaam.
even those who
built 60 m. to the
Ocean are being
removed as well .
-The future plan of
the government is
to have a new City
plan which will
help the smooth
running of
environmental
operations within
the City
-Some hotels are
built within the 60
m limit away from
the coast line
3 Do you have
short, medium
and long term
plan to educate
people
concerning
waste
management?
Yes we do There is a
campaign which
was launched on
12th
February 2011,
it is about keeping
the City clean. The
slogan of the
campaign is
everybody should
clean his premises.
The weakness of
the Campaign
Poor
implementation of
the plan
Awareness campaign
4 Do you have
any recycling
policy, or
recycling
system which
helps a bit to
deal with
waste? For
No such policy Though the
ministry supports
the recycling
system hundred
percent under
sustainable
industrial
development policy
State of waste
management

108
example:-
Plastic bottles,
cans etc.. If no,
do you have a
master plan to
put it down?
5 What are the
challenges do
you face?
There are many -poor
environmental
awareness of
people about
environment.
-In adequate of
resources
particularly money
-No sanitary
dumpsite in Dar es
salaam as it was
planned before;
instead we have a
crude dumpsite.
Challenges
6 Which
municipality
generates more
waste in the
City? If there is
one what are
the reasons,
Demographic
change?
Negligence of
municipal
officials? Lack
of education or
what else?
1. The first one
is Temeke
2. Secondly is
Kinondoni
3. Followed by
Ilala
The reason is the
population density
within the first two
municipalities is
higher than the last
one (Ilala) and also
the City planning
of the Temeke and
Kinondoni is poor
compared to the
last one (Ilala).
Because the Ilala
municipality is
within the City
centre. Therefore
the offices,
ministries, shops,
schools, collages,
good restaurants
are within this
Municipality
7 Could you tell
me the waste
management
hierarchy from
We don’t have

109
top to the
bottom or from
the ministerial
level to
municipalities
particularly in
Dar es salaam?
8 When you
make laws or
regulations,
how do you
form them?
We just hire a
consultant in
order to make a
draft. After
that, we call
upon key stake
holders in order
to review a
paper and make
some
comments on
it/inputs .And
finally we send
the draft to the
parliament.
9 What is the
difference in
functionalities
between you
(the ministry of
Environment)
and the
National
Environment
Management
Council
(NEMC)?
-We are the
law makers and
the NEMC job
is to enforce
environmental
laws
throughout the
country
(1) Interviewed: Mrs. Rogathe Kisanga- Principal Chemist, Division of Environment, Vice
President’s Office, United Republic of Tanzania.
(2) Date of Interview: November, 2013.

110
Appendix II
RESULTS FROM QUESTIONNAIRE FOR ENVIRONMENTAL OFFICERS OF KINONDONI, ILALA AND TEMEKE
MUNICIPALITIES OF DAR-ES-SALAAM COASTAL CITY
S/
N
QUESTION
ORGANISATION
RESPONSES COMMENTS
Kinondoni
Municipality
Ilala
Municipality
Temeke
Municipality
Kinondoni
Municipality
Ilala
Municipalit
y
Temeke
Municipalit
y
1 What is the
most common
waste does the
municipality
generates: bio
waste, metals,
plastics…?
1) Bio
waste
2) Offices´
waste
such as
papers
3) Metals,
4) Plastics
5) Tree
branches
-Bio waste
(Organic waste)
-plastic bags
-Plastic bottles
-Metals (Iron
metals, lead,
copper →E-
waste)
- Bus tickets
-Cell phone
Vouchers
Generation 1138
tons per day
Collected 535
tons per day
Collected 47%
Types of waste:
Dominant type
of waste; In
developing
countries
dominant waste
is food waste.
A)People
cook too
much food
for excess,
mean while
they don’t
have
refrigerators
for
preserving it
B) Not
enough waste
bins
C)No enough

111
waste bins
D) No
enough waste
bins and
people don’t
care much
about
dumping
waste
2 Do you have
any waste
management
plan in your
municipality?
Yes we do Yes We don’t have
data regarding
waste collected in
the coastal belt
only within our
municipality
We have the
old one
,though the
new one is
still under
way
3 Who is
responsible for
taking care of
the coastal belt
in your
municipality
Municipality
itself
The municipality
itself
Municipality
itself
4 What
challenges do
you face in
solving and
implementing
your waste
management
We have many So many Lots of them Challenges to
waste
management:
Lack of
enforcement of
laws
-Shortage of
facilities for
waste
management
such as
vehicles,
waste
1) Political
interference
from
councillors
who are
siding with
people who
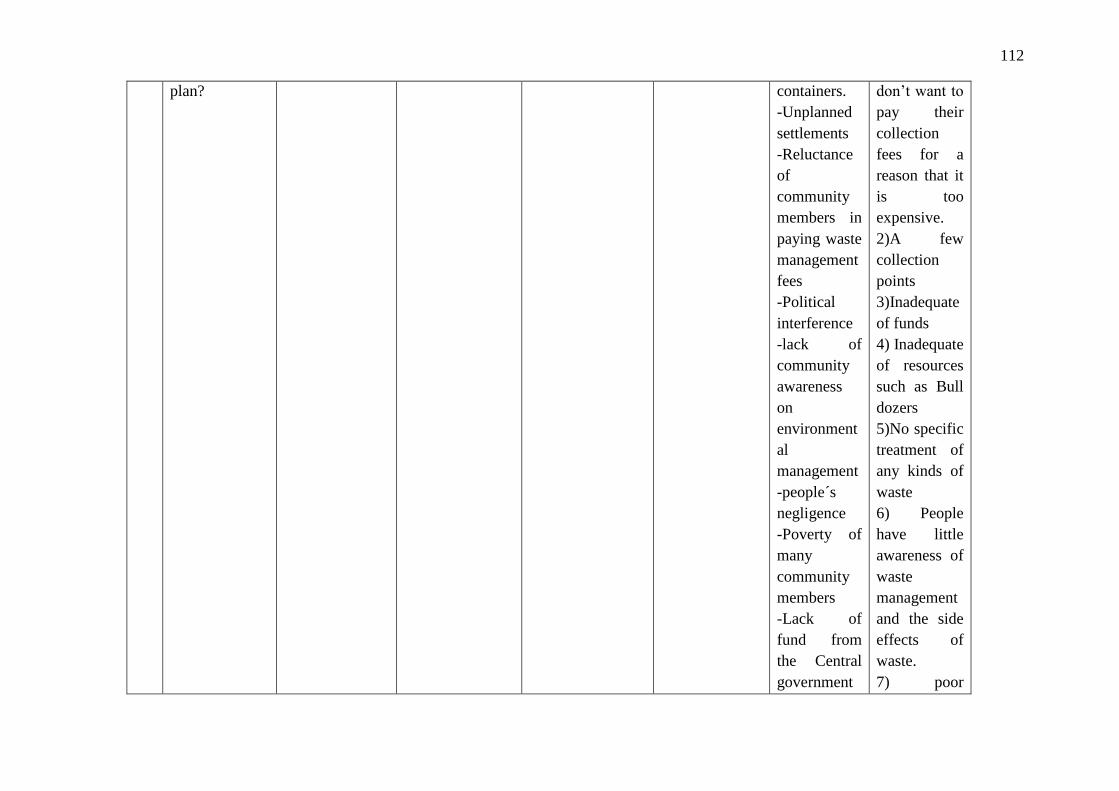
112
plan? containers.
-Unplanned
settlements
-Reluctance
of
community
members in
paying waste
management
fees
-Political
interference
-lack of
community
awareness
on
environment
al
management
-people´s
negligence
-Poverty of
many
community
members
-Lack of
fund from
the Central
government
don’t want to
pay their
collection
fees for a
reason that it
is too
expensive.
2)A few
collection
points
3)Inadequate
of funds
4) Inadequate
of resources
such as Bull
dozers
5)No specific
treatment of
any kinds of
waste
6) People
have little
awareness of
waste
management
and the side
effects of
waste.
7) poor

113
because the
fund which
is allocated
for waste
management
is too small
In adequate
of well-
trained
experts in
the field of
waste
management
arrangement
of the city,
squatters
which hinder
an effective
waste
collection by
using cars
5 Do solid
wastes pose
serious
challenges to
the
municipality?
Of course Yes Yes Yes Challenges -They don’t
reach
collection
points from
the
households
timely as
scheduled
because of
the lack of
facilities and
shortage of
human
resources(en
vironmental
experts)
Conflict
between
waste
management
companies
(contractors)
and civilian
on waste
collection
fees
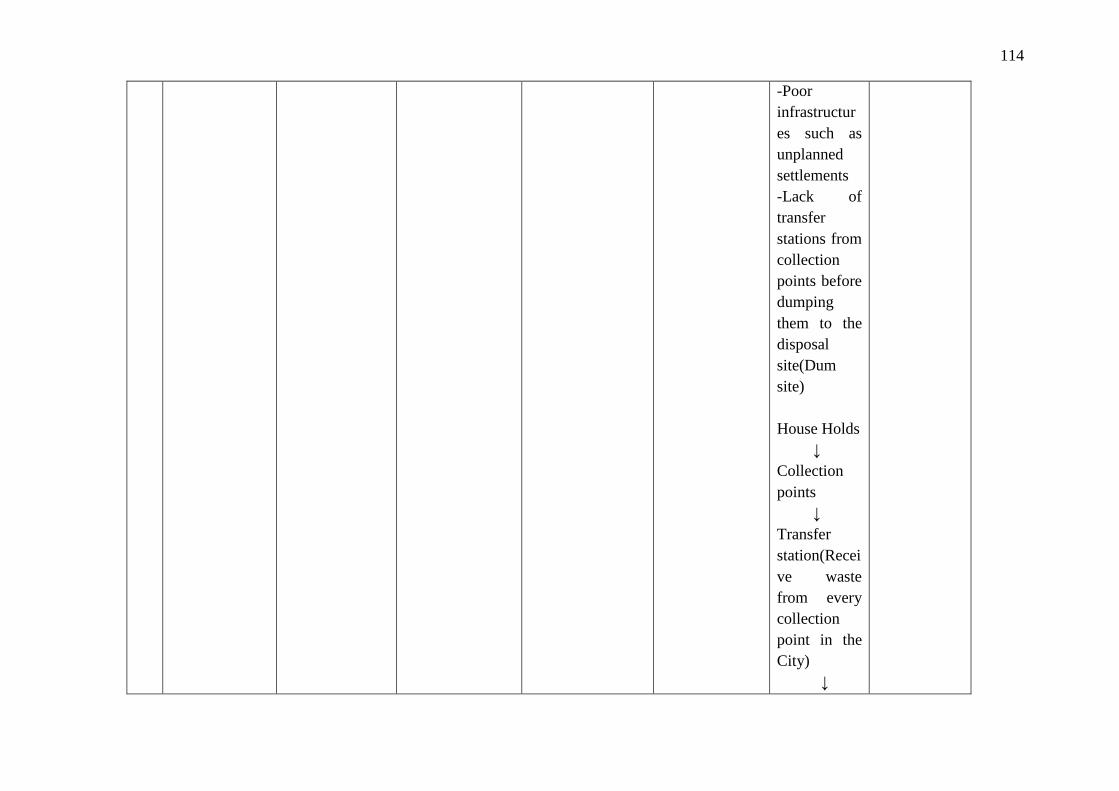
114
-Poor
infrastructur
es such as
unplanned
settlements
-Lack of
transfer
stations from
collection
points before
dumping
them to the
disposal
site(Dum
site)
House Holds
↓
Collection
points
↓
Transfer
station(Recei
ve waste
from every
collection
point in the
City)
↓

115
Dumpsite
-The plan to
build the
transfer
station by
the City
Council is
still under
way with the
help of the
world Bank
-During the
rainy season,
the dump
site is very
slippery
which cause
the Cars to
get stuck in
between
before
dumping the
waste to the
dumpsite
-No waste
sorting either
at the
household

116
level or at
the
collection
points
6 What is the
state of the
annual waste
generation in
municipal
since 1994? Is
it increasing or
decreasing?
increasing It is increasing Increasing
Waste
Generation
challenge
Though the
waste
collection
exercise is
improving.
60% of the
waste
generated is
collected.
Refer to the
Review of
the Annual
and Quarter
Report of the
Municipality
7 What is the
total volume of
waste
generation per
day in your
Municipality?
2026 tons per
day
It is estimated to
produce 1,088
tons per day
Generation 1138
tons per day
Collected 535
tons per day
Collected 47%
Challenge
8 What are the
total volumes
of waste
We don´t know
for sure
Actually it is
difficult to know
because we don´t
We don’t have
data regarding
waste collected in
Challenge Because the
contractors
within our
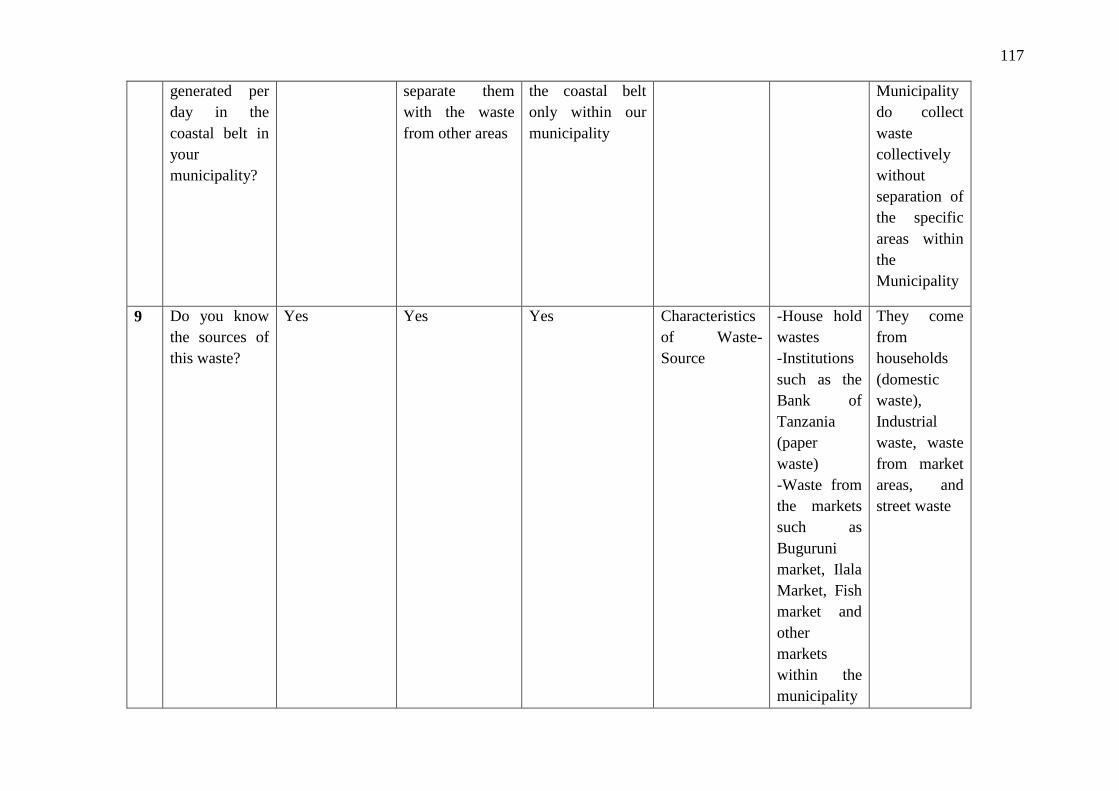
117
generated per
day in the
coastal belt in
your
municipality?
separate them
with the waste
from other areas
the coastal belt
only within our
municipality
Municipality
do collect
waste
collectively
without
separation of
the specific
areas within
the
Municipality
9 Do you know
the sources of
this waste?
Yes Yes Yes Characteristics
of Waste-
Source
-House hold
wastes
-Institutions
such as the
Bank of
Tanzania
(paper
waste)
-Waste from
the markets
such as
Buguruni
market, Ilala
Market, Fish
market and
other
markets
within the
municipality
They come
from
households
(domestic
waste),
Industrial
waste, waste
from market
areas, and
street waste

118
10 What kinds of
waste are the
largest of all
within the
coast line in
your
municipality?
Plastic bags 1. Organic waste
(Bio waste)
2. Plastic bottles
with their covers
3. Plastic bags
and some kinds
of papers
4.Cans
Domestic and
Industrial such as
plastic bottles and
cans, plastic bags,
pieces of threes
etc.
Because they
are
discharged
by the rivers
and
drainages to
the sea and
some
Industries
discharge
their waste
direct to the
rivers
11 How do you
collect these
waste, are they
sorted or
mixed
together?
Not yet, mixed Mixed They are mixed Because
there is no
sorting
formalities
12 How does the
municipal
dispose this
waste?
To the dump
site: Pugu
Kinyamwezi;
1)To the dump
site
2)Some are Re
used
To the dump site Challenge 1) Pugu-
Kinyamwezi
Dumpsite
2) Car tires
are reused
for making
slippers ,
sandals ,

119
mats for
cleaning
feets
2 b) some tin
metal related
materials are
used for
making oil
lamps
known as
“vibatari”
13 Are there some
waste reuse
strategies
currently being
implemented
such as
composting?
The plan is still
under way, by
January 2014
by the help of
Belgium
technical
cooperation the
project will
commence
Yes No such plan Challenge We have two
composting
stations
1) is at
Gongolambo
to known as
KIKUTA
Waste
Management
Station.
2) Is at
Buguruni
Malapa
waste
collection
site under
the
assistance of

120
Bremen
Overseas
Research
and
Developmen
t Association
14 Does the
municipality
have treatment
for specific
wastes such as
hazardous
waste, electric
and electronic
waste, liquid
waste etc.
No. we don’t
have such
program at all
There is no any
kind of treatment
for these waste
No specific
treatment for any
kind of waste
Challenge Hospital
waste are
incinerated
although
incinerators
are not
enough
Only hospital
wastes are
incinerated
15 Do you see any
problem when
people
discharge
waste to the
drains?
Yes there is a
big problem;
they block
drains, cause
floods, other
waste find their
way into the
ocean
The problem is
so big
Yes challenge -Because
majority of
the waste
discharged
are not
treated at all
-The River
Msimbazi is
one of the
biggest
victims of
these
Particularly
the waste
from the
factories
which pose a
great danger
to human
health and
the
environment
al at large.
Also the
smells which
121
confidential
activities
done by the
inhabitants
of Ilala,
whereby
people have
connected
their
latrines’
pipes to
discharge
it´s water to
the river.
Finally the
river
discharge
it´s water to
the Indian
Ocean
-People do
throw their
food left
over and
some
peelings to
the drains
-Small scale
come from
the rotten
waste is very
bad. Not only
that but also
the
discharged
waste do
block the
drains
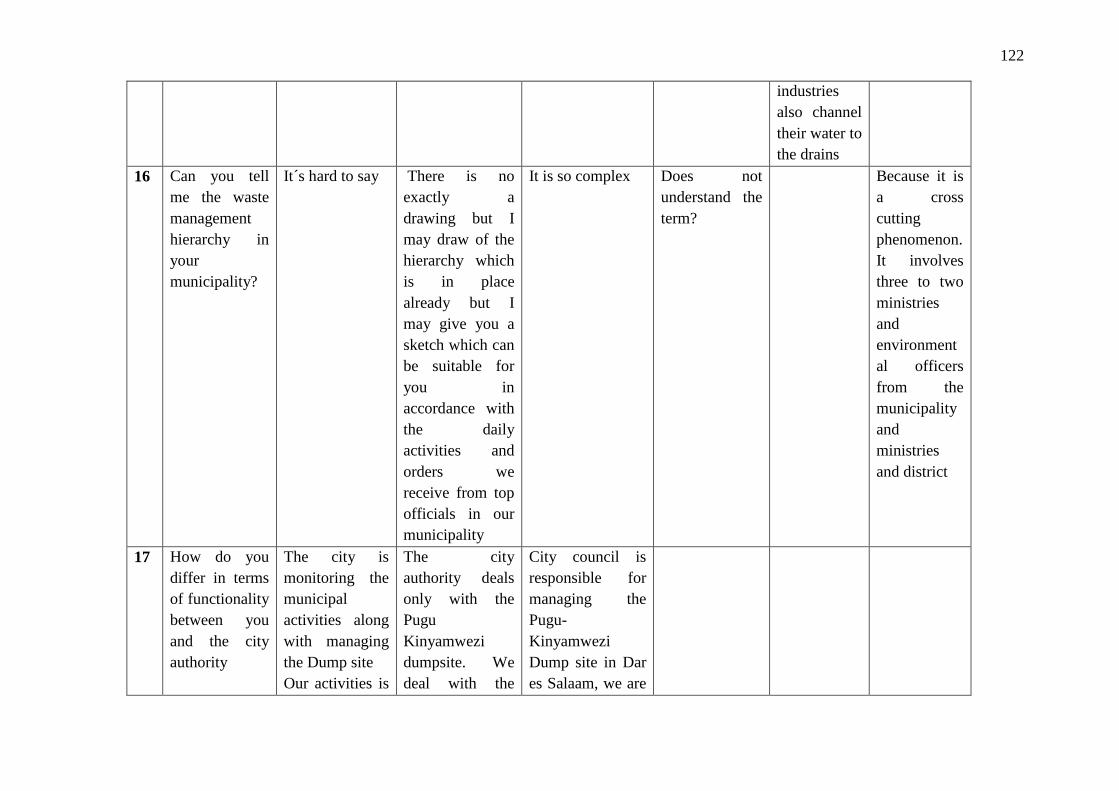
122
industries
also channel
their water to
the drains
16 Can you tell
me the waste
management
hierarchy in
your
municipality?
It´s hard to say There is no
exactly a
drawing but I
may draw of the
hierarchy which
is in place
already but I
may give you a
sketch which can
be suitable for
you in
accordance with
the daily
activities and
orders we
receive from top
officials in our
municipality
It is so complex Does not
understand the
term?
Because it is
a cross
cutting
phenomenon.
It involves
three to two
ministries
and
environment
al officers
from the
municipality
and
ministries
and district
17 How do you
differ in terms
of functionality
between you
and the city
authority
The city is
monitoring the
municipal
activities along
with managing
the Dump site
Our activities is
The city
authority deals
only with the
Pugu
Kinyamwezi
dumpsite. We
deal with the
City council is
responsible for
managing the
Pugu-
Kinyamwezi
Dump site in Dar
es Salaam, we are
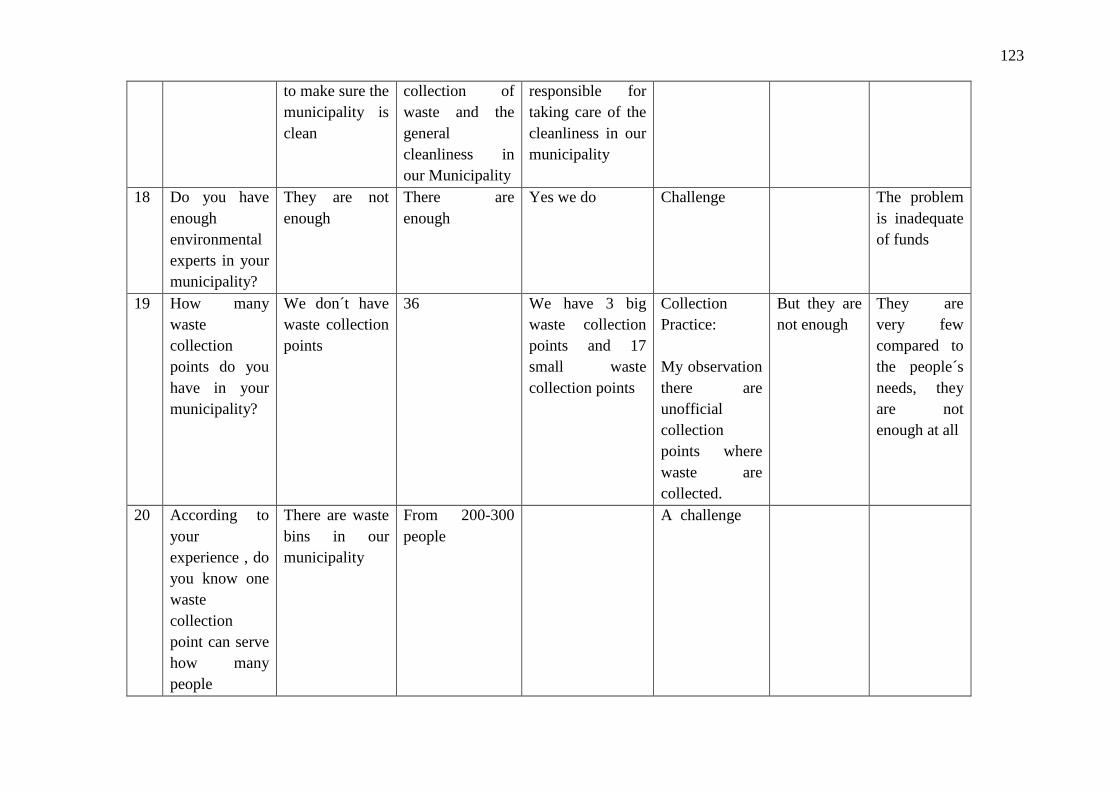
123
to make sure the
municipality is
clean
collection of
waste and the
general
cleanliness in
our Municipality
responsible for
taking care of the
cleanliness in our
municipality
18 Do you have
enough
environmental
experts in your
municipality?
They are not
enough
There are
enough
Yes we do Challenge The problem
is inadequate
of funds
19 How many
waste
collection
points do you
have in your
municipality?
We don´t have
waste collection
points
36 We have 3 big
waste collection
points and 17
small waste
collection points
Collection
Practice:
My observation
there are
unofficial
collection
points where
waste are
collected.
But they are
not enough
They are
very few
compared to
the people´s
needs, they
are not
enough at all
20 According to
your
experience , do
you know one
waste
collection
point can serve
how many
people
There are waste
bins in our
municipality
From 200-300
people
A challenge

124
21 Who is the
greatest
polluter in the
coast belt
within your
municipality
Bio-waste Rivers which
discharge their
water the Ocean
Category of

125
Appendix III
RESULTS FROM QUESTIONNAIRE FOR CIVIL SOCIETY GROUPS (BEACH GOERS, FISHERMEN, AND IFM STUDENTS)
IN DAR –ES-SALAAM COASTAL CITY
S/N QUESTION RESPONSES
GROUPS OF CIVIL SOCIETY
BEACH GOERS:N=30 FISHERMEN:N=10 IFM STUDENTS:N=20
I) Are you satisfied
with the waste
management
services given by
municipalities?
A Satisfied? Satisfied = 10 = 33%
They try to clean sometimes we
see them.
Satisfied=10 = 100%
We are very satisfied compared
to previous years, whereby
there was no water at all in this
market, so toilets were just
stinking; we could not wash the
fishes ready for sale etc. We are
real happy and satisfied now:
plastics. [Comments: My
observation The situation looks
to be filthy in the fish market. A
pile up of plastic bags;
packaging materials; plastic
Satisfied = 3 = 15%
We normally see people cleaning
in the morning whenever we come,
but the problem is the people who
pass by, usually through plastic
bottles and bags because no waste
bins around as you see now;
People clean every morning but
after some time in the afternoon
waste accumulates.

126
bottles; paper boxes; coconut
shells; (solid waste); they are
mixed with water and mud.]
B Not Satisfied? Not satisfied = 19 = 63%
We don´t see any one cleaning
the beach. Waste remains
uncollected.
We are very satisfied compared
to previous years, whereby
there was no water at all in this
market, so toilets were just
stinking; we could not wash the
fishes ready for sale etc. We are
real happy and satisfied now:
plastics.
[Comments: My observation
The situation looks to be filthy
in the fish market. A pile up of
plastic bags; packaging
materials; plastic bottles; paper
boxes; coconut shells; solid
waste-; they are mixed with
water and mud].
Not satisfied =17 = 85%
We normally come here to the
beach no one cleans the beach;
C I don´t know? I don´t know = 1 = 3%
I don’t usually come here
[My comments: Observation: I
observed waste scattered on the
beach]
My Comment: Respondents are
not fully aware of solid waste
problems. They are only
concerned with issues related
with the availability of water
for washing their fish.]
2 If no. What are you

127
doing in your small
ways to reduce?
A I try not to pollute
the environment
whenever I am here
I try not to pollute the
environment whenever I am here
=7 = 23%
I try not to pollute the environment
whenever I am here
= 12 = 60%
-I educate people at home.
-I clean the environment where I
live
-I am ready to walk with a plastic
bottle from morning to evening if I
don’t see waste bins
B It is not my
responsibility
It is not my responsibility= 0 It is not my responsibility
= 1 = 5%
-It is the responsibilities of the
municipality because they are paid
for it from our own taxes and they
do nothing. For example:-When
Obama came here, the beach was
very clean , not even a single
plastic bag, and it was the
municipality which was doing that
C I don’t know I don’t know = 0 I don’t know I don’t know - 0
D Other = 23 = 77%
Anyone who comes here will
automatically be compelled to
pollute the environment because
there are no waste bins
Other = 7 = 35%
-I don’t pollute at all in street, I
only clean where I live
3 [If Yes,] Why do No waste bins in the whole city [My comments: To them solid -No waste bins throughout the city.

128
we still experience
the waste problems
in our societies?
not only here at the beach waste does not exist so long as
they have plenty their business
of cleaning the fish bowels goes
on well. Stinking smell stench
People are not yet civilized.
4 Have you ever
experienced any
problem associated
with waste?
A Yes = 22 = 73%
-I got typhoid when I was in
school
-I have seen some people got
cholera.
I got stomach ache when I ate
food which was not good
Yes = 6 = 60% Yes = 2 = 10%-I saw one guy
where I used to live , he was
suffering from cholera
B No = 8 = 27%
I only hear from the media
No = 4 = 40% No = 18 = 90%
C I don’t know I don’t know
5 Do you know how
waste management
is functioning in
this municipality?
A Yes Yes = 0 Yes = 10 = 100% Yes = 4 = 20%
B No No = 27 = 90%
Though I usually see waste
management vehicles and people
No = 16 = 80%

129
cleaning around the City; still
there is always scattered around.
C I Don’t know I don’t know = 3 = 10% I don’t know 0 = 0% I don’t know = 0 = 0%
6 Do you know
where you are
supposed to put
your waste?
A Yes Yes = 30 = 100%
The problem is there are no
waste bins throughout the City.
Though they started putting
waste bins in the City
unfortunately people remove
them
Yes = 10 = 100%
When we remove fish scales
and intestines we usually throw
back to the Ocean, other types
of waste usually we put in
waste collection places around
the market areas.
My Observation: other solid
waste streams are placed any on
the floor. They lack open skip
buckets
Yes= 20 =100%
The problem is no waste bins
throughout the City.
B No = 0 0
C I don’t know = 0 0
7 Do you know
where your waste
ends after
discharging to the
drains
A Yes Yes = 26 = 87%
Some of them block the drains
Yes = 10 = 100%
Here whenever we throw away
Yes = 19 = 95%
They go to block the drainage
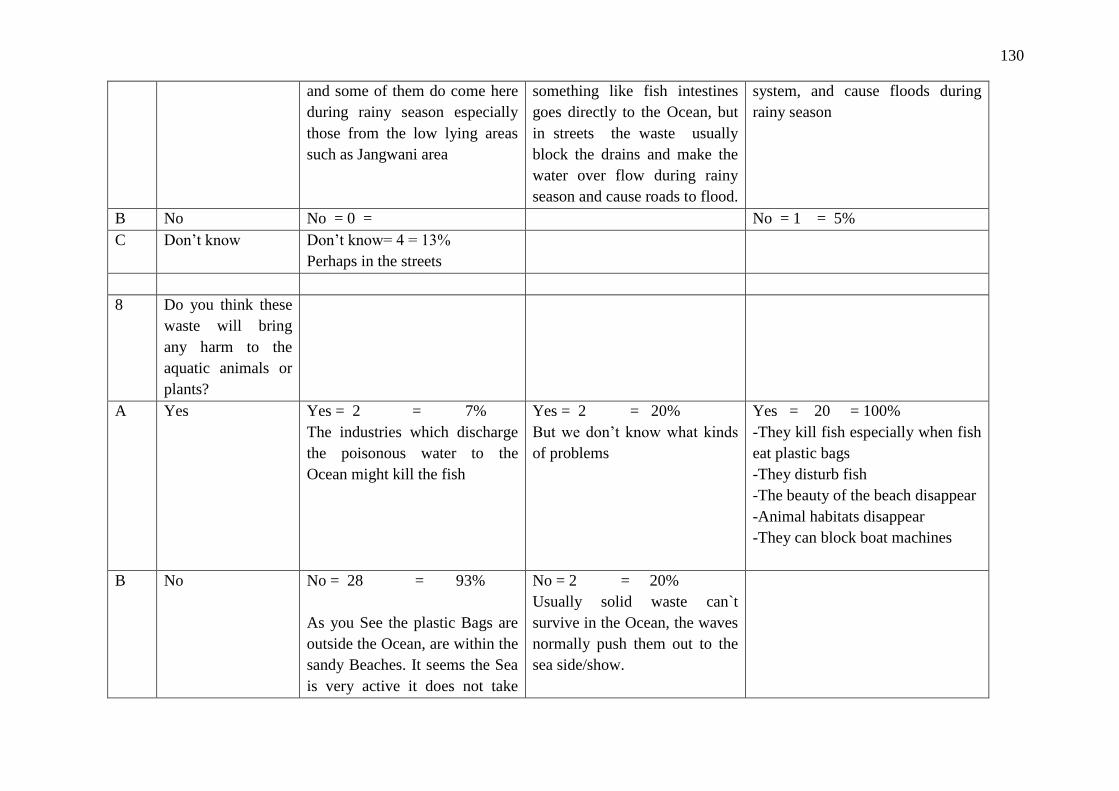
130
and some of them do come here
during rainy season especially
those from the low lying areas
such as Jangwani area
something like fish intestines
goes directly to the Ocean, but
in streets the waste usually
block the drains and make the
water over flow during rainy
season and cause roads to flood.
system, and cause floods during
rainy season
B No No = 0 = No = 1 = 5%
C Don’t know Don’t know= 4 = 13%
Perhaps in the streets
8 Do you think these
waste will bring
any harm to the
aquatic animals or
plants?
A Yes Yes = 2 = 7%
The industries which discharge
the poisonous water to the
Ocean might kill the fish
Yes = 2 = 20%
But we don’t know what kinds
of problems
Yes = 20 = 100%
-They kill fish especially when fish
eat plastic bags
-They disturb fish
-The beauty of the beach disappear
-Animal habitats disappear
-They can block boat machines
B No No = 28 = 93%
As you See the plastic Bags are
outside the Ocean, are within the
sandy Beaches. It seems the Sea
is very active it does not take
No = 2 = 20%
Usually solid waste can`t
survive in the Ocean, the waves
normally push them out to the
sea side/show.

131
any type of waste. Whatever
goes in usually is spilt brought
out by Ocean waves particularly
when the ocean is coming again
after disappearing
C I don’t know = 0 = 0 I don’t know = 6 = 60%
We don’t really know, perhaps
health officers might have
accurate answers
9 How far do you
live from the Sea?
[To understand how their lives
are closely related with what
happens to the ocean.]
A Very Far Very far = 15 = 50% Very far = 16 = 80%
B Not very far Not very far = 11 = 37% Not very far = 6 = 60% Not very far = 4 = 20%
C Close to the Sea Close to the Sea = 4 = 13%
[Objective: Nearness to the
ocean one becomes acquainted
with the behaviour and what is
happening at the sea side.]
Close to the Sea = 4 = 40%
10 What is your
relationship with
the Ocean?
Fishing Fishing Fishing = 10 = 100%
Our livelihood dependent on
the ocean
Fishing = 3 = 15%

132
Boating Boating Boating
Working Working Working
Swimming Swimming = 22 = 73% Swimming = 6 = 30%
We like swimming
Water Sports Water Sports Water Sports
Other Other = 8 = 27%
Recreational purposes
Other
Recreational purposes = 11= 55%
Fishing Fishing
Boating Boating
11 What problems do
you think there are
in Indian Ocean?
You can choose 3
of them
A Eutrophication Eutrophication = 0
B Overfishing, illegal
fishing
Overfishing, illegal fishing =0 Overfishing, illegal fishing = 6 =
30%
C Recreational
boating
Recreational boating =0
D Industrial Pollution Industrial Pollution=0 Industrial Pollution = 1= 10%
I think so according to what
you told us
Industrial Pollution = 8 = 40%
E Oil Spills Oil Spills=0
F Air Pollution Air Pollution=0
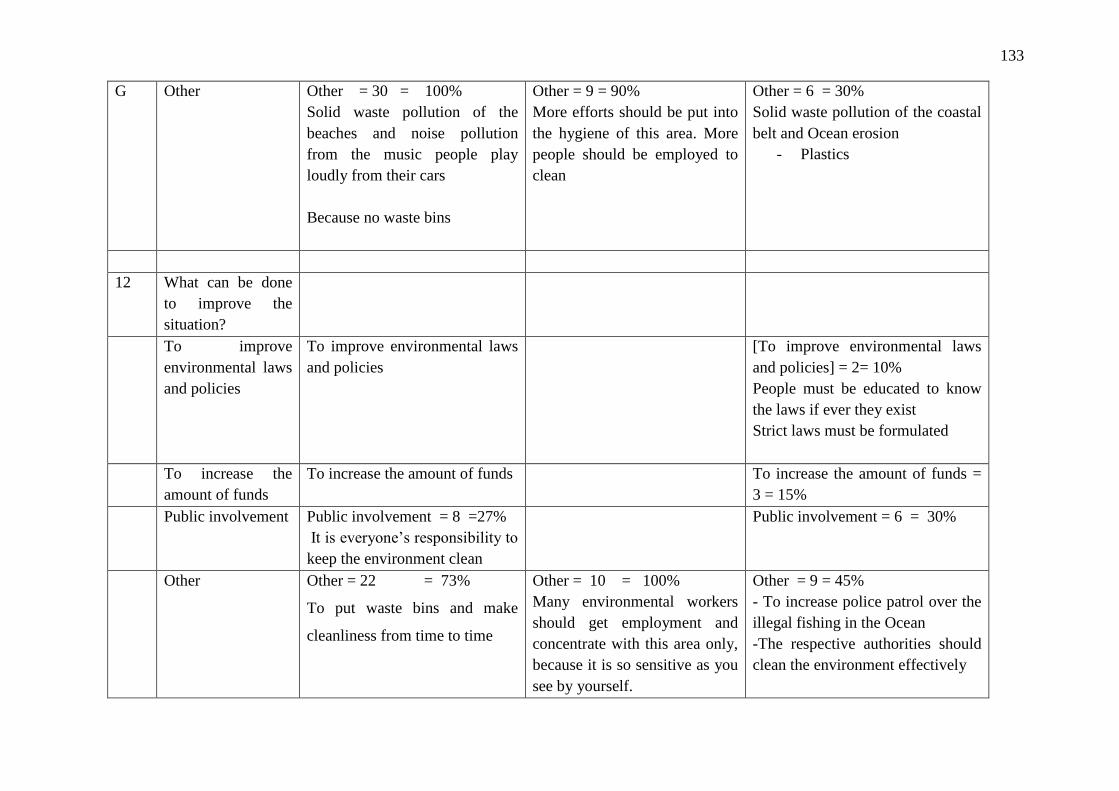
133
G Other Other = 30 = 100%
Solid waste pollution of the
beaches and noise pollution
from the music people play
loudly from their cars
Because no waste bins
Other = 9 = 90%
More efforts should be put into
the hygiene of this area. More
people should be employed to
clean
Other = 6 = 30%
Solid waste pollution of the coastal
belt and Ocean erosion
- Plastics
12 What can be done
to improve the
situation?
To improve
environmental laws
and policies
To improve environmental laws
and policies
[To improve environmental laws
and policies] = 2= 10%
People must be educated to know
the laws if ever they exist
Strict laws must be formulated
To increase the
amount of funds
To increase the amount of funds To increase the amount of funds =
3 = 15%
Public involvement Public involvement = 8 =27%
It is everyone’s responsibility to
keep the environment clean
Public involvement = 6 = 30%
Other Other = 22 = 73%
To put waste bins and make
cleanliness from time to time
Other = 10 = 100%
Many environmental workers
should get employment and
concentrate with this area only,
because it is so sensitive as you
see by yourself.
Other = 9 = 45%
- To increase police patrol over the
illegal fishing in the Ocean
-The respective authorities should
clean the environment effectively
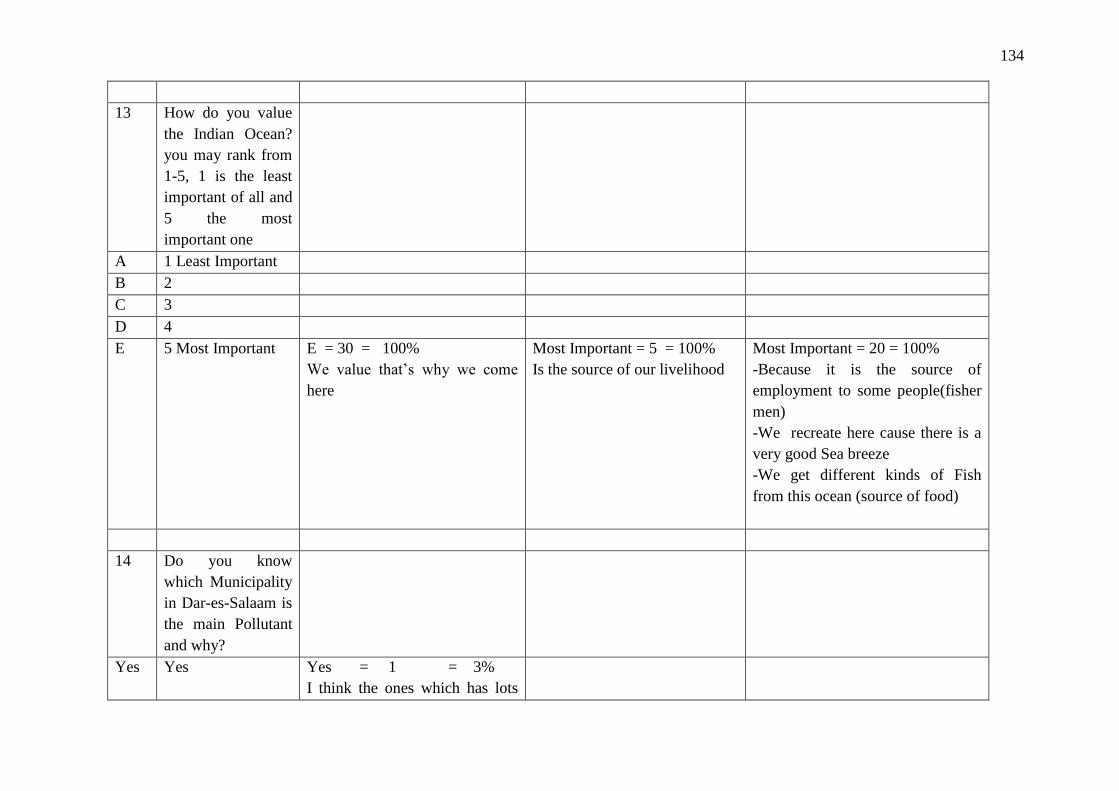
134
13 How do you value
the Indian Ocean?
you may rank from
1-5, 1 is the least
important of all and
5 the most
important one
A 1 Least Important
B 2
C 3
D 4
E 5 Most Important E = 30 = 100%
We value that’s why we come
here
Most Important = 5 = 100%
Is the source of our livelihood
Most Important = 20 = 100%
-Because it is the source of
employment to some people(fisher
men)
-We recreate here cause there is a
very good Sea breeze
-We get different kinds of Fish
from this ocean (source of food)
14 Do you know
which Municipality
in Dar-es-Salaam is
the main Pollutant
and why?
Yes Yes Yes = 1 = 3%
I think the ones which has lots

135
of markets which generate a
great deal of waste
No No No = 0 = 0 No = 10 = 100%
Yes I don’t know I don’t know = 29 = 97%
You must make your own
investigation
15 Do you do
something to
Improve the state of
the Ocean?
A Yes Yes = Yes = 10 = 100%
We try to clean whenever we
finish our activities over this
place, as well as reminding one
another about it;
Observation: They clean their
work place- cement floor
Yes = 2 = 10
I think the ones who are not within
the City Center (Kinondoni and
Temeke)
B No No = 26 = 87%
-We only come here during
weekends, how we can do that.
-There are some people who are
paid for that why should I bother
myself
No = 18 = 90%
We can’t say without making
research
C Other Other = 4 = 13%
16 How do you
become aware of
[A general question left to the
respondent to decide which
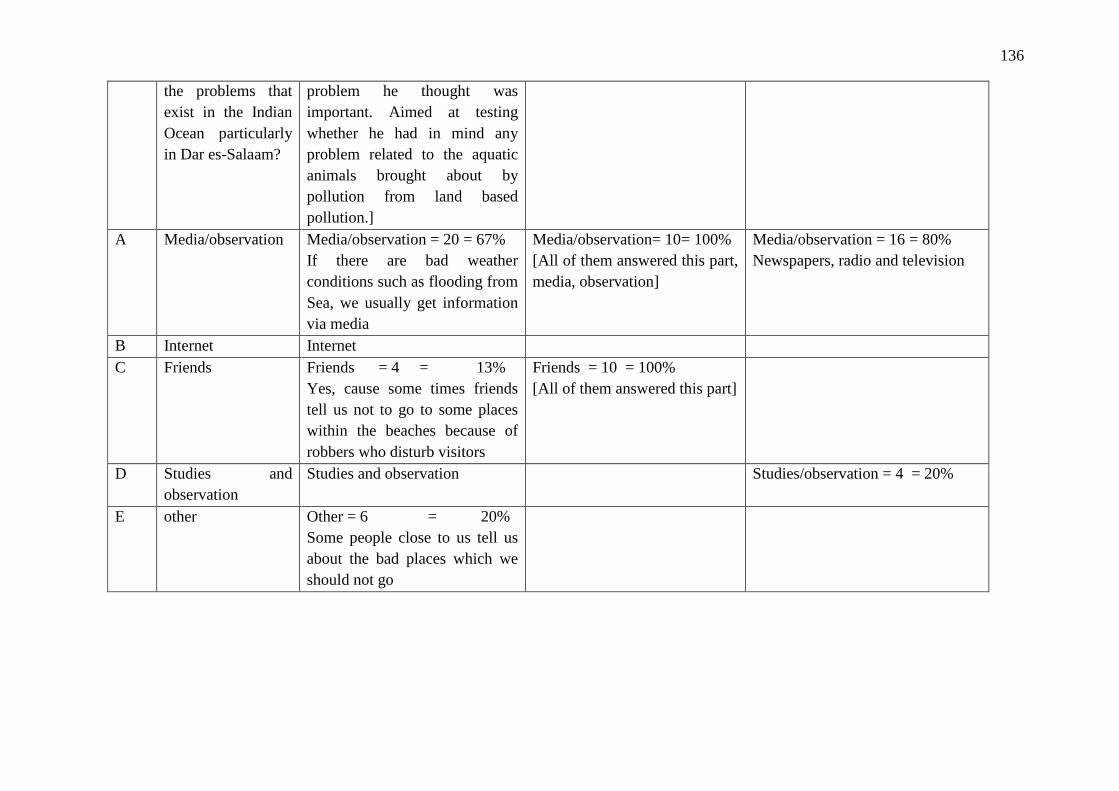
136
the problems that
exist in the Indian
Ocean particularly
in Dar es-Salaam?
problem he thought was
important. Aimed at testing
whether he had in mind any
problem related to the aquatic
animals brought about by
pollution from land based
pollution.]
A Media/observation Media/observation = 20 = 67%
If there are bad weather
conditions such as flooding from
Sea, we usually get information
via media
Media/observation= 10= 100%
[All of them answered this part,
media, observation]
Media/observation = 16 = 80%
Newspapers, radio and television
B Internet Internet
C Friends Friends = 4 = 13%
Yes, cause some times friends
tell us not to go to some places
within the beaches because of
robbers who disturb visitors
Friends = 10 = 100%
[All of them answered this part]
D Studies and
observation
Studies and observation Studies/observation = 4 = 20%
E other Other = 6 = 20%
Some people close to us tell us
about the bad places which we
should not go

137
I: Beach Goers
(1) Venue: Coco beach: Kinondoni Municipality
(2) Observation: Solid wastes scattered all over the beach. Juice plastic containers
(paper), coconut shells (madafu), plastic bottles; wrapping; plastic bags; sponges-
washed ashore by sea tides; wine bottles; pray cans; ice cream containers.
(3) Mode of interview: Group interviews- of clusters of 10.
(4) Date: End of October;
(5) Two days: Saturday and Sunday
II: Fishermen; At Kivukoni Fish Market
Along the beach plastic bags stuffed with solid wastes- scattered small piles along the
beach.
Purpose: (1) To find out how far they protect the marine environment.
(2) To determine their awareness of the importance of wastage management to society and
their individual economy (livelihood) and their effect on human health and aquatic
animals.
(3) I wrote the questions in English but while I was interviewing them I was translating the
questions into Kiswahili and left to them to answer in English. Used as a semi-structured
interview.
(4) Mode of the Interview was group discussion.
(5) To take
(6)Venue: Kivukoni Fish Market, Dar-es-Salaam.
(7) Time Taken: 2-3 Hours.
(8) Date: 3/12/2013 at about 2.00 pm.
III: IFM STUDENTS;
(1) Venue: Anti erosion embankments at the Dar-es-Salaam, sea side; every day they
sit there in group discussions.

138
(2) Mode of interview; I asked all 20 to gather together.
(3) Time taken; 2 hours.
(4) Interview guide-written in English
(5) Interviewed: I read the interview questions in English. Respondents answered both
in Swahili and English.
(6) Date: November, 2013.

139
Appendix IV
RESULTS FROM QUESTIONNAIRE FOR A WASTE MANAGEMENT COMPANY
AND CBO STAFF
Questioner with 3 waste management company workers at Kariakoo Market
1. What challenges do you encounter within your work?
-Low wages, you can imagine I receive Tsh 100,000/= per month, I do this job cause I have
no alternative.
-We are not well equipped in order to protect ourselves against disease, we are told to change
our names in every month in order to be seen as new employers, who are in probation period;
the guys are just avoiding Tanzanian law which says after sixth months at work you should
get permanent employment
2. What made you to work with waste management?
I normally choose any available job to do, but we don’t get any motivation, it’s real
discouraging for sure, we don’t have zeal to do this job at all, because of that.
3. What have you done to stand up for your right?
-We are little guys here we can do nothing, we are so grateful for your visit as a researcher
here, you should expose these evil activities done to us.
RESULTS FROM QUESTIONNAIRE FOR MR. MOHAMED KATOMA, HEAD OF
A COMMUNITY ORGANIZATION-THE HYGIENE TECHNICIAN
ENVIRONMENTAL GROUP AT BUGURUNI KISIWANI WARD.
1. What challenges do you encounter within your work?
-We don’t have good environmental equipments, such as motor bikes with trailers instead
we have “mikokoteni” (hand drawn carts) which are powered by human beings; however
they cannot go many trips.
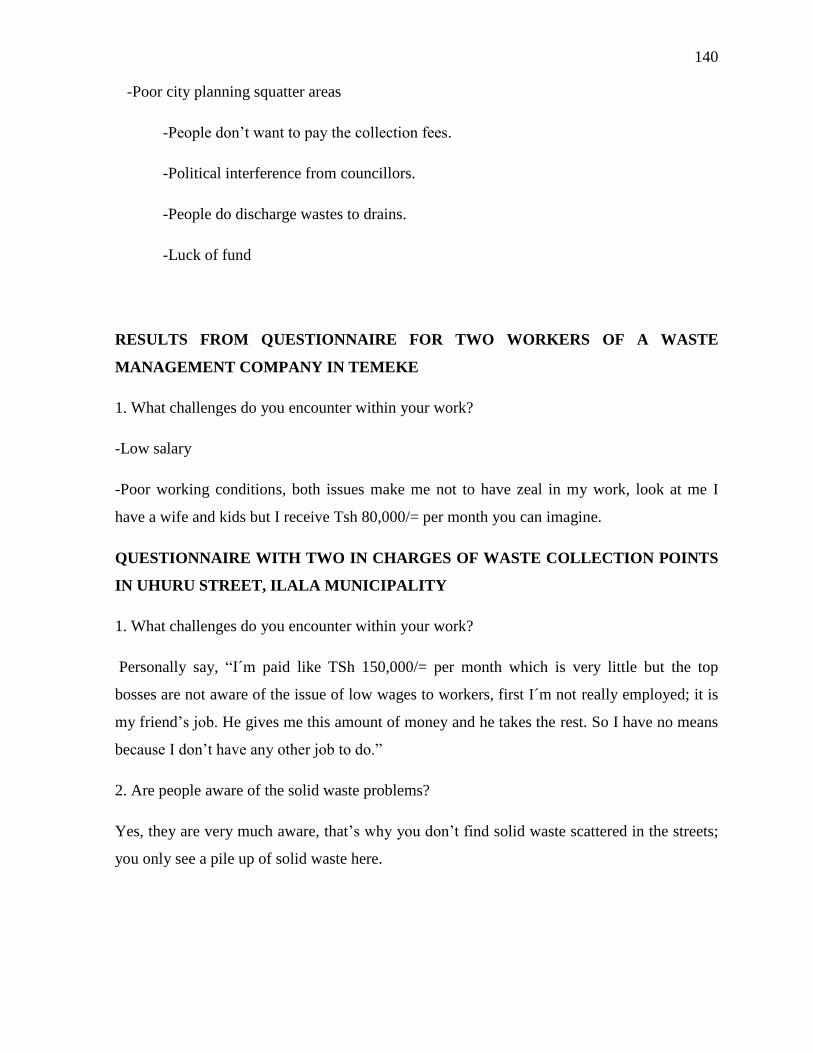
140
-Poor city planning squatter areas
-People don’t want to pay the collection fees.
-Political interference from councillors.
-People do discharge wastes to drains.
-Luck of fund
RESULTS FROM QUESTIONNAIRE FOR TWO WORKERS OF A WASTE
MANAGEMENT COMPANY IN TEMEKE
1. What challenges do you encounter within your work?
-Low salary
-Poor working conditions, both issues make me not to have zeal in my work, look at me I
have a wife and kids but I receive Tsh 80,000/= per month you can imagine.
QUESTIONNAIRE WITH TWO IN CHARGES OF WASTE COLLECTION POINTS
IN UHURU STREET, ILALA MUNICIPALITY
1. What challenges do you encounter within your work?
Personally say, “I´m paid like TSh 150,000/= per month which is very little but the top
bosses are not aware of the issue of low wages to workers, first I´m not really employed; it is
my friend’s job. He gives me this amount of money and he takes the rest. So I have no means
because I don’t have any other job to do.”
2. Are people aware of the solid waste problems?
Yes, they are very much aware, that’s why you don’t find solid waste scattered in the streets;
you only see a pile up of solid waste here.