improving quality, timeliness and efficacy of data ... · improving quality, timeliness and...
TRANSCRIPT
Improving quality, timeliness and efficacy of data collection and
management in population-based surveillance of vital events
INAUGURALDISSERTATION zur
Erlangung der Würde eines Doktors der Philosophie
vorgelegt der Philosophisch-Naturwissenschaftlichen Fakultät
der Universität Basel
von
Aurelio Di Pasquale aus Italien
Basel, 2018
Original document stored on the publication server of the University of Basel
edoc.unibas.ch

1
Genehmigt von der Philosophisch-Naturwissenschaftlichen Fakultät auf Antrag von Prof. Dr. Marcel Tanner, Prof. Dr. Thomas Smith, Dr. Nicolas Maire, Prof. Dr. David Schellenberg
Basel, 27.03.2018 Prof. Dr. Martin Spiess Dekan
2
Alla mia meravigliosa Famiglia

3

4
Table of Contents
List of Figures ........................................................................................................... 8
List of Tables ........................................................................................................... 10
Acknowledgements ................................................................................................. 11
Summary ................................................................................................................. 13
Zusammenfassung .................................................................................................. 16
Abbreviations .......................................................................................................... 19
1. History of Health and Demographic surveillance systems, data systems, and
advances in data collection: using database servers and electronic data capture ................ 22
Abstract ................................................................................................................... 23
Background ......................................................................................................... 23
Implementation .................................................................................................... 23
Conclusions ......................................................................................................... 23
Keywords ................................................................................................................ 24
Background ............................................................................................................. 25
Vital statistics and the need for health planning ................................................... 25
History of Health Demographic Surveillance Systems (HDSS) ............................ 26
HDSS operations ................................................................................................. 28
Development of data systems within INDEPTH ................................................... 29
The requirements of a new data management system ............................................ 33
The OpenHDS Data System ................................................................................ 35
Field data collection with OpenHDS ......................................................................... 39
Use cases: evidence from the field ............................................................................ 41
Conclusion .............................................................................................................. 44
Competing interests ................................................................................................ 44
Funding ................................................................................................................... 44
Acknowledgements ................................................................................................. 44
References .............................................................................................................. 45
2. Innovative Tools and OpenHDS for Health and Demographic Surveillance on
Rusinga Island, Kenya ......................................................................................................... 51
Abstract ................................................................................................................... 52
Background ......................................................................................................... 52
Methods ............................................................................................................... 52
Results and discussion ........................................................................................ 52
Key words: ........................................................................................................... 52

5
Background ............................................................................................................. 53
Methods .................................................................................................................. 56
Study location and population .............................................................................. 56
Data collection system ......................................................................................... 57
Data collection rounds ......................................................................................... 59
Data quality and management ............................................................................. 64
Ethical clearance ................................................................................................. 65
Results and Discussion ........................................................................................... 65
Resource allocation ............................................................................................. 65
Time and organizational efficiency ....................................................................... 66
Data quality assurance ........................................................................................ 68
Challenges and future research ........................................................................... 69
Conclusion .............................................................................................................. 70
Competing interests ................................................................................................ 70
Authors’ contribution ............................................................................................... 70
Acknowledgements ................................................................................................. 71
References .............................................................................................................. 72
3. Profile: The Rusinga Health and Demographic Surveillance System, Western
Kenya .................................................................................................................................. 75
Abstract ................................................................................................................... 76
Why was the HDSS set up? .................................................................................... 77
Where is the HDSS area? ....................................................................................... 78
Who is covered by the HDSS and how often have they been followed up? ............. 80
What has been measured and how have the HDSS databases been constructed? 81
Key findings ............................................................................................................ 84
Future analysis plan ................................................................................................ 89
What are the main strengths and weaknesses of the Rusinga HDSS? .................... 89
Data sharing and collaboration ................................................................................ 90
Funding ................................................................................................................... 90
Acknowledgements ................................................................................................. 90
Conflict of interests .................................................................................................. 90
KEY MESSAGES .................................................................................................... 90
References .............................................................................................................. 92
4. Assessing the population coverage of an Health Demographic Surveillance
System using satellite imagery and crowd-sourcing ............................................................. 94
Abstract ................................................................................................................... 95

6
Introduction ............................................................................................................. 96
Methods .................................................................................................................. 97
Population ........................................................................................................... 97
Data System ........................................................................................................ 97
Field data collection ............................................................................................. 98
Volunteered locations ........................................................................................ 100
Ground truthing ..................................................................................................... 103
Ethical consideration ............................................................................................. 105
Results .................................................................................................................. 106
Discussion ............................................................................................................. 110
Acknowledgements ............................................................................................... 113
References ............................................................................................................ 114
5. Migrating an established DSS site to OpenHDS: evidence for improved
quality/timeliness and cost ................................................................................................. 117
Introduction ........................................................................................................... 118
Methods ................................................................................................................ 119
Data Quality ....................................................................................................... 121
Costing .............................................................................................................. 124
Results .................................................................................................................. 127
Discussion ............................................................................................................. 134
References ............................................................................................................ 137
6. General discussion ..................................................................................................... 140
Summary of results ............................................................................................... 140
The way forward for the system ............................................................................ 147
References ............................................................................................................ 150
Curriculum vitae ................................................................................................................. 152

7

8
List of Figures
Figure 1.1: Schematic of an HDSS (source INDEPTH Network). ................................ 26
Figure 1.2: Countries and HDSSs members of the INDEPTH Network. ...................... 27
Figure 1.3: Reference Demographic Surveillance Data Model. (source: Ref 8) ........... 31
Figure 1.4:. OpenHDS and ODK platforms structure and interaction. .......................... 36
Figure 1.5: OpenHDS database schema. ................................................................... 37
.Figure 1.6: OpenHDS mobile application snapshot of Login screen. .......................... 40
Figure 1.7: Zoom on Rusinga Island in Lake Victoria, Kenya ...................................... 41
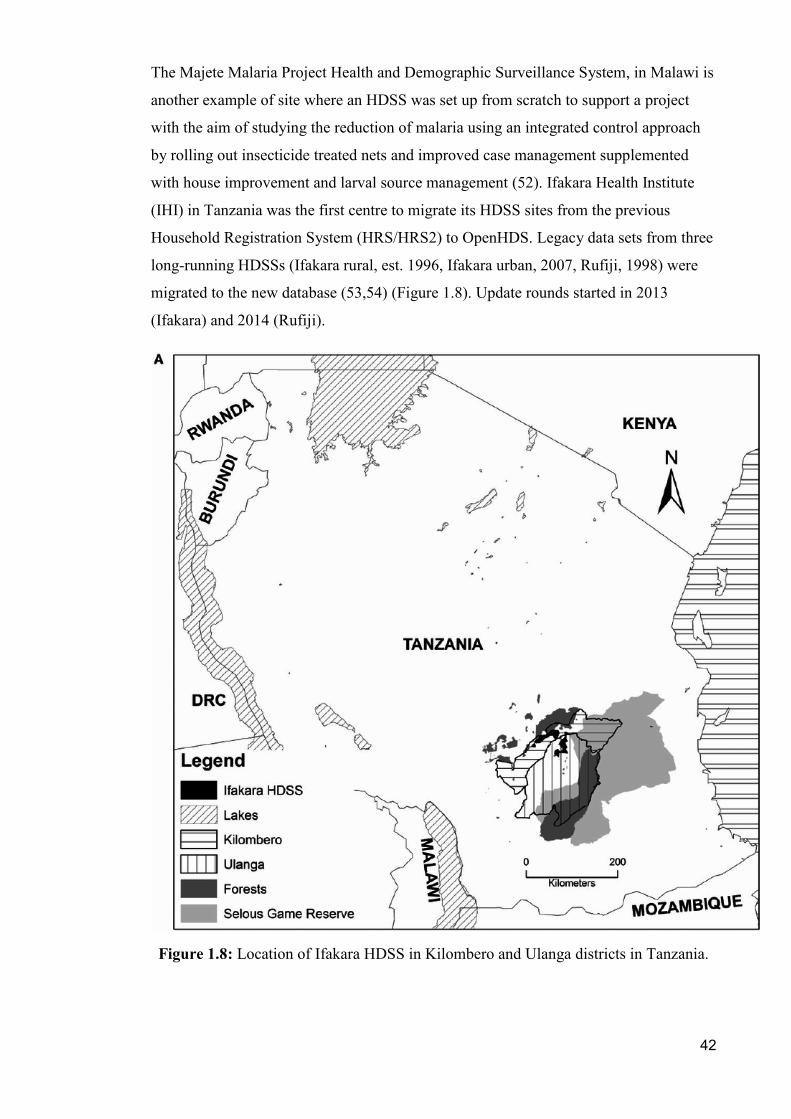
Figure 1.8: Location of Ifakara HDSS in Kilombero and Ulanga districts in Tanzania. . 42
Figure 2.1 Study site: Africa with Kenya highlighted dark grey; in the right upper corner
Kenya with Homa Bay County highlighted; Homa Bay County with Rusinga Island
tinted in dark grey. ...................................................................................................... 56
Figure 2.2: Data pathways using the ODK and OpenHDS platform: Electronic
questionnaires are created uploaded to the computer tablets by the ODK server.
Wireless synchronization of digitalized data collected at the point of capture is
transferred to the central data store based on the ODK server. Cleaned data is
transferred to the OpenHDS server that in turn synchronizes the up to date database to
the computer tablets. .................................................................................................. 58
Figure 2.3: Project sticker with barcode on the doorpost of a house: Barcode scanning,
integrated into the mobile data collection, allows quick identification of locations and
study population to add or amend health and demographic information. ..................... 60
Figure 2.4: Navigating assigned houses: Converting the up to date population database
into a geodatabase displayed with Google Maps Mobile assists fieldworkers with
tracking every house. .................................................................................................. 63
Figure 3.1: The upper Figure shows Africa with Kenya highlighted dark grey in the
middle, Kenya with Homa Bay County highlighted; lower Figure depicts Homa Bay
County with Rusinga Island in dark grey. .................................................................... 78
Figure 3.2: Rusinga Island with an uninhabited hill in the middle. Boundaries of
metaclusters (thick black lines); villages (indicated with dots); roads (dashed lines). .. 79
Figure 3.3: Population pyramid of Rusinga Island with the percent of people illustrated
per age category. ........................................................................................................ 81
Figure 3.4: Distribution of population density on Rusinga Island for the year 2013. .... 86
Figure 4.1. Map showing Majete Wildlife Reserve, surrounded by 19 groups of villages
known as community-based organizations (CBO). The 62 villages enumerated in the
current study are located in three focal areas. Village populations are as indicated in
the legend (Reprinted with slight modification from Kabaghe et al 2017 under a CC BY
license, with permission from PLOS, original copyright 2017). .................................... 99
Figure 4.2. OpenHDS mobile application snapshot of location hierarchy selection. .. 100
Figure 4.3. Rural Geolocator: A web-application for identifying houses on satellite
images by visual inspection (illustrative purposes only). ........................................... 102
Figure 4.4. Overlay of crowd-sourced and ground-collected locations. Red pins denote
candidate locations for a visit during ground-truthing, i.e. volunteer-provided locations
without a GPS-collected match. Green pins are the location recorded as enumerated
houses by research assistants during household interviews. Yellow pins are
geolocations far from the census one but closer than 40m. ...................................... 104
Figure 4.5. Geographic distribution of volunteers who contributed to the geo-location of
buildings. .................................................................................................................. 107

9
Figure 4.6. Distribution of numbers of tasks contributed by volunteers. The bin labeled
“100+”, contains volunteers who completed 100 or more tasks. ............................... 108
Figure 5.1: OpenHDS System Architecture ............................................................... 119
Figure 5.2: Site maps. (A) Location of Burkina Faso in Africa and the Nanoro site area
in Burkina Central West region. (B) Nanoro Demographic Surveillance Area ............ 120
Figure 5.3: Time difference between data collection and data entering into the central
database in the two systems (HRS2 left, openHDS right) ......................................... 128
Figure 5.4: Demographic Rates comparison obtained through IShare2 .................... 131
Figure 5.5: Cost comparison details .......................................................................... 132
Figure 5.6: Total cost per input for openHDS ............................................................ 133
Figure 5.7: breakdown cost of the personnel involved in the HDSS .......................... 134

10
List of Tables
Table 1.1: Advantages and disadvantages using different technologies ..................... 38
Table 2.1: An individual health questionnaire administered to everyone enrolled in the
study. In the right column an example of an individual’s answer in bold. ..................... 61
Table 3.1: Content of questionnaires administered during the census and each follow up survey.
(*) data is collected only when a new subject is enumerated. (**) indicates that the questionnaire
is administered for all new residential structures, as well as every second year for all registered
residential structures. ..................................................................................................... 83
Table 3.2: Key demographic indicators over the years 2013 and 2014 on Rusinga
Island; compared with indicators reported during the Mbita HDSS in 2010 and the
KEMRI HDSS in 2007.(*)No in-migration rates reported for 2013. Catch-up
enumerations in the first months of 2013 enumerated households which were missed in
the baseline survey, and could therefore not reliably be distinguished from in-migration
events. ........................................................................................................................ 85
Table 3.3: Summary of house information collected over the year 2013. .................... 88
Table 4.1: Locations found on Satellite imagery ........................................................ 109
Table 4.2: Locations found in the HDSS census ....................................................... 109
Table 4.3: Classification of ground-truthed locations: 85 locations were visited after
census because the satellite image-sourced locations showed a potentially missed
house. ....................................................................................................................... 110
Table 5.1 Table showing transition checks (source iShare2 Project)......................... 123
Table 5.2: Classification of routine HDSS costs by input type .................................. 125
Table 5.3: Breakdown of start-up costs ..................................................................... 127
Table 5.4: Cost components for the Survey management ......................................... 127
Table 5.5: Summary of time difference between data entry and the original visit date
................................................................................................................................. 128
Table 5.6: Round 15 Summary results of new record captured and duplications found
for HRS2 and openHDS ............................................................................................ 130

11
Acknowledgements This thesis was possible mainly thanks to the INDEPTH network, who have invested
substantial resources in the roll-out and support of the OpenHDS system in various
member sites. A big thanks goes to INDEPTH network and especially to Prof. Osman
Sankoh for their overarching views and input.
It is very difficult to thank all the other people who helped me through this fantastic
journey, each one in his/her own very special way but I’ll try, apologizing if I forget
someone.
I would really like first of all to say a big thanks to my supervisors Dr. Nicolas Maire
and Prof. Dr. Tom Smith, for the scientific support and guidance they have provided me
during my PhD studies. I started at Swiss Tropical and Public Health Institute (Swiss
TPH) in 2009 and they were since the beginning my mentors, in learning research and
the public health world.
I thank Prof. Dr. David Schellenberg for being my Co-Referee (Korreferent).
Thanks are not enough for Prof. Dr. Marcel Tanner for his leadership, friendship and for
providing the great opportunity to carry out my studies at Swiss TPH and to believe in
me from the first time we met. Without him not only I was not given this opportunity,
probably I will not be here in Switzerland since 2009.
I could not omit to mention all my colleagues I worked on in the field:
- The colleague at International Centre of Insect Physiology and Ecology (ICIPE)
in Mbita, Kenya
- All the Solarmal Team from the Wageningen University and Research Centre in
The Netherlands
- The Ifakara Health Institute (IHI) in Dar es Salaam and all the people in Ifakara
and Rufiji
- The colleagues in Nanoro at the Clinical Research Unit of Nanoro (CRUN).
- The colleagues in Malawi at the College of Medicine of Blantyre and at the
Majete region where the study was set up.

12
I would like to say thanks also to the Unit led from Prof. Smith at Swiss TPH:
Nakul Chitnis, Melissa Penny, Olivier Briet, Katya Galactionova, Flavia Camponovo,
Emilie Pothin, Don de Savigny, Michael Hegnauer, Daniel Mäusezahl, Fabrizio
Tediosi, Daniel Cobos, Paola Salari, Sabine Renngli. I thank you all for the scientific
talks and discussions, the moral support and for the good moments we spent together.
Special thanks to Meike Zuske for translating the summary into German.
Special thanks also to Christine Mensch and her colleagues in the Teaching and
Training office for their assistance with all issues regarding my PhD training at the
University of Basel. Thanks to Christine Walliser, Margrith Slaoui, Laura Innocenti and
Dagmar Batra for assisting with administrative issues. To Giovanni Casagrande and
other members of the library for their kind assistance needed for my thesis. I thank the
IT team for always, especially Philipp Petermann being available to provide technical
assistance. Thanks to friends, colleagues, fellow students, and those who made my life
outside home comfortable! These include: Ronaldo Scholte, Federica Giardina, Michael
Bretscher and Emmanuel Schaffner.
Special thanks to my parents for their sacrifices and unconditional love. Without them I
would not have been where I am today. To my brothers Davide and Fausto for always
being there for me and always encouraging me.
And of course a super thanks to my wife Ana, for supporting me every time I was
demotivated and for her enormous patience with me, with my change of humor and my
nervous periods especially in the last months. Without her at my side I could not
achieved this.
And to my son Antonio, for every time he smiled at me making me forget any other
issue.

13
Summary
Electronic data collection (EDC), has become familiar in recent years, and has been
quickly adopted in many research fields. It has become commonplace to assume that
systems that entail entering data in mobile devices, connected through secure networks
to central servers are of higher standard than old paper based data collection systems
(PDC). Although the notion that EDC performs better than PDC seems reasonable and
is widely accepted, few studies have tried to formally evaluate whether it can improve
data quality, and none of these to our knowledge, are in the context of population-based
longitudinal surveillance.
This thesis project aims to assess the strength of OpenHDS, a system based on EDC,
used in the population-based surveillance of vital events via Health and Demographic
surveillance systems (HDSS). HDSS are both sources of vital event data and have the
potential to support health intervention studies in the areas where they operate. Setting
up and running an HDSS is operationally challenging, and a reliable and efficient
platform for data collection and management is a basic part of it. There are often major
shortcomings in the data collection and management processes in running HDSS,
though these have not been extensively documented.
Recent technological advances, specifically the use of mobile devices for data
collection, and the adoption of OpenHDS software for data management, which makes
use of best practices for data management, appear to have the potential to resolve many
of these issues. The INDEPTH Network and others have invested substantial resources
in the roll-out and support of OpenHDS, and there is anecdotal evidence that this has
resulted in improvements, but there is considerable demand for compelling evidence.
The Swiss Tropical and Public Health Institute (Swiss TPH) has supported some
INDEPTH sites to fully migrate to OpenHDS (Ifakara and Rufiji in Tanzania, Nanoro in
Burkina Faso, Manhiça in Mozambique and Cross river in Nigeria) and some are in the
migration process (7 sites in Ethiopia: Arba Minch, Butajira, Dabat, Gilgel Gibe, Kersa
and Kilite Awlaelo). Some other sites are at different stages of evaluating the possibility
of adopting OpenHDS (Navrongo in Ghana, Niakhar in Senegal, Iganga/Mayuge in
Uganda, Nouna in Burkina Faso, Birbhum in India etc.) and there is a demand from all
of them for evidence of the benefits of adopting this system. Demonstration of the
appropriate functioning of the OpenHDS is also highly relevant in the light of recently
proposed approaches for comprehensive health and epidemiological surveillance

14
systems. Such systems will need to satisfy requirements in terms of data availability and
integration which are considerable higher than in a classical HDSS.
This project assesses the benefits of OpenHDS in terms of and how the advances in data
collection and management translate into improved data quality and timeliness. It asks
whether the system architecture of the novel data management system can be further
exploited to enable data integration approaches for near time quality control and near
time response triggers. It also considers what are the main challenges in implementing
such technologies in a new or an existing HDSS.
This entails:
A description of the new system and of a set of conjectured data management
best practices. For each of these best practices there is a literature review to
assess if there is evidence to support it and if OpenHDS follow these practices,
giving evidence of how this can be feasible and implemented in the field in two
different real-life scenarios: the setting up of a new HDSS (Rusinga Island,
Western Kenya and Majete Malaria Project, southern Malawi); and the
migration of existing HDSSs (Ifakara, Tanzania and Nanoro, Burkina Faso) to
OpenHDS. (Chapter 1)
Describing a novel approach for data collection and management in health and
demographic surveillance designed to address the shortcomings of the traditional
approach (OpenHDS) and documenting the usage of this system the
establishment of a new HDSS (Rusinga) in Chapter 2 and 3.
Evaluating innovative approaches for quality control measures that are made
possible by the novel data system architecture (in particular, use of satellite
imagery to assess completeness of populations, using Majete HDSS as an
example) in Chapter 4.
Studying the potential benefits of electronic data collection (compared with
paper) in terms of quality, timeliness, and costs by comparing both in a
contemporaneous comparison of different systems in 8 villages in Nanoro,
Burkina Faso and using historical comparisons of data quality (as assessed by
iSHARE2) before and after migration to OpenHDS for a range of INDEPTH
sites in Chapter 5.
A series of analyses were carried out to demonstrate that the OpenHDS data system for
HDSSs can be implemented in both existing or newly established sites in low- and

15
middle-income countries, and to test the hypothesis that the system is superior to
previous approaches with regard of quality and timeliness of data and running costs of
the system. This involved describing the novel approach to data collection and
management enabled by OpenHDS, evaluating benefits in terms of quality and
timeliness of the data using the OpenHDS mobile electronic data system, and the cost of
electronic data collection (OpenHDS) vs. paper. It also involved evaluating the impact
on the quality of the data of near-time availability and the potential of the OpenHDS
system architecture for data integration for next-generation quality control and
surveillance-response applications.
This work demonstrates that OpenHDS is a system that manages data in a standard
reference format, using rigorous checks on demographic events, adding the flexibility to
introduce entire questionnaires, variables that a longitudinal study could require, and
that OpenHDS can take over old demographic surveillance systems with this new real-
time low-cost paperless technology opportunity to abandon old fashion research
systems, that remain in use in developing countries.

16
Zusammenfassung
Elektronische Datenerfassung (EDC) ist in den letzten Jahren populär geworden und
wurde schnell in vielen Forschungsbereichen eingeführt. Es wird generell
angenommen, dass Systeme, welche die Dateneingabe durch mobile Geräte
ermöglichen, und die durch sichere Netzwerke mit einem zentralen Servern verbunden
sind, eine höheren Datenqualität ermöglichen als papier-basierte Systeme zur
Datenerhebung (PDC). Obwohl diese Annahme vernünftig erscheint und weitgehend
akzeptiert ist, haben nur wenige Studien überprüft, ob EDC die Datenqualität
tatsächlich verbessert. Unseres Wissens war keine dieser Studien im Kontext von
populations-basierten, longitudinaler Beobachtungsstudien angesiedelt.
Diese Dissertation beabsichtigt eine Bewertung der Stärken von OpenHDS, einem auf
EDC basierendem System, das zur Beobachtung der Bevölkerungsentwicklung in
Gesundheits- und Demographie Systemen (HDSS) eingesetzt wird. HDSS sind sowohl
eine Quelle für Daten über die Bevölkerungsentwicklung, als auch eine Unterstützung
für Studien zu Gesundheitsinterventionen in den Gebieten, in denen sie operieren. Das
Einrichten und Betreiben von HDSS sind operationell herausfordernd, und eine
zuverlässige und effiziente Plattform für das Erfassen und Verwalten von Daten ist eine
grundlegender Voraussetzung. Oft gibt es in HDSS gravierende Mängel in den
Prozessen des Erfassens und Managens der Daten, jedoch sind diese weitgehend
nicht dokumentiert.
Das Schweizerische Tropen- und Public Health Institut (Swiss TPH) unterstützt einige
Standorte des INDEPTH -Netzwerks in der vollständigen Migration zu OpenHDS
(Ifakara and Rufiji in Tanzania, Nanoro in Burkina Faso, Manhiça in Mozambique und
Cross river in Nigeria) und einige sind im Migrationsprozess (sieben Standorte in
Ethiopien: Arba Minch, Butajira, Dabat, Gilgel Gibe, Kersa und Kilite Awlaelo). Andere
Standorte sind noch in unterschiedlichen Etappen des Evaluationsprozesses
hinsichtlich der Einführung von OpenHDS (Navrongo in Ghana, Niakhar in Senegal,
Iganga/Mayuge in Uganda, Nouna in Burkina Faso, Birbhum in India etc.), und es
besteht die Nachfrage, die Vorteile der Einführung des Systems unter Beweis zu
stellen. Die Demonstration der angemessenen Funktionsfähigkeit von OpenHDS ist
auch hochgradig relevant angesichts kürzlich vorgeschlagener Ansätze zum Aufbau
umfassender Gesundheits- und epidemiologischer Beobachtungssysteme. Solche
Systeme müssen Anforderungen hinsichtlich Datenverfügbarkeit und -integration
genügen, die erheblich höher angesetzt werden, als in klassischen HDSS.

17
Dieses Projekt untersucht mögliche Vorteile von OpenHDS in Bezug auf
Verbesserungen in der Datenerfassung und –verwaltung, und wie sich diese in
verbesserte Datenqualität und Aktualität übersetzen. Es wird gefragt, ob die
Systemarchitektur des neuen Data Management Systems weiter genutzt werden kann,
um Ansätze der Datenintegration für die zeitnahe Qualitätskontrolle zu nutzen und
zeitnahe Reaktionen zu ermöglichen. Es berücksichtigt auch die grössten
Herausforderungen bei der Implementierung dieser Technologien in einem neuen oder
bestehenden HDSS.
Dieses Projekt beinhaltet das Folgende:
Eine Beschreibung des neuen Systems und einer Reihe bewährter Verfahren im
Datenmanagement. Für jedes dieser Verfahren erfolgt eine Literaturauswertung,
um zu bewerten, ob sie unterstützt werden, und ob OpenHDS diesen Verfahren
folgt, sofern der Nachweis besteht, wie sie ermöglicht, und implementiert
werden können im Rahmen zweier unterschiedlicher Anwendungsszenarien: a)
im Aufbau eines neuen HDSS (Rusinga Island, westliches Kenya und Majete
Malaria Project, südliches Malawi); und b) in der Migration von existierenden
HDSSs (Ifakara, Tanzania und Nanoro, Burkina Faso) zu OpenHDS (Kapitel 1).
Die Beschreibung eines neuen Ansatzes für die Erhebung und Verwaltung von
Daten in der Beobachtung von Gesundheit und Demographie, der darauf
ausgerichtet ist, die Mängel in den traditionellen Ansätzen anzusprechen und
den Nutzen dieses Systems im Aufbau eines neuen HDSS (Rusinga) in Kapitel 2
und 3 zu dokumentieren.
Eine Bewertung innovativer Ansätze in zur Qualitätskontrolle, die durch die
neue Datensystemarchitektur ermöglicht werden (insbesondere die Nutzung von
Satellitenbildern zur Erfassung der Population am Beispiel des Majete HDSS) in
Kapitel 4.
Die Untersuchung der potenziellen Vorteile der elektronischen Datenerfassung
(verglichen mit Papier) hinsichtlich Qualität, Verfügbarkeit und Kosten, in einer
zeitgleichen Gegenüberstellung der verschiedenen Systeme in acht Ortschaften
in Nanoro, Burkina Faso und über einen historischen Vergleich der Qualität der
Daten (wie von iSHARE 2 bewertet) vor und nach der Migration in OpenHDS
für eine Reihe von INDEPTH Standorte in Kapitel 5.
Eine Reihe von Untersuchungen wurden durchgeführt, um zu testen, ob das OpenHDS
Data System für HDSSs in bestehenden oder neu geschaffenen Standorten in Ländern

18
mit niedrigen und mittleren Einkommen implementiert werden kann. Weiter wurde
untersucht, ob das System besser als bisherige Ansätze ist hinsichtlich der Qualität
und Aktualität der Daten und die laufenden Kosten des Systems. Dies beinhaltet die
Beschreibung des durch OpenHDS ermöglichten neuartigen Ansatzes für die
Erfassung und die Verwaltung von Daten, die Bewertung allfälliger Vorteile in Bezug
auf die Qualität und die Aktualität der Daten, und die Kosten der elektronischen
Datenerfassung (OpenHDS) gegenüber Papier. Es beinhaltet auch die Bewertung der
Auswirkungen auf die Qualität der Daten hinsichtlich der zeitnahen Verfügbarkeit und
das Potenzial der OpenHDS Systemarchitektur für die Datenintegration mit neuen
Systemen zu Gesundheitsüberwachung.
Diese Arbeit zeigt auf, dass OpenHDS seinem Referenz-Datenformat die rigorose
Überprüfungen demographischer Ereignisse ermöglicht und darüber hinaus die
Flexibilität besitzt, ganze Fragebogen mit Variablen einzuführen, die eine
Langzeitstudie benötigen könnte, und dass OpenHDS mit seiner neuen Echtzeit-,
preiswerten, und papierlosen Technologie das alte demographische
Beobachtungssystem ablösen kann.

19
Abbreviations
API Application Programming Interface
CAB Community Advisory Board
CBR Crude Birth Rate
CDC Centers for Disease Control and Prevention
CDR Crude Death Rate
COMREC College of Medicine Research Ethics Committee
CRUN Clinical Research Unit of Nanoro
CRVS Civil Registration and Vital Statistics
DB Database
EDC Electronic Data Collection
FWM Fieldworker Manager
FWs Fieldworkers
GPS Global Positioning System
HDSS Health and Demographic surveillance systems
HRS Health Registration System
ICIPE International Centre of Insect Physiology and Ecology, Nairobi, Kenya
IDMP INDEPTH Data Management Programme
IHI Ifakara Health Institute, Dar es Salaam, Tanzania
INDEPTH International Network for the Demographic Evaluation of Populations
and their Health
IRS Indoor Residual Spraying
IRSS Institut de Recherche en Sciences de la Sante
KEMRI Kenyan Medical Research Institute
KML Keyhole Markup Language
LE Life Expectancy
LLIN Long Lasting Insecticidial Nets
LMIC(s) Low- and middle-income countries
LSHTM London School of Hygiene & Tropical Medicine
MDA Mass Drug Administration
M&E Monitor and Evaluation
MMP Majete Malaria Project
MoH Ministry of Health
MVR Majete Wildlife Reserve
NGO Non-Governmental Organizations
OBT Odour Baited traps s
ODK Open Data Kit
PDA Personal Digital Assistant
PDC Paper Data Collection
RBM Roll Back Malaria
RDBMS Relational Database Management System
RMP Rusinga Malaria Project
SOP Standard Operating Procedure
S&R Surveillance and Response
Swiss TPH Swiss Tropical and Public Health Institute
TFR Total Fertility Rate
UN United Nations

20
USM University of Southern Maine
VGI Volunteered Geographic Information
WHO World Health Organization
WURC Knowledge, Innovation and Technology Group, Wageningen University
and Research Centre, Wageningen, The Netherlands
ZAC Africa Centre for Health and Population Studies

21
Introduction: Description of the system

22
1. History of Health and Demographic surveillance systems,
data systems, and advances in data collection: using
database servers and electronic data capture Aurelio Di Pasquale*1,2, Donald de Savigny1,2, Marcel Tanner1,2,Kobus Herbst6 , Fred Binka7, Stephan Tollmann8,9, Osman Alimamy Sankoh3,4,5, Nicolas Maire1,2
1 Swiss Tropical and Public Health Institute, Basel, Switzerland
2 University of Basel, Basel, Switzerland
3 INDEPTH Network, Accra, Ghana
4 School of Public Health, Faculty of Health Sciences, University of the Witwatersrand, Johannesburg, South Africa
5 Faculty of Public Health, Hanoi Medical University, Hanoi, Vietnam
6 The Africa Centre for Population Health, UKZN, South Africa
7 University of Health and Allied Sciences, Ho, Ghana
8 USAID/Predict Program, Freetown, Sierra Leone
9 MRC/Wits Rural Public Health and Health Transitions Research Unit, School of Public Health, Faculty of Health Sciences, University of the Witwatersrand, Johannesburg, South Africa
Working paper

23
Abstract
Background
Health and Demographic surveillance systems (HDSS) can be a powerful source of
health information in geographic zones where a civil registration and vital statistics
system are not in place. HDSSs also play an essential role in supporting health
intervention studies in such areas (1). Setting up and running an HDSS is operationally
challenging, and a reliable and efficient platform for data collection and management is
a basic part of it. The data collection and management processes of HDSS have not been
extensively documented. This article reviews how, historically, HDSSs have tried to
address issues arising during the setup and running of these operation. Recent
Information Communication Technology (ICT) advances, specifically the use of mobile
devices for data collection, and the adoption of data management best practices can
potentially resolve many of these issues.
Implementation
We describe the OpenHDS system, for data collection and management of HDSS
designed to address the shortcomings of conventional approaches, and document the
usage of this system in two different real-life scenarios: the setting up of a new HDSS
(Rusinga Island, Western Kenya and Majete Malaria Project, southern Malawi); and the
migration of existing HDSSs (Ifakara, Tanzania and Nanoro, Burkina Faso) to
OpenHDS.
We start by describing a set of conjectured data management best practices, and for
each of these best practices we proceed with a literature review to assess if there is
evidence to support it and if OpenHDS follow these practices, giving evidence of how
this can be feasible and implemented in the field.
Conclusions
OpenHDS is a system that manages data in a standard reference format, transferrable to
different settings, using rigorous checks on data entry and demographic events, adding
the flexibility to introduce entire questionnaires and variables that a longitudinal study
could require. OpenHDS can substitute for older demographic surveillance systems that
do not properly address data management best practices, with a new technology that is
real-time and paperless, replacing outdated data systems in use today in low-income
countries.
24
Keywords
Health and demographic surveillance system, Mobile data collection, Data management
platform, Best practices for data management.
25
Background
Vital statistics and the need for health planning
Vital statistics are defined as the statistics on births, deaths, and relationships between
two individuals (marriages and divorces). They represent essential information for
health policy makers to assess population changes and evaluate the success of
intervention programs. Civil registration, a governmental system through which
authorities collect vital episodes which take place in their populations, usually represent
the most prevalent approach of gathering data on these events.
The UN has considered important vital statistics to set objectives and make social and
economic plans in a country and made recommendations on Civil Registration and Vital
Statistics (CRVS) since 1953; civil registration is defined as “the continuous,
permanent, compulsory and universal recording of the occurrence and characteristics of
vital events […] provided through decree or regulation in accordance with the legal
requirements of each country.”(2) A well-functioning CRVS system is made of three
components:
A component for the notification registration of vital events, which aside from
births and deaths can take into account neonatal deaths, marriages, and divorces.
Collecting these events creates records that represent personal legal documents
used by citizens to demonstrate fact over these events (e.g. age and identity)
A component should be able to produce verified transcriptions of these
documents, as needed by citizens
A component able to produce and disseminate vital statistics from the data
produced by the civil registration system.
The World Health Organization (WHO) has released a tool to provide standard reviews
of country practices CRVS practices (3). This WHO Guidance Tool can be a very
efficient way to assess the quality of CRVS operations; it identifies areas for
intervention within the system to improve the collection process.
In many LMICs in Africa, Asia and Oceania the vital registration and statistics systems
have serious deficiencies.(4) . Among other consequences, this frequently leads to a
very poor quality of population-based health statistics, despite the urgent need for
reliable epidemiological and demographic data to inform policy (5). Health
Demographic Surveillance Systems (HDSS) have been created to address this gap.

26
History of Health Demographic Surveillance Systems (HDSS)
A Demographic Surveillance Systems (DSS) is a community-based information system
that collects longitudinal data on core demographic events (births, deaths, and
migration) together with key health indicators at regular intervals within a defined
geographical area (Figure 1.1). DSSs have been put in place either to overcome CRVS
deficiencies, or as a basis to conduct clinical trials, or as more general purpose platforms
for population-based research (e.g. district health service delivery research, research
related to epidemics) (6,7) . They are mostly run by non-government organizations or
sometimes institutes associated with the Ministry of Health (MoH).
Figure 1.1: Schematic of an HDSS (source INDEPTH Network).
The DSS of Matlab (8) in Bangladesh, which began in 1963 was the first example of a
structured data system gathering demographic and health data on target population
samples. As part of the research program of the International Centre for Diarrheal
Disease Research, it is acknowledged as the biggest and longest-running DSS in the
world, it has made major contributions to global health research and development(9).
Evaluation of the potential of leveraging the experience of Matlab for research
platforms in Africa began in the late 1980s (9). This was the starting point of a project
that led to the International Network for the Demographic Evaluation of Populations
and their Health (INDEPTH).

27
A series of international meetings in the 1990s developed the concept of a network of
health research centres in low- and middle-income countries (LMICs) running DSSs1.
These led to the inauguration of INDEPTH at the 9-12 November 1998 meeting in Dar
es Salaam, Tanzania. Initially, it linked a few existing DSSs, with the Niakhar DSS in
Senegal being the oldest one in Africa (1962). INDEPTH is envisaged as a medium-
term effort to obtain CRVS information while government systems are developed, since
this is a problem with a very complex and difficult solution (not a short term time-
window). Since then there has been a steady growth in the number of sites in INDEPTH
sites (Figure 1.2) (10).
Figure 1.2: Countries and HDSSs members of the INDEPTH Network.
Since most INDEPTH sites work in the field of public health and evaluation of health
interventions, the letter “H” (for Health) was added to the acronym DSS. The rational to
setup a HDSS nowadays went also beyond the necessity to compensate the lack of
CRVS and new HDSSs has been implemented to strengthen the population based
research on specific area of interest to provide evidence-base for cost evaluation, policy
making and targeting of intervention programs, nevertheless improving the accuracy,
efficiency and effectiveness of health and health interventions(11). More recently the
terms of reference for these sites has further expanded with the concept of
1Meetings were hosted in University of the Witwatersrand in Johannesburg, South Africa, the London
School of Hygiene & Tropical Medicine in the UK, Heidelberg University in Germany; Rockefeller
Foundation, Bellagio, Italy, and then in Navrongo, Ghana,. Dar es Salaam, Tanzania.

28
Comprehensive Health and Epidemiological Surveillance System (CHESS) (12).
CHESS plan to be the container of demographic, epidemiological, mortality, morbidity,
clinical, laboratory, household, environmental, health systems, and other contextual
data, all linked by individual using unique electronic identifiers. At the same time they
should provide timely morbidity and mortality data of high quality. In practice this
requires a HDSS+ (an extended HDSS) that provides integration across population and
health facility data.
Recent years have also seen increasing emphasis from funders of HDSS sites on
efficient and timely sharing of data, or at least of data summaries, with potential users.
Linked to this there is a growing need for comparison between sites. This has led to the
INDEPTH Data Management Programme (IDMP, formerly known as iSHARE)
(13,14). INDEPTH administers the INDEPTH Data Repository with the goal of sharing
HDSS data globally.
HDSS operations
HDSSs depend strongly on continual community-based vigilance for vital event
registration and migration in and out from the area of surveillance, with high coverage
from a well-defined population base to gather accurate results about rates and trends. As
a consequence, setting up and running a HDSS poses an operational challenge, and a
solid and adequate platform for data collection and management is a fundamental
requirement.
Setting up an HDSS entails first defining the target study area. These usually correspond
to an administrative unit, with a total populations between 50,000 and 100,000 people
(15). A census is then carried out to capture basic demographic information on all
individuals and the locations/households where they reside.
The initial census attaches unique identifiers to all the individuals and
locations/households (referred to as enrolled entities) that are included, in a way that
makes it feasible to expand it in the future in case of new entities entering the study
area. Since the INDEPTH Network was established, the technology and methods to
acquire and use geographical data have progressed substantially, and geo-localization of
physical entities is a common feature. INDEPTH has made some attempts to provide
standard definitions for identifiers as much this can be done by supplying a resource kit
for HDSS design (5,10).

29
Once the HDSS is set up, there is a need to follow-up the population through regular
update visits to all the physical entities in the defined area. Multiple visits (also called
observations) are carried out each year to each physical location where individuals
reside to update the defined core parameters, which including births, and deaths,
pregnancies and pregnancy outcomes. Changes of residence, including movements
within the area, immigration from outside and departures from the monitored area, are
also recorded. The central database, initially populated only with the baseline census
data, is thus updated regularly with demographic events recorded as they happen. The
date of visits to each household should also be recorded as this is required for
computation of denominators for various demographic rates.
The visit updates constitute the majority of the continuing activity of running an HDSS,
and careful planning of the number of field staff needed for acceptable data quality is
required, taking into account the number of update rounds each per year needed to avoid
missing events (especially pregnancy outcomes and neonatal deaths)(16).
Development of data systems within INDEPTH
The maintenance of adequate data quality for HDSSs is challenging, and the
institutional development of INDEPTH was accompanied by developments in data
systems, as the scale of the challenges became apparent, and as technologies became
available to address them. The Matlab software system, called the Sample Registration
System (SRS) (17) was too site specific to be adopted in other locations (no core data
was defined and data collected were aligned with the needs of the specific objective of
calculating cause-specific mortality profiles in the area). This system illustrated the
challenge for software development of designing a transferable software data system for
such applications.
Maintaining an up to date denominator population by tracking all these events is a very
onerous duty for most HDSSs, and different methods are employed. Typically a
relational database management system (RDBMS) with some schema to capture the
longitudinal characteristic of the HDSS data and to manage the potential high number of
data points accumulated during long time periods is used. The RDBMS must be able to
record and track relationships, social groups with their members, residences of
individuals in various locations, “status” of an individual in time, and all of the events
required to delineate the population dynamics.

30
A conceptual data model that addressed some of these challenges was agreed at a
meeting in London in 1997 and commonly referred to as the INDEPTH Reference Data
Model (18). It uses the concepts of events and episodes taken from the 1996
Demographic Evaluation of Health Programs (19) as the basis of field procedures and
corresponding software implementations for recording longitudinal data. Events
correspond to the entry or exit of an individual from a location or state and the term
episodes is used to refer to the pair formed by a start event and an end event in the same
individual and location (or state). The episode thus defines how the individuals enter
(birth, in-migration episode) or exit the study area (death. out-migration episode) and
how individuals are related between themselves (e.g marriage relationship episode) and
in the “society” (membership episode) (20) (Figure 1.3).

Figure 1.3: Reference Demographic Surveillance Data Model. (source: Ref 8)

The database is augmented with application logic to support appropriate field and data
entry processes, along with business logic to enforce data validity constraints.
Navrongo in Ghana, one of the longest standing INDEPTH sites which was set up in
1992(21), pioneered the adoption of HRS(22), which was a DOS-based data system
written in an early version of the RDBMS FoxPro. The first version of HRS did not
have a concept of residency (the fact of an individual staying in a location) or
membership (the role of an individual in a household and his relationship with the head
of the household). Residency was inferred from census, births, deaths, and migrations.
These limitations became evident rather quickly, and the second version of HRS (HRS
2), written in Microsoft Foxpro v2.5(22) used the INDEPTH Reference Data Model,
expanding what could be modeled (e.g. non-resident individuals) by including the
concepts of residencies and memberships, and making validation/consistency logic
easier.
A number of other INDEPTH members adopted HRS2, which remained the standard
software for tracking events and episodes for the following two decades. Several major
challenges remained. One was in achieving high quality and timely availability of data.
Linking vital episodes to individuals is only possible if these are identifiable. It is
challenging to correctly associate events if individual records are not available to the
field enumerator at the time of a visit to a household, and correctly linked to the visited
location and household. Until recently, HDSS systems relied on paper-based data
collection with subsequent data entry into an electronic database. This often lead to
long delays between the time of collection and the availability of data in a form that is
accessible to HDSS supervisory staff, and was vulnerable to transcription errors,
especially since most HDSS did not implement double data entry. Many sites used
stand-alone personal computers for data processing, introducing challenges in
synchronization of data entered on different machines. All this made timely
identification and correction of inconsistencies and other errors extremely challenging.
Hardware and software able to address these challenges were developed and evolved.
Client-server based RDBMS were an important technological advance which was
implemented in some sites, to improve the efficiency of manual data processing and to
reduce error rates. With the availability of low-cost mobile communication and
computing devices (e.g. smart phones and tablet computers), there are now a number of

33
electronic data collection (EDC) technologies that allow direct entry of data at the point
of collection, and aggregation of these data in a central location with little delay. EDC
found its way into HDSS routines in some member sites of INDEPTH, but these
technologies could not easily be interfaced with HRS2.
In addition to the need to interface with state-of-the-art EDC technologies many sites
now face other issues linked to the continuing use of obsolescent data management
systems. Not only has updating of HRS and other data management applications been
limited, but many of these were built on technologies that are now heavily outdated, and
in some cases no longer supported by the manufacturers of proprietary RDBMS(23) for
instance, Foxpro is no longer supported by Microsoft.
Many sites have legacy datasets that are essentially undocumented and not well
integrated with the current core HDSS dataset (24). The ancillary data required as part
of CHESS, are also likely be captured and stored using systems that use different
technologies from that of the core HDSS, and which themselves differ between HDSS
sites, each of which has its own specific foci of activity and objectives, and which have
made different choices in how to address the limitations of their original RDBMS.
Specialized database programmers and data managers are needed to manage export of
data from these diverse systems into sharing platforms like IDMP. These require
common terminology, variable names, and core data, which in turn implies clear
understanding of the meta-data (information describing the data) and of the required
changes in data infrastructure (16).
There is thus a critical need to migrate longstanding HDSS operations and legacy
databases to systems that use up-to-date technologies but require less specialist skills at
site level. While significant effort and technical skills are needed to carry out such
migrations without loss of information or disruption of operations, there is presumably a
clear gain in efficiency once sites use EDC linked directly to web-based RDBMS.
The requirements of a new data management system
HDSSs sites and other longitudinal population and health related projects produce large
amount of records needed to analyze, define, and study the chain of events and
determinants that are linked to individuals and their populations (25). The older an
HDSS is, the more temporal data has to be stored and analyzed. This large amount of
records needs a standard way to be collected, stored and maintained. If these records
are not properly managed, in the long run this will lead to poor or corrupted data, that is

34
more difficult to analyze or to share with the consequence of HDSS’s studies connected
to the data losing validity (26).
A standard temporal data model to manage these temporal events at the adequate level
of detail needed (27–30) and a standard relational database management system (31–33)
are needed, as augmented from many efforts done in the last decades.
Normalization is a key issue on big databases. It is defined as the process to reduce or
totally eliminate redundant information on a database: very few data variables should be
in more than one table (34). Multiple recording of the same information leads to
inconsistency, is more complicated to maintain and should be avoided (26). One event
or property once recorded on a unique table should be referenced on other tables
through a link (foreign key) to it and should not be re-recorded.
Recognizing that a standard and transferrable data model and a standard database
schema are key requirements for correctly managing an HDSS, especially in the long
run, then the next requirement is centralized data storage and management (35,36) if the
validity of the data is to be maintained (32,37–40).
Because HDSSs, as explained before, work with temporal data, and from the data
collected depend how a possible intervention campaign should occur for example, or
how a study designed on top of the data should be done, the availability of the data and
real time checks on it are really important to guarantee the success and the validity of a
study or campaign.
Near-time data collection has been proved in many scientific studies to make an
important difference to achievement of the goals, making hypothesis testing more
robust and the results more valid (41–45). Data securely transferred (46) to the server
almost at the same time as data collection, should then be available through an open
interface and timely reporting to data managers whose role now is to provide their input
for quality assurance as soon as possible.
An integrated data management system based on a set of data management best
practices was thus needed to substantially improve quality, integrity and timely
availability of data in longitudinal epidemiological research, and that such a system at
the same time has the potential to reduce the high running costs which often threaten the
sustainability of long-running HDSSs. Such a system must be based on a standard
compliant data model and database schema, that provide centralized data storage and

35
management through a client-server database management system (e.g. relational
DBMS) and a Web-based data management application. This allows near time data
centralization with collected digital data transferred securely through the network and
near time quality control through open interfaces and automatized, extensible reporting
engine (allowing easy export of data for analysis).
The OpenHDS Data System
OpenHDS is an HDSS data system that provides data entry, quality control, and
reporting to support demographic and health surveillance designed according to these
principles (47,48) . OpenHDS was originally developed by University of Calabar,
Nigeria; University of Southern Maine, US; and Ifakara Health Institute, Tanzania; and
first deployed in Akpabuyo HDSS, Cross River. The team from Swiss Tropical and
Public health Institute (Swiss TPH) have led the development of OpenHDS since late
2013, in collaboration with the existing groups. It consists of two components: web and
mobile. OpenHDS mobile is integrated with the Open Data Kit (ODK) system. ODK is
an open-source suite of tools that helps organizations to author, field, and manage
mobile data collection solutions, and by now established as a quasi-standard in the field
(Figure 1.4). (49)
Following the standards of the INDEPTH reference data model (50), OpenHDS , uses
web-services that check the integrity of the data transferred from the field to the central
relational database (Figure 1.5), and provides reports on the data transfer to the data
managers. Due to its reliance on open standards and open source technology stack, the
system architecture lends itself to the extension with plugins that can give access to
reporting in several formats (including reports which can be layered onto satellite
images), and the easy integration with additional data sources.

Figure 1.4:. OpenHDS and ODK platforms structure and interaction.
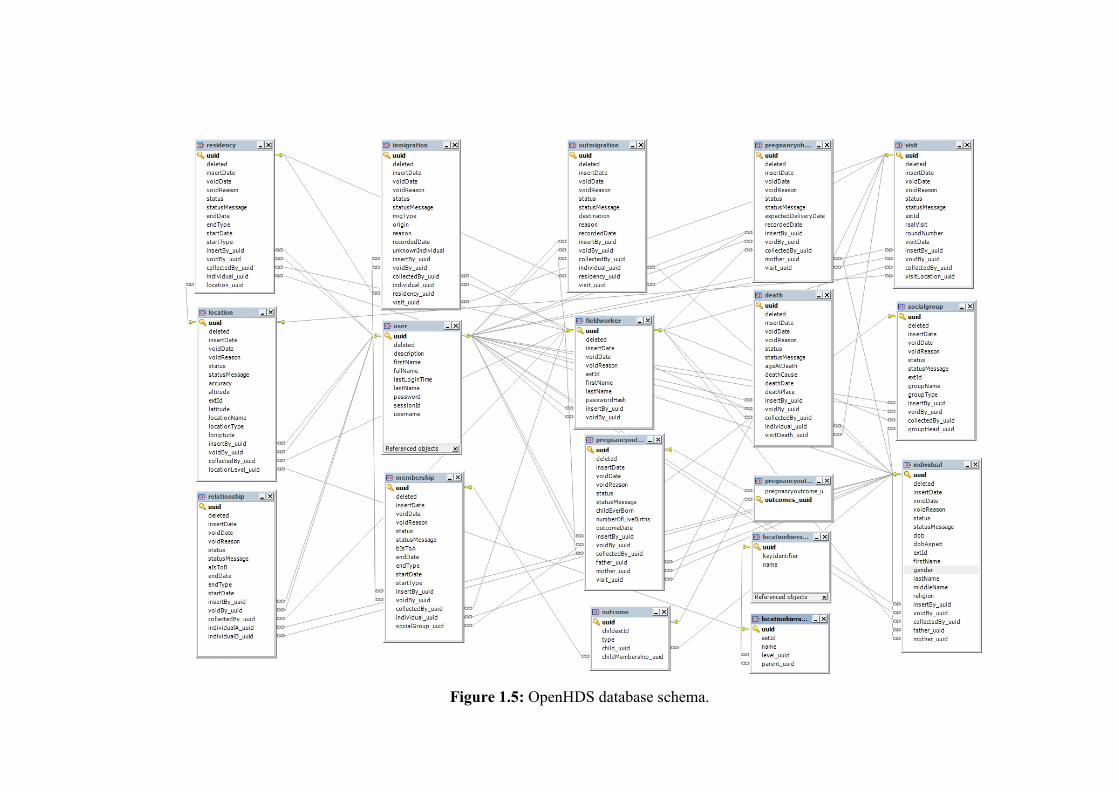
Figure 1.5: OpenHDS database schema.

We want to verify that this offers a number of potential advantages and provide
examples of evidence of this: it would reduce the workload of the data management
team, no IDs need to be typed in (removing one of the biggest causes of errors on data
collection in HDSS systems); and it can provide guidance for the project logistics. The
web interface allows viewing of collected data and correction of errors.
There are a number of obvious potential improvements of this novel data system over
the alternatives described above (Table 1.1), and there is some anecdotal evidence that
these benefits are real. However, up to now there is no proper documentation of
measurable advantages. We report a number of studies to gather such evidence, along
with proof of concepts that the implementation of OpenHDS is feasible in the context of
typical HDSS centres.
HRS1 HRS2 OpenHDS
Database FoxPro (support ended 2015)
FoxPro (support ended 2015)
MySQL, PostGreSQL, MS SQL etc…
RDBMS lacks transactional processing
lacks transactional processing
Yes
Data Collection Paper Paper Electronic
Data accessibility/Data management
Local Network through local Application
Local Network through local Application
Through internet browser, via secure SSL protected URL.
Data Clerk Needed Needed No
Reference data model adopted
No residency and membership
Yes Yes
Enabling factors
HRS1 HRS2 OpenHDS
Electronic Data capturing (Constraints and Skip logic)
No No Yes
Real time data availability
No No Yes
Central database Only accessible via intranet
Only accessible via intranet
Yes
Real time reporting No No Yes
Database availability on the device
Paper Household registration book
Paper Household registration book
SqlLite database
Table 1.1: Advantages and disadvantages using different technologies

39
Field data collection with OpenHDS
Each HDSS has a defined location hierarchy in the area under surveillance. The lowest
level of this location hierarchy is the one leading the ID generation for the HDSS
entities and is important for the identification of the location where the individuals live.
At village level the fieldworker collects location information where individuals were
living. This task is performed through OpenHDS mobile integrated with the ODK
collect application. (Figure 1.6). The fieldworker selects the location if it already exists
or he has to create the location by pressing the ‘create location’ button. Once the
information about the location is recorded the visit form needs to be filled.

40
.Figure 1.6: OpenHDS mobile application snapshot of Login screen.
The visit is the basis of the demographic statistics for the various rounds. It records that
the household was visited in a specific round, on which date, and except for the census
round (where the visit date is the only useful information) it records whether there is
any update on the household or if the house was empty and need to be re-visited. After
the visit form is completed then all the relevant events for the individual’s resident in
the location visited are recorded.

41
All the data collected are, under field supervisor control, sent to a central database
server.
Use cases: evidence from the field
The OpenHDS system can be implemented in a novel HDSS area, but even an existing
HDSS can be migrated to the new paperless data system to manage demographic
surveillance. We provide example of evidence for it.
We set up the OpenHDS system in Rusinga island (Figure 1.7), Nyanza (Western
Kenya), in 2014, during the Solarmal Project (51) in collaboration with the ICIPE
research center in Mbita, and the University of Wageningen in the Netherlands. The
main aim of the Rusinga HDSS was to monitor the effectiveness of the vector control
intervention deployed as part of the Solarmal project with the intent to eliminate malaria
from the island through mass trapping of mosquitoes using odour-baited traps. The
OpenHDS demographic database provided a sampling frame for the study, and allows
data collection for the periodic surveys of malaria incidence and parasitology through
the tablet devices. Moreover, the data provides guidance for the planning and logistics
of the intervention roll-out, giving a visual help to the project manager for the daily
field team planning.
Figure 1.7: Zoom on Rusinga Island in Lake Victoria, Kenya
The HDSS team in Rusinga (47) consists of 10 Fieldworkers, 1 Coordinator, 1 Data
manager and a software expert provides offsite advice. The system has been running
since 2012, and covers 24.972 individuals in three-yearly update rounds.
42
The Majete Malaria Project Health and Demographic Surveillance System, in Malawi is
another example of site where an HDSS was set up from scratch to support a project
with the aim of studying the reduction of malaria using an integrated control approach
by rolling out insecticide treated nets and improved case management supplemented
with house improvement and larval source management (52). Ifakara Health Institute
(IHI) in Tanzania was the first centre to migrate its HDSS sites from the previous
Household Registration System (HRS/HRS2) to OpenHDS. Legacy data sets from three
long-running HDSSs (Ifakara rural, est. 1996, Ifakara urban, 2007, Rufiji, 1998) were
migrated to the new database (53,54) (Figure 1.8). Update rounds started in 2013
(Ifakara) and 2014 (Rufiji).
Figure 1.8: Location of Ifakara HDSS in Kilombero and Ulanga districts in Tanzania.

43
In order to ingest legacy data collected in the Rufiji and Ifakara HDSSs into the new
platform, data had to be extracted from the existing HRS (Household Registration
System) and HRS2 (second generation HRS) data-systems, and transformed to match
the OpenHDS data base (22,55–57). This required the conversion from the FoxPro to
MySQL format; the reshaping and renaming of database tables to match the OpenHDS
database schema; and the cleaning of data to adhere to the more stringent requirements
for internal consistency of the OpenHDS database vs HRS and HRS2.
For the mapping of the data onto the OpenHDS and ingestion into the OpenHDS
database, a web-service interface similar to the one used to aggregate data collected on
tablets during routing field operations was developed. This allowed mapping of data to
the new schema (i.e. rename database table fields, or normalize data where this was
appropriate), and flagging invalid records while creating meaningful descriptions of the
data issues. This last step is a prerequisite for data cleaning, a process that was carried
out in close collaboration with the data managers and field supervisors to resolve as
many of the inconsistencies of the legacy data as possible Criteria for consistency of the
core population data included not only referential integrity, but also temporal integrity
and other checks as implemented by the iShare2 framework, developed by the
INDEPTH Data Management Project (14).
A series of training and field testing workshops were held both Ifakara and Rufiji, and
attended by members of the IHI data central team; data managers; IHI IT staff; field
supervisors and enumerators. These workshops also provided an opportunity to refine
certain software features and data-management tools based on the feedback from
attendants.
Supervision, continued advice, and further refinements of the data collection and
management processed happened over the complete course of the technical assistance
by means of email, instant messaging, and analysis of database and system logs by the
Swiss TPH team.
After IHI another INDEPTH site the Nanoro HDSS run by the Clinical Research Unit
of Nanoro (CRUN) - Institut de Recherche en Sciences de la Sante (IRSS), Nanoro in
Burkina Faso (58) decided to migrate their HRS2 system to the OpenHDS system. This
second site demonstrated the easy transferability and adaptability of the OpenHDS
system, able to adapt to the West Africa francophone setting after it was proved its
functionality in the East African one.
44
Conclusion
OpenHDS is a system that manages data in a standard reference format, transferrable to
different settings. It is developed to work on a any relational database management
system (Mysql, PostgreSQL, MS SQL Server etc.) , designed to keep track of all
temporal sequence of events that characterize a demographic surveillance system.
OpenHDS enforces rigorous checks on demographic events, adding the flexibility to
introduce entire questionnaires, variables that a longitudinal study could require.
OpenHDS can replace conventional demographic surveillance data systems, that don’t
address properly modern data management best practices, this new technology is a real-
time paperless opportunity to take advantage of ICT advances and innovate research
systems today in use in low-income countries.
In the idea of INDEPTH OpenHDS is the starting point for the CHESS, the new
generation of population based surveillance conceptualised by INDEPTH, able to
provide timely morbidity and mortality data of high quality. CHESS is a HDSS+ that
provide integration across population and health facility data.
Competing interests
The authors declare that they have no competing interests.
Funding
The Solarmal study was funded by a grant from the COmON Foundation through the
Wageningen University Fund.
The Ifakara OpenHDS implementation was funded by the INDEPTH network.
Acknowledgements
We would like to acknowledge the INDEPTH network for their overarching views and
input, and Tom Smith for valuable comments and input on the manuscript.

45
References 1. Ekström AM, Clark J, Byass P, Lopez A, Savigny DD, Moyer CA, et al. INDEPTH
Network: contributing to the data revolution. Lancet Diabetes Endocrinol. 2016 Feb
1;4(2):97.
2. United Nations Statistics Division - Demographic and Social Statistics [Internet].
[cited 2016 Feb 19]. Available from:
http://unstats.un.org/unsd/Demographic/standmeth/principles/default.htm
3. Organization WH. Improving the quality and use of birth, death and cause-of-death
information : guidance for a standards-based review of country practices. 2010
[cited 2016 Feb 19]; Available from: http://www.who.int/iris/handle/10665/44274
4. IMPROVING CIVIL REGISTRATION SYSTEMS IN DEVELOPING
COUNTRIES -
020_improving_civil_registration_system_in_developing_countries.pdf [Internet].
[cited 2016 Feb 19]. Available from:
http://www.cdc.gov/nchs/data/isp/020_improving_civil_registration_system_in_dev
eloping_countries.pdf
5. Sankoh O, Byass P. The INDEPTH Network: filling vital gaps in global
epidemiology. Int J Epidemiol. 2012 Jun 1;41(3):579–88.
6. Kahn K, Collinson MA, Gómez-Olivé FX, Mokoena O, Twine R, Mee P, et al.
Profile: Agincourt Health and Socio-demographic Surveillance System. Int J
Epidemiol. 2012 Aug;41(4):988–1001.
7. Tanser F, Hosegood V, Bärnighausen T, Herbst K, Nyirenda M, Muhwava W, et al.
Cohort Profile: Africa Centre Demographic Information System (ACDIS) and
population-based HIV survey. Int J Epidemiol. 2008 Oct;37(5):956–62.
8. Alam N, Ali T, Razzaque A, Rahman M, Zahirul Haq M, Saha SK, et al. Health and
Demographic Surveillance System (HDSS) in Matlab, Bangladesh. Int J Epidemiol.
2017 Jun 1;46(3):809–16.
9. Phillips JF, Simmons R, Chakraborty J, Chowdhury AI. Integrating Health Services
into an MCH-FP Program: Lessons from Matlab, Bangladesh. Stud Fam Plann.
1984;15(4):153–61.
10. INDEPTH Resource Kit for Demographic Surveillance Systems (Beta Version 0.9)
[Internet]. [cited 2016 Feb 19]. Available from: http://www.indepth-
network.org/Resource%20Kit/INDEPTH%20DSS%20Resource%20Kit/INDEPTH
%20DSS%20Resource%20Kit.htm
11. South African Research Infrastructure Roadmap [Internet]. South Africa:
Department of Science and Technology; 2016. 35-36 p. Available from:
http://www.dst.gov.za/images/Attachments/Department_of_Science_and_Technolo
gy_SARIR_2016.pdf
12. Sankoh O. CHESS: an innovative concept for a new generation of population
surveillance. Lancet Glob Health. 2015 Dec 1;3(12):e742.

46
13. iSHARE Repository [Internet]. 2015 [cited 2015 Jul 22]. Available from:
http://www.indepth-ishare.org/index.php/catalog/48
14. Herbst K, Juvekar S, Bhattacharjee T, Bangha M, Patharia N, Tei T, et al. The
INDEPTH Data Repository: An International Resource for Longitudinal Population
and Health Data From Health and Demographic Surveillance Systems. J Empir Res
Hum Res Ethics. 2015 Jul 1;10(3):324–33.
15. Streatfield PK, Khan WA, Bhuiya A, Alam N, Sié A, Soura AB, et al. Cause-
specific mortality in Africa and Asia: evidence from INDEPTH health and
demographic surveillance system sites. Glob Health Action. 2014;7:25362.
16. Sankoh O, Binka F. INDEPTH Network: Generating Empirical Population and
Health Data in Resource-constrained Countries in the Developing World. Health
Research in Developing Countries. Berlin, Heidelberg: Springer Verlag; 2005.
17. Leon D. User’s manual, SRS version 1.1: The microcomputer software component
of the sample registration system of the Sample Registration System of the MCH-
FP Extension Project," International Centre for Diarrhoeal Disease Research,
Bangladesh. The Population Council Regional Office for South and East Asia;
1986.
18. Benzler J, Herbst K, MacLeod B. A data model for demographic surveillance
systems. 1998;
19. Garenne M. Direct and indirect estimates of mortality change: a case study in
Mozambique. In: Demographic evaluation of health programs [Internet]. 1996. p.
53–63. Available from: http://www.cicred.org/Eng/Publications/pdf/c-a31.pdf
20. Clark SJ. A general temporal data model and the structured population event history
register. Demogr Res. 2006 Oct 13;15(7):181–252.
21. Oduro AR, Wak G, Azongo D, Debpuur C, Wontuo P, Kondayire F, et al. Profile of
the Navrongo Health and Demographic Surveillance System. Int J Epidemiol. 2012
Aug;41(4):968–76.
22. Phillips JF, Macleod BB, Pence B. The Household Registration System: computer
software for the rapid dissemination of demographic surveillance systems. Demogr
Res. 2000 Jun 27;2:[40] p.
23. Microsoft Support Lifecycle [Internet]. 2015 [cited 2015 Jul 31]. Available from:
https://support.microsoft.com/en-
us/lifecycle/search?sort=PN&alpha=Microsoft%20Visual%20FoxPro&Filter=Filter
NO
24. Chandramohan D, Shibuya K, Setel P, Cairncross S, Lopez AD, Murray CJL, et al.
Should Data from Demographic Surveillance Systems Be Made More Widely
Available to Researchers? PLoS Med. 2008 Feb 26;5(2):e57.
25. Rentsch CT, Kabudula CW, Catlett J, Beckles D, Machemba R, Mtenga B, et al.
Point-of-contact Interactive Record Linkage (PIRL): A software tool to
prospectively link demographic surveillance and health facility data. Gates Open
Res. 2017 Nov 6;1:8.

47
26. Clark SJ. A general temporal data model and the structured population event history
register. Demogr Res. 2006 Oct 13;15(7):181–252.
27. Etzion, Opher & Jajodia, Sushil & Sripada, Suryanarayana. Temporal Databases:
Research and Practice. New York, NY, USA: Springer Berlin Heidelberg; 1998.
28. Allen JF. Maintaining Knowledge About Temporal Intervals. Commun ACM. 1983
Nov;26(11):832–843.
29. Allen JF, Ferguson G. Actions and Events in Interval Temporal Logic. J Log
Comput. 1994 Oct 1;4(5):531–79.
30. Info on ISO 8601, the date and time representation standard [Internet]. [cited 2017
Feb 7]. Available from: https://www.cs.tut.fi/~jkorpela/iso8601.html
31. Jensen CS, Dyreson CE, Bohlen M, Clifford J, Elmasri R, Gadia SK, et al. The
consensus glossary of temporal database concepts - february 1998 version. Lect
Notes Comput Sci Subser Lect Notes Artif Intell Lect Notes Bioinforma.
1998;1399:367–405.
32. Türker C, Gertz M. Semantic Integrity Support in SQL:1999 and Commercial
(Object-)Relational Database Management Systems. VLDB J. 2001 Dec;10(4):241–
269.
33. Date C, Darwen H. Temporal Data and the Relational Model. San Francisco, CA,
USA: Morgan Kaufmann Publishers Inc.; 2002.
34. Beeri C, Bernstein PA, Goodman N. A Sophisticate’s Introduction to Database
Normalization Theory. In: Proceedings of the Fourth International Conference on
Very Large Data Bases - Volume 4 [Internet]. West Berlin, Germany: VLDB
Endowment; 1978 [cited 2017 Feb 15]. p. 113–124. (VLDB ’78). Available from:
http://dl.acm.org/citation.cfm?id=1286643.1286659
35. Cole LJ, Frantz CJ, Lee J, Ordanic Z, Plank LK. Centralized management in a
computer network [Internet]. US4995035 A, 1991 [cited 2017 Feb 8]. Available
from: http://www.google.com/patents/US4995035
36. Skiba M, Ryzhkin M. Systems and methods for electronic data storage management
[Internet]. US6366988 B1, 2002 [cited 2017 Feb 8]. Available from:
http://www.google.com/patents/US6366988
37. Ramakrishnan R, Gehrke J. Database Management Systems [Internet].
Osborne/McGraw-Hill; 2000 [cited 2017 Feb 8]. Available from:
http://dl.acm.org/citation.cfm?id=556863
38. Stonebraker M, Moore D. Object Relational DBMSs: The Next Great Wave. San
Francisco, CA, USA: Morgan Kaufmann Publishers Inc.; 1995.
39. Simon E, Kiernan J, Maindreville C de. Implementing High Level Active Rules on
Top of a Relational DBMS. In: Proceedings of the 18th International Conference on
Very Large Data Bases [Internet]. San Francisco, CA, USA: Morgan Kaufmann
Publishers Inc.; 1992 [cited 2017 Feb 8]. p. 315–326. (VLDB ’92). Available from:
http://dl.acm.org/citation.cfm?id=645918.672488

48
40. Sitka L. Hierarchical data storage management [Internet]. US6330572 B1, 2001
[cited 2017 Feb 8]. Available from: http://www.google.com/patents/US6330572
41. Stone AA, Broderick JE. Real-Time Data Collection for Pain: Appraisal and
Current Status. Pain Med. 2007 Oct 1;8:S85–93.
42. Lewis BT, Hamilton G. Method and apparatus for a real-time data collection and
display system [Internet]. US5748881 A, 1998 [cited 2017 Feb 8]. Available from:
http://www.google.com/patents/US5748881
43. Waechter JR, Patten JT, Kempter PC. Data collection and transmission system with
real time clock [Internet]. US4943963 A, 1990 [cited 2017 Feb 8]. Available from:
http://www.google.com/patents/US4943963
44. Gil-Carton D, Zamora M, Sutherland JD, Barrio R, Garrido I, Valle M, et al. Real-
time and decision taking selection of single-particles during automated cryo-EM
sessions based on neuro-fuzzy method. Expert Syst Appl. 2016 Aug 15;55:403–16.
45. Martinis S, Twele A, Voigt S. Towards operational near real-time flood detection
using a split-based automatic thresholding procedure on high resolution TerraSAR-
X data. Nat Hazards Earth Syst Sci. 2009;9(2):303–14.
46. Sa JHG, Rebelo MS, Brentani A, Grisi SJFE, Iwaya LH, Simplicio MA, et al.
Georeferenced and secure mobile health system for large scale data collection in
primary care. Int J Med Inf. 2016 Oct;94:91–9.
47. Homan T, Pasquale A, Kiche I, Onoka K, Hiscox A, Mweresa C, et al. Innovative
tools and OpenHDS for health and demographic surveillance on Rusinga Island,
Kenya. BMC Res Notes. 2015;8:397.
48. Asangansi I, Macleod B, Meremikwu M, Arikpo I, Roberge D, Hartsock B, et al.
Improving the Routine HMIS in Nigeria through Mobile Technology for
Community Data Collection. J Health Inform Dev Ctries [Internet]. 2013 Jun 1
[cited 2017 Aug 27];7(1). Available from:
http://www.jhidc.org/index.php/jhidc/article/view/100
49. Hartung C, Lerer A, Anokwa Y, Tseng C, Brunette W, Borriello G. Open Data Kit:
Tools to Build Information Services for Developing Regions. In: Proceedings of the
4th ACM/IEEE International Conference on Information and Communication
Technologies and Development [Internet]. New York, NY, USA: ACM; 2010 [cited
2016 Feb 19]. p. 18:1–18:12. (ICTD ’10). Available from:
http://doi.acm.org/10.1145/2369220.2369236
50. Justus Benzler KH. A data model for demographic surveillance systems.
51. Homan T, Hiscox A, Mweresa CK, Masiga D, Mukabana WR, Oria P, et al. The
effect of mass mosquito trapping on malaria transmission and disease burden
(SolarMal): a stepped-wedge cluster-randomised trial. The Lancet [Internet]. 2016
Aug 9 [cited 2016 Aug 10];0(0). Available from: /journals/lancet/article/PIIS0140-
6736(16)30445-7/abstract

49
52. Di Pasquale A, McCann RS, Maire N. Assessing the population coverage of a
health demographic surveillance system using satellite imagery and crowd-sourcing.
PLOS ONE. 2017 Aug 31;12(8):e0183661.
53. Mrema S, Kante AM, Levira F, Mono A, Irema K, de Savigny D, et al. Health &
Demographic Surveillance System Profile: The Rufiji Health and Demographic
Surveillance System (Rufiji HDSS). Int J Epidemiol. 2015 Apr;44(2):472–83.
54. Geubbels E, Amri S, Levira F, Schellenberg J, Masanja H, Nathan R. Health &
Demographic Surveillance System Profile: The Ifakara Rural and Urban Health and
Demographic Surveillance System (Ifakara HDSS). Int J Epidemiol. 2015 Jun
1;44(3):848–61.
55. The Household Registration System: technology for the generation of computer
software for longitudinal field experiments. Health Policy Plan. 2001 Dec
1;16(4):444–444.
56. Bruce MacLeod, Ph.D. and James F. Phillips, Ph.D. User Manual for Household
Registration System - HRS2 [Internet]. [cited 2017 Feb 6]. Available from:
http://www.popcouncil.org/uploads/pdfs/usermanual.pdf
57. MacLeod B, Phillips JF, Binka F. Sustainable Software Technology Transfer: the
Household Registration System. 1996 [cited 2017 Feb 8];17. Available from:
https://works.bepress.com/bruce_macleod/10/
58. Derra K, Rouamba E, Kazienga A, Ouedraogo S, Tahita MC, Sorgho H, et al.
Profile: Nanoro Health and Demographic Surveillance System. Int J Epidemiol.
2012 Oct;41(5):1293–301.

50
Feasibility of running an HDSS using computer tablets and
OpenHDS software

51
2. Innovative Tools and OpenHDS for Health and
Demographic Surveillance on Rusinga Island, Kenya
Tobias Homan3, Aurelio Di Pasquale1,2, Ibrahim Kiche4, Kelvin Onoka4, Alexandra
Hiscox3, Collins Mweresa4, Wolfgang R. Mukabana5, Willem Takken3, Nicolas Maire1,2
1 Department of Epidemiology and Public Health, Swiss Tropical and Public Health
Institute, Basel, Switzerland
2University of Basel, Basel, Switzerland
3 Laboratory of Entomology, Wageningen University and Research Centre,
Wageningen, The Netherlands
4 Department of Medical Entomology, International Centre of Insect Physiology and
Ecology, Nairobi, Kenya
5 School of Biological Sciences, University of Nairobi, Nairobi, Kenya.
Published as: Homan et al. BMC Res Notes (2015) 8:397

52
Abstract
Background: Health in low and middle income countries is on one hand characterized
by a high burden associated with preventable communicable diseases and on the other
hand considered to be under-documented due to improper basic health and demographic
record-keeping. Health and Demographic Surveillance Systems have provided
researchers, policy makers and governments with data about local population dynamics
and health related information. In order for an HDSS to deliver high quality data,
effective organization of data collection and management are vital. HDSSs impose a
challenging logistical process typically characterized by door to door visits, poor
navigational guidance, conducting interviews recorded on paper, error prone data entry,
an extensive staff and marginal data quality management possibilities.
Methods: A large trial investigating the effect of odour-baited mosquito traps on
malaria vector populations and malaria transmission on Rusinga Island, western Kenya,
has deployed an HDSS. By means of computer tablets in combination with Open Data
Kit and OpenHDS data collection and management software experiences with time
efficiency, cost effectiveness and high data quality are illustrated. Step by step, a
complete organization of the data management infrastructure is described, ranging from
routine work in the field to the organization of the centralized data server.
Results and discussion: Adopting innovative technological advancements has
enabled the collection of demographic and malaria data quickly and effectively, with
minimal margin for errors. Real-time data quality controls integrated within the system
can lead to financial savings and a time efficient work flow. Conclusion: This novel
method of HDSS implementation demonstrates the feasibility of integrating electronic
tools in large-scale health interventions.
Key words: Health and Demographic Surveillance System; Mobile data collection;
Data management platform; Malaria; Kenya
53
Background
Health and demographic surveillance systems [HDSS] are used to provide a framework
for prospective collection of demographic and public health data within a community.
Such systems, originally called population laboratories, have been in operation since the
late 20th century, and constitute the basis of population-based research in areas where
national or local authorities lack a proper registration system to monitor the most
important demographic events [1].
In order for population and health researchers to acquire longitudinal data on
communities, systematically constructed systems have undergone several developments
[2]; where originally the focus remained on surveying demographic data (demographic
surveillance systems, DSS), principally due to efforts of the INDEPTH network
(International Network of field sites with continuous Demographic Evaluation of
Populations and Their Health in developing countries), health indicators became a
routine part of science-driven surveillance systems, retitling the concept as HDSS
(health and demographic surveillance system) [3]. Despite these developments, public
health systems in developing countries often lack adequate infrastructure to monitor
demographic and health information; rural areas in particular experience challenges
with the collection of reliable health-related data. The World Health Organization
[WHO] states that vast rural areas in Sub-Saharan Africa are a reservoir for a variety of
predominantly preventable communicable diseases such as HIV/AIDS, tuberculosis and
malaria (WHO; World Health Statistics 2014) .The absence of well-operating national
or local demographic and health surveillance systems hampers evidence-based research
into these diseases. Over the past decades there are numerous examples of scientific
institutions deploying community-based HDSSs in order to provide policy makers and
governments with recommendations on health planning and intervention methods. A
classic example is the Garki project in Nigeria where, during the 1970s, field
experiments were conducted to understand the effects of Indoor Residual Spraying
[IRS] and Mass Drug Administration (MDA) on malaria and entomological outcomes
[4]. Another, more recent, malaria control study which used HDSS to capture
prospective data was the Asembo Bay Cohort Project, which ultimately showed a large
protective effect of Long Lasting Insecticidial Nets [LLIN] against malaria infection.
Nowadays, community-based HDSSs are established at an increasing number of sites to
investigate a range of different health indicators and diseases. The main goal of the
INDEPTH network is to harmonize the data of HDSSs from different sites in

54
developing countries to achieve a valid comparison of information and accordingly get
more insight into health related trends [5].
There are currently 43 INDEPTH associated centres that run one or more HDSSs for
scientific purposes [6].
At all these HDSS sites, the field and data management operations pose logistical
challenges.
Interviews in most sites are essentially paper based which makes conducting
questionnaires time consuming and error prone. Visiting households and individuals can
be time consuming, as keeping track of where fieldworkers navigate and which
community members have been visited can only be done manually. Likewise,
transferring data from paper into a digital form is a lengthy process with a lot of room
for error. Not only the content of data can be entered incorrectly, but assigning new data
to the right entity or ID is an error-prone process with small typos leading to
unrecognizable and ultimately squandered data [7-10]. Finally, accumulating and
managing data relies heavily on obsolete database software with limited data quality
assurance structures.
The past decade has borne witness to major developments in mobile computer
technology as well as software applications. Advanced computer tablets and improved
data collection and management software have become accessible and affordable to the
wider public. In high and middle income countries there are numerous examples of
ways to utilize the available technologies to improve health [11, 12]. Although there
have been several pilot studies which experimented with a telephone-based technology
to collect health and demographic data, in the lower income countries these
technologies remain mainly underused because of logistical and organizational
constraints [13, 14].
In some low- income countries, mobile computer technology and advanced data
collection and management software has been tested. In Akpabuyo Nigeria, the use of
computer tablets with practical collection software and a comprehensive data
management system has been tested [15].
The study showed that it is possible to save a great deal of time compared to the paper-
based and analogue data collection and management. Not only time could be saved,
costs could also be decreased considerably and data quality increased. Another study in
Malawi investigated how the use of computer technology and software could best be
organized to create a feasible system of health data collection and management [16]. A

55
governmental initiative in Kenya in 2006 marked a first step towards a digitalized health
management [17].
In 2012 an HDSS was initiated on Rusinga Island, western Kenya, to facilitate a large
malaria control trial, the SolarMal project [18].This paper describes the computer-based
HDSS developed for this project. It is shown that community-based health research
served by HDSSs can be of higher quality, more cost-effective and more time efficient
than currently deployed surveillance systems.

56
Methods
Study location and population
Rusinga Island with approximately 25,000 inhabitants, is located in Lake Victoria,
western Kenya (0°21′ S and 0°26 south, 34°13′ and 34°07’ east). The island is
administratively part of Homa Bay county in western Kenya (Figure 2.1) and is
connected to the mainland with a causeway. The land surface area of Rusinga Island is
approximately 44 km2 with an elevation between 1100 m and 1300 m above sea level.
Average daily temperatures lie between 16 and 34 degrees Celsius with temperatures
higher during the dry seasons which occur between June-October and late December-
February. The SolarMal project, including HDSS activities, operates through the
International Centre of Insect Physiology and Ecology [icipe] at the village of Mbita
Point just across the causeway, on the mainland. The population of Rusinga Island
belongs to the Luo ethnic community and, besides the national language of Swahili,
DhoLuo is primarily spoken. Fishing and farming are the principal occupations. There
are several health facilities in the area; one public health centre, three government-run
dispensaries and three private clinics. A district hospital is found at Mbita Point.
Figure 2.1 Study site: Africa with Kenya highlighted dark grey; in the right upper
corner Kenya with Homa Bay County highlighted; Homa Bay County with Rusinga
Island tinted in dark grey.

57
Malaria transmission occurs throughout the year, with peaks in transmission at the end
of the rainy seasons where parasite prevalence is around 30% (WHO Country Profile
2013: Kenya, Malaria).
Furthermore, schistosomiasis, filariasis, HIV, and tuberculosis are endemic on Rusinga
(Central Bureau of Statistics MoPaND. Kenya Demographic and Health Survey 2003)
Data collection system
The HDSS team consists of 10 fieldworkers [FWs], one fieldworker manager [FWM], a
database manager and a system developer. Fieldworkers who spoke DhoLuo fluently
and had a prior basic knowledge of computing were trained to use mobile tablet
computer devices (Samsung Galaxy Tab 2, 10.1). A pilot study was conducted to test
the usability of the computer tablets, as well as digital questionnaires, prior to the initial
HDSS census. The HDSS uses the Open Health and Demographic Surveillance
[OpenHDS] data system [15], a software platform that is based on a centralized
database. This database is linked to a web application for data management, linked to a
tablet computer-based mobile component which allows digitalization of data at the point
of capture, and wireless synchronization to the central data store based on the Open
Data Kit [ODK] platform [15, 19] (Figure 2.2). ODK is a free, open-source application
intended to facilitate mobile data collection services. ODK consists of two software
components for data collection, transfer and storage, and various tools exist for the
authoring of the electronic questionnaires used in the data collection process. ODK-
Collect is used to render electronic questionnaire forms on mobile devices running the
Android operation system, which includes forms to report core vital events as well as
customized forms. ODK-Aggregate is a web application that supports data transfer and
storage at a local server or a “cloud” server.
In addition to ODK-Collect, the OpenHDS mobile data collection application is
installed on the tablets.

Figure 2.2: Data pathways using the ODK and OpenHDS platform: Electronic questionnaires are created uploaded to the computer tablets by the ODK
server. Wireless synchronization of digitalized data collected at the point of capture is transferred to the central data store based on the ODK server.
Cleaned data is transferred to the OpenHDS server that in turn synchronizes the up to date database to the computer tablets.

This application contains a database which is pre-populated with data on the
administrative location hierarchy in the study area (district, villages, neighbourhoods),
and any information previously collected on individuals, houses and households in the
area. This allows selection of the individual or house using the software during a visit to
a household, and makes it possible to simply amend or add new information associated
with the individual or house that has been selected. The differentiation made between
houses and households follows the local culture, where the term dhala is used for a
group that is socially and financially dependent or formed of related family members
sharing the same facilities and recognizing one member as head of the household. A
house is always defined as a single residential structure. The XLS-Form application is
used for authoring questionnaire forms for ODK in the X-Form format. This allows
integration of all possible structures of questions into the questionnaire: open answers,
multiple choice answers, as well as posing constraints and requirements to answer
outcomes. Questionnaires are published to ODK-Aggregate, and then downloaded to
the tablets using ODK-Collect. This includes both questionnaires for capturing core
vital events (births, deaths, in- and out-migrations) and study-specific questionnaires
(parasitology, malaria incidence etc.). Electronic forms which are completed in the field
using OpenHDS mobile are stored in ODKCollect and synchronized over a Wi-Fi
connection at the field station to the central database through ODK-Aggregate server
(Figure 2.2). After subsequent automated customized data checks, cleaned data is then
submitted to the definite OpenHDS database. At the end of each update round, clean
data is synchronized to the tablets to ensure that the most up to date information is taken
back to the field for consecutive follow up surveys.
Data collection rounds
The SolarMal project was initiated in January 2012 and will run through December
2015. The population census survey took place from June to September 2012,
enumerating households, houses and individuals on the island. During the census
survey, fieldworkers were assisted by individuals of the local community that are
enrolled in a malaria programme, the Rusinga Malaria Project. The fieldworkers of the
HDSS were familiarized with the population and geography of the island. In subsequent
rounds of data collection, regular communication with the Rusinga Malaria Programme
members and village elders enabled fieldworkers to find newly created households. All
houses were mapped using the Global Positioning System function on the tablet,
recording latitude and longitude with an accuracy of five to 15 meters. Households are

60
given a unique code consisting of two letters, relating to the name of the village where it
is located, followed by a two digit number. Houses within a multi-house household have
one extra letter, and all individuals are assigned a unique code comprising of five letters
and two digits. Individuals were asked to provide their full name, sex, date of birth,
main occupation and their relationship to the head of household. Subsequent analyses of
individual data were performed using unique individual ID codes in order to ensure the
anonymity of personal data.
To ensure that FWs are adding data to the correct corresponding house and individual in
the field in subsequent follow up surveys, each house was provided with a door sticker
showing its unique ID (Figure 2.3).
Figure 2.3: Project sticker with barcode on the doorpost of a house: Barcode scanning,
integrated into the mobile data collection, allows quick identification of locations and
study population to add or amend health and demographic information.
The unique ID is also expressed as a barcode which is scanned with the tablet on arrival
at the house and recorded in the data base. Once scanned, the barcode is validated
against existing barcodes in the mobile application of OpenHDS and the application
allows questionnaires to be filled in and stored. Each household is visited three times a
year to collect and update demographic and malaria-related data. Members of the HDSS
team visit all residential structures in nine geographic areas on the island simultaneously
taking approximately three months to cover their area. At all households observed
pregnancies, new births, deaths and migrations which have occurred since the previous

61
visits are recorded and updated. Digital questionnaires concerning demographic
information are consistent with the HDSS questionnaire format of the INDEPTH
network (Table 2.1). Moreover, the standardized questionnaire formats are widely used
in East Africa and Kenya and therefore apply well to our research site.
Question Answer possibility
Individual ID ABCDE100
Fieldworker ID TO01
Illness over past 2 weeks Yes; No
If illness reported: what symptoms? 1) Diarrhoea, 2) Fever, 3) Vomiting, 4) Rash, 5) Bowel ache, 6) Head ache, 7) Cough/sore throat,8) Joint pain, 9) Dizziness, 10) Other (manually specify)
Fever over the last 2 days? Yes; No
Current fever? Yes, No
Under malaria treatment now? Yes; No
If illness or fever reported: take temperature measurement
37.6
If temperature 37.4 °C or above: RDT test
1) Negative, 2) P. falciparum, 3) Other Plasmodium, 4) Mixed malaria infection, 5) respondent refused to take test
Do you suffer respiratory symptoms? Yes, No
If respiratory symptoms are experienced: Did you seek medical attention?
Yes, No
If medical attention: what medical attention was sought?
1) Doctor, 2) Nurse, 3) Community health worker, 4) Traditional healer, 5) Other (manually specify)
Do you use any drug for the fever? Yes, No
If using drugs against fever: which drugs?
1) Anti malarials, 2) Antibiotics, 3) Pain killers, 4) Other (manually specify)
Table 2.1: An individual health questionnaire administered to everyone enrolled in the
study. In the right column an example of an individual’s answer in bold.
Upon arrival at a household the barcode is scanned and a digital log, which includes the
interview date and time, is automatically created. After recording deaths and births,
migrations into or out of the household are documented. There is a differentiation
between migrations within the island and from elsewhere. Individuals moving within
the island maintain their individual ID which becomes associated with the new
household. These individuals found in the system by filtering on their previous village
and their name, subsequently selecting and migrating him or her. Moving out of
Rusinga puts the individual in an inactive state in the database; people moving into

62
Rusinga are provided with a new unique ID code if not previously enumerated, and all
personal information is collected, as in the census survey.
These individuals are found in the system by filtering on their previous village and their
name and subsequently associating the individual ID with the new household ID
through the completion of a migration form. If it is known that the individual in
question does not plan to be a resident of the island no questionnaire is filled out. If it is
known that an absent person is definitely coming back, no out migration is documented.
To distinguish between temporary and permanent migration we use six months as a
threshold. General information about the house construction, composition of household
members and the presence and use of bed nets (as a malaria preventive tool) is collected
for every house which is newly added to the database and for existing houses once per
year.
Use of geographical information on basis of the geographical coordinates of houses and
demographic as well as malaria-related data gathered during the census of July 2012,
the study design for the sequence of the rollout of the SolarMal intervention was
developed and has been described elsewhere (Silkey et al., Personal Communications).
Briefly, the island is divided into 81 clusters each containing 50 or 51 households, with
nine clusters making up one metacluster. Metaclusters form the geographical basis for
the HDSS follow up surveys. The fieldworkers are each assigned one of the
metaclusters in which to visit every house and individual once during an interval of
three months. One fieldworker is deployed to an area conditional on relative progress in
the surveillance. For navigational purposes, the demographic database is converted into
a geographic database (KML file), allowing us to plot houses to be visited in the Google
Earth mobile (Version 7.1.3. 1255) application integrated in the tablet (constructed with
ESRI 2011. ArcGIS Desktop: Release 09. Redlands, CA: Environmental Systems
Research Institute).
Using the GPS function, FWs can track themselves on the map navigating in real time
from one house to another (Figure 2.4). Furthermore, the geographic database also
includes all server data enabling the FWs to select any house on the Google Earth map,
consequently displaying the personal information of people living there.

Figure 2.4: Navigating assigned houses: Converting the up to date population database into a geodatabase displayed with Google Maps Mobile assists
fieldworkers with tracking every house.
Data quality and management
Data quality is initially controlled by designing questionnaires which permit answers to
fall within an acceptable range. For example, using input constraints a date can only be
entered as a date format, only women can deliver a child, a body temperature must lie
within 35 to 42 degrees Celsius. After questionnaires have been entered in the field, the
data is transferred to the ODK-Aggregate server.
Unique IDs for individuals, houses and households are automatically generated per FW
to ensure that no duplicate values are entered in the system. Questionnaires which were
not fully completed are not accepted for upload to the server. Data is then transferred
from ODK-Aggregate to the OpenHDS server using the Mirth Connect data integration
platform [20]. All events entered during field visits are checked for inconsistencies
during this step. Faulty records are filtered for further checking, and an error report is
sent to the data manager by email. Births or deaths registered with an event date long in
the past, multiple new-borns or separate deaths with the same date of event will be
double checked with the FW or with the head of household. In addition, doubtful
migrations are double checked, for instance if a child of three years old was found to be
migrated because of marriage or work. Once in the OpenHDS server, the data manager
has access to information about all individuals who have ever been active in the
database, as well as their event history. A range of options to detect residual
inconsistencies and perform data cleaning are available. An error often found in HDSSs
is that individuals or households were duplicated during the census round under a
slightly different name with different unique IDs at geographical border areas of FWs.
An option to merge individuals and their past events provides a practical solution to this
problem. In addition to this real time data quality control a web-based monitoring
system was introduced that allows the data manager and FWM to extract a weekly
snapshot of certain fieldwork related matters in the database [21]. The web interface
displays information on where FWs have been in the past week, as well as which
household visits are yet to take place. Subsequently, the geographical database
converted to KML files are uploaded to tablets at the beginning of every follow up
round. The tool automatically removes individuals and houses which have already been
visited during a given round of surveillance from the visit plan, publishing a file with
remaining houses to be visited that can be uploaded to the computer tablets.
Furthermore, the tool can be used to produce graphs of how many individual and houses
were visited and how many forms were filled in during the previous week, allowing the
performance of fieldworkers to be tracked. The tool gives the opportunity to see where

65
FWs have been, how long they have taken to conduct the work delivered, as well as
which forms have been filled in and how often. This information gives the FWM a
quick insight into every FW’s performance, so that inconsistencies can be addressed
promptly and systematically. Additionally, on a weekly basis the tool generates 20
houses on basis of the houses already visited, to be revisited by the FWM. During re-
visits, the usual procedure of demographic questionnaires is conducted and
discrepancies between the results obtained by the FWM and FW are discussed with the
FW in question.
Finally, all data of the HDSS, as well as entomological, parasitological, geographical
and sociological data are fed into a MySQL relational database ready to be analysed. All
data are linked through the unique individual, house or household IDs, making
extraction of spatial and temporal data a mere case of entering the desired query in to
MySQL. Nightly backups of the databases are automatically copied to a network-
attached storage system The local server is a highly secured drive located at the field
station icipe.
Ethical clearance
Ethical approval was obtained from the Kenyan Medical Research Institute (KEMRI);
non-SSC Protocol No. 350. All participants are provided with information regarding the
project outline, the ongoing HDSS procedures, the implementation of the intervention,
and the collection and use of blood samples. Adults, mature minors and caregivers of
children provided written informed consent in the local language agreeing to
participation in the SolarMal project.
Results and Discussion
Resource allocation
We describe a data collection and management platform which advances the electronic
systems employed in HDSSs in developing countries a step further mainly by
integrating mobile-device based data collection with a centralized real-time data system.
This integration is one of the important improved aspects within the described HDSS,
resulting in organizational and scientific advantages.
HDSS sites often rely on paper-based conducting of questionnaires before the data is
entered in to a digital database [7, 9, 10, 22, 23]. The Android operating system is used
on powerful tablet computers, allowing us to develop or deploy the desired software. In

66
combination with the freely available mobile data collection software, ODK-Collect and
OpenHDS mobile, collecting data on paper is set to become obsolete. This not only
saves time because data can be entered by merely navigating through the digitalized
form, and the process of double-entry of paper questionnaires in to a digital format is no
longer necessary. Fewer field workers and staff are required to perform the same job as
before.
Besides the cost-effectiveness on the basis of reduced staffing, the use of stationery is
reduced to a minimum amount. Fieldworkers are provided with computer tablets, tablet
protection covers and a paper notebook for occasional notes. Stationary in the office is
reduced to a flip board to manage discussions, and some paper notebooks and pencils.
All data collection and management is fully digital. Thus where traditional paper based
HDSSs would approximately use one A4 for updates on household information and one
A4 for individual health information, a digitalized data collection with 25,000 people
and 8,000 houses would save over 30,000 A4 papers per survey. In the last five years
there are sites where HDSSs have migrated from paper-based to some sort of digitalized
entering system [8, 24-27]. However, none of these sites have linked data collection
software in the field directly to a real-time database. At the moment of writing, there is
at least one other collection system using computer technology to integrate collection,
management and database utilities; the LINKS system is in some ways similar to the
system described in this paper [28]. LINKS also uses the ODK platform to collect data
and is deployed at several sites in Africa. It is an easy implementable, cost reducing and
efficient platform; however, the concept of a near real time database and its advantages
seems not to be exploited. Furthermore, there are examples of health data collection
systems where PDAs and telephones are used, which is considerably more efficient than
the paper based surveillances. However, they show major limitations in terms of user-
friendliness and scalability [29, 30]. This is mostly caused by the obsolescence and
limited compatibility of software and hardware used.
Time and organizational efficiency
Making use of the latest openly available technology, data collection in the field enables
researchers and field workers to be time efficient, resulting in cost reductions and
organizational efficacy. At most INDEPTH affiliated HDSS sites the Household
Registration System [HRS] is used for managing demographic and health-related data,
either by digitalizing filled in paper forms or direct digital entry in the field [8, 10, 22,
25, 26]. There are also examples of HDSS sites where a different data management

67
system is developed relying on paper or non-paper based data collection [7, 9, 24]. The
data collection system described in this paper has several advantages compared to the
HRS in terms of organizational efficiency [31]: Firstly, traditional cleaning of data
accumulating to an entity like an individual or household is largely removed. As the
OpenHDS mobile application is a copy of the aggregated longitudinal database, in the
application interface, adding data is only possible after selecting an existing entity. The
constant uploading of collected data to the OpenHDS server and the synchronization of
the database to the tablets makes reliable continuity of the data achievable.
Secondly, the entire process of creating an electronic questionnaire, up to viewing the
collected data in a server, is a manageable, time efficient task for any scientist once
basic training has been provided.
The XLS-Form authoring tool allows also non-computer scientists to create a
questionnaire with the option to apply the preferred constraints. Concepts in
questionnaires such as skip logic, input constraints, structured data model and an entry
concept from the start, which the HRSs lack [31], have in our project let to only few
forms of mistakes and errors that were relatively easy to detect. In a sample of our data
we detected some incorrectly entered dates of birth and names, however in the
following visit this personal data is always checked and corrected appropriately. The
number of corrected mistakes in demographic data after one data collection round was
never more than one percent. Simply uploading the XLS- form within ODK-Collect on
the computer tablet allows one to conduct the questionnaires in OpenHDS mobile. All
questionnaires related to the core demographic data collection are standardized and
configured to OpenHDS mobile.
Thirdly, translating the real time database into a geographical database is a convenient
way to assist FWs in real-time navigating their area of data collection. Demographic or
disease-related data can be linked to a house location with its coordinate using the free
Google Earth software. Tapping a house location on the device shows all the available
household information. This combination of real time GPS navigation and fixed visiting
points in space enables the FW to invest a minimal amount of effort in locating
households at the study site. In this way fieldworkers of the HDSS manage to visit an
average of approximately 15 houses and 40 people per day. The visiting of houses
without a digital navigation platform can leave room for suboptimal walking routes.
Finally, after data collection has finished and data content has been cleaned, records can
immediately be used to guide other parts of the project that rely on data collection
structure of OpenHDS. Also, where the analysis of data in current HDSSs can only
68
commence after it is manually entered and cleaned, this system allows one to have a
dataset ready for analysis shortly after collection. Data cleaning is performed on a daily
basis and, with roughly 500 data entries per day the data manager usually finishes
routine cleaning in less than two hours. Manually entering great amounts of
questionnaires and post-hoc cleaning of entered data can take many more hours even if
every single questionnaire is digitally entered and cleaned in one minute.
One aspect of this particular HDSS is the facilitation of healthy team cohesion. The
SolarMal project is a multidisciplinary project with multiple researchers collecting data
on sociological, entomological and parasitological outcomes integrated with a HDSS.
The complete project data and storage is linked to the OpenHDS infrastructure, there are
twice-monthly meetings with all project staff to discuss data related issues and all
research areas make use of the data gathered through the HDSS in planning and
carrying out data collection activities and subsequently analysing the data.
Data quality assurance
Organizational efficiency and data quality assurance go hand in hand, commencing
from the OpenHDS platform where all data is centrally stored. Having the ODK-
Aggregate and the OpenHDS server opens up the possibility for the data manager to
check and clean the contents of data in a consistent way on a daily basis. This near-real-
time quality assurance is conducted on the level of the ODK-Aggregate by means of a
customized list of queries looking for inconsistencies that are easily detectable, like
double visited individuals. The more in-depth data cleaning is then possible at the level
of the OpenHDS. The platform offers a range of tools to check, research and amend all
aspects of the demography in a population. Another large advantage of this system is
the automatic generation of unique IDs. Automating the assignment of IDs avoids
duplication of individuals or multiple individuals with the same ID. All data collected in
the project are related to one of these three levels of unique IDs, in this way it is
safeguarded that data collected is attributed to the right person or house. Furthermore,
by means of the KML file, the FW knows which house is visited. Selecting the house
ID in the OpenHDS mobile application directly gives access to editing and attaching
new data to the individuals living there. Demographic and other questionnaires can
easily be filled in and attached to the right unique ID, thus reducing confusing data
accumulation drastically. In addition, all houses are provided with a door sticker with a
unique bar code and the house and household ID. Scanning the barcode confirms the
physical presence of the FW at the house, so that the data entered truly correspond to

69
the house that is visited and it is not possible for a FW to enter data remotely. Lastly, a
web-based monitoring of the database to monitor the performance of FWs is under
development. This monitoring allows the FWs and data manager to follow the
performance of every FW. Monitoring of fieldworkers to increase data quality is not a
new concept [14, 15]. However, a near-real-time database that automatically displays
FW performance is a convenience never described. Tracking the route walked by FWs,
and observing the number of individuals and questionnaires filled in are currently the
most prominent and helpful tools to detect fieldworker inconsistencies. More
importantly, simple analysis of this data can shed light on interviewer bias, which can
directly be discussed with the FW in question.
Challenges and future research
Despite the advancement of and improved accessibility of information technology, the
development and implementation of the described infrastructure in low and middle
income countries will meet obstacles and limitations. Primarily, the requirement of
electricity and a computer server near the field work site are vital. Likewise, this
operation only becomes truly feasible with a trained data manager who has advanced
I.T. skills. During this pioneering phase, having access to or collaborating with a
software developer is also necessary. So, although on one hand cost and time savings
are made in the long term, setting up the initial facilities requires a significant financial
investment and demands a well-designed strategic plan for the context of the HDSS.
Another complementary investment is the training of staff involved in the HDSS in how
to handle the hardware and the software. Digitalization of the HDSS process from an
existing paper-based system can lead to a drastic reduction of personnel, which
facilitates the operational procedures of the HDSS.
Furthermore, there are many HDSS currently using paper based systems that desire to
migrate to a fully digitalized HDSS. This transition can introduce a whole set of
unforeseen difficulties that rely on complex logistical issues which necessitate more
data and software professionals [32].
One of the biggest issues experienced throughout the past HDSSs, is dealing with
migration of the population under study. Where the OpenHDS system allows this
problem to be handled much more promptly than paper-based or obsolete household
registration systems, it is still a challenge to make sure that internal migrations between
households are correctly processed. Individuals can always be immigrated again, but the

70
reintroduction relies on the name given by the person in question. We experienced that
sometimes other names are given or the original name was incorrectly provided.
Conclusion
In regions lacking adequate organization to monitor demographic and health
information little is known about population dynamics and the epidemiology of disease.
It is these areas where health is often heavily compromised and where collection of
specific health-related data can greatly improve our understanding of health issues. The
HDSS within the SolarMal project provides an example of a user friendly infrastructure
for field data collection in evidence-based research in low and middle income countries
by making use of the currently available technologies. Whereas most HDSSs still work
with paper based or obsolete digital systems, this paper describes a totally digitalized
platform that allows fieldworkers and field managers to quickly and systematically keep
clean data, make fewer mistakes with data collection and make use of a structured data
model and entry concept from the start.
Stakeholders such as government health officers, local administrators and scientists
have easy access to real time data storage on a secure central database which enables
them to conduct near-real-time quality assurance. Besides, remote progress monitoring
allows scientists to quickly detect inconsistencies. Most importantly, this system could
radically increase cost-effectiveness by saving time and money on stationery, data
clerks, organizational costs and manual logistics.
Competing interests
The authors declare that they have no financial, political or other kind of competing
interests.
Authors’ contribution
AdP is the software developer that helped with improving and advising on the data
management platform as well as providing expert comments on the manuscript. KO is
the local database manager applying the OpenHDS and ODK platform in the field. IK is
the fieldworker manager, organising the field activities and linking this to the data
management platform. AH, CM, WM and WT are part of the overall program
management and have directly worked a lot on embedding and integrating the data
management platform into the SolarMal project. NM has supervised the complete
implementation of the platform and provided expert comments on the manuscript. All
authors read and approved the final manuscript.

71
Acknowledgements
We want to thank the population of Rusinga Island, for their participation in this study.
We are also very thankful that the International Centre of Insect Physiology and
Ecology has enabled us to implement and manage all our scientific activities from the
field station in Mbita. We would also like to acknowledge the INDEPTH network for
their overarching views and input. And we want to express appreciation to the Kenyan
Medical Research Institute. This study was funded by a grant from the COmON
Foundation through the Wageningen University Fund.
72
References
1. Kesler II LM: The community as an epidemiologic laboratory: A case-book in
community studies. Baltimore: Johns Hopkins Press 1970.
2. Garenne M DGM, Pison G, Aaby P: Prospective community studies in developing
countries. Oxford: Clarendon press; 1997.
3. Network I: Population and health in developing countries. Ottawa: International
development Research Centre 2002, Volume 1. Population, health, and survival at
INDEPTH sites.
4. Molineaux L GG: The Garki Project: Research on the Epidemiology and Control of
Malaria in the Sudan Savanna of West Africa.: World Health Organization
Pulication; 1980.
5. Sankoh O, Ijsselmuiden C, Others: Sharing research data to improve public health: a
perspective from the global south. Lancet 2011, 378(9789):401-402.
6. Sankoh O, Byass P: The INDEPTH Network: filling vital gaps in global
epidemiology. International journal of epidemiology 2012, 41(3):579-588.
7. Scott JAG, Bauni E, Moisi JC, Ojal J, Gatakaa H, Nyundo C, Molyneux CS, Kombe
F, Tsofa B, Marsh K et al: Profile: The Kilifi Health and Demographic Surveillance
System (KHDSS). International journal of epidemiology 2012, 41(3):650-657.
8. Kouanda S, Bado A, Yameogo M, Nitiema J, Yameogo G, Bocoum F, Millogo T,
Ridde V, Haddad S, Sondo B: The Kaya HDSS, Burkina Faso: a platform for
epidemiological studies and health programme evaluation. International journal of
epidemiology 2013, 42(3):741-749.
9. Kahn K, Collinson MA, Gomez-Olive FX, Mokoena O, Twine R, Mee P, Afolabi
SA, Clark BD, Kabudula CW, Khosa A et al: Profile: Agincourt Health and Socio-
demographic Surveillance System. International journal of epidemiology 2012,
41(4):988-1001.
10. Gyapong M, Sarpong D, Awini E, Manyeh AK, Tei D, Odonkor G, Agyepong IA,
Mattah P, Wontuo P, Attaa-Pomaa M et al: Profile: The Dodowa HDSS.
International journal of epidemiology 2013, 42(6):1686-1696.
11. Martínez-Pérez B dlT-DI, López-Coronado M: M. Mobile health applications for
the most prevalent conditions by the World Health Organization: review and
analysis. J Med Internet Res 2013, 10(6):e120.
12. Bloomfield GS VR, Vasudevan L: Mobile health for non-communicable diseases in
Sub-Saharan Africa: a systematic review of the literature and strategic framework
for research. Global Health 2014, 10:49.
13. Asangansi I, Braa K: The emergence of mobile-supported national health
information systems in developing countries. Studies in health technology and
informatics 2010, 160(Pt 1):540-544.

73
14. Schobel J SM, Pryss R et al.: Towards Process-Driven Mobile Data Collection
Applications: Requirements, Challenges, Lessons Learned. 10th Int’l Conference on
Web Information Systems and Technologies 2014, 10:371–382.
15. Asangansi I MB, Meremikwu M et al.: Improving the Routine HMIS in Nigeria
through Mobile Technology for Community Data Collection. JHIDC 2013, 7, 1.
16. Matavire R MT: Intervention breakdowns as occasions for articulating mobile
health information infrastructures. EJISDC 2014, 63, 3: 1-17.
17. Odhiambo-Otieno GW: Evaluation of existing district health management
information systems - A case study of the district health systems in Kenya. Int J
Med Inform 2005, 74(9):733-744.
18. Hiscox AF MN, Kiche I, Silkey M, Homan T, Oria P, Mweresa C, Otieno B, Ayugi
M, Bousema T, Sawa P, Alaii J, Smith TA, Leeuwis C, Mukabana WRm Takken
W: The SolarMal Project: innovative mosquito trapping technology for malaria
control. Malaria journal 2012, 11:(Suppl 1):O45
19. Hartung C LA, Anokwa Y et al.: Open data kit: tools to build information services
for developing regions. Proc 4th ACM/IEEE Int'l Conf Information and
Communication Technologies and Development 2010:pp. 1–11.
20. Hiscox A, Otieno B, Kibet A, Mweresa CK, Omusula P, Geier M, Rose A,
Mukabana WR, Takken W: Development and optimization of the Suna trap as a tool
for mosquito monitoring and control. Malaria journal 2014, 13.
21. Web-based monitoring system SU2 for data quality control
[https://github.com/SwissTPH/openhds-su2]
22. Derra K, Rouamba E, Kazienga A, Ouedraogo S, Tahita MC, Sorgho H, Valea I,
Tinto H: Profile: Nanoro Health and Demographic Surveillance System.
International journal of epidemiology 2012, 41(5):1293-1301.
23. Pison G, Douillot L, Kante AM, Ndiaye O, Diouf PN, Senghor P, Sokhna C,
Delaunay V: Health & demographic surveillance system profile: Bandafassi Health
and Demographic Surveillance System (Bandafassi HDSS), Senegal. International
journal of epidemiology 2014, 43(3):739-748.
24. Sacoor C, Nhacolo A, Nhalungo D, Aponte JJ, Bassat Q, Augusto O, Mandomando
I, Sacarlal J, Lauchande N, Sigauque B et al: Profile: Manhica Health Research
Centre (Manhica HDSS). International journal of epidemiology 2013, 42(5):1309-
1318.
25. Odhiambo FO LK, Sewe M et al.: Profile: The KEMRI/CDC Health and
Demographic Surveillance System-Western Kenya. International journal of
epidemiology 2012, 41(4):977-987.
26. Wanyua S NM, Goto K et al.: Profile: The Mbita Health and Demographic
Surveillance System. International journal of epidemiology 2013, 42(6):1678-1685.

74
27. Sifuna P, Oyugi M, Ogutu B, Andagalu B, Otieno A, Owira V, Otsyula N, Oyieko J,
Cowden J, Otieno L et al: Health & Demographic Surveillance System Profile: The
Kombewa Health and Demographic Surveillance System (Kombewa HDSS).
International journal of epidemiology 2014, 43(4):1097-1104.
28. Pavluck A, Chu B, Flueckiger RM, Ottesen E: Electronic Data Capture Tools for
Global Health Programs: Evolution of LINKS, an Android-, Web-Based System.
Plos Neglect Trop D 2014, 8(4).
29. Anantraman V, Mikkelsen T, Khilnani R, Kumar VS, Pentland A, Ohno-Machado
L: Open source handheld-based EMR for paramedics working in rural areas.
Proceedings / AMIA Annual Symposium AMIA Symposium 2002:12-16.
30. DeRenzi B, Borriello G, Jackson J, Kumar VS, Parikh TS, Mph PV, Lesh N: Mobile
Phone Tools for Field-Based Health care Workers in Low-Income Countries. Mt
Sinai J Med 2011, 78(3):406-418.
31. Phillips JF, Macleod BB, Pence B: The Household Registration System: computer
software for the rapid dissemination of demographic surveillance systems.
Demographic research 2000, 2:[40] p.
32. Wilcox AB, Gallagher KD, Boden-Albala B, Bakken SR: Research Data Collection
Methods From Paper to Tablet Computers. Med Care 2012, 50(7):S68-S73.

75
3. Profile: The Rusinga Health and Demographic Surveillance System, Western Kenya
Tobias Homan3, Aurelio di Pasquale
1,2, Kelvin Onoka
4, Ibrahim Kiche
4, Alexandra Hiscox
3,
Collins Mweresa4,Wolfgang R. Mukabana
5, Daniel Masiga
4, Willem Takken
3, Nicolas Maire
1,2.
1 Department of Epidemiology and Public Health, Swiss Tropical and Public Health
Institute, Basel, Switzerland
2University of Basel, Basel, Switzerland
3 Laboratory of Entomology, Wageningen University and Research Centre,
Wageningen, The Netherlands
4 Department of Medical Entomology, International Centre of Insect Physiology and
Ecology, Nairobi, Kenya
5 School of Biological Sciences, University of Nairobi, Nairobi, Kenya.
Published as: Homan et al. International journal of epidemiology (2016), 45 (3). pp. 718-727.

76
Abstract
The health and demographic surveillance system on Rusinga Island, Western Kenya,
was initiated in 2012 to facilitate a malaria intervention trial: The SolarMal project.
The project aims to eliminate malaria from Rusinga Island using the nationwide adopted
strategy for malaria control (insecticide-treated bed nets and case management)
augmented with mass trapping of anopheline mosquitoes.
The main purpose of the health and demographic surveillance is to measure the
effectiveness of the trial on clinical malaria incidence, and to monitor demographic,
environmental and malaria-related data variables. By the end of 2014, the 44 km² island
had a population of approximately 25,000 individuals living in 8746 residential
structures. Three times per year all individuals are followed up and surveyed for clinical
malaria. Following each round of surveillance a randomly selected cross section of the
population is subject to a rapid diagnostic test to measure malaria. Additionally,
extensive monitoring of malaria vectors is performed. Data collection and management
is conducted using the OpenHDS platform, with tablet computers and applications with
advanced software connected to a centralized database. Besides the general
demographic information, other health related data is collected that can be used to
facilitate a range of other studies within and outside the current project. Access to the
core dataset can be obtained through the INDEPTH Network or the corresponding
author.

77
Why was the HDSS set up?
A malaria intervention study based on removal trapping of anopheline mosquitoes in
addition to the Roll Back Malaria [RBM] control strategy [1] was initiated on Rusinga
Island, Western Kenya in 2012.
Mosquito traps baited with a synthetic lure that mimics human odour are placed at the
household level to reduce mosquito population density and, as a consequence, lower the
intensity of malaria transmission [2]. Traps are powered by solar energy, which is also
used to provide electric light and mobile phone charging points for the household
members. The combination of solar energy with malaria control led to the project being
named SolarMal. A health and demographic surveillance system [HDSS] was
established to facilitate continued monitoring of demographic, and particularly malaria-
related, variables. In addition, the complex roll-out logistics of the SolarMal
intervention required accurate and up-to-date information about the population and their
housing. Although the main objective of the HDSS is to measure the effectiveness of
the vector control intervention on health and population outcomes, the collected
demographic and malaria specific data may be used for validation of epidemiological
models as well as entomological and parasitological research. The most prominent
objectives facilitated by the HDSS are:
(i) Longitudinal monitoring of demographic dynamics to provide a robust framework
for research.
(ii) Studying the epidemiology of malaria,
(iii) Analysing the effect of the SolarMal intervention on malaria prevalence,
transmission and mosquito abundance.
(iv) Measuring the interaction between the intervention and existing approaches to
malaria control, and environmental and socio-economic variables.
The SolarMal HDSS collects demographic information, malaria related variables and
other information on factors that are likely to influence malaria epidemiology and
malaria mosquito ecology. The HDSS provides different disciplines within the project
with an up-to-date population database. The entomological and parasitological
experimental designs, as well as the logistics for rolling out the intervention, rely on the
continued updating of the study population (WT, personal communication.).
An important component of SolarMal is the inclusion of sociological studies and the
population database enables social scientists to conduct targeted sociological research.
Since 2012 an extensive baseline survey and 8 subsequent follow up rounds have been

78
conducted. The roll out of the intervention traps started in June 2013 and was completed
in May 2015, at that point covering all households on the island.
Where is the HDSS area?
Homa Bay County is located in Western Kenya at Lake Victoria, within the former
province of Nyanza, exposed to the south of the Winam Gulf. Rusinga Island is situated
between latitudes 0°21′ and 0°26 South, and longitudes 34°13′ and 34°07’ East (Figure
3.1). A causeway connects the island with the mainland. Rusinga Island stretches over
44 sq. km with an elevation between 1100 m and 1300 m above sea level. Mean daily
temperatures vary from 16 to 34 degrees Celsius with higher temperatures in the dry
seasons that occur between June-October and late December-February.
Figure 3.1: The upper Figure shows Africa with Kenya highlighted dark grey in the
middle, Kenya with Homa Bay County highlighted; lower Figure depicts Homa Bay
County with Rusinga Island in dark grey.

79
Seasonality in precipitation is traditionally experienced as one long rainy season ranging
from March into May (average of 198 mm per month in the period 2012-2014) and a
short rainy season from October to early December (average of 132 mm per month).
The local administration comprises of two chiefs, each governing one part of the island;
Rusinga East and Rusinga West. The local authority divided the island into eight
subzones containing a total of 36 villages and about 10 beach communities (Figure 3.2).
For the purpose of the SolarMal trial and to measure the impact of the intervention most
effectively, the island was divided into nine metaclusters each consisting of nine
clusters. Each cluster comprises of 50 or 51 households. The HDSS operates from the
International Centre of Insect Physiology and Ecology [icipe] at the village of Mbita
Point at the mainland side of the causeway.
Figure 3.2: Rusinga Island with an uninhabited hill in the middle. Boundaries of
metaclusters (thick black lines); villages (indicated with dots); roads (dashed lines).

80
Who is covered by the HDSS and how often have they been followed
up?
The population of Rusinga Island belongs to the Luo ethnic group and DhoLuo is the
main spoken language. The national languages (English and Swahili) are also used.
Fishing and farming are the principal occupations, with people typically harvesting
millet, sorghum and maize and fishing tilapia and Nile perch. Christianity is the
predominant religion (84%) in this area; the Muslim community (12%) forms a
minority.
Most houses on the island are made of mud or cement walls with iron sheet roofs.
Connection to the electrical grid is rare and there is little to no supply of piped potable
water. There are several health facilities on the island; one governmental health centre,
one government clinic, two private clinics and one drug dispensary. Non-governmental
organisations have established a further two clinics. A district hospital is found at Mbita
point village.
All members of the population are visited three times a year. By August 2015, each
location had been visited eight times, including the baseline enumeration. With the
baseline conducted in 2012, and the latest update round completed in mid-2015,
currently eight rounds of surveillance have been carried out in the course of the first two
complete years of health and demographic surveillance. During this period, a total of
33,283 people were registered in the database, with residences divided over 8746
houses, and belonging to 5457 households. The actual number of people living on
Rusinga island mid-2015 was 24,643.
The leading causes of death in this area are HIV/AIDS related, with an HIV prevalence
of
26% (Ministry of Health Kenya: HIV estimates, 2014). Malaria is hyper-endemic and
existent in this region throughout the year, with peaks in transmission at the end and just
after the rainy seasons, where Plasmodium parasite prevalence of around 30% is
reported (WHO Country Profile 2014:
Kenya, Malaria). The population is characterised by a seasonal influx of labourers
searching for jobs in the fishing industry. Temporary in and out migrations are
distinguished from permanent migration within the Rusinga HDSS. Households are
recorded following the Luo description of a dhala: any set of houses that share a head of
household and/or are economically dependent.
The age distribution of Rusinga has a typical East-African profile. Baseline studies
(2012) and 2 years of data collection (2013 and 2014) demonstrate that approximately
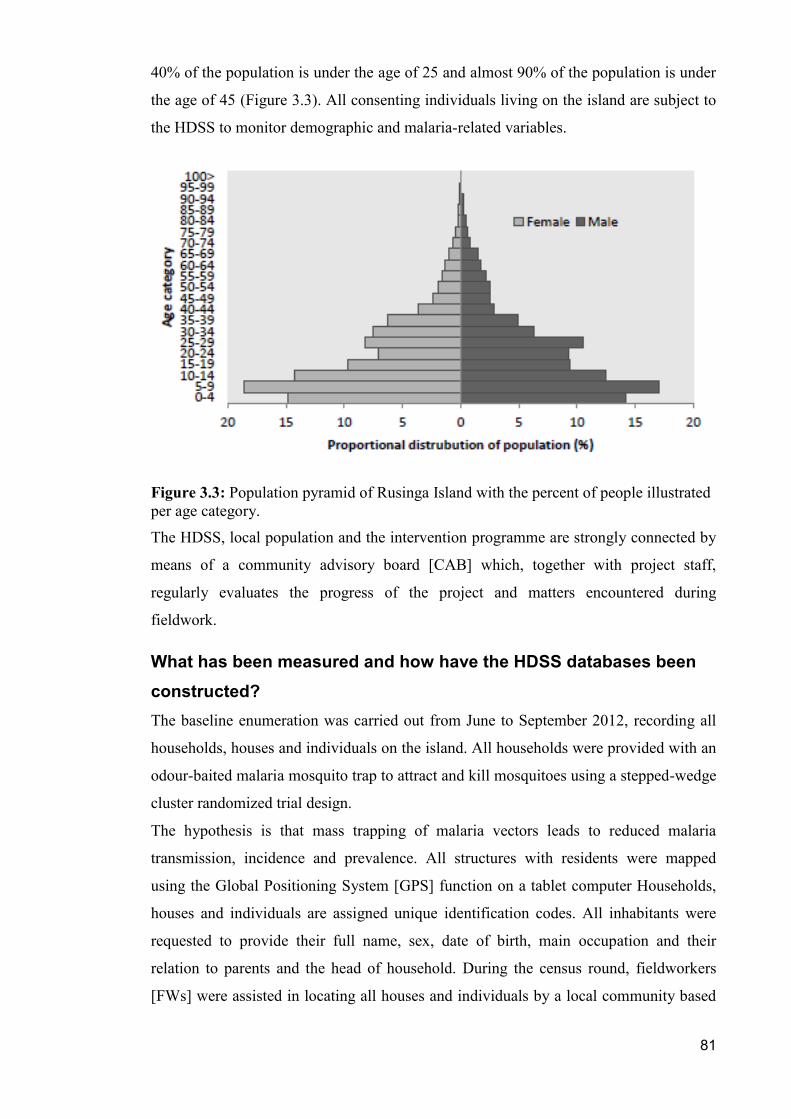
81
40% of the population is under the age of 25 and almost 90% of the population is under
the age of 45 (Figure 3.3). All consenting individuals living on the island are subject to
the HDSS to monitor demographic and malaria-related variables.
Figure 3.3: Population pyramid of Rusinga Island with the percent of people illustrated
per age category.
The HDSS, local population and the intervention programme are strongly connected by
means of a community advisory board [CAB] which, together with project staff,
regularly evaluates the progress of the project and matters encountered during
fieldwork.
What has been measured and how have the HDSS databases been
constructed?
The baseline enumeration was carried out from June to September 2012, recording all
households, houses and individuals on the island. All households were provided with an
odour-baited malaria mosquito trap to attract and kill mosquitoes using a stepped-wedge
cluster randomized trial design.
The hypothesis is that mass trapping of malaria vectors leads to reduced malaria
transmission, incidence and prevalence. All structures with residents were mapped
using the Global Positioning System [GPS] function on a tablet computer Households,
houses and individuals are assigned unique identification codes. All inhabitants were
requested to provide their full name, sex, date of birth, main occupation and their
relation to parents and the head of household. During the census round, fieldworkers
[FWs] were assisted in locating all houses and individuals by a local community based

82
organisation, the Rusinga Malaria Project [RMP], which has been involved in malaria
control practices on the island for over a decade. From January 2013, collection and
updating of demographic and malaria and health related data started. The HDSS
operates by house-to-house interviews, visiting on average 120 houses per day equally
distributed across the nine metaclusters. Interviews take approximately 30 min.
depending on the size of the household. Each HDSS round is completed in
approximately three months. During household visits, observed pregnancies, new births,
deaths and migrations which have occurred since the previous visit are recorded and
updated (Table 3.1). Clinical malaria is recorded during HDSS rounds based on fever
recalls and a conditional RDT, and at the end of each round the team performs blood
collections on a random sample of the population. Digital questionnaires on
demography are consistent with the HDSS questionnaire format of the principal HDSS
association globally; INDEPTH network [3, 4]. These standardised questionnaire
formats are widely used in East Africa, including Kenya, and therefore apply well to our
study site. The HDSS uses tablet computers and the OpenHDS system, which allows for
rapid centralization of the data without a need for processing paper forms. This reduces
data management overhead and allows for rigorous and timely quality control. A
detailed description of this system can be found elsewhere [5]. The HDSS team consists
of 10 FWs, a fieldworker manager [FWM] and a data manager. The local team has
access to a senior software manager. A server running the OpenHDS software is hosted
at the icipe field station in Mbita.
Visit form: scanning bar code on house to
confirm follow up visit and set date of
interview
Pregnancy observation: mother ID, # of
months pregnant, attended health facility
during pregnancy, received tt-injection1,
other medicines, estimated date of birth,
woman’s first pregnancy
Household (*): new household ID,
number of houses in the household, name
and ID of household head ID and name
Pregnancy outcome: delivery outcome,
name of child, date of birth of child, sex,
creation of new individual ID, house ID,
household ID, link to parents ID
House (*): new house ID, longitude and
latitude, household head ID and name,
photo of the house, number of individuals
Migration-Out: individual ID, house ID,
household ID, date of migration, within
Rusinga, to which village/zone, out of
Rusinga, reason for migration
Individual (*) : new individual ID, names,
date of birth, sex, level of education,
occupation, relation to the household head
Migration-In: previously registered by
SolarMal, village/zone, new individual
ID, names, date of birth, sex, highest
level of education, primary occupation,
relationship to the household, house ID,
household ID, date of migration, reason

83
of migration, moved from
Household characteristics (**): ownership of dwelling, # of rooms, # of
bedrooms, location of kitchen, source of
electricity, source of light, agricultural
land ownership, wall construction, floor
construction, roof construction, whether
eaves are screened, whether IRS has been
applied during the past year, bed nets
reported, bed nets observed, # of bed nets,
when were bed nets obtained, condition of
bed nets, other mosquito control methods
used by household members
Individual health: individual ID, any
illness during the past 2 weeks, current
fever reported, under malaria treatment at
the time of the visit, temperature (if
indicated illness), RDT2 result (tested if
> 37.3 ° C), any respiratory symptoms,
medical attention, what medical
attention, drugs against fever, which
drugs
Death registration: individual ID, name,
date of death, outcome of verbal autopsy,
verbal autopsy performed by, cause of
death, place of death
Table 3.1: Content of questionnaires administered during the census and each follow up
survey. (*) data is collected only when a new subject is enumerated. (**) indicates that
the questionnaire is administered for all new residential structures, as well as every
second year for all registered residential structures.
1 tt-injection is a tetanus vaccine, which can be injected during pregnancy to prevent
neonatal tetanus
2 RDT is a rapid diagnostic test performed to promptly detect evidence of malaria
parasites in the blood.
OpenHDS, a software platform that is based on a centralised database, a web
application for data management [6], is linked to a tablet computer-based mobile
component which allows digitisation of data at the point of capture, and wireless
synchronization to the central data store based on the Open Data Kit [ODK] platform [7,
8]. Samsung Galaxy Tab 2 tablet computers were used from the start for data collection,
and upgraded after years to the successor Galaxy Tab 3. Data entry errors are minimised
through basic range checks and the integration of different questionnaires through
systemwide IDs in a guided workflow. The ODK and OpenHDS platforms allow the
FWM and data manager to use a range of data cleaning options, many of which are
guided by reports generated automatically on a nightly basis. This process enables
scientists to use the clean data for analysis with minimal delay. Furthermore, to monitor
the performance of FWs a web-based tool was developed that monitors progress of the
work FWs conduct over time, allowing the project to optimize the quality and
effectiveness of data collection. Finally the data of all sub-disciplines of SolarMal are
connected to each other by one of the three levels of unique codes and kept in a MySQL
relational database.

84
Calculation of demographic rates and further quality assurance is conducted using the
iShare2
software (http://www.indepth-ishare.org).
Key findings
The demographic data collected during the census survey in 2012 up until May 2015 is
the basis for Table 3.2. Reported demographic figures are calculated for the complete
years of 2013 and 2014. To place the reported rates in context, the same measurements
calculated by other HDSSs operating close to Rusinga in the years 2007 and 2010 are
also reported in Table 3.2. Kaneko et al. [9] published demographic information on the
basis of the Mbita HDSS covering Rusinga and neighbouring areas in 2011. An HDSS
at Kisian and surrounding areas operated by the KEMRI/CDC some 150 km North-East
of Rusinga reported rates for 2007 [10]. In calculating person-time at risk we defined
residents as those who stayed in the HDSS area 60 days (two months) or longer.
Registered individuals who stayed less than 60 days during a year were removed for the
calculation of total person-years. Table 5.2 shows the key demographic indicators of the
Rusinga HDSS for the years 2013 and 2014. The total population that was registered in
the database by the end of 2013 was 29 206 and the total contributed person-years in
2013 was 24 350. The total number of individuals enumerated by the end of 2014 was
33 283. By December 2014 the HDSS registered a total of 8746 residential structures
divided over 5457 households. The sex ratio is skewed towards females with 91 men for
every 100 women. The average population density was 553 (2013) and 577 (2014)
person years per square kilometre calculated on basis of 44 km² of landmass. However,
as shown in Figure 3.4, the population is not evenly distributed and there are densely
populated fishing beaches and a large village in the southeast; the hill in the centre of
the island is uninhabited. The total fertility rate [TFR] is calculated as the average
number of children that would be born per woman if all women lived to the end of their
childbearing years (15-49 years) yielding a TFR 2.1 for both years.

Table 3.2: Key demographic indicators over the years 2013 and 2014 on Rusinga Island; compared with indicators reported during the Mbita HDSS in
2010 and the KEMRI HDSS in 2007.(*)No in-migration rates reported for 2013. Catch-up enumerations in the first months of 2013 enumerated
households which were missed in the baseline survey, and could therefore not reliably be distinguished from in-migration events.
Indicator Unit Rusinga 2013 Rusinga 2014 Mbita 2010 KEMRI 2007
Total population visited Total number of individuals enumerated 29.206 33.283 - -
Total houses visited Total number of houses enumerated 8141 8746 - -
Total households visited Total number of households enumerated 4948 5457 - -
Male : Female ratio Proportions of sexes 91 91 91.2 90.1
Population density Average number of people per km2 553 577 - -
Total fertility rate Average number of live children per woman 2.1 2.1 3.7 5.3
Crude birth rate Births per 1000 person years 18.7 18.5 29.7 36.8
Crude death rate Deaths per 1000 person years 6.3 5.8 9.1 15.9
Life expectancy at birth (Male) Expected years to live at birth 66.9 68 57.5 46.5
Life expectancy at birth (Female) Expected years to live at birth 68.8 68.6 61 46.5
Infant mortality ratio (<1 year) Infant deaths per 1000 live births 17 11 14.1 76
Child mortality rate (1-4 years) Child deaths per 1000 person years 7.4 6.8 - 16.5
Child mortality ratio (1-4 years) Deaths between age 1 and 5 per 1000 children 29 27 - 58.8
Under-five mortality rate Under-five deaths per 1000 person years 9.7 7.5 - 29.5
Under-five mortality ratio Under-five deaths per 1000 live births 45 37 91.5 167
Crude in-migration rate (external) In-migrations per 1000 person years (*) 127.9 64.1 115
Crude out-migration rate (external) Out-migrations per 1000 person years 164.6 148.9 86.2 111
Malaria prevalence Percentage of population with a positive RDT 27.1 28.1 - -
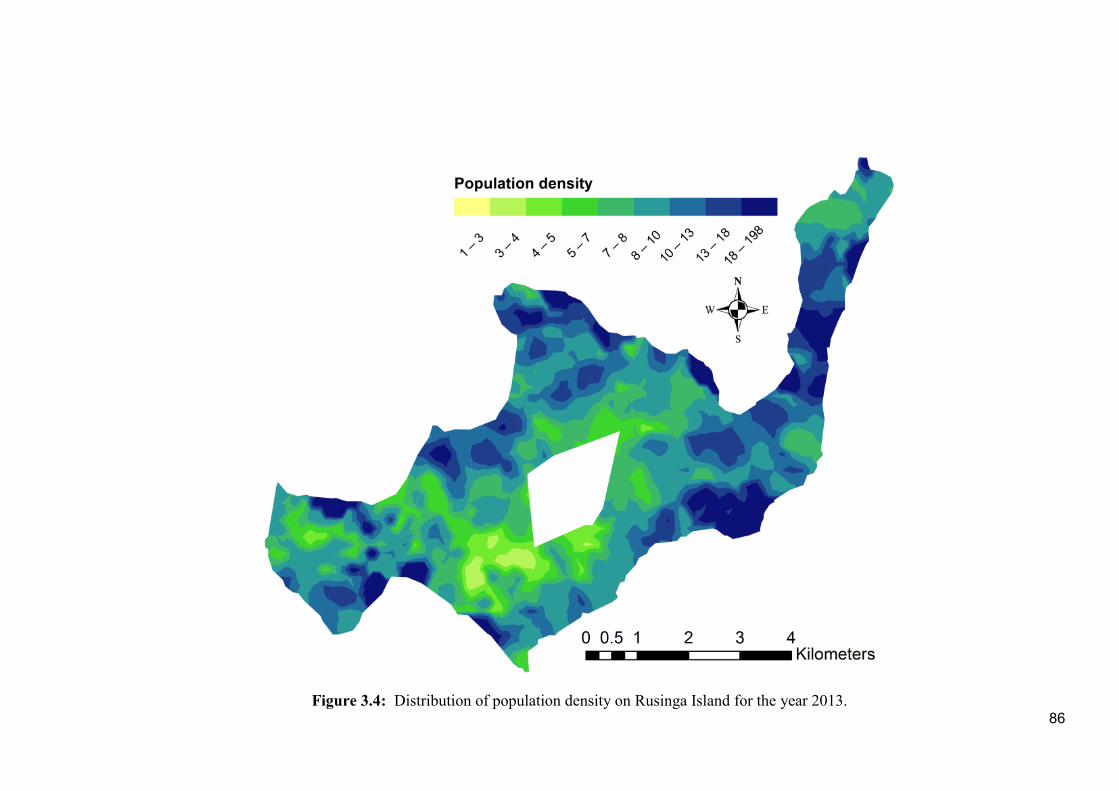
86
Figure 3.4: Distribution of population density on Rusinga Island for the year 2013.

The crude birth rate [CBR] and death rate [CDR] are presented as the number of live
births or deaths per 1000 residents. We found a CBR of 18.7 (2013) and 18.5 (2014),
and CDRs of 6.3 and 5.8 were determined for 2013 and 2014. Compared with the
HDSS of KEMRI/CDC at Kisian, both the Mbita and the Rusinga HDSS report a lower
CDR. The life expectancy [LE] at birth for females and males is calculated as the total
number of person-years lived in all age intervals of the static population divided by the
number of alive individuals at the start of every 5year age interval. For males in 2014
the LE at birth was 68 years, for females the LE at birth was 68.6 years.
The infant mortality ratio was 17 in 2013 and 11 in 2014 (number of infant deaths, <1
year, per 1000 live births). This relatively large difference may be explained by the
protective effect of the malaria vector intervention. The child mortality ratios in
consecutive years were remained 27 (number of deaths between 1-4 years per 1000
children) and the under-five mortality ratios are presented as the number of deaths in
that age category per 1000 live births was 45 and 37.
Calculation of all mortality rates as well as the CDR yield lower rates and ratios than
the KEMRI/CDC HDSS. Our findings are comparable with the results of the Mbita
HDSS [9]. Unlike the Mbita and the Rusinga HDSSs, the KEMRI/CDC HDSS worked
together with at least two health clinics in recording deaths, which most likely resulted
in a more sensitive death registration system. In addition, it is common in Luo culture,
to return to the place of birth at the time of death. As there are many working
immigrants residing on Rusinga Island, this could explain the lower number of recorded
deaths taking place on the island.
The in-migration and out-migration rates are also calculated using person-years. The
analysis of the migration rates for the year 2014 show a crude in-migration rate of 12.9
per 1000 person years and a crude out-migration rate of 148.9 [10].
Table 3.3 summarises characteristics of 6640 inhabited houses of which information
about the house was collected. These results are comparable to other HDSSs in Western
Kenya, such as Asembo and Gem [10] and around Mbita [9, 11]. On Rusinga a typical
house is made from mud walls, a roof of iron sheeting with a cement floor. Most houses
have bed nets, but are not protected against mosquitoes flying into the house through the
open eaves [12]. Only a fraction of the population has access to the electrical grid and
the main sources of indoor light were kerosene lamps at the time when the SolarMal
intervention was rolled out.

88
Finally, the average the island-wide malaria prevalence and the average number of
malaria mosquitoes caught per trapping night for the rainy seasons in 2013 and 2014 are
reported in Table 3.2. The malaria prevalence is established on basis of a cross sectional
survey of 10 percent randomly selected people tested with a RDT. Malaria mosquito
abundance is established on basis of three surveys of mosquito monitoring at 80
randomly selected households. Ignoring intervention arms, malaria prevalence did not
differ much island wide between both years with 27.1% and 28.1% prevalence,
respectively. However, we found a significant difference in malaria mosquito
abundance with an average of 0.30 mosquitoes per trapping night in 2013 versus 0.21 in
2014.
Table 3.3: Summary of house information collected over the year 2013.

89
Future analysis plan
The HDSS data are a valuable resource when studying the parasitological,
entomological and sociological [13] aspects of the malaria interventions. For example,
the spatial and temporal distribution of malaria, and its vectors, in combination with
environmental data, will be used to measure the effect of the introduction of odour-
baited traps in combination with pre-existing widespread use of LLINs and case
management. Other topics being studied are the emergence of malaria hot spots, models
of the interaction between vector presences, and the spatial analysis of malaria. Data
from the HDSS and the trial are used to parameterise mathematical models of malaria.
However, this HDSS provides a platform not only to study and analyse malaria related
outcomes within the SolarMal project, but also for other public health related research
on Rusinga Island. From 2016 we establish prolonged monitoring of the intervention,
and we strive to introduce eave screening to enhance the possible effect of odour-baited
traps on malaria transmission. Furthermore, we will introduce verbal autopsy and
various other standardised types of health related data. Knowledge, resources and
objectives will be combined to equip the Rusinga HDSS with a broader scope of health-
related subjects after the SolarMal project comes to an end.
What are the main strengths and weaknesses of the Rusinga HDSS?
A major strength of this HDSS is the innovative process for data collection in the field
(OpenHDS and ODK) using tablet computers which simplifies the management of
system-wide unique identifiers for individuals and houses and their linking to health- or
intervention-related data. Point-of-capture digitization and the client-server architecture
of the data management system saves time and money in terms of entering,
accumulating, managing and processing data compared to its predecessor Household
Registration System 2 [14]. Data quality is of great importance in a HDSS, and due to a
digital data collection organization rather than a paper based system, the error rate of the
collected data in the Rusinga HDSS is well below 1% according the quality metrics of
iShare2. A weakness of the pioneering system in this phase is that support of a skilled
software developer and data manager is required. Other applications with web interfaces
that make this HDSS distinct are the real-time monitoring of demographic and health
related events, keeping track of the performance of FWs and the use of geographical
information systems to assist in precise navigation, and spatial research and analysis.
Data can thus immediately be processed and used to facilitate all scientific disciplines in
the project. Another strength of the Rusinga HDSS is the fact that it closely works

90
together with the interest groups in the study area. By communicating with community
health workers, and delegates from different segments on the island, a sustaining
cooperation and interaction has been created. In the future it would be possible to
expand the system to capture information on other health outcomes.
A priority and an important improvement for the near future is the integration of verbal
autopsies as part of the demographic surveillance.
Data sharing and collaboration
After the main publications of the effect of the SolarMal intervention are published, all
basic data and descriptive maps are available through the INDEPTH network or the
SolarMal project management.
Individual and household level data relating to demography or malaria for the purpose
of new analysis are open to scientists in collaboration with Wageningen University.
Please contact [email protected] for any enquiries and queries regarding
datasets of the Rusinga HDSS.
Funding
This work and the Rusinga HDSS is funded as part of the SolarMal project by the
COmON
Foundation, the Netherlands via Food for Thought Campaign, and Wageningen
University Fund.
Acknowledgements
Firstly we want to thank the population of Rusinga Island, for cooperating with us and
for embracing the project. We are also very grateful to the International Centre of Insect
Physiology and Ecology for enabling us to implement and manage all our scientific
activities from the Thomas Odhiambo Campus in Mbita. Besides we want to
acknowledge INDEPTH network for their overarching views and input.
Conflict of interests
None declared
KEY MESSAGES
The Rusinga HDSS covers an island in Lake Victoria, Kenya. Living conditions
and health indicators on Rusinga suggest to be better compared to HDSSs
nearby.

91
The Rusinga HDSS facilitates in-depth studies into the transmission of malaria.
A trans-disciplinary intervention trial aiming for the elimination of malaria
transmission is the core driver behind this surveillance.
The HDSS uses the OpenHDS system which provides a cost-effective way to
collect, store and manage data, as well as to safeguard quality assurance.
The HDSS provide a robust foundation to conduct not only malaria research;
future collaboration with local and international institutes will enable researchers
to combine resources and interests.

92
References 1. RBM: Annual report 2013. In.: Roll Back Malaria Partnership, Geneva,
Switzerland; 2013.
2. Hiscox AF MN, Kiche I, Silkey M, Homan T, Oria P, Mweresa C, Otieno B, Ayugi
M, Bousema T, Sawa P, Alaii J, Smith TA, Leeuwis C, Mukabana WRm Takken
W: The SolarMal Project: innovative mosquito trapping technology for malaria
control. Malaria journal 2012, 11:(Suppl 1):O45
3. Sankoh O, Binka F: INDEPTH Network: a viable platform for the assessment of
malaria risk in Developin g countries. Wag Ur Fron 2005, 9:99-105.
4. Sankoh O, Byass P: The INDEPTH Network: filling vital gaps in global
epidemiology. International journal of epidemiology 2012, 41(3):579-588.
5. Homan T, Di Pasquale A, Kiche I, Onoka K, Hiscox A, Mweresa C, Mukabana WR,
Takken W, Maire N: Innovative tools and OpenHDS for health and demographic
surveillance on Rusinga Island, Kenya. BMC research notes 2015, 8(1):397.
6. Web-based monitoring system SU2 for data quality control
[[https://github.com/SwissTPH/openhds-su2]
7. Hartung C LA, Anokwa Y et al.: Open data kit: tools to build information services
for developing regions. Proc 4th ACM/IEEE Int'l Conf Information and
Communication Technologies and Development 2010:pp. 1–11.
8. Asangansi I MB, Meremikwu M et al.: Improving the Routine HMIS in Nigeria
through Mobile Technology for Community Data Collection. JHIDC 2013, 7, 1.
9. Kaneko S KoJ, Kiche, I et al.: Health and Demographic Surveillance System in the
Western and Coastal Areas of Kenya: An Infrastructure for Epidemiologic Studies
in Africa. J Epidemiol 2012, 22(3):276-285.
10. Odhiambo FO LK, Sewe M et al.: Profile: The KEMRI/CDC Health and
Demographic Surveillance System-Western Kenya. International journal of
epidemiology 2012, 41(4):977-987.
11. Wanyua S NM, Goto K et al.: Profile: The Mbita Health and Demographic
Surveillance System. International journal of epidemiology 2013, 42(6):1678-1685.
12. Lindsay SW, Snow RW: The trouble with eaves; house entry by vectors of malaria.
Transactions of the Royal Society of Tropical Medicine and Hygiene 1988,
82(4):645-646.
13. Oria PA, Alaii J, Ayugi M, Takken W, Leeuwis C: Combining malaria control with
house electrification: adherence to recommended behaviours for proper deployment
of solar-powered mosquito trapping systems, Rusinga Island, western Kenya.
Tropical medicine & nternational health : TM & IH 2015, 20(8):1048-1056.
14. Phillips JF, Macleod BB, Pence B: The Household Registration System: computer
software for the rapid dissemination of demographic surveillance systems.
Demographic research 2000, 2:[40] p.

93
Evidence for improved quality/timeliness of data and cost
savings

94
4. Assessing the population coverage of an Health Demographic Surveillance System using satellite imagery and crowd-sourcing
Aurelio Di Pasquale1,2*, Robert S. McCann 3, Nicolas Maire1,2
1 Department of Epidemiology and Public Health, Swiss Tropical and Public Health
Institute, Basel, Switzerland
2University of Basel, Basel, Switzerland
3 Laboratory of Entomology, Wageningen University and Research Centre,
Wageningen, The Netherlands
Published as: Di Pasquale et al. PLOS ONE (August 2017), 12(8).

95
Abstract
Remotely sensed data can serve as an independent source of information about the
location of residential structures in areas under demographic and health surveillance.
We report on results obtained combining satellite imagery, imported from Bing, with
location data routinely collected using the built-in GPS sensors of tablet computers, to
assess completeness of population coverage in a Health and Demographic Surveillance
System in Malawi.
The Majete Malaria Project Health and Demographic Surveillance System, in Malawi,
started in 2014 to support a project with the aim of studying the reduction of malaria
using an integrated control approach by rolling out insecticide treated nets and
improved case management supplemented with house improvement and larval source
management. In order to support the monitoring of the trial a Health and Demographic
Surveillance System was established in the area that surrounds the Majete Wildlife
Reserve (1600 km2), using the OpenHDS data system.
We compared house locations obtained using GPS recordings on mobile devices during
the demographic surveillance census round with those acquired from satellite imagery.
Volunteers were recruited through the crowdcrafting.org platform to identify building
structures on the images, which enabled the compilation of a database with coordinates
of potential residences. For every building identified on these satellite images by the
volunteers (11,046 buildings identified of which 3424 (ca. 30%) were part of the
censused area), we calculated the distance to the nearest house enumerated on the
ground by fieldworkers during the census round of the HDSS. A random sample of
buildings (85 structures) identified on satellite images without a nearby location
enrolled in the census were visited by a fieldworker to determine how many were
missed during the baseline census survey, if any was missed. The findings from this
ground-truthing effort suggest that a high population coverage was achieved in the
census survey, however the crowd-sourcing did not locate many of the inhabited
structures (52.3% of the 6543 recorded during the census round).We conclude that
using auxiliary data can play a useful role in quality assurance in population based
health surveillance, but improved algorithms would be needed if crowd-sourced house
locations are to be used as the basis of population databases.

96
Introduction
Detailed, high resolution and up-to-date maps on human settlements are not available
for many rural areas in low and middle income countries, but such information on
human population distribution would be invaluable for measuring precisely the impacts
of population growth, for monitoring changes and for planning interventions (1), in
particular in the health sector. The absence of such information makes the planning and
implementation of field studies of public health a challenge in these places.
One approach to resolving these challenges is to establish Health and Demographic
Surveillance Systems (HDSS). An HDSS is a system that collects longitudinal data on
core demographic events (births, deaths, migration, and relationships) and certain health
indicators at regular intervals (normally between 3-4 times per year) from a target
population in an area where government-based data for these events and indicators are
unreliable due to total absence of a Civil Registration System (CVRS) in the area or
improperly recorded data (2). HDSS are an importance source of demographic
information in areas where routine vital registration is absent or incomplete and serve as
sampling frames for intervention trials, providing a comprehensive list of households to
be selected when monitoring trial outcomes. Without an HDSS, the absence of high
resolution population maps makes establishing the level of population coverage
inherently difficult.
The Majete Malaria Project (3) in Malawi (MMP) is an operational research project in
southern Malawi that aims to increase community participation in malaria control
through education and community engagement, and to study the impact of structural
house improvements and larval source management on malaria transmission when
implemented in addition to standard malaria control interventions (3).
Ensuring completeness and accuracy of the population database is essential for accurate
characterization of core demographic as well as key health indicators in an HDSS, but
ground censuses are labor-intensive, time-consuming, and are not necessarily complete.
Unlike ground-truthed maps of house locations, high-resolution satellite images are
generally available (4), and easy to access through an application programming
interface (API). There are many popular or less popular available online as Google
Maps, Bing Maps, OpenStreetMaps, and MapQuest... All provide similar services with
some more specialized on a specific feature (traffic, driving directions, education etc…).
Bing map was used rather than Google Maps because of a suspected incompatibility

97
between the OpenLayer library and Google Maps at the time of the development of the
web application.
We present an approach for estimating the population coverage of an HDSS using
geolocations of buildings, crowd-sourced from satellite imagery, to assess the
completeness of the population data. This exploits features of the OpenHDS data
system, which is increasingly used as a standard in HDSS sites, combined with
volunteered geographic information (VGI) (5), and show the results of applying this to
the area of the MMP.
A crowd-sourcing approach was used to collect geo-locations of houses in the study
area of the MMP from satellite images. This was used to establish a database of
building geolocations for comparison with that established from the census of the
population by field teams, allowing us to identify buildings which were possibly missed
in the HDSS census. The population coverage of the census for the HDSS was
estimated on the basis of visits by a supervisor to a sample of locations identified as
buildings on the satellite images but absent from the census database at the end of the
census-round (ground-truthing).
Methods
Population
The HDSS is run in the Chikhwawa District, an area in the lower Shire River Valley
region of southern Malawi. The district, mainly rural, has a population of over 530,000
people distributed in an area of about 4,800 km2 (6). Since starting in 2014, MMP has
initially concentrated efforts in three regions, referred to for convenience as focal areas
A, B and C, respectively. Focal areas were delineated to cover the same villages as
those targeted by one of MMP’s implementing partners, The Hunger Project (7), and
spaced roughly evenly around Majete Wildlife Reserve (MWR) to capture a maximum
amount of the ecological variation present in the area. Villages neighboring these three
focal areas, but which were not covered by The Hunger Project, were not eligible to be
enrolled in the HDSS.
Data System
The HDSS data were managed using the OpenHDS System (6,8,9). OpenHDS is an
HDSS data system developed on a standard relational database management system
(Mysql, Postgress, MS SQL Server etc.), designed and developed to enable simpler and

98
more robust data collection and data management routines than possible with paper-
based data collection traditionally used in population-based surveillance. Data collection
in the field uses an application running on tablet computers.
The OpenHDS System (8,10) was set up at the startup of the HDSS in Majete, requiring
installation of server components of the system on local server. The OpenHDS system
is interfaced with the Open Data Kit (ODK) an open source suite of tools to author,
manage and run data collection with mobile devices (11). Samsung Galaxy Tab-3
Android tablets running the version 4.1.2 of Android (Jelly Bean) (12) were configured
with the OpenHDS mobile (13) and the ODK Collect (14) applications, to communicate
with the ODK Aggregate (11) and OpenHDS web (15) component through the wi-fi
network at the field station.
During the census, demographic surveillance visit to each location in the study site,
location coordinates were captured through the tablets’ in-built GPS to build a database
of inhabited buildings. This approach allowed the aggregation of data points in a central
database in near-time, i.e. within days after a house was visited.
Field data collection
12 fieldworkers recruited from the target communities for their knowledge of the area
and to ensure good relations with the communities were trained on the use of the
OpenHDS mobile system.
Each HDSS has a defined location hierarchy in the area under surveillance. The lowest
level of this location hierarchy is the one leading the ID generation for the HDSS
entities and is important in our study for the identification of houses that became part of
the ground-truthing (see section “Ground truthing”). A complete list of the villages
(lowest location hierarchy level) was obtained from African Parks-Majete, the
management authority of MWR and implementing partner in MMP. In the area targeted
for the HDSS surrounding MWR, there are 62 villages (Figure 4.1).

99
Figure 4.1. Map showing Majete Wildlife Reserve, surrounded by 19 groups of
villages known as community-based organizations (CBO). The 62 villages
enumerated in the current study are located in three focal areas. Village populations are
as indicated in the legend (Reprinted with slight modification from Kabaghe et al 2017
under a CC BY license, with permission from PLOS, original copyright 2017).
At village level during the census round, the fieldworker collected location information
where individuals were living. This task was performed through OpenHDS mobile
integrated with the ODK collect application. After the login into the OpenHDS mobile
application, the fieldworker had to select the village where the house was located, going
through selecting the hierarchies available in the OpenHDS mobile (Figure 4.2). Once
he selected the village, he had to create the location by pressing the create location
button. An ODK Xform was automatically opened on the tablet, pre-filled with data
previously selected in the OpenHDS app, plus a unique ID identifying the fieldworker, a
unique ID associated to the location automatically generated through the OpenHDS
mobile application according with the INDEPTH standardized identifiers (4,15), and the
date of the visit to the location. At this point, the coordinates of the location were
recorded by the fieldworker using the GPS sensor of the tablet. If the sensor reported
accuracy of 5 meters or less, the coordinates were recorded automatically. In cases
where such accuracy could not be reached due to weak GPS signal, the fieldworker was

100
allowed to manually accept a positioning with lesser accuracy. The information of the
locations was then transferred to the system central database.
Figure 4.2. OpenHDS mobile application snapshot of location hierarchy selection.
Volunteered locations
A software application called Rural Geolocator was developed using the PyBossa
framework (17) and the Openlayers library (18) to present satellite images from Bing
(19–21), of the study areas in a web-browser (22). PyBossa (inspired by the Bossa
platform(23)), is an open-source platform for applications using human interaction or
recognition through the help of volunteers (crowd-sourcing) to obtain information that

101
a machine alone cannot easily deduce. Rural Geolocator was hosted on the easily
accessible crowd-sourcing platform named crowdcrafting.org (24–26) (Figure 4.3).
Volunteers were recruited via this platform by advertising the project on
crowdcrafting.org, and on social media. The volunteers were provided with a simple
and well defined task each time, which consisted of visually inspecting a small section
of the study area (300-350m x 500-600m) and marking all potentially inhabitable
structures using mouse clicks. If no houses were spotted in the determined area, the
volunteer would submit the task without marking anything. Tasks were replicated at
least three times, i.e. each section was processed by a minimum of three different
volunteers. Volunteers were distinguished either by their user id (for registered
volunteers), or on the basis of the IP address of their computer (for anonymous
volunteers). Replicate results submitted for each task were consolidated using the
following clustering approach: contributed geolocations were processed sequentially
and added to a set of points, but only if the set did not yet contain a location less than
10m away. In case such a location was already in the set, it was replaced with a location
mid-way between the contained and currently processed point. The number of replicates
contributing to each of the geolocations in the resulting dataset was recorded.

Figure 4.3. Rural Geolocator: A web-application for identifying houses on satellite images by visual inspection (illustrative purposes only).

The tasks processed by the volunteers were grouped into three batches corresponding to
the three focal areas described above (A, B, and C). The batch sizes for focal areas A, B
and C were and 682, 2953, and 1031 tasks, respectively. The area covered by each batch
was defined prior to the completion of the HDSS census, and therefore the spatial extent
of each batch was greater than the village borders eventually identified by the HDSS
census.
Ground truthing
At the end of the census, crowd-sourced geolocations were compared with the GPS-
based coordinates collected by the study team to identify locations which were
potentially missed in the census. In a first step, data points from the census were
processed by grouping the points according to the village in which they were collected
using the location id assigned by the fieldworker. A convex hull was placed around the
points in each village (27). Next, the crowd-crafted geolocations were processed
sequentially. Points that were located outside a village defined by the convex hull
described above were discarded, assuming that these locations were unlikely to be valid
locations for the HDSS villages. Points inside a village were classified as either “near”
if a geolocation from the census was closer than 40m, or flagged as “distant” if this this
was not the case (Figure 4.4). The rationale for this was that research assistants would
visit any house they could see while walking through a village, and we considered it
most likely for “distant” locations, if any, to have been missed by the field team’s visual
assessments. A random sample of 85 of these locations were mapped and provided to a
supervisor for “ground-truthing” to determine the nature of these potential
discrepancies, and to estimate the coverage of the population during the census.
Fieldworkers, guided by the generated maps and by the coordinates collected for each
location, visited the randomized candidate locations and recorded what they observed
there. The goal was to verify if these “missing” houses in the census round were meant
to be part of the HDSS or for any reason were correctly excluded.

Figure 4.4. Overlay of crowd-sourced and ground-collected locations. Red pins denote candidate locations for a visit during ground-truthing, i.e.
volunteer-provided locations without a GPS-collected match. Green pins are the location recorded as enumerated houses by research assistants during
household interviews. Yellow pins are geolocations far from the census one but closer than 40m.

Only locations that were identified in all three replicates were eligible for a ground-
truthing visit, as the limited time available for visits was focused on the most promising
candidate locations.
We also tested if there were houses which were enrolled during the HDSS census but
absent from the set of locations identified on satellite images. We used an approach
analogous as described above, i.e. we classified HDSS locations as “distant” if they did
not have a nearby location among the set of locations identified on the satellite imagery,
again using a threshold of 40m.
Ethical consideration
Ethical clearance for the HDSS was obtained from the University of Malawi, College of
Medicine Research Ethics Committee (COMREC) in Malawi (P.05/14/1579).
Permissions were obtained from the Ministry of Health and the district health
authorities in Chikwawa District. Prior to the start of the study, a series of meetings
were held in participating communities to explain the nature and purpose of the study.
We obtained individual written informed consent from all participants.

106
Results
The census round in the MMP projects started on 20 August 2014 and ended on 14
November 2014, data were collected in one additional village in February 2015. During
this census round 6,543 locations and 24,129 individuals were registered in the
OpenHDS System.
A group of volunteers from more than 30 different countries contributed to the crowd-
sourced geolocation effort (Figure 4.5). 299 registered volunteers (i.e. with a user
account on crowdcrafting.org) processed a total of 10,445 task replicates, and
unregistered volunteers processed 3,091 task replicates connecting from computers with
174 distinct IP addresses. The processing of the all 4,306 tasks representing the study
area was completed within four months.
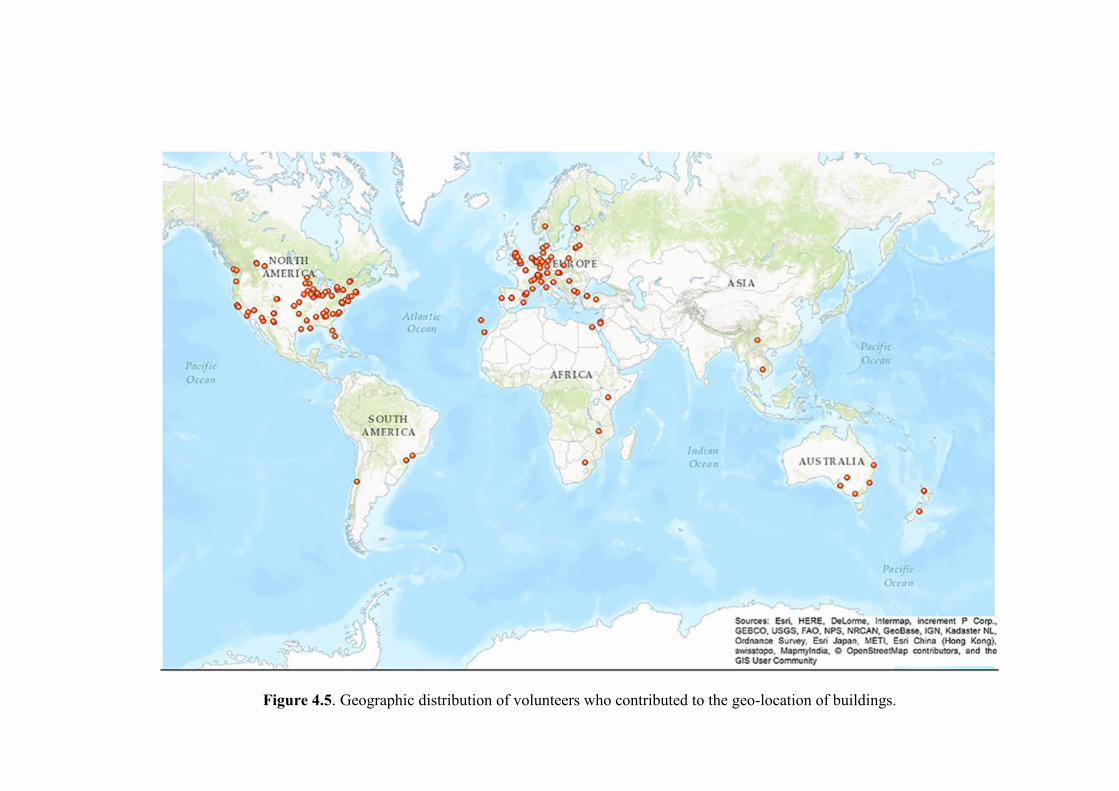
Figure 4.5. Geographic distribution of volunteers who contributed to the geo-location of buildings.

Volunteers contributed a median of 7 task replicates each, but the distribution of task
replicates was highly overdispersed, with the top 20 contributors having processed
roughly 50% of the tasks (Figure 4.6).
Figure 4.6. Distribution of numbers of tasks contributed by volunteers. The bin labeled
“100+”, contains volunteers who completed 100 or more tasks.
The data processed and the results of the crowdsourcing are available to be downloaded
from the Crowdcrafting.org website (28).
A total of 62,946 geolocations were submitted via mouse-clicks by the volunteers.
When applying the replicate-consolidation algorithm to cluster points, a total of 26,247
suspected houses were identified. Of those, 11,046 (42.1%, 95% confidence interval

109
0.4149 to 0.4268) were confirmed by being identified in all three replicates, and 3,424
of these were within the censused areas (Figure 4.1). 445 (13.0%, 95% confidence
interval 0.1189 to 0.1412) of the volunteer-provided locations within the censused areas
were “distant” from the GPS location of the nearest of the 6,543 inhabited houses
identified in the HDSS census. Table 4.1 provides these results disaggregated by focal
area. Conversely, 1,490 of the GPS locations of inhabited houses identified in the
census were “distant” from the nearest confirmed crowd-sourced location, and 279
censused houses were “distant” from the nearest crowd-sourced location on any of the
replicates (Table 4.2).
Focal Area A Focal Area B
Focal Area C
Mouse clicks (across all replicates) 6749 30235 25962
Locations identified (through clustering of mouse clicks)
2769 12780 10698
Houses (identified in all three replicates)
1143 5444 4459
Houses eligible for ground-truthing (as above, but also within a village)
576 1003 1845
Houses identified as “distant” 62 205 178
Table 4.1: Locations found on Satellite imagery
Focal Area A Focal Area B Focal Area C
Houses enrolled in the HDSS census 1,157 2,275 3,111
Houses enrolled in HDSS census which were “distant” compared to the satellite-located houses identified in all three replicates
320 670 500
Houses enrolled in HDSS census which were “distant” compared to the satellite-located locations identified in at least one replicate
122 101 56
Table 4.2: Locations found in the HDSS census
In all 85 cases where all three crowd-sourcing replicates identified a house that was
absent from the GPS database, ground-truthing indicated that the location had been
correctly excluded from census (Table 4.3). Most of these potential locations vacant or
abandoned houses (37 cases, 43.5%) or non-residential buildings such as churches and
schools (30 cases, 35.3%).

110
Classification Number of occurrences
Comments
Empty House 37 Uninhabited or abandoned house
Non-residential building
30 Schools, churches, health facilities, shops
Not eligible during census
6 Constructed or vacant during census
No building 6 Tree, anthill, open space
Other reason 4 Indistinguishable from census house
Refused consent 2 Inhabitants refused consent for
participation in the census
Table 4.3: Classification of ground-truthed locations: 85 locations were visited after
census because the satellite image-sourced locations showed a potentially missed house.
For a small number of locations, classification on the ground was not possible. None of
these locations were inhabited houses that had been missed during census when empty
houses were not taken into account in the system. This indicates that a high percentage
of the population coverage was reached using the OpenHDS system in the census round
of the HDSS.
A total of 1,490 of the locations visited during the census were found to be distant from
all houses identified by volunteers in all three replicates of a task (Table 4.2). This
number was reduced to 279 when considering all locations identified by clustering
clicks (irrespective of their presence in other replicates).
Discussion
The collection of volunteer-provided geolocations for a sizable study area required
about the same elapsed time as the ground survey. The crowd-sourcing provided a
convincing check of the coverage of the ground census, demonstrating that the HDSS
achieved a high coverage of the population of the study area.
However, as implemented, the crowd-sourcing missed many of the inhabited locations.
The cost of crowd-sourcing was negligible because the PyBossa software is a publicly
available resource.
The number of houses identified in all three replicates processed by the volunteers,
deemed “eligible for ground-truthing” in Table 1 was much lower than the houses
enrolled in the HDSS census in the same area. This was both because close-standing

111
buildings cannot always be distinguished on the satellite imagery, and because the
algorithm chosen for consolidating replicates groups nearby buildings into single
locations.
For the application described here this is of no consequence, except that it introduces an
asymmetry between the HDSS and volunteer-provided locations which makes it
difficult to compare some results in absolute numbers. For example, the 455 points
identified as distant probably represent a higher number of buildings. We think that it
would be scientifically interesting to follow up with a more detailed analysis using a
supervised learning algorithm (29,30) to explore the potential for locating houses in
some of the areas from the volunteer provided data, and then test how it works on the
other area(s).
The large number of houses enrolled in the HDSS but not identified in all three
replicates of a task was not expected and merits some discussion of possible reasons.
One factor that may explain the classification of HDSS-enrolled houses as distant is that
for a number of those databases records the reported GPS-accuracy was substantial (up
to 50m). A more detailed analysis showed that many of the HDSS houses had close-by
analogues in at least one of the task replicates. This raises a number of questions related
to the optimal way of presenting tasks to volunteers.
The first concerns the number of replicates. Is three replicates per task are sufficient, or
would a higher number of replicates provide a more solid foundation for distinguishing
reliably located buildings from spurious mouse clicks? There were 164 tasks in which
one replicate was submitted with no clicks, but more than 10 clicks in both other
replicates, suggesting that a quorum smaller than the replicate number might increase
the quality of volunteered data.
The second is related to task size. It may be useful to make the task size (i.e. the area to
be inspected as part of a task) smaller. Due to a glitch of the PyBossa software at the
time of the data collection, we lack information on how long it took a volunteer to
process each task replicate. This issue has since been fixed, and we recommend that
future applications focus on this metric for optimizing the size of the task.
Most of the volunteer work was done by a small number of individuals, whereas most
volunteers stopped contributing after a small number of tasks. It is possible that simpler
tasks (i.e. smaller area to analyze) would lead to a volunteer contributing more task

112
replicates. Further, it might be possible to identify incentives for those who only
contributed a few results to do more, rather than spending effort on recruiting more
volunteers (31).
To our knowledge this is the first time that VGI has been employed in an effort to
establish the population coverage in an HDSS, and the approach is an important
addition to the tools available to HDSS program managers, allowing them to ensure that
the entire population was covered during the census or successive rounds. The approach
is easily transferable to other areas, and could be used to estimate coverage in any
surveillance system which requires geo-locations of houses.
Beyond using the approach described here for quality control in population-based
surveillance, we see further applications in the planning of observational or intervention
field studies. Potentially, crowd-sourcing of such images could provide improved
sampling frames for household surveys, even in areas where there is no population
database. This could even be used for generating samples stratified according to other
characteristics identifiable on satellite images (e.g. vehicles, or gardens etc.). Similarly,
crowd-sourcing could be used to count or localize the numbers of such features within a
research area for comparison between different areas. All of these extra studies could be
also decided after the data collection and not predetermined a priori.
In general crowdsourcing projects have an outreach component (citizen, civic or
amateur science), and the benefit is probably more than the data because people learn
about the research (32,33).
VGI (5,34,35) and crowd sourced data (geodata) (36–39) have changed the collection
of digital spatial data. This volunteer approach is giving us a new way to improve the
data collection, and new ways of comparison.
In last 3-4 years computer image recognition has improved significantly (40), but still
this kind of technology is limited to the pharmaceutical or military industry, or in
general to research with funding behind and that needs fast response, and analysis of the
data, so in general algorithmic image analysis of such remote-sensed images is still
challenging (41–43).

113
Developing and tuning an image analysis application is technically challenging, while
crowd sourcing data is relatively straightforward and can be implemented quickly. On
the other hand, the problem of identifying houses on satellite images is recurrent and
will not go away because even existing population databases need frequent updating, so
it is probably worth investing in automating it. VGI, combined with the ground-truthing
methodology presented here, may contribute to the process of training image
recognition algorithms.
Acknowledgements
We would like to thank the fieldworkers of the Majete Malaria Project, Daniel
Lombrana Gonzalez (Scifabric.com) and François Grey for technical assistance, Tom
Smith for valuable comments on the manuscript, and the volunteers who helped us on
this study.

114
References
1. Worldpop - What is WorldPop? [Internet]. [cited 2016 Oct 17]. Available from:
http://www.worldpop.org.uk/
2. INDEPTH Resource Kit for Demographic Surveillance Systems (Beta Version 0.9)
[Internet]. [cited 2016 Feb 19]. Available from: http://www.indepth-
network.org/Resource%20Kit/INDEPTH%20DSS%20Resource%20Kit/INDEPTH
%20DSS%20Resource%20Kit.htm
3. form C prof dr ir WtC. Wageningen UR and AMC jointly initiate large-scale
malaria study in Malawi with involvement of the local population [Internet].
Wageningen UR. 2014 [cited 2016 Mar 18]. Available from:
http://www.wageningenur.nl/en/newsarticle/Wageningen-UR-and-AMC-jointly-
initiate-largescale-malaria-study-in-Malawi-with-involvement-of-the-local-
population.htm
4. Shannon HS, Hutson R, Kolbe A, Stringer B, Haines T. Choosing a survey sample
when data on the population are limited: a method using Global Positioning
Systems and aerial and satellite photographs. Emerg Themes Epidemiol. 2012 Sep
11;9:5.
5. Elwood S. Volunteered geographic information: future research directions
motivated by critical, participatory, and feminist GIS. GeoJournal. 2008 Jul
24;72(3–4):173–83.
6. Projected Population by Age and Sex for Malawi [Internet]. [cited 2016 Dec 5].
Available from:
http://www.nsomalawi.mw/index.php?option=com_content&view=article&id=135
%3Aprojected-population-by-age-and-sex-for-malawi&catid=8&Itemid=40
7. The Hunger Project in Malawi [Internet]. The Hunger Project. [cited 2016 Dec 23].
Available from: http://www.thp.org/our-work/where-we-work/africa/malawi/
8. Homan T, Pasquale A, Kiche I, Onoka K, Hiscox A, Mweresa C, et al. Innovative
tools and OpenHDS for health and demographic surveillance on Rusinga Island,
Kenya. BMC Res Notes. 2015;8:397.
9. SwissTPH/openhds: 1.5 Stable. Zenodo [Internet]. [cited 2017 Jan 23]; Available
from: https://zenodo.org/record/257461
10. Swiss TPH : OpenHDS [Internet]. [cited 2016 Mar 8]. Available from:
http://www.swisstph.ch/?id=1392
11. Anokwa Y, Hartung C, Brunette W, Borriello G, Lerer A. Open Source Data
Collection in the Developing World. Computer. 2009 Oct;42(10):97–9.
12. Android - History [Internet]. [cited 2016 Mar 18]. Available from:
https://www.android.com/history/#/jellybean
13. A. Di Pasquale, A. Kakorozya, D. Roberge, N. Maire, B. Heasly, B. MacLeod.
Swisstph/Openhds-Tablet: 1.5 Stable. 2017 [cited 2017 Feb 10]; Available from:
https://doi.org/10.5281/zenodo.258107

115
14. Hartung C, Lerer A, Anokwa Y, Tseng C, Brunette W, Borriello G. Open Data Kit:
Tools to Build Information Services for Developing Regions. In: Proceedings of the
4th ACM/IEEE International Conference on Information and Communication
Technologies and Development [Internet]. New York, NY, USA: ACM; 2010 [cited
2016 Feb 19]. p. 18:1–18:12. (ICTD ’10). Available from:
http://doi.acm.org/10.1145/2369220.2369236
15. A. Di Pasquale, D. Roberge, R. Gillen, N. Maire, B. MacLeod, J. Faulkner.
Swisstph/Openhds-Server: 1.5 Stable. 2017 [cited 2017 Feb 10]; Available from:
https://doi.org/10.5281/zenodo.257463
16. Sankoh O, Byass P. The INDEPTH Network: filling vital gaps in global
epidemiology. Int J Epidemiol. 2012 Jun 1;41(3):579–88.
17. LTD S. The ultimate crowdsourcing framework - PyBossa.com [Internet]. [cited
2016 Mar 8]. Available from: http%3A%2F%2Fpybossa.com/
18. OpenLayers 3 - Welcome [Internet]. [cited 2016 Mar 8]. Available from:
http://openlayers.org/
19. Bing Maps Geographic Coverage [Internet]. [cited 2016 Nov 29]. Available from:
https://msdn.microsoft.com/en-us/library/dd435699.aspx
20. Understanding Scale and Resolution [Internet]. [cited 2016 Nov 29]. Available
from: https://msdn.microsoft.com/en-us/library/aa940990.aspx
21. Bing Maps [Internet]. Bing Maps. [cited 2016 Nov 28]. Available from:
https://www.bing.com/maps?FORM=Z9LH3
22. Nicolas, Daniel Lombraña González. Swisstph/App-Rural-Geolocator: Mmp Stable.
2017 [cited 2017 Jan 22]; Available from: https://doi.org/10.5281/zenodo.255676
23. BossaIntro – BOINC [Internet]. [cited 2016 Mar 10]. Available from:
http://boinc.berkeley.edu/trac/wiki/BossaIntro
24. Scifabric. Science affects all of us, Science needs all of us [Internet]. Crowdcrafting.
[cited 2016 Mar 8]. Available from: http://crowdcrafting.org
25. Doan A, Ramakrishnan R, Halevy AY. Crowdsourcing systems on the World-Wide
Web. Commun ACM. 2011 Apr 1;54(4):86–96.
26. Estellés-Arolas E, González-Ladrón-de-Guevara F. Towards an integrated
crowdsourcing definition. J Inf Sci. 2012 Apr 1;38(2):189–200.
27. Finding the Convex Hull of a 2-D Dataset — SciPy Cookbook documentation
[Internet]. [cited 2017 Feb 10]. Available from: http://scipy-
cookbook.readthedocs.io/items/Finding_Convex_Hull.html
28. Scifabric, CrowdcraftingEn. Rural Geolocator [Internet]. Crowdcrafting. 2013
[cited 2016 Mar 18]. Available from:
http://crowdcrafting.org/project/RuralGeolocator/
29. LeCun Y, Bengio Y, Hinton G. Deep learning. Nature. 2015 May
28;521(7553):436–44.

116
30. Schmidhuber J. Deep learning in neural networks: An overview. Neural Netw. 2015
Jan;61:85–117.
31. Simperl E. How to Use Crowdsourcing Effectively: Guidelines and Examples. Liber
Q [Internet]. 2015 Aug 18 [cited 2016 Dec 20];25(1). Available from:
http://www.liberquarterly.eu/articles/10.18352/lq.9948/
32. Seltzer E, Mahmoudi D. Citizen Participation, Open Innovation, and
Crowdsourcing Challenges and Opportunities for Planning. J Plan Lit. 2013 Feb
1;28(1):3–18.
33. Surowiecki J. The Wisdom of Crowds. Anchor; 2005.
34. Goodchild MF. Citizens as sensors: the world of volunteered geography.
GeoJournal. 2007 Nov 20;69(4):211–21.
35. Goodchild MF. Citizens as voluntary sensors: spatial data infrastructure in the world
of Web 2.0. In [cited 2016 Mar 9]. Available from:
http://citeseerx.ist.psu.edu/viewdoc/summary?doi=10.1.1.162.2017
36. Crowdsourcing Is Radically Changing The Geodata Landscape : Case Study Of
OpenStreetMap [Internet]. www.crowdsourcing.org. [cited 2016 Mar 9]. Available
from: http://www.crowdsourcing.org/document/crowdsourcing-is-radically-
changing-the-geodata-landscape--case-study-of-openstreetmap/22864
37. Heipke C. Crowdsourcing geospatial data. ISPRS J Photogramm Remote Sens.
2010 Nov;65(6):550–7.
38. Hudson-Smith A, Batty M, Crooks A, Milton R. Mapping for the Masses Accessing
Web 2.0 Through Crowdsourcing. Soc Sci Comput Rev. 2009 Nov 1;27(4):524–38.
39. Stark, H.-J., Ramm, F. Crowdsourcing Geodata. 2008 [cited 2016 Mar 9]; Available
from: http://dx.doi.org/10.5169/seals-236520
40. Bordag S. Significant Advances in Medical Image Analysisorem. In: Tolxdorff T,
Deserno MT, Handels H, Meinzer H-P, editors. Bildverarbeitung für die Medizin
2016: Algorithmen – Systeme – Anwendungen [Internet]. Berlin, Heidelberg:
Springer Berlin Heidelberg; 2016. p. 1–1. Available from:
http://dx.doi.org/10.1007/978-3-662-49465-3_1
41. Hussain M, Chen D, Cheng A, Wei H, Stanley D. Change detection from remotely
sensed images: From pixel-based to object-based approaches. ISPRS J Photogramm
Remote Sens. 2013 Jun;80:91–106.
42. Hay SI, Snow RW, Rogers DJ. From Predicting Mosquito Habitat to Malaria
Seasons Using Remotely Sensed Data: Practice, Problems and Perspectives.
Parasitol Today. 1998 Aug 1;14(8):306–13.
43. Ward D, Phinn SR, Murray AT. Monitoring Growth in Rapidly Urbanizing Areas
Using Remotely Sensed Data. Prof Geogr. 2000 Aug 1;52(3):371–86.
117
5. Migrating an established DSS site to OpenHDS: evidence for improved quality/timeliness and cost
Aurelio Di Pasquale*1,2, D. Cobos 1,2, Derra K.3, Tinto H.3, Nicolas Maire1,2
1Department of Epidemiology and Public Health, Swiss Tropical and Public Health
Institute, Basel, Switzerland
2University of Basel, Basel, Switzerland
3 Nanoro HDSS, Clinical Research Unit of Nanoro (CRUN) - Institut de Recherche en
Sciences de la Sante (IRSS), Nanoro, Burkina Faso
Working paper

118
Introduction
Health and Demographic surveillance systems (HDSS) can provide valuable
information in geographic zones where vital registration systems are not present or not
running at an acceptable level, and play an essential role supporting health intervention
studies in such areas. Setting up and running an HDSS is operationally challenging, and
requires a reliable and efficient platform for data collection and management. The
advent of affordable information technology including hardware and software has
opened new opportunities to eliminate some of the problems posed by paper-based
HDSS which were the standard instruments for collecting data in household surveys.
Mobile technology that in the past was considered a luxury, is nowadays common
everywhere in the world including low and middle-income countries (LMIC) (1,2).
Most non-governmental organizations (NGOs) or research institutes provide their staff
with new generation mobile devices (smartphones).
Using mobile devices for data collection (EDC) brings with it some advantages. The
data is entered only once and the data clerk role is not needed anymore. Validation can
be done directly at data collection time using constraints, and enumerators can rely on
advanced features for guidance, like the conditional display of questions available with
electronic forms (“skip logic”). EDC is faster than paper data collection (PDC), partially
because of skip logic that makes it possible to avoid questions on the basis of previous
answers. The more complex and long the survey, the more time is generally saved (3).
Data can be sent in near real time to a central database for analysis and review. A
substantial part of the review protocols can be automated, where reports of data issues
can be made available to data managers and management via email or dashboards. In
addition, this allows for the near real time possibility to review and amend data
collection instruments and processes.
EDC and adoption of data management best practices using OpenHDS software (Figure
5.1) have the potential to resolve many of the major shortcomings of running a paper
data collection HDSS. Together with the possibility of cleaning data inside OpenHDS
(4–7)
this can give a huge advantage in term of promptness to fix errors and the possibility of
accruing high quality data. Integration of OpenHDS with external tools to calculate
demographic rates (e.g. INDEPTH IShare2 tool) (8,9) further expands the options
available to analysts and data managers for obtaining statistics and demographic rates
and reviewing the data from any single application.

119
This chapter reports an evaluation of the hypothesis that the system is superior to
previous approaches with regard of quality and timeliness of data and running costs of
the system.
Figure 5.1: OpenHDS System Architecture
Specifically, four of the six data quality dimensions proposed by DAMA UK (10)
(completeness, uniqueness, timeliness, consistency) were compared, as well as the costs
for setting up and running a PDC vs a paper-free data system. The PDC system was
compared with the Household Registration System 2 (HRS2)(11), which has been in
widespread use over many years in HDSSs.
Methods
The study was performed in the Nanoro HDSS site (12), situated in Central West region
of Burkina Faso (85km from Ouagadougou) and including 24 villages with 63’000
inhabitants, 11’500 households at 5’500 distinct locations (Figure 5.2). This site
migrated to the OpenHDS system from the previously used HRS2 in June 2015.
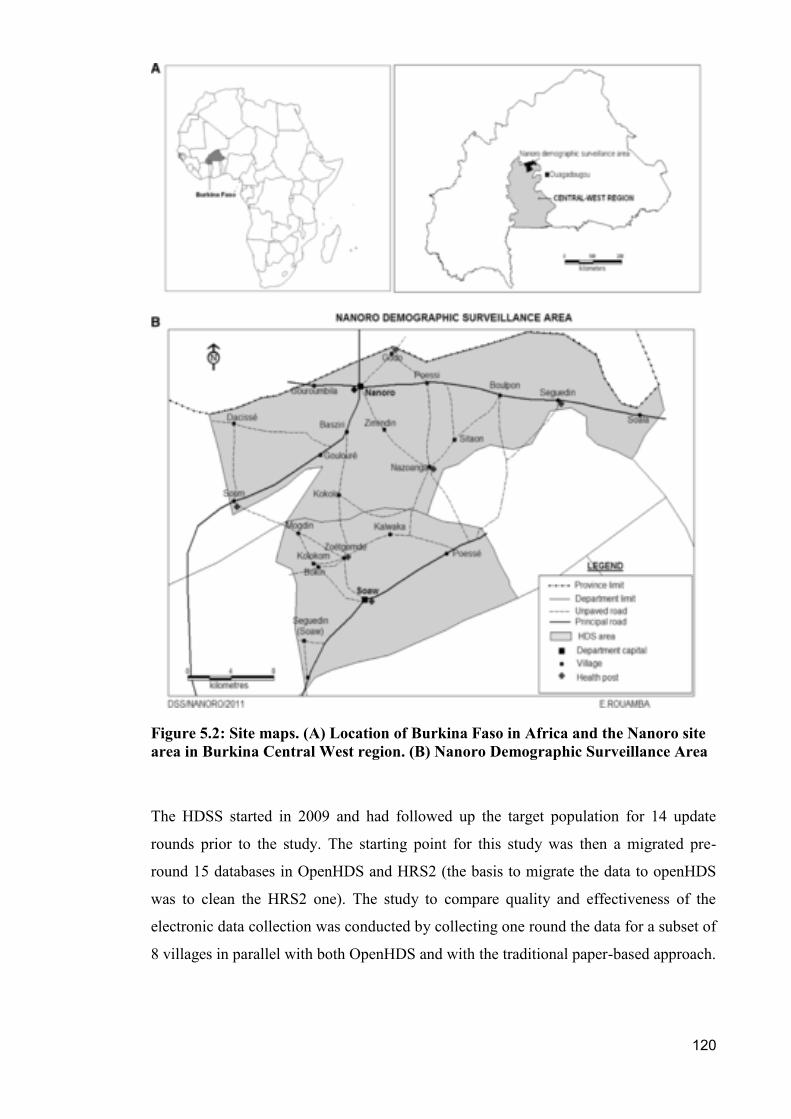
120
Figure 5.2: Site maps. (A) Location of Burkina Faso in Africa and the Nanoro site
area in Burkina Central West region. (B) Nanoro Demographic Surveillance Area
The HDSS started in 2009 and had followed up the target population for 14 update
rounds prior to the study. The starting point for this study was then a migrated pre-
round 15 databases in OpenHDS and HRS2 (the basis to migrate the data to openHDS
was to clean the HRS2 one). The study to compare quality and effectiveness of the
electronic data collection was conducted by collecting one round the data for a subset of
8 villages in parallel with both OpenHDS and with the traditional paper-based approach.

121
Data Quality
The villages were randomized to select 8 of the 24 villages as first step (all villages are
in rural areas and we hypothesized there were no relevant appreciable differences of
possible collected data between villages). During the round, fieldworkers were sent in
pairs to the same location to record the vital events with the two data collection
instruments. Fieldworkers had the same skills and had the same training on data
collection for HDSS. To avoid bias introduced by the person the two fieldworkers were
alternating during data collection to work 50% with the tablet and 50% with the paper.
The Quality measures taken into account in the study were:
-Timeliness: Distribution of time difference between visit to a household, and
availability in the central database (i.e. availability for use by and analyst or supervisor)
To evaluate this, the differences between date of the visit to the household on round 15
and the data entry of the record on the systems were compared.
-Completeness: the proportion of stored data against the potential of "100% complete":
this was challenging to assess in practice. An extra complication was due to the fact that
some Social Groups were added in the HRS2 system after the start of the data collection
(they were registered on round 14 but there was no time to enter them on both openHDS
and HRS2 system baseline for this study). The number (by type) and identity of events
collected by the two methods in the village were compared, computed by difference
between the baseline database and that obtained post-entry and cleaning of round 15.
These outcomes are presented in the form of sets, where we assume the union of HRS2-
and openHDS-collected data after removal of duplicates (see below) represents 100%
completeness.
-Uniqueness: Number of entities in real world/Number of records describing different
entities. Duplicate entities (individuals, locations, socialgroups) and events were
identified based on their attributes, to establish the number of duplicates introduced in
round 15. In case of the enrolled entities the uniqueness was based on unique associated
ID (INDEPTH standard identifiers). Events were assessed according to ID of the entity
associated, the date of the event (e.g. for Inmigration the individual ID, the location ID,
and the date of migration were checked).
-Consistency: The absence of difference, when comparing two or more representations
of the same thing against a definition: We use some of the quality metrics defined by
the iShare2 project to assess consistency. In particular, we use the iShare2 ETL (8,13)
for auditing data quality to calculate the following metrics for both databases: illegal
start events (the first event must be Enumeration, Birth or Inmigration), illegal end
122
events (the last event must be End of observation, Death or Outmigration), illegal
transitions (Figure 5.3).
The data entry for HRS2 was performed by 4 data clerks full time working on data
entry, while for openHDS we had a data manager who performed the data cleaning
when records were rejected from openHDS and reset a flag on the database for the
record to be reprocessed- This operation was less than full-time work for the data
manager but was performed on a “when needed” basis. The openHDS system sent
automated emails with records that failed the validation process and the data manager
he started the cleaning process only when he received those records.

Event Codes ENU BTH IMG EXT ENT DTH OMG OBE None
ENU
BTH
IMG
EXT
ENT
DTH
OMG
OBE
Legend: Event codes: ENU: Enumeration; BTH: Birth; IMG: Inmigration; EXT: Exit event; ENT: Entry Event; DTH: Death; OMG: Outmigration; OBE: Observation End
Legal Transition Illegal Transition Legal in case of multiple movements
Table 5.1 Table showing transition checks (source iShare2 Project)

Costing
One expectation frequently stated by site leaders is that switching to EDC leads to
substantial cost savings compared to PDC. There are some documented cases in the
literature about cost saving (14,15). Some anecdotal evidence from sites that switched
to electronic data capture indicates some of the advantages of the new system that could
lead to significant reductions in cost of the program.
“The elimination of big amounts of paper, the reduction of physical persons previously
involved in the study (data clerks), the fact that we don’t need any more archiving
physical space to keep the data collected, the cut on expenses to transport the data just
this induce to think that costs are reduced using EDC vs. PDC.” (16)
However, there is currently no solid data to substantiate the claim that an integrated data
management system like OpenHDS indeed reduces the total cost of ownership of an
HDSS data system. We investigated on how the system costs compare to a traditionally
run system by doing a detailed costing analysis, in collaboration with the Burkina
partner in Nanoro as a second issue to investigate during the visit planned on site (17) of
major cost drivers (personnel costs, cost of stationery, etc…).
The approach on data cost we chose to perform this analysis is the bottom up costing
methodology, also known as micro-costing (18,19). To conduct the micro-costing, the
inputs were precisely identified and measured the inputs required for running the HDSS,
and then converted everything into value terms to estimate the cost.
This allowed not only identification of differences in cost of the two programs (EDC-
PDC) at the aggregate level but also pointed to specific activities and resource
categories where cost savings are realized.
Once this approach was selected the next steps were to:
Identify the activities involved in running the HDSS
Identify the types of inputs such as personnel, equipment, materials and supplies needed
to undertake a specific activity
Identify the discrete unit by which each input is counted
Assign a monetary value to each input unit
Estimate the quantities of each of the units required to complete the specific activity
Multiply the unit costs by the quantities required to obtain input cost estimates
Add the input cost estimates together to get a total activity cost estimate
The cost of paper data collection was obtained by reviewing historical program data
from Nanoro HDSS site from 2014 (the year before the switch to electronic data

125
collection was implemented). The cost of establishing the openHDS system for data
collection, cost of change in policy, as well as operational costs post-implementation
were assessed from 2015 accounting records at the same site.
The costs we compared between EDC and PDC are thus financial costs that represent
current expenditures on goods and services and economic costs that define costs in
terms of the alternative uses that have been forgone by using a resource in a particular
way.
Cost classification
Costs of running a HDSS may be classified by input type (Capital or recurrent costs);
and or fixed or variable costs.
Resources that are utilized within a year and are purchased regularly should be
categorized as recurrent, while resources that last longer than a year should be
considered capital goods. Table 5.2 provides a summary of recurrent and capital costs.
Capital costs Recurrent costs Building space: fieldworker
office, data unit office,
administrative offices, IT office,
storage facilities
IT equipment (Server, Tablets,
Laptops, printers)
Vehicles: bicycles, motorcycles,
four-wheel-drive vehicles, trucks
Personnel (all types):
administrators, fieldworkers, data
management, IT staff,
geographers, demographers.
Recurrent training costs :
trainer/facilitator costs; participant
travel and per diem costs;
Building maintenance and
utilities: plumbing, roofing ,
painting, electrical repairs,
electricity, water, sewage, and
telephone
Vehicles maintenance and
operation: fuel, lubricants, spare
parts, registration and insurance
Other travel costs including staff
per diems for outreach activities
Other recurrent operating costs
Table 5.2: Classification of routine HDSS costs by input type
To calculate the value of capital goods, the replacement value or purchase price of the
good was spread over the lifetime of the item. When calculating financial costs of a
capital good, it was assumed that an equal proportion of the good was used each year
and the replacement cost of the good divided by its useful years of life.

126
If calculating economic costs, the alternative opportunities for having resources
reserved for the capital goods was evaluated. This was done by estimating the interest
income not earned during this period. Thus, to estimate the annualised economic cost of
capital items we used a discount rate of 0.05.
When resources, such as personnel and building space, were used by more than one
service, the shared costs attributable specifically to HDSS services was estimated. To
calculate the value of these resources, the proportion that is used for HDSS services was
estimated based on clearly stated assumptions. For example, in a situation where a data
unit spends a proportion of his time on HDSS data, a similar proportion of the data
manager’s salary was allocated to HDSS program costs.
Costs of HDSS were divided into start-up, HDSS management, survey management,
and service routine costs.
When a HDSS is starting or is being modified (e.g. introduction of EDC) then we talk
of start-up costs. Start-up costs relate to activities that are conducted at the beginning of
a project or program and rarely repeated such as such as planning, training of staff and
development of information and communication materials.
Planning for new programs includes meetings to develop a strategic action plan and
timelines. Training of providers on implementation of the new program includes
workshops, meetings, training publications, training related travel, including training
per-diems. The core training should be distinguished from refresher trainings which
occur annually. To estimate resource requirements for training, the program manager
should estimate the value of the resources used such as the facilitators’ fees.
The other start up activity is development of communication materials. This activity
includes the preparation activities for IEC and social mobilization such as material
development and printing of materials or production of radio/air spots. Table 5.3
presents the types of resource requirements for start-up activities by whether these are
financial or economic costs. If start-up costs are included in the costing analysis, then
they should be treated as capital costs and annualized over the expected lifetime of the
program.
Start-up activities
Financial Costs Economic Costs
Planning Rental of meeting
location
Development of meeting
materials
Rental of meeting
location
Participants’ time

127
Training Facilitators/trainers’
time
Development of training
curricula
Venue rental
Per diem and travel
expenses for facilitators
and trainees
Facilitators/trainers’
time
Training Curricula
Venue rental
Participants’ time
Per diem and travel
expenses for facilitators
and trainees
Table 5.3: Breakdown of start-up costs
HDSS management costs includes costs as planning of rounds and strategy; training of
field workers on routine data collection and protocols; production of information and
education materials; surveillance, monitoring and evaluation; and programme personnel.
There are three main survey management parts: survey implementation, data collection,
supervisors’ monitoring of data collection activities, staff undertaking data management
activities (Table 5.4).
Function Costs
Survey implementation
Planning and design
Staff time spent on survey implementation
Storage
Warehouse/server room rental
Maintenance and utilities of IT and server space
Data manager team time
Management Fieldworkers salary cost
Transportation management
Drivers salary cost
Drivers per diem
Fuel and vehicle maintenance
Table 5.4: Cost components for the Survey management
Results
The “Timeliness” validation showed (Figure 5.4) that while with the openHDS system
the data started to flow in the database the same date it was collected, that in the first 5
days 73.9% of the data collected was already available for analysis and that the system
was “ON” 23 days (there are 23 different insert dates).The maximum delay before a
record was cleaned and passed the validation in openHDS was 209 days.
Before the data was entered in the HRS2 system, after it was collected, reached the
Nanoro Data center and the data clerks were able to start the data entry the first record
had to wait 167 days, and it took 43 days and 4 people working before 76% of the data
was in the HRS2 database for analysis. The record that entered the system with most
difference between visit and date of entry had to wait 300 days.

128
A summary of the analysis is available in table 5.5.
Min. Median Mean Max.
HRS2 167 244 245.2 300
openHDS 0 25 30.01 209
Table 5.5: Summary of time difference between data entry and the original visit
date
Figure 5.3: Time difference between data collection and data entering into the
central database in the two systems (HRS2 left, openHDS right)
Time to availability of a record is on average reduced by 215 days with OpenHDS
(compared to 4 data clerks working full time for data entry). Data transfer from mobile
devices plus cleaning of inconsistencies took less days with one data manager compared
to 1 month of manual entry carried out daily by 4 data clerks, plus the data manager
time required for sorting out the inconsistencies with the paper-based system.
Fieldworkers take on average 20 minutes less for a visit than with paper forms. This
value was obtained from supervisors comparing household visits done with paper vs.
mobile device.

129
The “Completeness” analysis is rather more complex. The table 5.6 shows in the first
two columns the number of records captured in the round 15 in the two systems. The
table shows some differences between the two systems, but does not highlight
problems. The most important difference was found in the individuals table due to a bug
in the HRS2 system during the last weeks of the data entry when a trigger that was
meant to enter newborns in the individuals table after they were entered in the
pregnancy outcome table did not function. Those individuals were not entered in the
individual table.
The Social group difference has to be inferred to the short timing for starting the round
15. We learned a-posteriori that to synchronise the tablets in time, the data manager
entered socialgroups from round 14 into the openHDS system and not on HRS2 and
these were entered later on in the HRS2 system (this was easily tracked looking at the
data entry date compared with the date of recording the new socialgroup on the table
socialgroup of HRS2).
Differences in the Outmigration table were mainly evident as additional records in
openHDS, because the openHDS system automatically generates an outmigration if
there is an internal Inmigration closing the old residency and opening a new one.
In the Inmigration table some of the differences (ca. 280) result from internal migrations
that are not captured in HRS2 (e.g. people that moved away and that now after months
come back to the same house), and external Inmigrations from round 14 that were not
registered in HRS2. (This is linked to the socialgroup issue. A socialgroup was entered
in HRS2 but the migrations were not recorded).
There were very few differences in the other tables. Most of these cannot be classified
as either real missing information or errors, but rather as results of unclear field
procedures (for instance a the difference in location captured may be due to occasional
recording of empty locations depending on the fieldworker who’s collecting the data).
Missing pregnancy outcome that was recorded as inmigrations instead of pregnancy
were considered as errors in HRS2. This arose when the family migrated and after
Inmigration they had a baby (the date of birth is post migration date). This was
correctly captured in openHDS that check this kind consistency (dob < Inmigration
data).
Similarly, extra relationship records in HRS2 can be rejected by openHDS because of
date inconsistency (e.g. if a marriage is recorded in the future or before the start of the
HDSS).

130
For “Uniqueness” analysis we found the results on the last two columns in table 5.6,
that confirm that no duplications were introduced in the round from openHDS while
there were some brought into the HRS2 system.
Round 15
summary
New records
HRS2
New records
openHDS
# of duplicates
HRS2
# of duplicates
openHDS
Individual 1412 1608 0 0
Location 32 34 0 0
Visit 2257 2218 1 0
Socialgroup 161 122 0 0
Deaths 116 117 5 0
Pregnancy outcome 503 511 3 0
Inmigration 1602 2230 2 0
Outmigration 1797 1907 0 0
Relationship 60 51 0 0
Table 5.6: Round 15 Summary results of new record captured and duplications
found for HRS2 and openHDS
Demographic rates calculated through the IShare2 software (8) show lower error rate
0.55% vs. 0.75% with the OpenHDS than with HRS2 (p < .001) (Figure 5.5).

Figure 5.4: Demographic Rates comparison obtained through IShare2
Nanoro OpenHDS15
EventCode None BTH DTH ENT ENU EXT IMG OBE OBS OMG
BTH .00 .00 524.00 .00 .00 1,274.00 .00 7,607.00 2,188.00
DTH 2,841.00 .00 .00 .00 .00 .00 .00 .00 .00
ENT 523.00 .00 486.00 71.00 .00 4,777.00 .00 20,982.00 15,054.00
ENU 5.00 .00 1,830.00 .00 .00 11,192.00 .00 24,536.00 17,388.00
EXT .00 .00 .00 17,350.00 .00 .00 .00 .00 42.00
IMG 34.00 .00 1.00 .00 .00 16.00 .00 1,129.00 65.00 Invalid 1,216.00
OBE 54,196.00 4.00 .00 23.00 .00 58.00 23.00 .00 1.00 Total 219,251.00
OMG 34,520.00 .00 .00 336.00 .00 72.00 79.00 24.00 .00 Error rate 0.5546%
Nanoro HRS2 15
EventCode None BTH DTH ENT ENU EXT IMG OBE OBS OMG
BTH 2.00 .00 474.00 12.00 .00 1,216.00 .00 8,137.00 1,740.00
DTH 2,467.00 .00 .00 .00 .00 .00 .00 .00 .00
ENT 390.00 .00 387.00 136.00 .00 4,609.00 .00 25,100.00 12,140.00
ENU .00 .00 1,604.00 120.00 .00 10,834.00 .00 26,469.00 15,927.00
EXT .00 .00 .00 16,741.00 .00 .00 .00 .00 30.00
IMG .00 .00 .00 1.00 .00 2.00 .00 34.00 4.00 Invalid 1,623.00
OBE 59,867.00 2.00 .00 1.00 .00 2.00 .00 .00 2.00 Total 218,630.00
OMG 29,229.00 .00 2.00 632.00 .00 106.00 26.00 132.00 53.00 Error rate 0.7424%
Legend: Event codes:
ENU: Enumeration; BTH: Birth; IMG: Inmigration; EXT: Exit event;
ENT: Entry Event; DTH: Death; OMG: Outmigration; OBE: Observation End

Financial and Economic costs with OpenHDS are respectively 10 and 6.9% lower
(Figure 5.6).
Figure 5.5: Cost comparison details
The tabulation of total costs per input (Figure 5.6), demonstrates that the highest part of
the cost is attributable to personnel. A breakdown of the costs of the personnel (Figure
5.7) we better indicates what can be saved.
For the first year after transition from HRS2 to openHDS, the management of the HDSS
made very conservative decisions on staffing. The only personnel affected were the data
clerks (3 full time data clerks removed from the HDSS costs). There was of course
elimination of paper but the biggest impact on the cost was the 3 salaries less per year.
The results obtained on timeliness and time needed to perform a household visit show
that less time was required to visit the same number of households, and this could be
translated into fewer interviewers. The reduction of number of interviewers would
imply lower cost of “refresher trainings and meetings” and “communication” (e.g. less
sim-cards), maybe reduction of supervisors, and could also lead to a reduced need for
motorcycles with a consequent reduction of fuel, insurance and reparation expenses.
This reduction of personnel would not necessarily mean dismissing staff, since these
could be diverted to other projects and spend less time on the HDSS’s activities.
A more accurate analysis could determine the staffing needs more accurately and could
lead to a higher level of savings compared to the HRS2 system. This goes beyond the
immediate objective of this study, which was to compare the cost of the openHDS with
a paper system, taking into account the initial investment needed for the tablet devices.

Figure 5.6: Total cost per input for openHDS
InputFinancial cost in
2016 (USD)% of financial costs
Economic cost in
2016 (USD)
% of economic
costs
Start-up costs
Trainings, workshops & meetings - 0% 5,563 5%
Other start up - 0% - 0%
Total start-up costs - 0% 5,563 5%
Recurrent costs 0% 0%
Refresher trainings & meetings 298 0% 1,207 1%
Personnel 83,312 82% 83,312 71%
Communications 4,446 4% 4,446 4%
Maintenance 4,411 4% 4,411 4%
Supplies & other recurrent 9,360 9% 9,360 8%
Total recurrent costs 101,826 100% 102,735 87%
Capital costs 0% 0%
Buildings - 0% 1,185 1%
Equipment - 0% 5,746 5%
Vehicles - 0% 2,548 2%
Consultants - 0% - 0%
Total capital costs - 0% 9,479 8%
Total Annual Costs 101,826 100% 117,777 100%

Position Description
Number
of staff in
this
position
Gross
annual
salary
(USD)
% to
HDSS
Total
annual
salary for
HDSS
(USD)
1 HDSS interviewers 11 2,371 90.00% 23473.2
2 Field supervisors 7 3,754 90.00% 23651.1
3 Community outreach health workers 22 395 100.00% 8693.8
4 IT helpdesk 2 6,916 20.00% 2766.2
5 Demographer 1 10,867 80.00% 8693.8
6 Geographer 1 7,903 100.00% 7903.4
7 Drivers 7 2,569 15.00% 2697.1
8 Logistician 1 9,879 10.00% 987.9
9 Accounting 2 2,964 15.00% 889.1
10 Data Managers 2 8,891 20.00% 3556.6
11 Data Clerks 3 3,952 100.00% 11855.2
Figure 5.7: breakdown cost of the personnel involved in the HDSS
Discussion
Despite the limitations of the methodology (that includes the fact that the baseline
between hrs2 and openHDS was not exactly identical, and this did not allow matching
of some of the events in round 15 between the two systems, and that for the time saved
we only have an oral statement of the managerial staff), we found that quality and costs
improved moving from HRS2 to openHDS, but still more could be done.
In particular for cost we assessed that the most of it is attributable to personnel (Figure
5.6) and that moving from HRS2 to openHDS the saving in personnel costs was due to
the a cut on the 3 data clerks that led alone to a save of 11855.2 USD (row 11 on Figure
5.7) . Fine-tuning the system in the future could potentially reduce the number of
interviewers and possibly of field supervisors that are the highest part of the personnel
cost (row 1 and 2 of Figure 5.7). These together make up 49.5% of the total personnel
cost (47124.3 USD).
Some issues on slowing down the openHDS system were the change of data manager
during the round that led to a 2-3 months with no data manager able to deal with the
cleaning procedure of openHDS. The data transfer stalled for some time and there was a
need for a training period once the new data manager arrived, before he could start.
Many of the issues that could make the EDC system much better are linked to the
structure/organization of the HDSS itself. People still adhere to the procedures used
with PDC, and there are insufficient staff with higher skill levels, like IT technicians,
data managers with relational database knowledge and some IT technology skills.
135
Training should be provided to the people in these roles and this translates into an
increase in investments (costs) on IT helpdesk and data managers (row 4 and 10 in
Figure 5.7).
The tendency to continue to work in the same way as with the paper based system can
dramatically limit the speed of an EDC system like openHDS. New technologies need
in parallel an “update” in the working methods. In particular, the skill-sets of data
managers, familiar with manual data entry and Excel or old databases (e.g. Foxpro),
need to be upgraded to the use of new systems. A proper training should be provided to
fieldworkers, supervisors and data managers. A standard operating procedure (SOP)
that specifies all possible cases of conduct during the survey should be provided to
fieldworkers (even in electronic format in the tablet), to avoid different approaches to
collecting data depending on the mood of the fieldworker (e.g. clear instructions on
cases like empty houses, or no events in a household: should the visit form always be
filled? The coordinates recorded?).
It is conceivable that since the fieldworkers knew that the data was collected using the
two systems they would take more care than normal on filling the paper forms. But we
also know that a large proportion of errors arise on the transfer of the data from the
paper to the database due to data clerks. On the basis of this hypothesis, even though the
fieldworkers perform better during this study, the EDC proves to provide better quality
and this could certainly be better in normal conditions once the system is well
established (conservative hypothesis).
Timeliness is improved and we should benefit from the possibility of real-time access to
the data to check data quality and the work of the fieldworkers. The architecture of the
new system allows well-staffed central helpdesk to be setup. This could possibly lead to
substantial changes in the organization of data collection. In particular, adjusting the
data collection and providing feedback to field workers during data collection time
could reduce errors and reduce the load of mistakes accrued by the end of a DSS round.
We strongly suggest following up with a study on how real time feedback could
improve the data collection process. Currently HDSS data managers generally wait until
the end of a survey round before looking the data, making it impracticable to resolve
many errors arising from data that may have been collected up to 3-4 months
previously. If a fieldworker is queried on something he submitted the previous day, it is
much easier to correct errors and ensure accrual of complete data. Few hours per day on
data cleaning and feedback to fieldworkers could lead to better quality data and data
136
available on near real time, and would avoid at the end of the round the need of rushing
on data entry because a new round will start in a month or less.
A proper programmed electronic questionnaire can avoid many errors. It is possible to
use constraints, regular expressions to check specific formats (e.g. a phone number, a
national ID etc…), relevancies, calculated checks, required fields, images or audio to
help the interview, selecting IDs instead of typing (pre-populated fields, csv pre-loaded
in the device), give more choices to select instead to provide free text fields. But if the
new system is not supported in parallel by new working approaches from the HDSS
entourage, this will reduce the benefits.

137
References
1. James J, Versteeg M. Mobile phones in Africa: how much do we really know? Soc
Indic Res. 2007 Oct;84(1):117–26.
2. Hall CS, Fottrell E, Wilkinson S, Byass P. Assessing the impact of mHealth
interventions in low- and middle-income countries – what has been shown to work?
Glob Health Action [Internet]. 2014 Oct 27 [cited 2017 Nov 25];7. Available from:
https://www.ncbi.nlm.nih.gov/pmc/articles/PMC4216389/
3. Fitzgerald G, FitzGibbon M. A Comparative Analysis of Traditional and Digital
Data Collection Methods in Social Research in LDCs - Case Studies Exploring
Implications for Participation, Empowerment, and (mis)Understandings. IFAC Proc
Vol. 2014 Jan 1;47(3):11437–43.
4. Homan T, Pasquale A, Kiche I, Onoka K, Hiscox A, Mweresa C, et al. Innovative
tools and OpenHDS for health and demographic surveillance on Rusinga Island,
Kenya. BMC Res Notes. 2015;8:397.
5. SwissTPH/openhds-su2 [Internet]. GitHub. [cited 2016 Feb 22]. Available from:
https://github.com/SwissTPH/openhds-su2
6. A. Di Pasquale, D. Roberge, R. Gillen, N. Maire, B. MacLeod, J. Faulkner.
Swisstph/Openhds-Server: 1.5 Stable. 2017 [cited 2017 Feb 10]; Available from:
https://doi.org/10.5281/zenodo.257463
7. A. Di Pasquale, A. Kakorozya, D. Roberge, N. Maire, B. Heasly, B. MacLeod.
Swisstph/Openhds-Tablet: 1.5 Stable. 2017 [cited 2017 Feb 10]; Available from:
https://doi.org/10.5281/zenodo.258107
8. iSHARE2 | INDEPTH Network [Internet]. 2017 [cited 2017 Feb 13]. Available
from: http://www.indepth-network.org/projects/ishare2
9. Herbst K, Juvekar S, Bhattacharjee T, Bangha M, Patharia N, Tei T, et al. The
INDEPTH Data Repository: An International Resource for Longitudinal Population
and Health Data From Health and Demographic Surveillance Systems. J Empir Res
Hum Res Ethics. 2015 Jul 1;10(3):324–33.
10. International D. The DAMA Guide to the Data Management Body of Knowledge -
DAMA-DMBOK. USA: Technics Publications, LLC; 2009.
11. Bruce MacLeod, Ph.D. and James F. Phillips, Ph.D. User Manual for Household
Registration System - HRS2 [Internet]. 2017 [cited 2017 Feb 6]. Available from:
http://www.popcouncil.org/uploads/pdfs/usermanual.pdf
12. Derra K, Rouamba E, Kazienga A, Ouedraogo S, Tahita MC, Sorgho H, et al.
Profile: Nanoro Health and Demographic Surveillance System. Int J Epidemiol.
2012 Oct;41(5):1293–301.
13. iSHARE Repository [Internet]. 2015 [cited 2015 Jul 22]. Available from:
http://www.indepth-ishare.org/index.php/catalog/48
14. Lietz H, Lingani M, Sié A, Sauerborn R, Souares A, Tozan Y. Measuring
population health: costs of alternative survey approaches in the Nouna Health and
138
Demographic Surveillance System in rural Burkina Faso. Glob Health Action.
2015;8:28330.
15. Dalaba MA, Akweongo P, Williams J, Saronga HP, Tonchev P, Sauerborn R, et al.
Costs associated with implementation of computer-assisted clinical decision support
system for antenatal and delivery care: case study of Kassena-Nankana district of
northern Ghana. PloS One. 2014;9(9):e106416.
16. Dillon DG, Pirie F, Rice S, Pomilla C, Sandhu MS, Motala AA, et al. Open-source
electronic data capture system offered increased accuracy and cost-effectiveness
compared with paper methods in Africa. J Clin Epidemiol. 2014 Dec;67(12):1358–
63.
17. King C, Hall J, Banda M, Beard J, Bird J, Kazembe P, et al. Electronic data capture
in a rural African setting: evaluating experiences with different systems in Malawi.
Glob Health Action [Internet]. 2014 Oct 30 [cited 2016 Feb 7];7. Available from:
http://www.ncbi.nlm.nih.gov/pmc/articles/PMC4216812/
18. Drummond M. Methods for the Economic Evaluation of Health Care Programmes.
4th ed. Oxford University press; 2015.
19. Frick KD. Micro-Costing Quantity Data Collection Methods. Med Care. 2009
Jul;47(7 Suppl 1):S76–81.
139
Conclusions and recommendations: The way forward for the system

140
6. General discussion
Summary of results
The rapidity of technology changes, including new ways of capturing data in electronic
format, the decreasing costs of devices and continuous interest from many research
fields in standardising collection and analysis of data. This inevitably leads to interest
in EDC from all kind of organizations (private or public) and has made EDC the quasi-
default choice for almost all research activity(1–3). This development has been so rapid
in recent years that there have unfortunately been little time for a proper assessment of
how these new technologies bring added value to research (4,5).
It appears obvious that new technologies for electronic data collection, using central
databases on a centralized server should perform better than old paper based systems.
However, the rational for this, needs to be made explicit and proof that this is the way
forward for research fields to collect their data is needed, as is evidence that quality,
cost, and timeliness are really improved by EDC.
A technology can be considered as progress if it improves and simplifies daily work
and, when we talk of research, if it provides advantages in quality, in accessibility, or in
timeliness of the data. It should also be also sustainable, and it is important to
understand the impact on costs of using EDC compared to PDC (6).
This project looks at those questions and contributes to understanding, assessing and
evaluating how EDC performs compared to the previously- used PDC systems, focusing
attention on population-based surveillance of vital events.
The first chapter gives an historical background and the rational for the project. It
summarises the history of Demographic Surveillance Systems, the need of these and the
importance of them for health related questions, which justify the use of the HDSS
acronym (rather than simply DSS). It explains how the need for an improved way to
collect, store and analyze data led to the development of the OpenHDS system,
designed to provide a higher quality data that DSS needed as a basis for health related
projects. Starting from the first DSS that used a structured way to capture data, and
considering developments up to the latest one, this chapter looks at the technology used
and developed during the years in parallel with ICT advances. It describes a set of
conjectured data management best practices, and for each of these best practices it uses

141
a literature review to assess if there is evidence to support it, while also considering
whether OpenHDS follows these practices, giving evidence of how this can be feasible
and implemented in the field. The conclusion of this chapter explains how the
OpenHDS system, using the latest mobile technologies and following data management
best practices, manages to be a valid solution to the HDSSs shortcomings. It
demonstrates the feasibility in implementing this system both in newly created HDSS
sites and already established ones through a data migration process.
Chapter 2 and 3 look at the example of a newly established HDSS, Rusinga Island in
Western Kenya. In Rusinga the SolarMal project started in the first quarter of 2012 with
the aim of eliminating malaria from the island, by using the nationwide adopted strategy
of malaria prevention (insecticide-treated bed nets and case management) augmented
with the introduction of odour-baited traps [OBTs] for trapping malaria mosquitoes.
Real time health and demographic data of the study population of 24,000 individuals are
constantly being accumulated, and were instrumental in informing the study design and
project logistics.
This HDSS was one of the first to introduce Android tablet computers to collect data
and incorporated a near real time database with integrated quality checks. OpenHDS
was chosen as the data management platform, following guidance from the INDEPTH
Network due to its anticipated cost effectiveness and organizational efficiency.
However, this piloting of OpenHDS, raised many questions and issues that needed to be
addressed; mainly the missing tangible proof of its advantages over a paper-based
method. Some of the general key challenges of such HDSSs were addressed like the
sharing of data, the harmonization and generalizability of health data collection methods
and the logistical management.
Another issue coming out from this first pilot was still the need for an IT and database
expert to help the local data manager on the daily routine activities. There was a clear
need for a new data manager figure with more technical and relational database
expertise. After support of from a software developer in the initial phases, and the
training of the data manager to use the system, less support from the software developer
was required in the follow up rounds. Training was also needed for the fieldworkers and
so an initial effort was made in term of cost and organizational time.

142
The results from this study showed how this system performed well and that it was a
key point for the success of the Solarmal project.
The Rusinga pilot showed the feasibility of implementing this system in new
established HDSSs but did not demonstrate whether there were data quality
improvements, or indicate the relative cost of implementing such a data platform for a
HDSS.
The Majete Malaria Project in Malawi provided an opportunity to confirm the
feasibility of setting up such a system in a new setting. The MMP (Majete Malaria
Project) HDSS, in Malawi, started in 2014 to support a project with the aim of studying
the reduction of malaria using an integrated control approach by rolling out insecticide
treated nets (ITNs) and improved case management supplemented with house
improvement and larval source management. In order to support the monitoring of the
trial, an HDSS was set up in the area that surrounds the Majete Wildlife Reserve (1600
km2), and OpenHDS was chosen as a data system.
In Majete, in addition to the normal use of the system for recording vital events in the
area, we assessed how the sensory capabilities of the mobile computing devices (in
particular the in-built GPS sensor) in combination with auxiliary data source could
improve the quality of the data and of the daily routine work in the field. The
combination of the electronic data collection component OpenHDS with recent
developments in open data availability and data sciences opens various possibilities for
improving quality aspects in longitudinal population-based surveillance.
Chapter 4 reports an illustrative example that demonstrated the potential of linking
OpenHDS to other data sources to support the MMP HDSS. The complementary data
source was Volunteered Geographic Information (VGI) provided by cyber volunteers
who were recruited at negligible cost, using publicly available software (PyBossa) to
analyze satellite images. VGI and crowd sourced data (geodata) have changed the
collection of digital spatial data, and this approach with volunteers recruited over the
internet provides a new way to improve the data collection. In general crowdsourcing
projects also have an outreach component (citizen, civic or amateur science), and the
benefit is probably more than the data because people learn about the research. VGI
contrasts with the core HDSS model of survey-based data collection, and the feasibility
of combining these data sources illustrates the versatility of the OpenHDS-based
system.

143
The problem addressed by VGI was the validation of the coverage of the HDSS
population. Incomplete coverage of the population in an HDSS area can be a problem,
because HDSS systems do not contain information about their own completeness.
Remote sensed data (i.e. satellite imagery) can serve as an independent source of
information about the location of residential structures in areas under surveillance, so
we combined satellite imagery with location data routinely collected using the built-in
GPS sensors of the tablets to assess completeness of population coverage.
In last 3-4 years computer image recognition has improved significantly, but
algorithmic image analysis of remote-sensed images, and especially developing and
tuning a new image analysis application is still technically challenging. This kind of
technology is limited to the pharmaceutical or military industry, or in general to well-
funded research. Crowd sourcing data is relatively straightforward and can be
implemented quickly, and so was a logical approach to addressing this, although since
the problem of identifying houses on satellite images is recurrent and will not go away
because even existing population databases need frequent updating, so it is probably
worth investing in automating such systems. If the automated image recognition
algorithm is developed, the VGI, combined with the ground-truthing methodology
presented in Chapter 4, may contribute to the process of training it.
The approach described in Chapter 4 was to compare the crowd-sourced house position
with the maps obtained by the collection of location coordinates through the tablet in
the baseline survey conducted by the fieldworkers. We calculated distances between
houses on satellite images to the locations collected by the field teams to evaluate the
precision of the GPS coordinates collected. A subset of locations was revisited by field
supervisors to resolve discrepancies between the two data sets. We also used the map
and distances of the house to guide fieldworkers to unregistered structures that appeared
in the satellite images for checking if individuals were missed during the round.

144
The crowd-sourcing provided a convincing check of the coverage of the ground census
carried out using OpenHDS, demonstrating that the HDSS achieved a high coverage of
the population of the study area, and that the OpenHDS system had good performance
in term of data availability, and precision in population enumeration. No occupied
house was missed during the baseline. The few buildings indicated in the satellite
images by the volunteers that initially could be considered candidates for missing
house/individuals were determined to be either empty locations, non-residential
buildings (Schools, churches, health facilities, shops), non-building structures (e.g.
trees) , or houses with individuals who had refused consent to be enumerated in the
baseline survey.
The large number of houses enrolled in the HDSS but not identified was not expected
and merits some discussion of possible reasons. It appears that, as implemented, the
crowd-sourcing missed many of the inhabited locations and the number of houses
identified by the volunteers, deemed “eligible for ground-truthing” was much lower
than the houses enrolled in the HDSS census in the same area. One factor that may
explain the classification of HDSS-enrolled houses as distant is that for a number of
those databases records the reported GPS-accuracy was substantial (up to 50m). A more
detailed analysis showed that many of the HDSS houses had close-by analogues in at
least one of the task replicates. This was both because close-standing buildings could
not always be distinguished on the satellite imagery, and because the algorithm chosen
for consolidating groups nearby buildings into single locations. For the application
described here this was of no consequence, except that it introduced an asymmetry
between the HDSS and volunteer-provided locations which making it difficult to
compare some results in absolute numbers. For example, the 455 points identified as
distant probably represent a higher number of buildings. It would be scientifically
interesting to follow up with a more detailed analysis using a supervised learning
algorithm to explore the potential for locating houses in some of the areas from the
volunteer provided data, and then test how it works on the other area(s).
This also raises questions about the optimal way of presenting tasks to volunteers. The
first concerns the number of replicates needed to provide a more solid foundation for
distinguishing reliably located buildings from spurious mouse clicks. There were 164
tasks in which one replicate was submitted with no clicks, but more than 10 clicks in
both other replicates, suggesting that a quorum smaller than the replicate number might
increase the quality of volunteered data.

145
The second is related to task size. It may be useful to make the task size (i.e. the area to
be inspected as part of a task) smaller. Due to an issue with the PyBossa software at the
time of the data collection, we lack information on how long it took a volunteer to
process each task replicate. This issue has since been resolved, and we recommend that
future applications focus on this metric for optimizing the size of the task. Most of the
volunteer work was done by a small number of individuals, whereas most volunteers
stopped contributing after a small number of tasks. It is possible that simpler tasks (i.e.
smaller area to analyze) would lead to a volunteer contributing more task replicates.
Further, it might be possible to identify incentives for those who only contributed a few
results to do more, rather than spending effort on recruiting more volunteers.
To our knowledge this is the first time that VGI has been employed in an effort to
establish the population coverage in an HDSS, and the approach is an important
addition to the tools available to HDSS program managers, allowing them to ensure that
the entire population was covered during the census or successive rounds. The approach
is easily transferable to other areas, and could be used to estimate coverage in any
surveillance system which requires geo-locations of houses.
Beyond using the approach described here for quality control in population-based
surveillance, we see further applications in the planning of observational or intervention
field studies. Potentially, crowd-sourcing of such images could provide improved
sampling frames for household surveys, even in areas where there is no population
database. This could even be used for generating samples stratified according to other
characteristics identifiable on satellite images (e.g. vehicles, or gardens etc.). Similarly,
crowd-sourcing could be used to count or localize the numbers of such features within a
research area for comparison between different areas. All of these extra studies could be
also decided after the data collection and not predetermined a priori.
The final Chapter (Chapter 5) describes studies carried out in the Nanoro HDSS site
situated in Central West region of Burkina Faso (85km from Ouagadougou). This
includes: 24 villages with 63’000 inhabitants, 11’500 households at 5’500 distinct
locations. In contrast to the Kenya and the Malawi sites, this site already existed and
was migrated to the OpenHDS system from the previously used HRS2 in June 2015.
The migration of this system provided an opportunity to make a quantitative
comparison of the quality, timeliness and cost of the EDC compared with the previously
used HRS2 system. Specifically, four of the six data quality dimensions proposed by

146
DAMA UK (completeness, uniqueness, timeliness, consistency) were compared, as well
as the costs for setting up and running a PDC vs. a paper-free data system.
The baseline situation for this study was the migrated and cleaned pre-round 15
databases in OpenHDS and HRS2. For one DSS round, data were collected for a subset
of 8 villages with OpenHDS and simultaneously using the traditional paper method. The
8 study villages were selected at random from the full set of 24 (all villages are in rural
areas and we hypothesized there were no appreciable differences in data collection data
between villages).
During the round, fieldworkers were sent in pairs to the same location to record the vital
events with the two data collection instruments. Fieldworkers had same skills and had
the same training on data collection for HDSS. To avoid bias introduced by the person
the two fieldworkers were alternating during data collection to work 50% with the tablet
and 50% with the paper.
We used a bottom-up costing methodology (micro-costing) starting by identifying
precisely and measured the inputs required for running the HDSS, and then converted
everything into value terms to estimate the cost. This allowed to not only to identify
differences in cost of the two programs (EDC-PDC) at the aggregate level but also point
to specific activities and resource categories where cost savings are realized. The cost of
paper data collection was obtained by reviewing historical program data from Nanoro
HDSS site from 2014 (the year before the switch to electronic data collection was
implemented). Cost of establishing the openHDS system for data collection, cost of
change in policy, as well as operational costs post-implementation was assessed from
2015 accounting records at the same site.
This study confirmed the substantial advantages in efficiency and cost of the OpenHDS
system.
Time to availability of a record is on average reduced with OpenHDS (compared to 4
data clerks working full time for data entry). Data transfer from mobile devices plus
cleaning of inconsistencies took fewer days to one Data manager compared to 1 month
of manual entry done daily from 4 data clerks, plus the data manager time required for
sorting out the inconsistencies with the paper-based system.

147
Fieldworkers take on average 20 minutes less for a visit than with paper forms. This
value obtained from supervisors comparing household visits done with paper vs. mobile
device.
Financial and Economic costs with OpenHDS are respectively 10 and 6.9% lower.
Demographic rates calculated through the IShare2 software (http://www.indepth-
ishare.org/index.php/about) show lower error rates 0.55% vs. 0.75% with the OpenHDS
(p < .001).
The way forward for the system
The results obtained demonstrate that the paperless openHDS system has many
advantages compared with the traditional paper-based data collection methods, but at
the same time showed some limitations, mainly relating to the need for staff with higher
skill levels. These include the need for staff to fill new roles as IT technicians, data
managers with relational database know-how, together with some smearing of tech
skills. There are significant needs for training of fieldworkers to use computer tablets.
There are also new IT infrastructural needs, in terms of availability of mobile devices,
charging stations, and internet connections to configure the tablets and to send data
The potential of such a system is also reduced by the tendency of people to continue to
work in the same way to work as with the paper based system. New technologies need
in parallel an “update” in the working methods. In particular, the skill-sets of data
managers, familiar with manual data entry and Excel or old databases (e.g. Foxpro),
need to be upgraded to the use of new systems. If new technologies are not introduced
in the correct way, or if they are not used properly, instead of being useful for research,
could be even be harmful. Analogously to providing a powerful car to someone without
a driving license, provision of a powerful data system to unskilled staff can lead to
accidents. A proper training should be provided to fieldworkers, supervisors and data
managers.
Timeliness is a very important aspect for EDC and the possibility of near-real-time
access to the data should be used to check data quality and the work of the fieldworkers.
This could possibly lead to substantial changes in the organization of data collection. In
particular, adjusting the data collection and providing feedback to field workers during
data collection time could reduce errors and reduce the load of mistakes accrued by the
end of a DSS round. Currently HDSS data managers generally to wait until the end of a

148
survey round before looking the data, making it impracticable to resolve many errors
arising from data that may have been collected up to 3-4 months previously. If a
fieldworker is queried on something he submitted the previous day, it is much easier to
correct errors and ensure accrual of complete data.
A system accessible from everywhere through the network, secured with SSL and
password protected (7), would give any collaborator of the project the possibility to
access the data at any time from any location. This needs an IT skilled person to
configure the server with a public IP and setup an SSL certificate. The same person will
have also the important duty to set up a backup process that guarantees (in case of any
possible problem) the possibility of rollback to a certain configuration or a fixed date
and time.
The use of devices could allow extra security checks, which prevent illicit access in case
of a theft. It is possible to configure the system so that fieldworkers do not have access
to functionality that should not be part of their daily work. The same devices could be
also programmed to check that the fieldworker is effectively visiting households
(forcing to record GPS coordinates at time of the visit), or to take pictures of the visited
houses together with the coordinates.
A proper programmed electronic questionnaire can avoid many errors. It is possible to
use constraints, regular expressions to check specific formats (e.g. a phone number, a
national ID etc…), relevancies, calculated checks, required fields, images or audio to
help the interview, selecting IDs instead of typing (pre-populated fields, csv pre-loaded
in the device), give more choices to select instead to provide free text fields. It is
worthwhile investing time in designing and piloting questionnaires, to ensure that high
quality data are obtained, rather than starting the data collection process and trying to
fix possible errors on the go.
HDSS sites, as described in the introduction, have been originally put in place either to
overcome the CRVS deficiencies, or as a basis to conduct clinical trials (8), and their
utility for other population-based data projects came later. (E.g. district health service
delivery research, research related to epidemics). HDSSs until now in general have been
just served as a platform for epidemiological studies and health programme evaluation.
The concept of Monitoring & Evaluation (M&E) to achieve an improvement of current
data collection and management processes, other performance management and learning

149
tasks to get better future outputs, outcomes and impact is the original and actual basis
for HDSSs (9–12).
The use of EDC in HDSSs should bring a change in its purpose. The real time
possibility to monitor the system and a real access to results of a certain degree of
quality should make this system not anymore a platform with the goal of evaluation for
review, but have the potential for something more.
The future move, the way forward for this system should be Surveillance & Response
(S&R) (13,14). Surveillance as a continuous systematic collection, comparison, analysis
and interpretation of data and then provide the information to those people who need to
know in order to provide an appropriate Response, take an action to react to a problem.
This scenario could be necessary for example in a situation of near elimination of a
pathogen (15,16) or to react in case of a pandemic of an infection disease(17–19).

150
References 1. Flaxman AD, Stewart A, Joseph JC, Alam N, Alam SS, Chowdhury H, et al.
Collecting verbal autopsies: improving and streamlining data collection processes
using electronic tablets. Popul Health Metr. 2018 Feb 1;16:3.
2. King C, Hall J, Banda M, Beard J, Bird J, Kazembe P, et al. Electronic data capture
in a rural African setting: evaluating experiences with different systems in Malawi.
Glob Health Action [Internet]. 2014 Oct 30 [cited 2016 Feb 7];7. Available from:
http://www.ncbi.nlm.nih.gov/pmc/articles/PMC4216812/
3. Zhang S, Wu Q, van Velthoven MH, Chen L, Car J, Rudan I, et al. Smartphone
Versus Pen-and-Paper Data Collection of Infant Feeding Practices in Rural China. J
Med Internet Res [Internet]. 2012 Sep 18 [cited 2018 Feb 17];14(5). Available
from: https://www.ncbi.nlm.nih.gov/pmc/articles/PMC3510690/
4. Rajput ZA, Mbugua S, Amadi D, Chepnǵeno V, Saleem JJ, Anokwa Y, et al.
Evaluation of an Android-based mHealth system for population surveillance in
developing countries. J Am Med Inform Assoc. 2012 Jul 1;19(4):655–9.
5. Giduthuri JG, Maire N, Joseph S, Kudale A, Schaetti C, Sundaram N, et al.
Developing and Validating a Tablet Version of an Illness Explanatory Model
Interview for a Public Health Survey in Pune, India. PLoS ONE. 2014 Sep
18;9(9):e107374.
6. Tomlinson M, Solomon W, Singh Y, Doherty T, Chopra M, Ijumba P, et al. The use
of mobile phones as a data collection tool: A report from a household survey in
South Africa. BMC Med Inform Decis Mak. 2009 Dec 23;9:51.
7. Cobb C, Sudar S, Reiter N, Anderson R, Roesner F, Kohno T. Computer security
for data collection technologies. Dev Eng. 2018 Jan 1;3:1–11.
8. Sahoo U, Bhatt A. Electronic Data Capture (edc) – a New Mantra for Clinical
Trials. Qual Assur. 2004 Jul 1;10(3–4):117–21.
9. Emina J, Beguy D, Zulu EM, Ezeh AC, Muindi K, Elung’ata P, et al. Monitoring of
Health and Demographic Outcomes in Poor Urban Settlements: Evidence from the
Nairobi Urban Health and Demographic Surveillance System. J Urban Health. 2011
Jun 1;88(2):200–18.
10. Kouanda S, Bado A, Yaméogo M, Nitièma J, Yaméogo G, Bocoum F, et al. The
Kaya HDSS, Burkina Faso: a platform for epidemiological studies and health
programme evaluation. Int J Epidemiol. 2013 Jun 1;42(3):741–9.
11. Crampin AC, Dube A, Mboma S, Price A, Chihana M, Jahn A, et al. Profile: The
Karonga Health and Demographic Surveillance System. Int J Epidemiol. 2012 Jun
1;41(3):676–85.
12. Adazu K, Lindblade KA, Rosen DH, Odhiambo F, Ofware P, Kwach J, et al.
HEALTH AND DEMOGRAPHIC SURVEILLANCE IN RURAL WESTERN
KENYA: A PLATFORM FOR EVALUATING INTERVENTIONS TO REDUCE
MORBIDITY AND MORTALITY FROM INFECTIOUS DISEASES. Am J Trop
Med Hyg. 2005 Dec 1;73(6):1151–8.

151
13. Nsubuga P, Nwanyanwu O, Nkengasong JN, Mukanga D, Trostle M. Strengthening
public health surveillance and response using the health systems strengthening
agenda in developing countries. BMC Public Health. 2010 Dec 3;10(1):S5.
14. Ransom RL, Henao OL, Peruski L, Kigozi R, Blazes D, Bertrand W, et al. Global
Health Surveillance: Innovation and Coordination for Broad Health Impact. Online
J Public Health Inform [Internet]. 2017 May 1 [cited 2018 Feb 17];9(1). Available
from: https://www.ncbi.nlm.nih.gov/pmc/articles/PMC5462328/
15. Bergquist R, Yang G-J, Knopp S, Utzinger J, Tanner M. Surveillance and response:
Tools and approaches for the elimination stage of neglected tropical diseases. Acta
Trop. 2015 Jan 1;141:229–34.
16. Zhou X-N, Bergquist R, Tanner M. Elimination of tropical disease through
surveillance and response. Infect Dis Poverty. 2013 Jan 3;2:1.
17. André AM, Lopez A, Perkins S, Lambert S, Chace L, Noudeke N, et al. Frontline
Field Epidemiology Training Programs as a Strategy to Improve Disease
Surveillance and Response. Emerg Infect Dis. 2017 Dec;23(Suppl 1):S166–73.
18. de Oliveira WK, de França GVA, Carmo EH, Duncan BB, de Souza Kuchenbecker
R, Schmidt MI. Infection-related microcephaly after the 2015 and 2016 Zika virus
outbreaks in Brazil: a surveillance-based analysis. The Lancet. 2017 Aug
26;390(10097):861–70.
19. Juin S, Schaad N, Lafontant D, Joseph GA, Barzilay E, Boncy J, et al.
Strengthening National Disease Surveillance and Response—Haiti, 2010–2015. Am
J Trop Med Hyg. 2017 Oct 18;97(4_Suppl):12–20.

152
Curriculum vitae
First names: Aurelio Di Pasquale
Date of birth: 26.08.1973
Nationality: Italian
Civil status: Married, 1 child
Education:
September 2015 to current: Epidemiology
Department at the University of Basel
PhD candidate: Thesis: “Improving
quality, timeliness and efficacy of data
collection and management in
population-based surveillance of vital
events”
September 1993-July 1999 Università degli Studi di
Palermo
MSc Electronic Engineer in
Telecommunication
Membership of professional bodies: 2011 Member: Swiss Society of Tropical
Medicine and Parasitology (SSTMP), Member of Technical Steering Committee of ODK
(Open Data Kit: opendatakit.org)
Present position: Swiss Tropical and Public Health Institute: Software project
coordinator Scientific Computing
Years within the firm: 9 yrs
Key qualifications:
Software/Database design and development, Data Analysis

153
Specific country experience:
Country Date: from (month/year) to (month/year)
Kenya August 2011 to August 2015 (offsite and onsite)
Tanzania August 2011 to August 2015 (offsite and onsite)
Malawi October 2013 to present (offsite and onsite)
Mali May 2014 to present (offsite and onsite)
Burkina Faso June 2014 to November 2017 (offsite and onsite)
Ethiopia July 2015 to November 2016 (offsite and onsite)
Italy January 2000 to February 2009
Switzerland March 2009 to present

154
Professional experience record:
Date
from -
Date to
Location Company&
reference
person (name
& contact
details)
Position Description
August
2015 to
present
Basel,
Switzerland
Swiss Tropical
and Public
Health Institute
Dept.
Epidemiology
and Public
Health / Health
Systems
Research and
Dynamical
Modelling
Software
project
coordinator
Scientific
Computing
Technical Advisor for the INDEPTH network on HDSS systems implementation.
Software coordination and implementation of electronic data capturing systems in various projects
August
2011 to
August
2015
Basel,
Switzerland
Swiss Tropical
and Public
Health Institute
Dept.
Epidemiology
and Public
Health / Health
Systems
Research and
Dynamical
Modelling
Software
project
coordinator
Scientific
Computing
Software coordination, Solarmal Project: Solar power for malaria eradication
Health and Demographic surveillance systems (HDSS) implemented to support a malaria intervention study in Kenya, in the Rusinga Island.
IHI OpenHDS: Coordination of data migration for the HDSS data on site to the new
OpenHDS/ODK system.
Implementation of forms, pilot
of the new system.

155
Apr
2009 to
Aug
2011
Basel,
Switzerland
Swiss Tropical
and Public
Health Institute
Dept.
Epidemiology
and Public
Health / Health
Systems
Research and
Dynamical
Modelling
Technical
Project
Leader and
Senior
Software
Engineer
Project “SAPALDIA3” (Swiss study on Air Pollution and Lung Disease in adults) a cohort study in the Swiss population, which studies the effects of air pollution on the respiratory and Cardiovascular health in adults providing web interfaces to databases and software to perform statistical analysis and entry data.
Provision of web interfaces to epidemiological databases and other software held by the Department of Public Health and Epidemiology
July
2003 to
March
2009
Palermo,
Italy
Sispi S.P.A
Software
Engineer
Solutions and software development of WEB applications in a development team.
Feb
2000 to
Dec
2002
Palermo,
Italy
Nortel Networks Software
Engineer:
Client Server
Developer of a monitoring and maintenance tool of GSM/GPRS networks, Support on Server for the same tool, Manage the version coding

156
Publications:
Di Pasquale A, McCann RS, Maire N. Assessing the population coverage of a health
demographic surveillance system using satellite imagery and crowd-sourcing. PLoS
One. 2017;12(8):e0183661. DOI: 10.1371/journal.pone.0183661
McCann RS, Van den Berg H, Diggle PJ, Van Vugt M, Terlouw DJ, Phiri KS, Di
Pasquale A, Maire N, Gowelo S, Mburu MM, Kabaghe AN, Mzilahowa T, Chipeta MG,
Takken W. Assessment of the effect of larval source management and house
improvement on malaria transmission when added to standard malaria control
strategies in southern Malawi: study protocol for a cluster-randomised controlled trial.
BMC Infect Dis. 2017;17:639. DOI: 10.1186/s12879-017-2749-2
Hiscox A, Homan T, Mweresa CK, Maire N, Di Pasquale A, Masiga D, Oria PA, Alaii J,
Leeuwis C, Mukabana WR, Takken W, Smith TA. Mass mosquito trapping for malaria
control in western Kenya: study protocol for a stepped wedge cluster-randomised trial.
Trials. 2016;17:356. DOI: 10.1186/s13063-016-1469-z
Homan T, di Pasquale A, Onoka K, Kiche I, Hiscox A, Mweresa C, Mukabana WR,
Masiga D, Takken W, Maire N. Profile: the rusinga health and demographic
surveillance system, western Kenya. Int J Epidemiol. 2016;45(3):718-727. DOI:
10.1093/ije/dyw072
Homan T, Hiscox A, Mweresa CK, Masiga D, Mukabana WR, Oria P, Maire N, Di
Pasquale A, Silkey M, Alaii J, Bousema T, Leeuwis C, Smith TA, Takken W. The effect
of mass mosquito trapping on malaria transmission and disease burden (SolarMal): a
stepped-wedge cluster-randomised trial. Lancet. 2016;388(10050):1193-1201. DOI:
10.1016/S0140-6736(16)30445-7
Homan T, Maire N, Hiscox A, Di Pasquale A, Kiche I, Onoka K, Mweresa C, Mukabana
WR, Ross A, Smith TA, Takken W. Spatially variable risk factors for malaria in a
geographically heterogeneous landscape, western Kenya: an explorative study. Malar
J. 2016;15:1. DOI: 10.1186/s12936-015-1044-1
Homan T, Di Pasquale A, Kiche I, Onoka K, Hiscox A, Mweresa C, Mukabana WR,
Takken W, Maire N. Innovative tools and OpenHDS for health and demographic
surveillance on Rusinga Island, Kenya. BMC Res Notes. 2015;8:397. DOI:
10.1186/s13104-015-1373-8
Maire N, Di Pasquale A, McCann RS. Crowd-crafted geolocations for quality assurance
in health and demographic surveillance systems (HDSS). Trop Med Int Health,
2015;20(Suppl. 1):227. Abstracts of the 9th European Congress on Tropical Medicine
and International Health, 6-10 September 2015, Basel, Switzerland
Crowell V, Briët OJ, Hardy D, Chitnis N, Maire N, Di Pasquale A, Smith TA. Modelling
the cost-effectiveness of mass screening and treatment for reducing Plasmodium
falciparum malaria burden. Malar J. 2013;12:4. DOI: 10.1186/1475-2875-12-4

157
Maire N, Tarantino M, Di Pasquale A, Penny M, Smith TA. Cost-effectiveness of a
malaria control programs in sub-Saharan Africa: analysis of uncertainties using a
stochastic individual-based simulation model. Malar J, 2012;11(Suppl. 1):S45-S46
Di Pasquale A, Chitnis N, Hardy D, Smith T, Maire N. Modeling the effects of ITNS and
IRS in reducing malaria transmission and disease. Trop Med Int Health,
2011;16(Suppl. 1):106-107
Hürlimann E, Schur N, Boutsika K, Stensgaard AS, Laserna de Himpsl M, Ziegelbauer
K, Laizer N, Camenzind L, Di Pasquale A, Ekpo UF, Simoonga C, Mushinge G,
Saarnak CF, Utzinger J, Kristensen TK, Vounatsou P. Toward an open-access global
database for mapping, control, and surveillance of neglected tropical diseases. PLoS
Negl Trop Dis. 2011;5(12):e1404. DOI: 10.1371/journal.pntd.0001404