improving quality of spending in indonesia 2017 budget … pendidikan... · spending on secondary...
TRANSCRIPT

IMPROVING QUALITY OF SPENDING IN INDONESIA2017 BUDGET AND BEYOND
PER Update Phase IIEducation sector spending
Reduced version

Outline
SUMMARY OF KEY ISSUES AND RECOMMENDATIONS
ANALYSIS
1. Allocation of education expenditure
a.Overall budget allocation of education expenditure
b. Intra-sector allocation: central government education spending
2. Key education sector programs:
a.Teacher management and certification
b.BOS – Bantuan Operasional Sekolah (School operational assistance)
c. PIP – Program Indonesia Pintar (Indonesia Smart Program)
3. Service delivery at the facility level
a.Aligning allocation with needs performance in education sector

The 2002 Constitutional amendment mandated a total (central + sub-national spending) budget allocation of at least 20% to education effective since 2009. Two-thirds of education spending is managed by sub-national governments (province + districts). National education expenditure increased nearly eleven-fold in nominal terms and quadrupled in real terms over 2001-2016.
Education spending has increased dramatically and is dominated
by subnational spending ….
Source: World Bank COFIS database using MoF data Notes: Sub-national government education spending data is only available until 2016. Total government national spending comprises: 1) CG spending, including subsidies and interest payments, but excluding transfers; 2) Provincial spending; and 3) District level spending. Total education spending comprises of CG education sector/function spending, excluding transfers, Province education sector/function spending and District education sector/function spending.
National education expenditure by level of governments, 2001-2017(LHS: IDR trillion; RHS: % GDP and total spending)
2,2 2,4 2,8 2,5 2,5 2,7 3,0 2,7 3,2 3,1 3,3 3,3 3,3 3,3 3,4 3,3
11,3
14,215,1
13,7 14,0 14,315,6
13,6
18,9 19,4 18,9 19,318,5 18,5
19,319,6
0
5
10
15
20
0
50
100
150
200
250
300
350
400
450
500
2001 2002 2003 2004 2005 2006 2007 2008 2009 2010 2011 2012 2013 2014 2015 2016 2017
Central, LHS Districts, LHSProvinces, LHS Total education spending (2010=100), LHSTotal education spending as % GDP, RHS Total education spending as % national spending, RHS

Outline
SUMMARY OF KEY ISSUES AND RECOMMENDATIONS
ANALYSIS
1. Allocation of education expenditure
a.Overall budget allocation of education expenditure
b. Intra-sector allocation: central government education spending
2. Key education sector programs:
a.Teacher management and certification
b.BOS – Bantuan Operasional Sekolah (School operational assistance)
c. PIP – Program Indonesia Pintar (Indonesia Smart Program)
3. Service delivery at the facility level
a.Aligning allocation with needs performance in education sector

CG spending on education is dominated by three line ministries (~90%): MoEC, MoRA, and MoRTHE
Note:• MoRA: Ministry of Religious Affairs; MoEC: Ministry of Education & Culture; MoRTHE: Ministry of Research, Technology, and Higher Education• These charts only cover budget of Education Function (Function 10)• Some spending of DG Higher Education was still in MoEC in 2015 & 2016 (around IDR 8 trillion, each year)• 2011-2016 are realization, 2017 is budget data
Trend of CG education expenditure by line ministries, 2011-17(Bar – nominal IDR trillion; Line – real IDR trillion)
Composition of CG education expenditure by line ministries(% expenditure, average 2015-17)
• CG Education spending increased sharply in 2015:o An introduction of PIP (Indonesia Smart Card-scholarship for the poor) (IDR 5 trillion) and expanding BOS
beneficiaries at the secondary level (IDR 2 trillion)
• … but it declined in 2016 due to re-allocation of BOS spending (for secondary schools) from MoEC expenditure to transfers to SNGs and across the board budget cuts.
MoRA, 33,6
MoEC; 32,1
MoRTHE; 25,5
Other line ministries,
8,8
28 31 36 40 45 45 50
6168
7277 56
3940
31
3739
86
76
1112
14
0
20
40
60
80
100
120
140
160
2011 2012 2013 2014 2015 2016 2017
MoRA MoEC
MoRTHE Other line ministries
Total (real 2010 = 100)

Early childhood development (ECD) spending remains negligible; central spending on secondary and tertiary education has been gradually increasing since 2013
• Since the launch of 12-Year Compulsory Education (Pendidikan Menengah Universal, PMU) program in 2013, spending for secondary education has been gradually increasing.
• In 2016, allocation of BOS for secondary education was reallocated from CG spending to transfers to SNGs. Taking into account for BOS in 2016 and 2017, spending/budget allocation senior secondary reaching IDR 22.2 T and IDR 22.5 T
• ECD spending is a negligible share of central government spending, despite being a key objective of the Government.
Note: • These charts only cover Education Function spending under MoEC, MoRA, and MoRTHE• Sub-function 2, formerly known as “Basic Education” is later classified as "Basic & Secondary Education". It is taken into account and data are readjusted accordingly as much as possible, but Basic Education in
the above chart may still be overestimated• Other includes: in-service education, facilitation services to education, education R&D, youth & sport founding, and cultural development (Sub-function 5, 7, 9-11, and 90)• Budget for madrasah (Islamic schools) is allocated in Sub-function 2 (“Basic & Secondary Education”); while budget for pesantren (Islamic boarding schools) is allocated in Sub-function 8 (“Religious Education”)
Composition of 3 main ministries’ spending by level of education
(% spending, average 2015-2017)
Composition of 3 main ministries’ spending by level of education(IDR trillion, 2011-2017)
20 28 27 27 30 2635
99 14 16 19
109
3135
36 3742
4043
3
3 3 3
4
4
10
3
32 2
2
1
2
23
2126
31
35
38
30
0
20
40
60
80
100
120
140
2011 2012 2013 2014 2015 2016 2017
ECD Basic Education
Secondary Education Tertiary Education
Religious Education Non-formal & Informal Education
Other Total (real 2010 = 100)
ECD; 0,4
Basic Education;
23,7
Secondary Education;
10,0
Tertiary Education;
33,0
Religious Education; 4,5
Non-formal & Informal
Education; 1,3
Other; 27,2

The majority of MoEC budget goes to basic education; Budget allocation for vocational remains low at 9% of total MoEC budget
• Within basic and secondary education, basic education receives the largest budget allocation (56%) and is almost twice larger than secondary
• Vocational education receives only 16% of total basic and secondary education program, or 9% of total MoEC budget
Basic education,
56%Regular
secondary, 13%
Vocational,16%
Special education,
4%
All level education,
11%
Total secondary 29%
0,2
0,4
1,1
1,9
1,9
1,9
10,0
22,5
0 10 20 30
Monitoring & accountability…
Language & literature development
R&D
ECD & community-based education
Support to management & other…
Culture preservation
Teachers & education staffs
Basic & secondary education
MoEC budget by programs(IDR trillion, 2017)
Composition of basic & secondary education program(% budget, 2017)

Despite the fact that basic education has been decentralized, MoEC still spends a significant amount on this function
• Following the creation of MoRTHE in 2015, MoEC is responsible for ECD, basic & secondary education; while MoRTHE is only accountable for tertiary education
• 41% of MoEC’s spending on basic education goes to PIP (IDR 6.6 T)• The remaining of PIP budget (IDR 2.2 T) is allocated in secondary education
Spending across ministries and levels of education (by sub-function) (IDR trillion, 2017)
Note:• Sub-function 2, formerly known as “Basic Education” was reclassified as "Basic and Secondary Education". Data have been adjusted accordingly as much as possible to split Basic
Education and Secondary Education, but Basic Education in the above chart may still be overestimated. • In the case of MoRA, budget for ECD was classified in Sub-function 2 (Basic and Secondary Education), data have been adjusted to split ECD from Sub-function 2 where possible.
Budget for madrasah (Islamic day schools) is classified in Sub-function 2 (“Basic & Secondary Education”); while budget for pesantren (Islamic boarding schools) is classified in Sub-function 8 (“Religious Education”)
• Other includes: in-service education, facilitation services to education, education R&D, youth & sport founding, and cultural development (Sub-function 5, 7, 9-11, and 90).
15,4
1,7
0,1
6,5
16,0
0,2
14,4
9,7
4,7
2,7
18,6
0,4
38,7
0 5 10 15 20 25 30 35 40 45
Other
Non-formal & Informal Education
Religious Education
Tertiary education
Secondary Education
Basic Education
ECED
MoRTHE
MoRA
MoEC

MoEC’s large transfers to SNGs for school construction, rehabilitation and equipment potentially overlap with SNG responsibilities; MoEC spends the most on travel
• 66% of MOEC’s material spending transferred to SNGs (spent by CG Office or Kantor Pusat) where it is allocated to: classrooms rehabilitation/school renovation (IDR 3.6 trillion), construction of new schools and classrooms, (IDR 1.1 trillion), and school equipment (IDR 1.9 trillion) – this potentially overlaps with SNG responsibilities (DAK Education)*
• While “Material transferred to SNGs” by MoRA’s and MoRTHE is relatively low, despite the fact that these ministries are fully centralized without provinces and districts to share their responsibilities.
• Official travel spending by MoEC is nearly 3 time the spending by MoRA and MoRTHE, both in nominal terms and as a share of ministry’s spending
• This also reflects travel spending for teachers undertaking training
Material spending (52) across ministries(IDR trillion, 2017)
10,0
3,8
0,7
1,1
0,3
1,1
0 2 4 6 8 10 12
Material transferred to SNGs (526)
BLU (525)
Travel (524)
Maintenance (523)
Services (522)
Goods (521)
MoRTHE MoRA MoEC
*) Note: Prior to 2016, material transferred to SNGs was classified as social aid (57) spending, also spent by CG Office
Share of travel (524) spending as % of ministry's
spending, 2017
MoRTHE 3.1%
MoRA 3.6%
MoEC 9.6%

Professional allowance for teachers/lectures accounts for the largest personnel spending
• Professional allowance for teachers and lecturers (PNS & non-PNS) accounts for 51% of personnel spending (or equivalent to IDR 27.1 trillion).
• In addition, professional allowance for PNS teachers under MoEC, which is allocated as transfers to regions, stands at IDR 55.6 trillion in 2017.
0 2 4 6 8 10 12 14
Other
Special allowance/Bureaucracy Reform (512411)
Meal allowance (511129)
Allowance for Non-PNS teachers/lecturers (511521)
TPG Lecturers (511153)
TPG PNS teachers (511152)
TPG Non-PNS teachers (511152)
Basic salary (511111)
MoRTHE MoRA MoEC
Personnel spending (51) across ministries(IDR trillion, 2017)
Note:• TPG (Tunjangan Profesi Guru) = Professional Allowance. PNS = civil servant• TPG for PNS teachers under MoEC is allocated as transfers to regions, hence not seen in the chart above• In MoRA, IDR 4.4 tln (77%) of allowance for non-PNS teachers (budget account number: 511521) goes to professional allowance
IDR 27.1 Tor 51%

Outline
SUMMARY OF KEY ISSUES AND RECOMMENDATIONS
ANALYSIS
1. Allocation of education expenditure
a.Overall budget allocation of education expenditure
b. Intra-sector allocation: central government education spending
2. Key education sector programs:
a.Teacher management and certification
b.BOS – Bantuan Operasional Sekolah (School operational assistance)
c. PIP – Program Indonesia Pintar (Indonesia Smart Program)
3. Service delivery at the facility level
a.Aligning allocation with needs performance in education sector
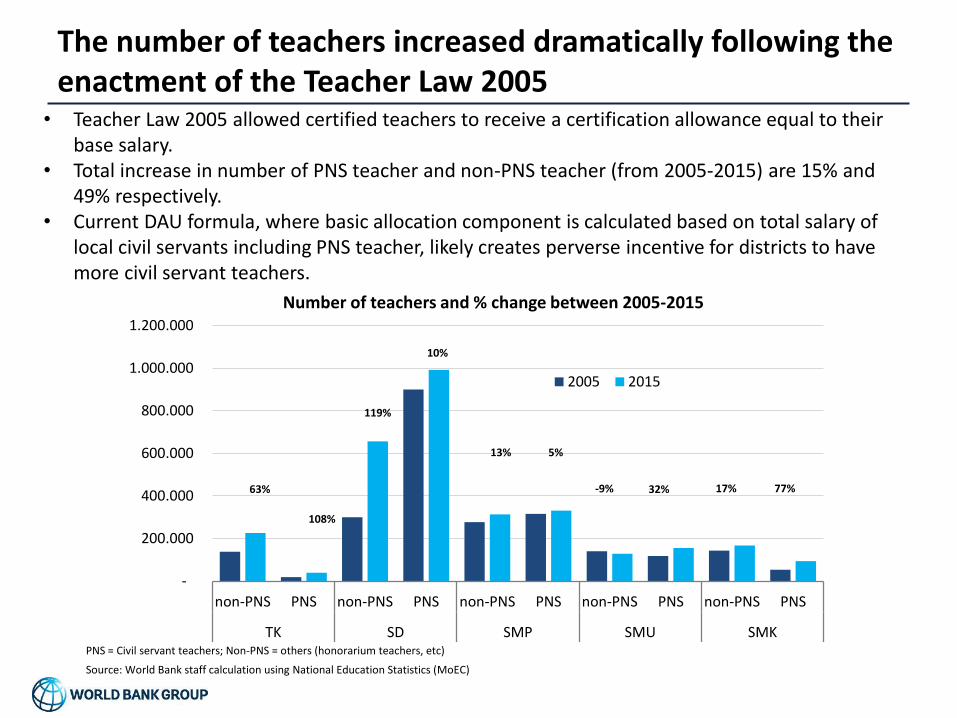
The number of teachers increased dramatically following the enactment of the Teacher Law 2005
-
200.000
400.000
600.000
800.000
1.000.000
1.200.000
non-PNS PNS non-PNS PNS non-PNS PNS non-PNS PNS non-PNS PNS
TK SD SMP SMU SMK
2005 2015
63%
108%
119%
10%
13% 5%
-9% 32% 17% 77%
Number of teachers and % change between 2005-2015
Source: World Bank staff calculation using National Education Statistics (MoEC)
PNS = Civil servant teachers; Non-PNS = others (honorarium teachers, etc)
• Teacher Law 2005 allowed certified teachers to receive a certification allowance equal to their base salary.
• Total increase in number of PNS teacher and non-PNS teacher (from 2005-2015) are 15% and 49% respectively.
• Current DAU formula, where basic allocation component is calculated based on total salary of local civil servants including PNS teacher, likely creates perverse incentive for districts to have more civil servant teachers.

The certification program increased sharply and absorbed a significant portion of education spending
• Spending on teacher professional allowance increased nearly 5x in real terms between 2010-2016 • The proportion of teacher salaries and allowances increased to more than 60% of total CG education
spending in 2017 from above 50% in 2009.
Share of CG Education Spending, including SNG transfers, by major programs
Source: 2009 numbers are based on Education PER (World Bank, 2012), 2017 numbers are from Presidential Regulation No. 97/2016 regarding the Education budget details for 2017.
Spending on teacher professional allowance
-
10
20
30
40
50
60
70
80
2010 2011 2012 2013 2014 2015 2016 2017
Nominal Prices (IDR Trillion) 2010 Prices (IDR Trillion)
Source: Education Budget 2009-2016 (MoF) and Annex XX Perpres APBN 2017Note: This figure only represents professional allowance (TPG) for PNS teachers under MoEC (spending trough transfer).
0%
20%
40%
60%
80%
100%
2009 2017
Other programs and unspecified expenditures
University
BOS
Teacher certification and proffesional allowance (CG spending)
Teacher certification and proffesional allowance (through transfer)
Teacher certification and professional allowance (Total)
Teacher and staff salaries
Conflicting regulations makes teacher management and distribution more difficult (1/2)
The central government has issued multiple regulations regarding teachermanagement and distribution. Some regulations are conflicting and create gaps inteacher distribution.
1. The central government issued moratorium on teacher hiring (since 2010/2011)
Moratorium policy has caused shortage of teacher in some schools. The shortage is also due to teacher attrition (retired/quit).
Districts’ response: Hired contract teacher to fulfill teacher needs
2. Ministry of Home Affairs (MoHA) issued a circular letter restricting contract teacher hiring (2013)
=> Schools’ response: Hired contract teacher using BOS funds to fill the gaps
=> Selection criteria used to hire teachers varies among schools, most of the honorarium is below the minimum wage and the teachers are hired with temporary basis. This has caused teacher can teach with lower qualification (and salary) than what is required.
Source: Effective Teacher Deployment study, World Bank, forthcoming

Conflicting regulations makes teacher management and distribution more difficult (2/2)
3. The central government issued regulation on teacher certification requirements
Regulation for teacher certification allowance: 24 teaching hours/week, teaching in a class with a minimum of 20 students
- District’s response: 30% of sampled districts manage the teacher GTT
(temporary teachers) distribution and appoint the GTTs needed using APBD
through Local BOS. The other districts support schools in teacher exchange
by issuing the required approvals.
- Schools’ response: Initiating teacher exchange between schools to overcome
the oversupply of teachers for particular subjects.
4. The central government issued regulation on the new curriculum (2013)
Reduced teaching hours for particular subjects (English, Mathematics, Physics, Chemistry, Natural Science) and deletion of ICT subject matter caused by curriculum changes (from KTSP to K-13). This implies the teachers for above subjects lack of teaching hours and are not able to meet the regulation to get certification allowance (point. 3 above).
Source: Effective Teacher Deployment study, World Bank, forthcoming

Outline
SUMMARY OF KEY ISSUES AND RECOMMENDATIONS
ANALYSIS
1. Allocation of education expenditure
a.Overall budget allocation of education expenditure
b. Intra-sector allocation: central government education spending
2. Key education sector programs:
a.Teacher management and certification
b.BOS – Bantuan Operasional Sekolah (School operational assistance)
c. PIP – Program Indonesia Pintar (Indonesia Smart Program)
3. Service delivery at the facility level
a.Aligning allocation with needs performance in education sector

BOS spending increased by eight times in nominal terms and nearly quadrupled in real terms in the past decade
Source: BOS portal, MoEC
• In 2017 budget allocation for BOS is IDR 45 trillion or 11% of total education budget.• BOS aims to raise education outcomes through four main channels (based on
Permendikbud No 8 Tahun 2017):1. Direct support for school operating costs2. Financial assistance for children from poor households3. Improving enrollment rate and reducing drop-out rates4. Improving the quality of learning at schools
0
10
20
30
40
50
2005 2006 2007 2008 2009 2010 2012 2013 2014 2015 2016
IDR
tri
llio
nBOS expenditures
Nominal Real (2010 prices)

BOS over spending on honorarium; while allocation for teacher
professional development and support for poor students is negligible
BOS expenditures by component, 2015
Source: BOS portal, MoEC
Library5%
New student enroment activities
2%
Learning and extracurricular
activities15%
Tests and exams12%
Goods16%
Services4%
School maintenance
10%
Teacher and staff honorarium
17%
Teacher professional
development5%
Poor students2%
BOS management
4%Computers
3%Others
5%
• BOS under MoEC schools (80% of
total schools) is largely used for
teacher & staff honorarium, goods,
learning and extracurricular activities.
• On average, BOS spending on
honorarium accounts for 17% of total
- exceeding the maximum threshold
of 15% set by the Minister regulation
(Permendikbud 8/2017)
• BOS expenditures data from schools
under MoRA is lacking to allow
similar analysis.
• BOS minimum allocation is also
provided for private schools with
minimum 3 years operational license
and requirement to release tuition
fees for all students. Private schools
charging high tuition fees are not
eligible for BOS.

The current BOS allocation formula does not accommodate equity
and performance; a few SNGs have addressed this issue
• BOS formula is currently based on number of students enrolled. Regardless of school performance, the bigger schools get the higher allocation.
• The formula does not consider geographical factors such as urban/rural location, remoteness, etc.
• Lack of BOS monitoring impedes transparency and accountability in the use of funds.
• In 2015, DKI province introduced new local BOS (BOP/Bantuan OperasionalPendidikan) formula based on performance and equity.
Allocation Objective Formula
Basic Ensure schools meet their operational needs and minimum service standards.
Per-student allocation
Equity Address the higher operational costs in remote areas.
Additional 20% for schools in remoteareas (e.g. Kep. Seribu)
Performance Provide incentives for higher performing schools and encourage schools to perform better.
Additional 20% for 25% top schools) based on UN score (average and change from previous year).
• Supporting system – electronic-based school plan (e-RKAS) has also been implemented in DKI Jakarta to ensure transparency and accountability in BOS utilization.

Outline
SUMMARY OF KEY ISSUES AND RECOMMENDATIONS
ANALYSIS
1. Allocation of education expenditure
a.Overall budget allocation of education expenditure
b. Intra-sector allocation: central government education spending
2. Key education sector programs:
a.Teacher management and certification
b.BOS – Bantuan Operasional Sekolah (School operational assistance)
c. PIP – Program Indonesia Pintar (Indonesia Smart Program)
3. Service delivery at the facility level
a.Aligning allocation with needs performance in education sector

In 2016, only 54% of schools achieved the five selected criteria:1.Maximum student per learning group is 32
(primary) and 36 (junior secondary).2.All headmasters are certified and hold at least
D4/S1 degree.3.Primary: One teacher for every 32 students and
at least six teachers in each school (four teacher in some special regions).
4.Primary: Minimum of two teachers with D4/S1 education qualification and two certified teachers.
5.Junior Secondary: Minimum of 70% of the teachers should have D4/S1 education qualification and half of them are certified.
Source: World Bank calculations using district education spending data from SIKD/Sisteminformasi Keuangan Daerah & MSS achievements from Dapodik 2015. Note: Data only available for SD, SMP, and its equivalent under MoEC.
.4.5
.6.7
.8
% o
f schools
achie
vin
g 5
MS
S c
rite
ria,
2016
0 5000 10000 15000 20000Education Spending per capita, 2014
However, district education spending is weakly
correlated with MSS achievements
MSS achievement and district education spending
Kab. Sampang and Kab. Lamongan (in East Java) achieved about the same level of results (e.g., 50% of schools achieved 3of the criteria above) despite a huge difference in education spending (IDR 4.7 vs. IDR 9.4 mil/student/yr, respectively).

Primary level (by districts) Junior secondary level (by district)
Senior secondary level (by province)• DAK fisik aims to address infrastructure issues in
education sector at district level (e.g. damaged schools/classrooms, other school facilities).
• DAK budget allocation 2017 is somewhat correlated with district needs for classroom renovation, especially for senior secondary level (indicator used: # damaged classrooms).
• More detailed data on school’s facilities is needed to draw more precise analysis.
DAK for education (DAK fisik) is somewhat correlated with local governments’ needs (school classroom condition)
0
10000
20000
30000
DA
K F
isik
Pendid
ikan,
SM
P,
mill
ion I
DR
, 2017
0 500 1000 1500 2000Total damaged classroooms, SMP, 2016
Sumatera Java
Bali & Nusa Tenggara Kalimantan
Sulawesi Maluku & Papua
Fitted values
0
5000
10000
15000
20000
25000
DA
K F
isik
Pendid
ikan,
SD
, m
illio
n I
DR
, 2017
0 500 1000 1500 2000 2500Total damaged classroooms, SD, 2016
Sumatera Java
Bali & Nusa Tenggara Kalimantan
Sulawesi Maluku & Papua
Fitted values
0
20000
40000
60000
80000100000
DA
K F
isik
Pendid
ikan,
SM
A,
mill
ion I
DR
, 2017
0 500 1000 1500Total damaged classroooms, SMA, 2016
Sumatera Java
Bali & Nusa Tenggara Kalimantan
Sulawesi Maluku & Papua
Fitted values

Key findings and recommendations (1/7)
Key Findings Key Recommendations
Overarching issue: data availability
Insufficient data to allow more
comprehensive analysis and
inform decision making.
• MoF to produce an annual “State of Indonesia’s Education System” Report on
education spending and sectoral performance, broken down by district. The report
should include:
• Data on spending by each local government against the education function,
disaggregated by a) level of education (ECED, primary, junior secondary,
senior secondary and other) and b) Economic classification/type of spending
including: 1) salary and wages, 2) goods and services, 3) capital, and 4)
subsidies
• Spending by MoRA and MoEC, disaggregted by district
• Sectoral performance data (for example, from the Education Achievement
Index) disaggregated by district
1a. Overall allocation and adequacy of spending
Total education spending
increased significantly following
20% rule reaching 3.3% GDP
(2017) and is dominated by
subnational spending
• Overall public spending at 3.3 percent of GDP or near 20% of central government
spending (including transfers to SNG) is relatively adequate considering other
competing priorities and efficiency issues of current spending

Key findings and recommendations (2/7)
Key Findings Key Recommendations
1b. Intra-sectoral allocation of central government education spending
Insufficient spending on Early
Childhood Education (ECE),
where the returns to investment
are the highest
MoEC to increase budget for Early Childhood Education and Development (ECED) by:
• increasing the coverage and unit cost of BOP (School Operational Assistance Grants to
ECED) based on Dapodik data
• linking the use of BOP to meeting National ECED standards
Strengthen support to deliver quality ECE:
• At national level: (i) issue Minimum Service Standards as a basis for districts to allocate and
manage resources; (ii) build district capacity to manage services based on ECED MSS
standards
• At district level: (i) Establish ECED units in Dinas and provide funding for staffing support; (ii)
build capacity of supervisors (Penilik PAUD) to conduct quality assurance visits to ECE
centers; (iii) support the provision of incentives and training for community teachers.
Leverage Dana Desa as an alternative funding source: include ECED in annual Dana Desa
prioritization regulation (Ministerial regulation No. 22/2016 as an amendment by No. 4/2017) to
support village planning to identify early childhood centers as priority programs for investment of
Dana Desa
Allocation for vocational remains
relatively low (9 percent of total
MoEC)
MoEC to increase its budget allocation to vocational education
A part of MoEC’s material
spending (“Material transferred to
SNG”), ~ IDR 6.6 T, potentially
overlaps with SNG
responsibilities funded by DAK
MoEC to re-allocate “Material transferred to SNG” (budget account number: 526) to DAK
Education
Spending on official travels by
MoEC is almost triple that of
spending by MoRA & MoRTHE
MoEC to examine its high allocation for official travel, and ensure there are good reason for this
to be higher than in MoRA and MoRTHE

Key findings and recommendations (3/7)
Key Findings Key Recommendations
2a. Key education sector programs: teacher management and certification (IDR 203.5 trillion or 49% of the total
education budget)
Spending on teacher
salaries and allowances
has risen sharply in
recent years but has not
been associated with
similar gains in learning
outcomes
Weak link between
teacher incentive with
performance/ quality
• MoEC to update existing Teacher Performance Management System to more directly link teacher
allowances (DAK-Profesi Guru) with competency achievement, continuous professional
development (CPD) and classroom performance
i. MoEC with MoRA to identify options for performance measures to directly link with allowances.
ii. MoEC, MoRA, MoF, MenPanRB, and MoHA to finalize pay for performance system based on
step (i)
iii. Revise PP (Government Regulation) no. 74/2008 on teacher certification & responsibility to
accommodate pay for performance program
iv. Revise Permenpan no. 16/2009 on teacher career progression to support step (iii)
• Commence a rigorous teacher re-certification process to ensure certification is more directly linked
to achievement of key professional competencies, and make periodic re-certification a condition for
teachers to continue to receive professional allowances and career progression.
• Support teacher Continuous Professional Development (CPD) through clear prioritization in annual
School Budget and Activity Plans (RKAS), optimising use of BOS funds.
• Leverage and explore opportunity for scaling up from existing initiatives
Improving teacher performance and accountability (KIAT GURU)
i. Community Empowerment: explicit role to verify teacher presence and evaluate teacher service
quality.
ii. Pay for Performance: Tying payment of teacher allowance with teacher attendance and
performance.
Tunjangan Kinerja Daerah/TKD for teachers in DKI Jakarta: teacher allowance from DKI government.
i. Fixed allocation (70%), affected by presence.
ii. Variable allocation (30%), affected by job functions and related variables.

Key findings and recommendations (4/7)
Key Findings Key Recommendations
2a. Key education sector programs: teacher management and certification (IDR 203.5 trillion or 49% of the total
education budget)
Imbalanced teacher
distribution across
subjects and regions.
Few districts have made
an effort to address
over/ undersupply of
teachers
Redistribute teachers across schools within districts
i. Districts to identify oversupply & undersupply of teachers in their area. (Data sources: 1) school
form R.10 on teacher needs 2) teacher census NUPTK, MoEC)
ii. Districts to map teacher needs and create a redistribution plan, in collaboration with teachers
and schools, based on step (i)
iii. Districts to issue approval/instruction letters for teacher redistribution based on step (ii)
Redistribute teachers across districts or across provinces
This is not currently possible due to Law no 23/2014 (authority to hire PNS teachers at primary and
junior secondary level is within districts only). Proposed steps:
i. MoEC and MENPAN revise the Law no. 23/2014 and
ii. Issue a new Perpres (Presidential Regulation) on teacher redistribution to support step (i)
To standardized recruitment process for non-permanent teacher, MoEC and MenPAN develop
national guidelines for recruiting non permanent teacher that will teach the main subjects and
extracurricular activities. The guidelines should cover the selection process, selection criteria, payment
(payroll, budget source), contract term, and other requirements

Key findings and recommendations (5/7)
Key Findings Key Recommendations
2b. Key education sector programs: BOS (IDR 45.1 trillion or 11% of the total education budget)
The current BOS allocation formula is
not linked to measurements of equity or
performance. Instead, the BOS formula
is currently based on number of
students enrolled.
Link BOS allocations to equity, need, and performance. One methodology for this is that
applied in by DKI province since 2015, which applies a formula with 3 components (Pergub
no.59/2016):
• Basic allocation: based on number of students
• Equity allocation: based on school location/special needs
• Performance allocation: based on improvement in national exams.
Nearly 60% of schools did not report
BOS funds realization in 2015. Lack of
BOS monitoring impedes transparency
and accountability in the use of funds.
More detailed data is needed to analyze
the efficiency of BOS funds in fulfilling
schools needs and achieving minimum
service standards (MSSs).
Improve transparency and accountability of BOS spending through expansion of school
planning and budgeting (RKAS – Rencana Kegiatan dan Anggaran Sekolah), and using
electronic based where possible which has been implemented in DKI Jakarta and Surabaya:
• E-RKAS helps schools to manage their budget, activities, needs, and targets they want to
achieve
• Goods and services are standardized in e-catalog
• E-RKAS helps to improve transparency and accountability as it is accessible by education
office/governor/other stakeholders for monitoring
Proposed steps in expanding RKAS to national level:
i. Revise Permendikbud no 8/2017 on BOS technical guidelines
ii. Nation-wide roll-out of a web-based school Self-Evaluation Instrument benchmarked
against MSS/National Education Standards through which annual School Budget and
Activity Plans (RKAS) are prepared.
iii. Use of e-catalogues for good and services for school planning and budgeting to achieve
value for money in the utilisation of school operational grants and other school-related
funds.
iv. Periodic, effective training to schools and their communities in how to conduct efficient,
effective and transparent school self-evaluation and annual planning to optimise the use
of BOS and BOP funds for education quality improvement.
v. Performance agreements between districts and schools, reviewed annually by districts
and schools, and reported to provinces (as BOS disburser).
vi. Preparation of annual school report cards by districts, published online and distributed to
provinces, school committees and parents
Key findings and recommendations (6/7)
Key Findings Key Recommendations
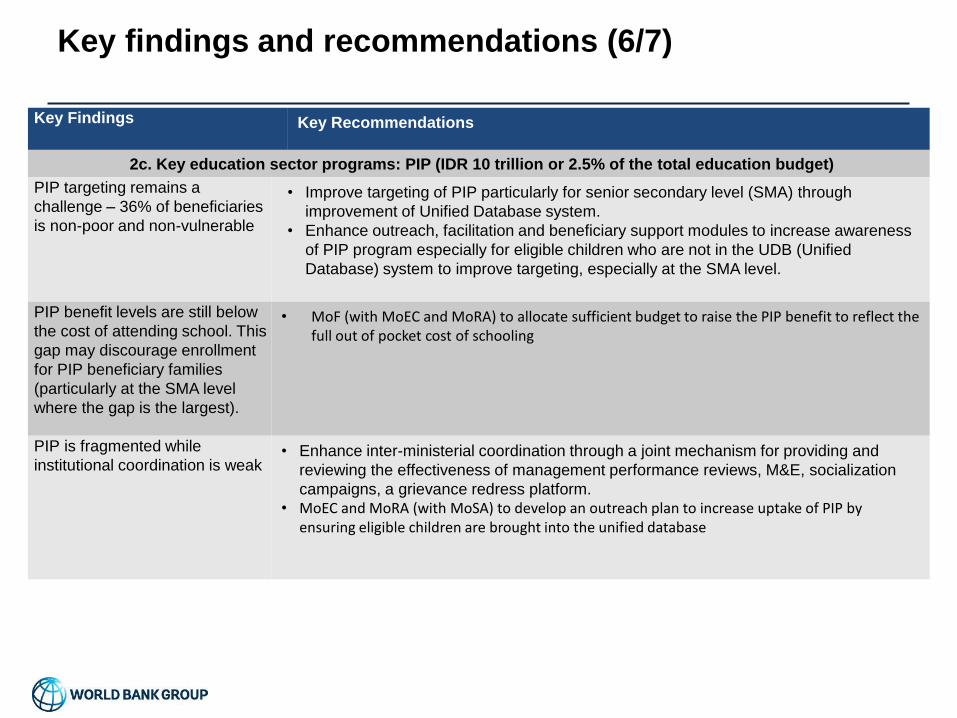
2c. Key education sector programs: PIP (IDR 10 trillion or 2.5% of the total education budget)
PIP targeting remains a
challenge – 36% of beneficiaries
is non-poor and non-vulnerable
• Improve targeting of PIP particularly for senior secondary level (SMA) through
improvement of Unified Database system.
• Enhance outreach, facilitation and beneficiary support modules to increase awareness
of PIP program especially for eligible children who are not in the UDB (Unified
Database) system to improve targeting, especially at the SMA level.
PIP benefit levels are still below
the cost of attending school. This
gap may discourage enrollment
for PIP beneficiary families
(particularly at the SMA level
where the gap is the largest).
• MoF (with MoEC and MoRA) to allocate sufficient budget to raise the PIP benefit to reflect the full out of pocket cost of schooling
PIP is fragmented while
institutional coordination is weak• Enhance inter-ministerial coordination through a joint mechanism for providing and
reviewing the effectiveness of management performance reviews, M&E, socialization
campaigns, a grievance redress platform. • MoEC and MoRA (with MoSA) to develop an outreach plan to increase uptake of PIP by
ensuring eligible children are brought into the unified database

Key findings and recommendations (7/7)
29
Key Findings Key Recommendations
3. Service delivery at facility level: aligning allocation with needs and performance
District education
spending is not
correlated with
district’s MSS
(Minimum Service
Standards)
achievement.
Budget for DAK
education (DAK
fisik) is weakly
correlated with
local
governments’
needs of
classroom
renovation
Enhance national performance monitoring and accountability for sub-national government
• Establish a transparent and publically accessible Education Achievement Index, referencing
MSS/National Education Standards, to monitor the performance of SNG’s’ education service delivery.
• Utilize the Education Achievement Index to influence results through incentives and sanctions:
1. Utilize the proposed Sovereign Wealth Fund for education to pay incentives to districts that achieve
system strengthening improvements (additional incentives for educational excellence).
2. Publish and socialize performance assessment results of sub-national governments against the
Education Achievement Index.
3. Provide capacity building and technical support to sub-national government to enhance their systems,
focusing on the low performers.
4. Apply financial sanctions in relation to DAK-fisik disbursement, where necessary.
• Education Achievement Index should be developed utilizing indicators that are:
• Regularly collected on an annual or semi annual basis could include DAPODIK, Education Statistic
office (MoEC& MORA);
• Directly capture the outcomes of interest, for example:
• Net Enrollment Rate (NER) at Early Childhood and at senior secondary level of education;
• Effective distribution of teachers across geographical regions based on student
enrollments;
• Sufficiency and condition of educational infrastructure
• Learning outcomes of students;
• Utilization of budget at school and district level;
• ECED participation rate
• Weighted to take into account the needs of the various districts and regions (rather than setting
different criteria for remote regions)
• Transparent, and easy to understand at the levels of school, district and central management as
well as the general public.
• The Education Achievement Index should be publicized as the instrument to create public
awareness as well as make hard decisions on utilization of budget.