‘improving quality of life and enhancing sustainable economic development’
TRANSCRIPT

‘Improving Quality of Life and Enhancing Sustainable Economic Development’
SEWERAGE AND BULK WATER CAPACITY IN MSUNDUZI
ADDRESSING THE WATER CHALLENGE WITHIN UMGENI WATER’S
SUPPLY AREA
06 May 2015Investment Conference 2015

‘Improving Quality of Life and Enhancing Sustainable Economic Development’
PRESENTATION CONTENT
Wastewater Infrastructure
Water Demand
Water Resource Infrastructure
Long-term plans to balance Supply and Demand

‘Improving Quality of Life and Enhancing Sustainable Economic Development’
Wastewater Infrastructure

‘Improving Quality of Life and Enhancing Sustainable Economic Development’
DARVILL WASTEWATER WORKS
Originally constructed in 1956
Serves the City of Pietermaritzburg
Owned and operated by Umgeni Water
Designed average dry weather flow of 65 Ml/day
Effluent mix: 90% domestic & 10% industrial
Inflow during last wet season reached 150 Ml/day!
Currently discharging approx. 60 Ml/day treated effluent into the
Msunduzi River

‘Improving Quality of Life and Enhancing Sustainable Economic Development’
DARVILL WASTEWATER WORKS
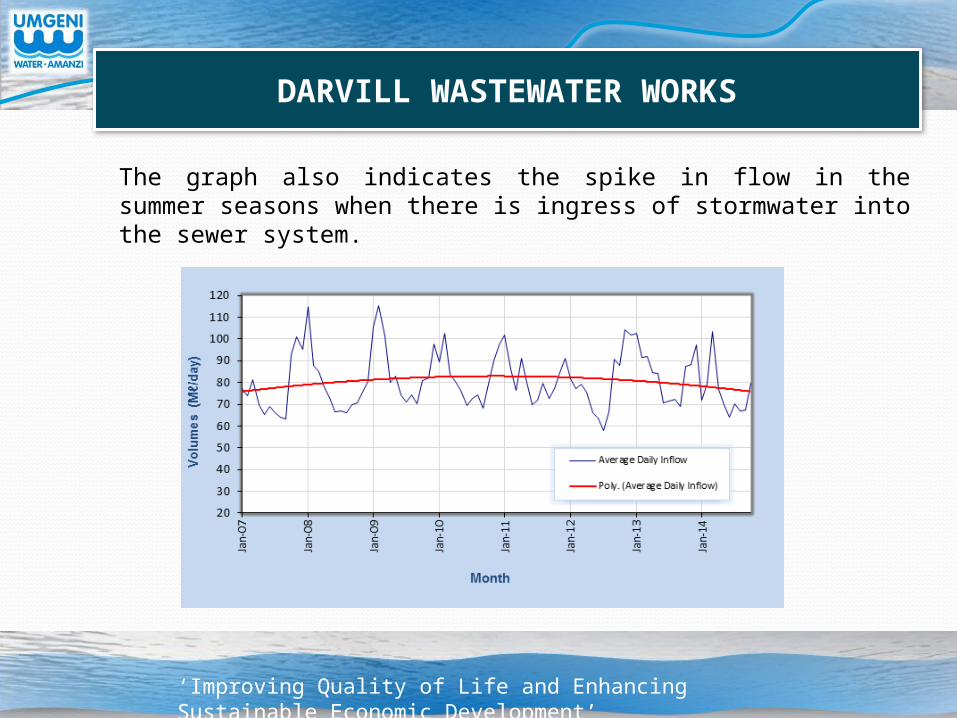
This WWW has a current biological treatment capacity of 65 Mℓ/day. Current average daily inflow (Oct 2007 to Oct 2014) is approximately 81 Mℓ/day which is more than the plant’s capacity.
The Darvill WWW serves the Msunduzi Municipality.
‘Improving Quality of Life and Enhancing Sustainable Economic Development’
DARVILL WASTEWATER WORKS
The graph also indicates the spike in flow in the summer seasons when there is ingress of stormwater into the sewer system.

‘Improving Quality of Life and Enhancing Sustainable Economic Development’
DARVIL UPGRADE
This WWW is currently being upgraded to a biological treatment capacity of 100 Mℓ/day.

‘Improving Quality of Life and Enhancing Sustainable Economic Development’
Water Demand

‘Improving Quality of Life and Enhancing Sustainable Economic Development’
Population Distribution
Source: CoGTA 2009
Harry Gwala
Umgungundlovu
Ugu
eThekwini
iLembe
Msunduzi
‘Improving Quality of Life and Enhancing Sustainable Economic Development’
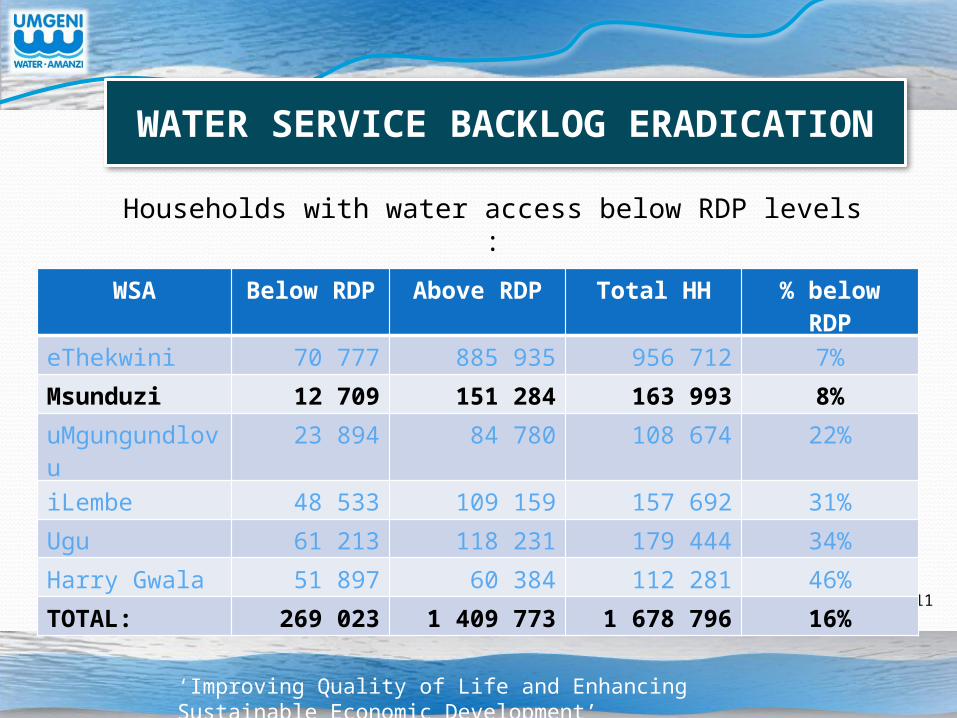
Households with water access below RDP levels :
WATER SERVICE BACKLOG ERADICATION
Source: Census 2011
WSA Below RDP Above RDP Total HH % below RDP
eThekwini 70 777 885 935 956 712 7%
Msunduzi 12 709 151 284 163 993 8%
uMgungundlovu 23 894 84 780 108 674 22%
iLembe 48 533 109 159 157 692 31%
Ugu 61 213 118 231 179 444 34%
Harry Gwala 51 897 60 384 112 281 46%
TOTAL: 269 023 1 409 773 1 678 796 16%

‘Improving Quality of Life and Enhancing Sustainable Economic Development’
NON REVENUE WATER
Source: DWS 2014
% Non Revenue Water in 2013/2014 vs 2018/2019
WITH and WITHOUT intervention

‘Improving Quality of Life and Enhancing Sustainable Economic Development’
NON REVENUE WATER
Source: DWS 2014
• Total Non Revenue Water for 2013/14 600 Ml/day
• Total Non Revenue Water for 2018/19 WITHOUT intervention 691 Ml/day
• Total Non Revenue Water for 2018/19 WITH intervention 418 Ml/day
• Total Capital Cost of Intervention R946 million
• Total Operating Cost of Intervention R286 million
• Responsibility for implementation: Water Service Authorities
• Support provided by DWS

‘Improving Quality of Life and Enhancing Sustainable Economic Development’
Water Resource Infrastructure

‘Improving Quality of Life and Enhancing Sustainable Economic Development’
Mearns Weir
Spring Grove Dam
Nagle Dam
Inanda Dam
Hazelmere DamMidmar Dam
Albert Falls Dam
Mhlabatshane Dam
Umzinto Dam
EJ Smith Dam
CURRENT WATER RESOURCES
Mtwalume (run-of-river)
Mvoti (run-of-river)

Resource River
Stochastic Yield (Ml/day)
Demand (Ml/day)
1:50 1:100
Mgeni System (including MMTS-2B) uMngeni & Mooi 1118 1081 1130
Mvoti (run-of-river) uMvoti 9 Not Available 18
Hazelmere Dam uMdloti 55 51 55
Nungwane Dam Nungwane 10 9 10
E.J. Smith Dam Mzimayi 5 3 4
Umzinto Dam uMuziwezinto 9 6 12
Mtwalume (run-of-river) uMtwalume 5 3 10
Mhlabatshane Dam Mhlabatshane 5 4 0.5
CURRENT WATER RESOURCE AVAILABILITY

‘Improving Quality of Life and Enhancing Sustainable Economic Development’
Long Terms plans to balance Supply and Demand

‘Improving Quality of Life and Enhancing Sustainable Economic Development’
WATER RESOURCE DEVELOPMENT
Mgeni Water Balance
Source: Department of Water & Sanitation, June 2014
SHORTFALL

‘Improving Quality of Life and Enhancing Sustainable Economic Development’
Resource RiverCapacity
(million m3)Yield
(Ml/day)1:100
uMkhomazi Water Project Phase 1 (Smithfield Dam) uMkhomazi 226 602
uMkhomazi Water Project Phase 2 (Impendle Dam) uMkhomazi 270 1227
East Coast Desalination Plant – North -- -- 150
EWS Reuse Plants (Northern & KwaMashu) -- -- 110
PROPOSED WATER RESOURCE AUGMENTATION

‘Improving Quality of Life and Enhancing Sustainable Economic Development’
PROPOSED WATER RESOURCE DEVELOPMENTS
uMkhomazi Water Project

‘Improving Quality of Life and Enhancing Sustainable Economic Development’
PROJECT CAPITAL COSTS
ProjectCapacity (Ml/day)
Capital Cost(R)
Responsibility
uMkhomazi Water Project Phase 1 (Smithfield Dam) 602 17 billion DWS Raw Water (R13.1 billion)
UW Potable (R3.7 billion)
East Coast Desalination Plant – North
150 3.5 billion UW
Reuse Plants (Northern & KwaMashu)
110 2.5 billion eThekwini Metro

‘Improving Quality of Life and Enhancing Sustainable Economic Development’
DEVELOPMENTAL BULK WATER SUPPLY INFRASTRUCTURE
uMshwathi BWSS
Greater Mpofana BWSS
Maphumulo BWSS
Richmond Pipeline
Greater Eston BWSS
Mhlabatshane BWSS
Southern Ndwedwe
Mzimkhulu BWSS
Impendle BWSS

‘Improving Quality of Life and Enhancing Sustainable Economic Development’
SUMMARY
• Large augmentation schemes are necessary to sustain the projected demand over the long term
• It is primarily the responsibility of DWS and Umgeni Water to implement these schemes
• Total Municipal Non-Revenue Water in Umgeni Water’s supply area is currently 43% Savings in Non Revenue Water could defer implementation of large augmentation schemes
• Building large capital schemes are major undertakings that require significant lead times and funds to implement
• There will be a direct impact on the water tariff to consumers either via the CUC or UW tariff

‘Improving Quality of Life and Enhancing Sustainable Economic Development’
Thank You