improving production efficiency david ellings david rosebrook business mentors 2006 dkc conference,...
TRANSCRIPT

Improving Production Improving Production EfficiencyEfficiency
David EllingsDavid RosebrookBusiness Mentors
2006 DKC Conference, Toronto

What’s On TapWhat’s On Tap
1. Industry standards
2. Efficiency myths and facts
3. Study profile
4. A case study
5. The results
6. The hidden effect
7. The bottom line
8. Simple steps to improve your position
9. Building the team

Measuring Success?Measuring Success?
Employees
Equipment
Building Size
Volume

SALES:SALES:$5,000,000$5,000,000
EXPENSE:EXPENSE:$4,850,000$4,850,000
PROFIT:PROFIT:$150,000 or 3%$150,000 or 3%
SALES:SALES:$750,000$750,000
EXPENSES:EXPENSES:$600,000$600,000
PROFIT:PROFIT:$150,000 or 20%$150,000 or 20%


NAICS CodeNAICS Code
Industry Segment
Profit

PROFIT
DIRECT COSTSOVERHEAD COSTS
0 – 22%
15 – 30%
50 – 80%

DIRECT COSTS
50 – 80%
Direct Costs
20 – 50% Material/Equipment
50 – 90% Labor

50 – 90% Labor50 – 90% Labor
Focus For Efficiency

Top Five InefficienciesTop Five Inefficiencies
• Materials • Buying smarter and using wiser
• Speed of work• Get your employees to move faster through the assigned tasks
• Amount of management• Train your staff to function in the field with less management
oversight
• Pricing• Estimating program pricing problems
• Project size• Advance to larger projects…they are more substantially more
profitable

Ratio Difference Efficiency Ratio Difference Efficiency

True InefficienciesTrue Inefficiencies
• Scheduling– Time management and efficient use of resources
• Material procurement– Multiple trips, retaining stock, price shopping
• Accuracy– Time card slippage, accountability, management
• Drive time– Most significant indicator, liability, waste, waste,
waste

Study ProfileStudy Profile
Executive Summary• Productivity trends carry a large impact
on profitability• Utilize detailed data gathered over three
years to analyze efficiency• Productivity focused on production employees and management processes
• Clear conclusions were able to be drawn by the results
IntroductionIntroduction
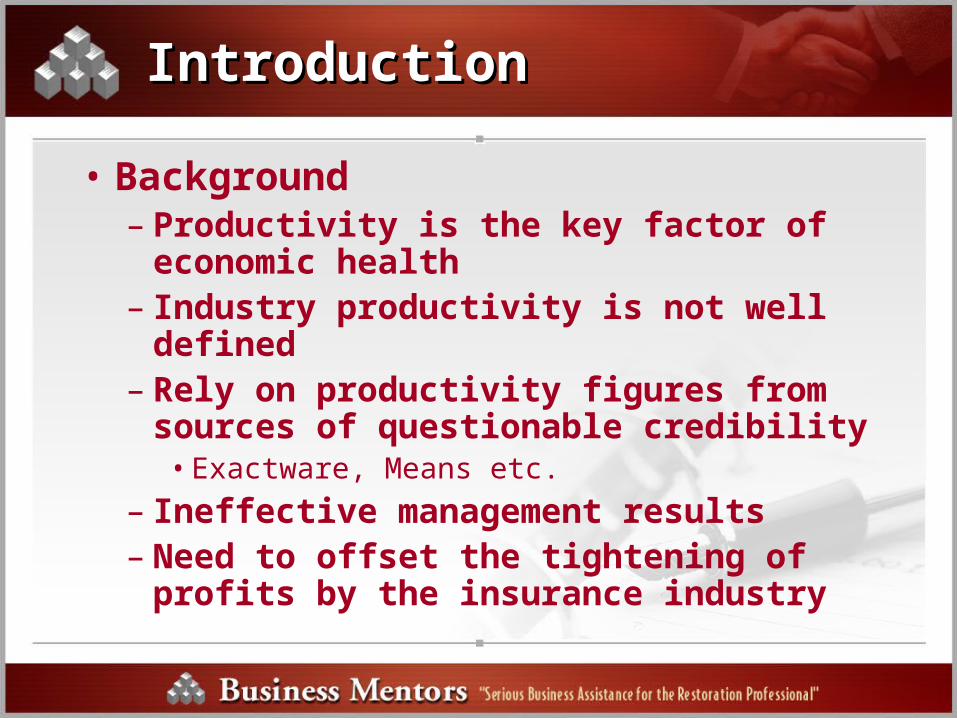
• Background– Productivity is the key factor of economic
health– Industry productivity is not well defined– Rely on productivity figures from sources of
questionable credibility• Exactware, Means etc.
– Ineffective management results– Need to offset the tightening of profits by the
insurance industry

IntroductionIntroduction
• Objectives– Study efficiency trends over an extended
period– Create an awareness– Counter insurance industry pressure on
margins– Increase management tools– Nothing matters unless we increase….
$ NET PROFITS $

IntroductionIntroduction
• Scope– Defined:
The American Association of Cost Engineers
“Productivity is a relative measure of labor efficiency, either good or bad, when compared to an
established base or norm”
– Its nature creates difficulties in tracking it as an absolute value over time.
– Information is gathered against movements of an established base, or benchmark value

IntroductionIntroduction
• Methodology– Study detailed movement of 82 production
employees – Focus on inefficient time and not on production
cycles– Created buy-in through incentives and self-
improvement– Used sampling and statistical analysis techniques to
establish and confirm results– Sampled across all company production areas– Gathered data very quietly

Affecting FactorsAffecting Factors
• Project Uniqueness– Each job is different and unique
• Environmental factors– Landscape, weather, and physical location
• Aesthetic factors– Level of quality required, material selection, existing conditions
• Human factors– Expectations of adjusters, owners, managers etc.
– Uniqueness requires modification of the process…creating an inefficient learning curve at the beginning stages of each project activity

Affecting FactorsAffecting Factors
• Technology– Hugh effect on overall productivity– Modify skill requirements
– Create difficulties in separating contributions of technology, management and labor to the efficiency
– Less motivation to add technological changes when the associated labor is not expensive
– Sometimes expensive and only a temporary strategic advantage

Affecting FactorsAffecting Factors
• Personnel– Management
• Level of training, accountability, and knowledge• Documented studies – poor management activities account for over
50% of the inefficiencies
– Production• Cross training, flexible contract increase efficiency• The fall of “real wages” within the industry
– Old skills retire...young talent goes else ware– Industry tends to retire or fall off at an earlier age
• Lack of formal training– Lowest of any formal sector of the economy– Workforce tends to be transient, causing a reluctance to invest capital
to train

Case Study AssumptionsCase Study Assumptions
Employee• Carpenter
– Generalist to handle multiple tasks• Wage: $25/hour• Burden: 50%• Total cost to employee: $37.50/hour• Work year available: 1960 hours/year
– 2080 hours minus 3 weeks for holidays, vacation and sick time.
• Expected production: $100/hour

Scenario OneScenario One
7:00 AM arrive at your facility to get assignment and supplies
7:00 – 7:30 drive to work site
7:30 – 9:30 install trim (productive work)
9:30 – 9:45 break (paid)
9:45 – 11:30 finish trim and paint (productive work)
11:30 – 12:00 lunch (unpaid)
12:00 – 1:45 install interior doors (productive work)
1:45 – 2:00 break ( paid)
2:00 – 3:00 install door hardware (productive work)
3:00 – 3:30 drive back and unload items and paperwork

Scenario OneScenario One
Results
• 8 hours worked and paid
• $200 wages + $100 burden = $300 cost
• 6.5 hours productive revenue generation
• 1.5 hours unproductive time paid
19% of paid time unproductive

Scenario TwoScenario Two
7:00 AM arrive at your facility to get assignment and supplies
7:00 – 7:30 drive to work site
7:30 – 7:45 get coffee then discuss project, activities last evening and other personal items with the rest of the production crew
7:45 – 8:00 unload supplies and tools from truck and set-up to work
8:00 – 9:00 install trim (productive work)
9:00 – 9:15 break (paid)
9:15 – 9:20 put away coffee, doughnuts and items from break

Scenario TwoScenario Two
9:20 – 10:00 install trim but a scope clarification problem arises (productive work)
10:00 – 10:15 discuss project with home owner and/or call project manager for clarification
10:15 – 10:30 install trim (productive work)10:30 – 10:40 at 10:20 the carpenter realized that there
wasn’t enough trim to complete the work, so a discussion about this issue occurs with the crew and the carpenter winds down his activities to get ready to leave for a store
10:40 – 11:00 drive to Home Depot (even though there was another lumber yard 5 min away but was unknown to the carpenter)

Scenario TwoScenario Two
11:00 – 11:30 locate trim in store, pick-up a couple of other supplies on your account, look at a the new compound miter saw, look at bath fixtures for a home remodel or side job, go to pro-desk to check out, converse with pro-desk manager about the weather or sports, load items into truck and leave
11:30 – 11:40 stop for gas and snacks
11:40 – 12-00 drive back to project
12:00 – 12:30 lunch (unpaid)
12:30 – 12:40 conclude lunch and put away lunch supplies, clean-up and use restroom

Scenario TwoScenario Two
12:40 – 1:00 install last piece of trim ( project completed for the day, other supplies to arrive tomorrow)
1:00 – 1:15 wind down from activities and load vehicle
1:15 – 1:30 drive to a different work site
1:30 – 1:45 set-up tools and work at new site, also greet and discuss things with crew/homeowner
1:45 – 2:15 install windows (productive work)
2:15 – 2:30 break (paid)
2:30 – 2:35 put away coffee, doughnuts and items from break

Scenario TwoScenario Two
2:35 – 2:50 install insulation (productive work)
2:50 – 3:00 wind down for day, load truck and leave
3:00 – 3:30 return to facility, drop of time sheet/paperwork and unload supplies and debris

Scenario TwoScenario Two
Results
• 8 hours worked and paid
• $200 wages + $100 burden = $300 cost
• 3.0 hours productive revenue generation
• 5.0 hours unproductive time paid
63% of paid time unproductive

The Cost of InefficiencyThe Cost of Inefficiency
Scenario One
Scenario Two
Industry Average
1.5 hrs = $56.25/person/day = $13, 781/year
5.0 hrs = $187.50/person/day = $45,937/year
2.6 hrs = $99.00/person/day = $24,255/year

Is this it….

No, it is just the tip of the ice berg!

What about the revenue that should have been earned during the inefficient time spend….

Lost RevenueLost Revenue
• 2080 hrs in a work year = $208,000– 3 weeks removed for vacation, holidays, etc.
• 1960 possible productive hours in a year
• At $100/hr = $196,000/person/year of
revenue generation

Lost RevenueLost Revenue
Scenarios
1. $36,750/yr of lost revenue per person1. 367.5 hrs unproductive = 1592.5 hrs productive
2. $122,500/yr of lost revenue per person– 1225 hrs unproductive = 735 hrs productive
Avg. $64,680/yr of lost revenue per person
– 646.8 hrs unproductive = 1313.2 hrs productive

What Does All of This Mean?What Does All of This Mean?
Company Assumption• 1,000,000 revenue for year
– 60% direct costs = $600,000• 25% materials/equipment = $150,000• 75% direct labor = $450,000
– 25% overhead = $250,000– 15% profit = $150,000

What Does All of This Mean?What Does All of This Mean?
Company Assumption
• We will use the average efficiency to test
1/3 of production day is inefficient2 hours 38 minutes non-productive
5 hours 22 minutes productive time


Small Increase, Big GainSmall Increase, Big Gain
5% increase = 25% more profit5% increase = 25% more profit
• Productive time– 5hr 22min to 5hr 37min…..or only 15 min/day– 12,000 hrs of labor in our example – 1,500 personnel days per year– 1,500/days X .25hrs X $100 =
$37,500 increase in PROFITS
ResultsResults
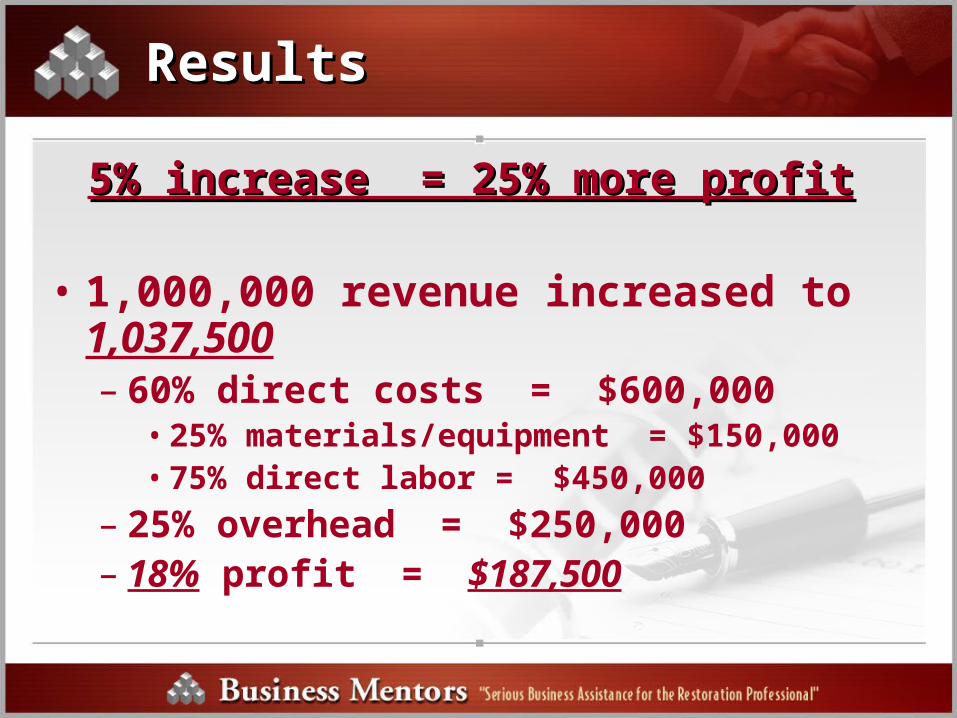
5% increase = 25% more profit5% increase = 25% more profit
• 1,000,000 revenue increased to 1,037,500– 60% direct costs = $600,000
• 25% materials/equipment = $150,000• 75% direct labor = $450,000
– 25% overhead = $250,000– 18% profit = $187,500

ResultsResults
5% increase = 25% more profit5% increase = 25% more profit
Therefore with the exact same costs the company was able to produce an increase of $37,500 of additional revenue which increased the profit by the expected 25% from $150,000 to $187,500 with only 15 min of increased production per person each day.

ResultsResults
5% increase = 25% more profit5% increase = 25% more profit
In addition, in order to capture the same profit of $187,500 without increasing the efficiency would require a 25% increase in the revenue or an additional $250,000 of sales….
Which is the easier improvement?

Actual ResultsActual Results
History• 62% increase in employee retention• With incentives wages increased 6½ X greater
then rate of inflation• 18% increase in margins• 76% decrease in paid none revenue travel time • 36% decrease in management related
inefficiencies• 54% reduction in production inefficiencies

Actual ResultsActual Results
42.4%

Break Time
10 Minutes

Recap Recap
• Direct costs represent 50% to 80% of the companies total expenditures
• Labor represents 50% to 90% of the total job costs on a project

Recap Recap
• Direct costs represent 50% to 80% of the companies total expenditures
• Labor represents 50% to 90% of the total job costs on a project

True Inefficiencies According to Dave True Inefficiencies According to Dave
• Scheduling
• Materials procurement
• Accountability of employees
• Travel time

A SolutionA Solution
• Build a construction team that is accountable for the outcome of the project from the time the first call is received until the final check is cashed
• Proactively plan the project and then execute the plan
• Measure your progress and outcome

ContentsContents
• Building the construction team
• Planning the project– Estimating– Budgeting– Scheduling– Materials
• Measuring our progress
Building the construction teamBuilding the construction team
Two different models for production
• Production manager
• Construction team

Production ManagerProduction Manager
PROS
• Specialized sales team
• Specialized construction team
CONS
• Poor communication• Lack of
accountability• Us against them
mentality

Construction TeamConstruction Team
PROS
• Team environment• Improved
communication• One person accountable
for the entire project from start to finish
• Easy to duplicate
CONS
• Potentially uneven sales from month to month
• Potential for poor or slow production
Progression of a Construction TeamProgression of a Construction Team
• Project manager – sell, write, run
• Project manager and coordinator or superintendent
• Project manager, coordinator and superintendent

Project ManagerProject Manager
• Responsible for everything– SalesSales– MarketingMarketing– EstimatingEstimating– ProductionProduction– CollectionsCollections
• Limited by time and energyLimited by time and energy• Typically will produce from $500,000 to Typically will produce from $500,000 to
$1,000,000 per year$1,000,000 per year

Project Manager and Coordinator or Project Manager and Coordinator or SuperintendentSuperintendent
• Project manager is responsible for everything
• Hires to compliment his/her strengths
• Delegates responsibilities to the coordinator or superintendent
• Needs to produce from $1,250,000 to $1,750,000 per year

Project Manager, Coordinator and Project Manager, Coordinator and SuperintendentSuperintendent
• Project manager is responsible for everything
• Delegates responsibilities to the coordinator and superintendent
• Needs to produce $1,750,000 or more each year
• Top dollar amount depends on project size and location

Building the Construction TeamBuilding the Construction Team
• The players
• Their responsibilities

The PlayersThe Players
• Project manager
• Coordinator
• Superintendent
• Lead carpenters or lead technicians
• Field staff
• Temporary employees
• Subcontractors
Project Manager ResponsibilitiesProject Manager Responsibilities
• Sales, Sales, Sales
• Marketing
• Managing the construction team
• Accountable for the teams outcomes

Coordinator ResponsibilitiesCoordinator Responsibilities
• Administrative assistant for the team• Budgeting• Communications with adjuster and
homeowners• Assemble project books• Keeping computer software up to date• Helping with collections• Make the project manager look good!• 95% of this persons time is spent in the office• Compensation is around $38,000 per year plus
bonus

Superintendent ResponsibilitiesSuperintendent Responsibilities
• Scheduling• Quality control• Training• Keeping projects on budget and on schedule• Manage subcontractors• Customer selections• Order materials• Manage the homeowners expectations• Safety• 95% of this persons time is spent in the field• Compensation is around $45,000 per year plus bonus

Lead CarpenterLead Carpenter
• Works on the project• Manages the project• Quality control• Safety• Manages the homeowners expectations• Manages subcontractors• Keeps site documentation up to date• Works on 1 to 3 small projects at a time or one
large project (over $15,000)• Compensation is in the $18 to $28 per hour
range

Field StaffField Staff
• Carpenters, helpers, painters, drywallers, etc…
• Keep the number of field staff small• Travel, meetings and other non-
productive times are magnified• When work is slow they are on “shop
time”• When work is slow painters are framing!• Tendency to overstaff jobsites

Temporary EmployeesTemporary Employees
• Labor – Good source of labor– There are pros and cons– They only work when we have jobs
• Skilled labor– Acceptable source of skilled labor– You have to be organized
• Some insurance programs are trying to limit the use of temporary employees
SubcontractorsSubcontractors
• Fixed price for work
• They need to be managed
• You do not pay for inefficiencies
• Small subcontractors are better suited for our margins

A System for Improving EfficiencyA System for Improving Efficiency
• By design– Keep the system simple and easy to use in
the office or in the field– Easy to duplicate with different levels of
employee proficiency– Inexpensive – Expandable– Does not break down when project volume
increases
• Could be the most difficult thing you do!

Start With the End in MindStart With the End in Mind
• What does the lead carpenter need to successfully complete the project?
– Scope of work– Budget– Schedule– Customer selections– Materials

The EstimateThe Estimate
• Scoping the loss
• Sketch
• Estimate detail
• Estimate timelines
• Negotiations
• Open items

Scoping the LossScoping the Loss
• Consistent
• Accurate
• Fair
• Detailed
• Notes– For the adjuster and his boss– For the superintendent and lead carpenter
• Sketch

Estimate TimelinesEstimate Timelines
• Timelines– 24 hours – under $10,000– 48 hours – under $50,000– 72 hours – over $50,000
• Exceptions– Specialty items– Subcontractors– Open items

Open ItemsOpen Items
• Line items in the estimate that do not have firm dollar amounts
• Allow the estimate to be completed and uploaded on time
• Allow for future supplements
• Strong potential that supporting invoices and other documentation will be required

NegotiationsNegotiations
• Meet the adjuster at the loss site to scope the project
• Understand the estimating software better than the adjuster
• Argue scope not price

The BudgetThe Budget
• Markup vs. Margin
• Calculating the sales price
• Calculating the budget amount
• Different budgeting tools– Xactimate– Excel

DefinitionsDefinitions
• Direct costs are the actual expenses – labor, materials, subcontractors and permits that go into each project.
• Markup is the amount added to the direct job costs to get the selling price – expressed as a percentage of direct costs.
• Gross profit is the amount of money remaining after the direct costs have been deducted.
• Gross margin is the difference between direct job costs and the selling price – it is expressed as a percentage of the selling price.

Gross Margin
50
45
40
35
33
30
25
20
16.66
Markup
100
82
67
54
50
43
34
25
20 O&P

Using Markup to Find the Sale PriceUsing Markup to Find the Sale Price
• Target is a gross profit of 40% no O&P– Markup direct costs by 67%– Gross profit equals 40.1%
• Target is a gross profit of 40% with O&P– Markup direct cost by 40%– Add overhead and profit 20%– Gross profit equals 40.5%
• Gross profit = (contract amount – direct costs) -1 contract amount

Calculating the Budget AmountCalculating the Budget Amount
• With overhead and profit– Budget = contract * (1-(gross profit))
– Budget = $167 * (1-(40%))
= $167 * (.6)
= $100.20
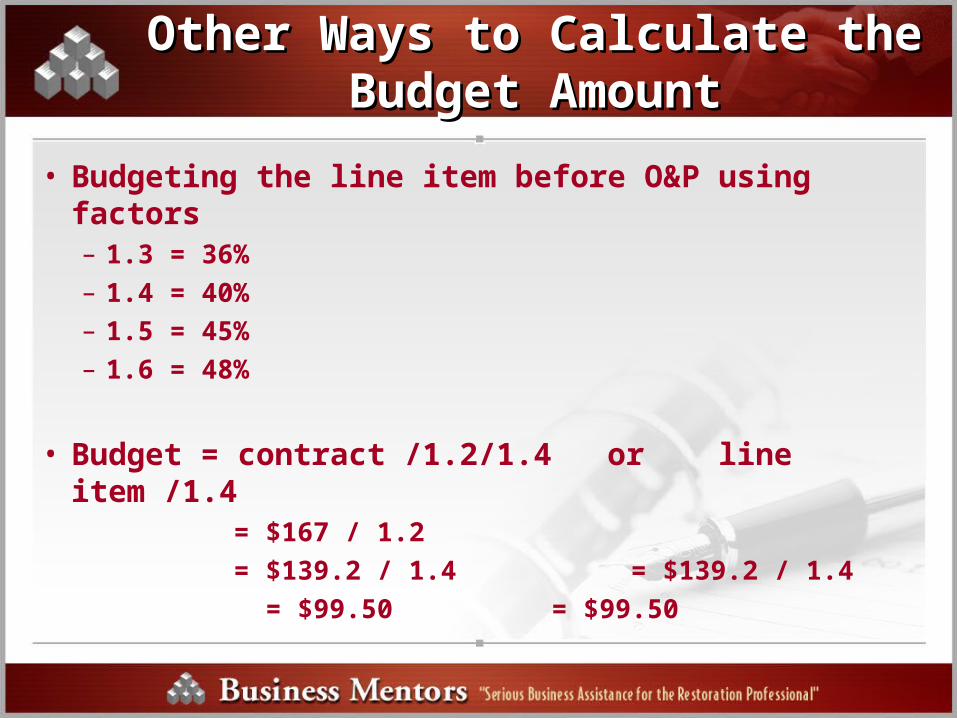
Other Ways to Calculate the Budget Other Ways to Calculate the Budget AmountAmount
• Budgeting the line item before O&P using factors– 1.3 = 36%
– 1.4 = 40%
– 1.5 = 45%
– 1.6 = 48%
• Budget = contract /1.2/1.4 or line item /1.4 = $167 / 1.2
= $139.2 / 1.4 = $139.2 / 1.4
= $99.50 = $99.50

Budgeting ToolsBudgeting Tools
• Xactimate– Factoring– Work orders
• Excel spreadsheet

Xactimate FactoringXactimate Factoring
• Xactimate version 2002– Create a duplicate estimate– Grouping screen– Highlight all rooms– Pull down the EDIT menu– Go to FACTORING– Highlight activity and change factor– Do this separately for each activity– When complete press OK

Factoring Table for XactimateFactoring Table for Xactimate
Factor
75
70
50
25
Gross profit
37.5%
42%
58.5%
79%

Xactimate Work OrderXactimate Work Order
• Xactimate Version 2002– Go to work order – Set up vendor as “ Budget”– Select all categories– Highlight categories and set factor using
factoring table for desired gross profit– Follow instructions until finshed
Excel SpreadsheetExcel Spreadsheet
• Easy to manipulate and change data
• Able to track costs and changes throughout project
• Can be tailored to your company
• Uses your companies labor and burden rates
• Separates labor, materials, equipment, subcontractors
• Example of a budgeting spreadsheet
The ScheduleThe Schedule
• A schedule is simply a plan for carrying out a project, indicating when each operation should begin and when it should end.

Types of SchedulesTypes of Schedules
• Manual– Calendar
– Scheduling board
– Work orders
– Spreadsheet (Gant)
• Computer program– JPP
– Microsoft Project
– Plethora of others options

Rules for a Successful ScheduleRules for a Successful Schedule
“Under promise and over deliver”1. List the work trades (from your estimate)2. Put the trades in the proper sequence3. Find the time allotted for each trade (from
your budget)4. Schedule each trade in its proper sequence
showing start and stop dates5. Allow plenty of time during the schedule
for unplanned events

Scheduling Scheduling
• Simple, easy to revise, and take as little effort as possible
• Tracks what work is complete
• Tracks the start date of upcoming trades
• Sets the completion date for trades, inspections, materials, selections
• Sets expectations and accountability
• Has solid must hit dates
Materials and SelectionsMaterials and Selections
• Making the materials list
• Getting materials to the job site– At project start up– While the job is in progress– When the job is done
• Customer selection process

Making the Materials ListMaking the Materials List
• Print components list from Xactimate• Site visit
– Good time for project manager to hand-off project to the superintendent
– List of all homeowner selections prepared in advance by coordinator
– Confirm lengths, styles, colors of all materials– Compare actual materials to components list– Leave site with detailed list of materials to complete
the project– Use vendors for specialty items such as windows,
cabinets, and doors

Getting the Materials to the Job SiteGetting the Materials to the Job Site
• Delivery by supplier– Job site– Warehouse
• Delivery service– Good for small pick-ups– Cost around $25– Keeps your lead carpenters on the job site
• In-house delivery person– Job costed– Needs to have a set schedule for deliveries
• Will-call

While the Job is in ProgressWhile the Job is in Progress
• Large projects– Order materials by phase and have them delivered
• Small projects– Order all materials before the project starts and
have them at the site, warehouse or will-call
• Daily phone call by lead carpenter– Materials for tomorrow
– Ask “ What materials do you need tomorrow, or to finish out the project”
• Site visit by superintendent

When the Project is CompleteWhen the Project is Complete
• Leave all project specific materials behind for the homeowner – paint, trim, scraps
• Throw all scraps and project specific materials away
• Lead carpenter and superintendent remove left over materials– Return to store – superintendent– Return to warehouse – superintendent– Take to next project – lead carpenter

Homeowner SelectionsHomeowner Selections
• Must be in writing and signed by the homeowner
• List of selections is generated by the coordinator using the estimate
• Small project under $25,000 selections made before work begins
• Large projects selections made by the time demolition and cleaning is complete

MeasurementsMeasurements
• Job cost-outs
• Accountability reports
• Production meetings

Job cost reportsJob cost reports
• Manual– Field report by superintendent or lead
carpenter– Spreadsheet used by coordinator or project
manager
• Accounting software

Accountability ReportsAccountability Reports
• Production report– Budget vs. actual cost
• Project manager efficiency– Length of time to complete estimate– Length of time to get contract signed
• Production efficiency – Measures estimated completion time vs.
actual completion time

Production MeetingsProduction Meetings
• Weekly production meeting
• Daily team meeting

Strategies For CorrectionsStrategies For Corrections

Strategies For CorrectionsStrategies For Corrections
• Put production on a pedestal– Plan and use your production staffs 2080
hours as your first priority

ProductionProduction
• Create and post and organization chart– Make sure each production person know where they
lay and who supervises them
• Emphasis safety and safety training– Let them know you are interested in their well being
• Create a detailed job description for each employee– Change them as the positions change
• Create a review form holding them accountable for the items in the job description

ProductionProduction
• Include them in meetings• Offer training incentives• Have a clear and concise path for career
mobility• Remove cancers immediately
– Hire tough…fire fast
• Create and implement an incentive plan – Both personal and team based– Small perks and recognition go a long way

ProductionProduction
• Remember:
You can’t manage what you can’t measure-Jack Welch
And
Trust but verify-Ronald Regan (with special credit to Phil Rosebrook Sr.)

Strategies For CorrectionsStrategies For Corrections
• Put production on a pedestal– Plan and use your production staffs 2080
hours as your first priority
• Monitor and reduce drive time– Monitoring is the blood test of your
businesses health check-up– Single most reducible and inefficient time
spent

Drive TimeDrive Time
• Start/stop day at job site– Production staff should start and end day for all
non-emergency work at the job site
– Use technology to monitor the process
– Review company vehicle policy
– Pay mileage instead of allowance• This will allow a tracking mechanism for drive time
– Add runner for material delivery• Better yet use your suppliers to deliver material
– The numbers do not support staff material procurement

Strategies For CorrectionsStrategies For Corrections
• Material Handling– Dispose of extras– Look critically at what you stock– Keep production from material procurement
at all costs

Material HandlingMaterial Handling
• Don’t return unused commodity stock to your warehouse– Dispose on site
– Give to property owner
• Production personnel should produce and not purchase
• Avoid the temptation to stock most supplies. – The savings on most bulk purchases are far offset by
the cost of storage and delivery
– Utilize suppliers that will deliver even for a fee

Strategies For CorrectionsStrategies For Corrections
• Material Handling– Dispose of extras– Look critically at what you stock– Keep production from material procurement
at all costs
• Add technology– Computer, faxes, PDA’s– GPS, Sprint/Nextel systems

TechnologyTechnology
• Cost vs. benefit– Make sure it makes sense financially and
logistically
• Keep production staff out of office– Use faxes or computers to send daily time
sheets– Enter time data in real time through PDA’s
or phones
• Use GPS to track assets, both organic and inorganic

Challenges of having a mobile Challenges of having a mobile workforceworkforce
• No visibility into your team• High overtime costs• Manual timecard processing• High mileage costs• Can’t allocate your resources
effectively• Difficult to communicate with
your team• Manual dispatching• Manual paperwork chaos

Mobile VendorsMobile Vendors
• Gearworks (gearworks.com)– Etrace:Worksmart
• Aligo (aligo.com)– WorkTrack
• Portable Internet (portableinternet.com)– GPS Mobile Workforce Management
• Westlake Software (westlakesoftware.com)– AIR Mobility
• Time Card (timecard.econz.com)– Time Card (Verizon Wireless)
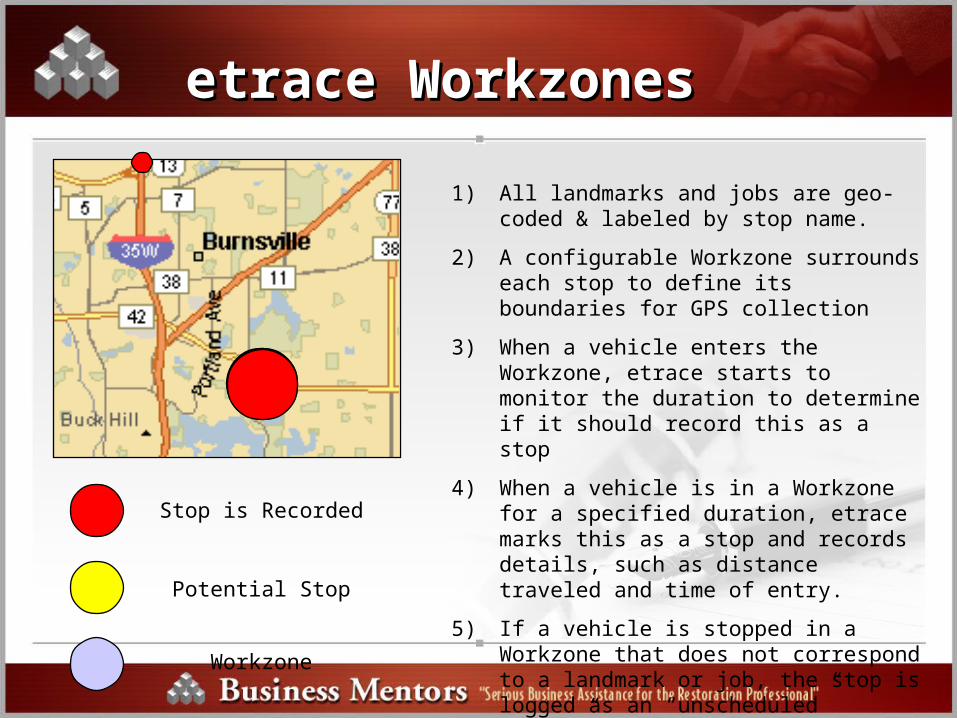
1) All landmarks and jobs are geo-coded & labeled by stop name.
2) A configurable Workzone surrounds each stop to define its boundaries for GPS collection
3) When a vehicle enters the Workzone, etrace starts to monitor the duration to determine if it should record this as a stop
4) When a vehicle is in a Workzone for a specified duration, etrace marks this as a stop and records details, such as distance traveled and time of entry.
5) If a vehicle is stopped in a Workzone that does not correspond to a landmark or job, the stop is logged as an “unscheduled” stop..”
Stop is Recorded
Potential Stop
Workzone
etrace Workzonesetrace Workzones

Worker Map Display of Exception Time

SummarySummary
• Ability to transform the mobile workforce for the field service industry.
• Eliminate manual processes increasing accuracy and costs.
• Increase customer response times • Decrease mileage and overtime
costs • Leverage your IT and backend
system investment• Fast return on investment
