improving pavement sustainability through integrated
TRANSCRIPT

Improving pavement sustainability through integrated design, construction, management,
LCA and LCCA
John HarveyUniversity of California Pavement Research Center
City and County Pavement Improvement Center
UC Davis
Kent Lecture28 September 2020
Outline
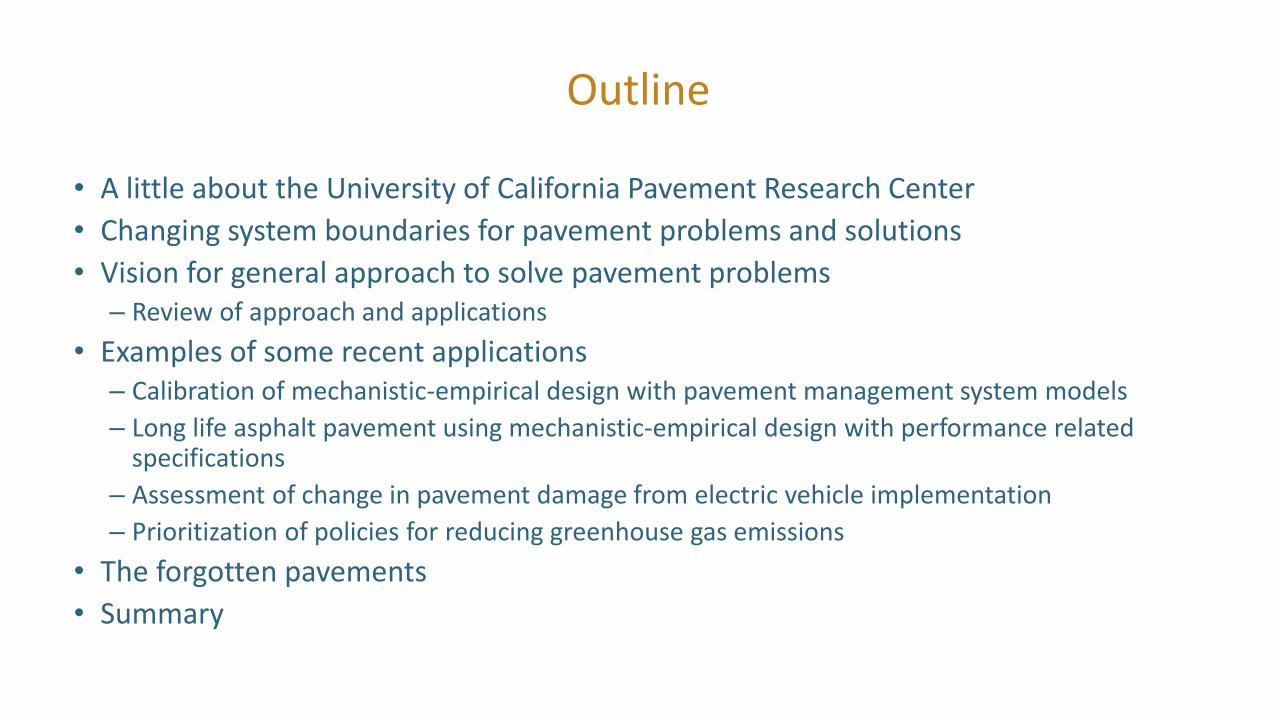
• A little about the University of California Pavement Research Center
• Changing system boundaries for pavement problems and solutions
• Vision for general approach to solve pavement problems– Review of approach and applications
• Examples of some recent applications– Calibration of mechanistic-empirical design with pavement management system models
– Long life asphalt pavement using mechanistic-empirical design with performance related specifications
– Assessment of change in pavement damage from electric vehicle implementation
– Prioritization of policies for reducing greenhouse gas emissions
• The forgotten pavements
• Summary

Who and What is the University of California Pavement Research Center?
• Mission– Research, development and implementation of economically and environmentally sustainable,
equitably distributed, multi-functional pavement systems
• Who we are – 2 campuses (Davis, Berkeley), materials laboratories, 2 Heavy Vehicle Simulators
– 8 Professional Researchers
– 8 Research and development engineers
– 13 graduate students
– 6 Technical and admin support staff
– Partner research organizations
• 3 to 5-year contracts with Caltrans since 1995– Full arc: conceptual studies, basic research, development, support and evaluation of
implementation, continuous improvement
– Partnered Pavement Research Center

Some Current and Recent UCPRC Areas of Work
• Caltrans (90% of our work) and other work
– Pavement management
– Life Cycle Cost Analysis (LCCA)
– Mechanistic-Empirical design methods
• Long life rehabilitation, concrete and asphalt
– Environmental Life Cycle Assessment (LCA)
– New materials
– Performance related specifications and construction quality
– Rehabilitation construction productivity and work zone traffic
– Recycling (asphalt, concrete, asphalt rubber, in-place recycling)
• Existing pavement materials, other waste, forest and agriculture biomass feedstocks
– Multi-functional pavement and quality of life
• Permeable for stormwater quality, flood control
• Pavement for thermal conditions (heat island, human thermal comfort) and noise
• Other partners
– FHWA, Calrecycle, National Center for Sustainable Transportation, FAA, Air Resources Board, state and national pavement industries, legislature, agencies, universities, NGOs

Changing System Boundaries for Pavement Thinking over Last 80 Years
Materials
Pavement
SustainableTransportationInfrastructure
System
Transportation Facility Network
Pavement Network
Resilient Transportation Infrastructure System
Multi-functional Pavement

Period Start Infrastructure Focus Research Implementation Examples
1948-1985 Deployment Materials, empirical and then
mechanistic-empirical structural design
AASHTO design methods (1965-1993)
1960s-
ongoing
Deployment,
rehabilitation
Integration of materials, mechanics,
performance
Shell, Asphalt Institute PCA methods (1970-80s), MEPDG (2006), CalME
(aimed at rehabilitation 2010)
1975-ongoing Network asset
management
Condition assessment, resource
allocation, scheduling of M&R
Pavement management system (California 1978), automated condition
assessment 2000-2010
1978-ongoing Materials recycling,
use of alternative
materials
Materials properties and energy
considerations
Use of Reclaimed Asphalt Pavement (RAP), tire rubber recycling,
supplementary cementitious materials (SCM)
1995-ongoing Reconstruction under
traffic
Integration of traffic handling,
construction productivity, fast materials,
materials handling, demand reduction
Northridge earthquake (1994), southern California freeways (2000s), Utah
Olympics (2002), Chicago Tollways (2010s)
1970s on Life cycle cost
efficiency
Application of economics to pavement
type selection (Life Cycle Cost Analysis)
RealCost (1998)
1995 -
ongoing
Global warming,
environmental
sustainability
Life Cycle Assessment for pavement,
urban metabolism
Palate (1998), Tollway LCA tool (LCA and LCCA, 2017), eLCAP (2020), FHWA
tool (2020), CA requirement for CAPs (2010)
2000 -
ongoing
Climate resilience Climate resilience of pavement systems
(continuing, events)
Florida Energy and Climate Change Action Plan (2007), Infrastructure and
Climate Network (2012)
2000 -
ongoing
Multi-functional
pavement
Permeable pavement, pavement for
active transportation, stormwater quality,
flood control, thermal comfort
NRMCA, NAPA, ICPI design guides (2010s), Caltrans permeable pavement
design method for heavy vehicles (2016), ASCE standards (2018)

UCPRC Vision Document 2000
• Why written? After 15 years as a pavement researcher, and 5 years working with Caltrans, awareness that large important changes were needed in the Pavement Enterprise
– History of repeated failures in getting to widespread implementation
– Outside systems were going to require additional changes
• Prepared in response to question from graduating doctoral student:
– “you talk about a lot of stuff, but I don’t see how it all fits together, why don’t you write it down?”
• Plan to try and notrepeat mistakes of the past
– Path forward to getresearch into practice
– Create a system for continuousimprovement
• Google: ucprc vision document
– http://www.ucprc.ucdavis.edu/PDF/UCPRC-RR-2000-10.pdf

UCPRC Vision Document 2000Observations
• Observations regarding the problem to be solved
– Decision-making was not driven by data
– Data were not collected, or were not organized and made available by the data owners
– Tools to use the data were not available
– Use of data was not integrated through the project delivery process of planning, design and life cycle cost analysis, construction and traffic management, asset management, and environmental assessment
– Potential users were not trained in fundamentals to be able to use the tools
– Researchers were not participating in development and implementation of data and tools, and technology transfer
• Observations regarding how to successfully move from concept to implementation
– Policy makers, managers, and industry as well as “front line” staff needed to be trained at appropriate levels of detail
– Support for implementation must be continuous for 5 to 15 years to complete the arc of implementation
– Due to high turnover and changing responsibilities must communicate in a few minutes the research/development/implementation arc and where we are on it

Proposed Solution and Advice Received
• Proposed solution in the Vision Document 2000– A strategy and tactics for development of integrated Databases and Tools will need to be developed so
that they are compatible with each other, and so that they can be upgraded periodically without losing their ability to interact.
– Requires integration of software, specifications, work-flow processes, information flow, equipment and methods
• Advice– Jon Epps (successful academic implementer of research):
• To be successful in moving from conceptual ideas to successful implementation for every $10 you have, spend $1 on research, $3 on development and $6 on implementation
– Larry Orcutt (when Director of Caltrans Research):
• This is more of an IT problem than a pavement problem, and state government is littered with IT failures because people with technical domain knowledge were in charge
• You must understand how to solve an IT problem to successfully implement your research; data ownership is distributed within the organization https://www.politico.com/states/california/story/2020/08/22/california-is-the-worlds-tech-capital-
but-state-computers-are-failing-residents-1309732

Questions Researchers Don’t Like to Answer
• Researchers and champions must concisely answer these questions to middle and then upper management to move implementation forward:
– Is this a solution for an agency problem, or a researcher’s solution looking for a problem to solve?
– How much will it save Caltrans? • Explain it on a life cycle basis
– Quantify how much will this improve the environment (especially GHG)?
– What is your confidence level that this will work?
– Where are we in the process towards implementation?
– What are the risks of implementation and how will they be addressed?

Need strong
foundation
to perform
desired
operations
Data
Truck Traffic Loading
Construction quality
Construction date, traffic opening, cost
Climate data
Analytics
Information Technology and Pavement
• Pavement tools need updated data and models, make them web-based, and connected to each other, using same data– PMS
– ME design systems
– LCCA
– LCA
• Update informationroutinely
• Databases first, softwareafter data
Pavement Management System example

Information Technology and Pavement• Life Cycle
Assessment example
• Common background data definitions currently being developed by federal agency consortium
• Local example of full pyramid:
– Chicago Tollway LCA

Integration of Data Definitions in Caltrans Pavement Tools
• Tools
– Pavement asset management tool
– Materials testing methods
– Construction materials performance related specifications
– Pavement design tools
• Asphalt (Pavement ME)
• Concrete (CalME)
– Project life cycle cost analysis tool
– Project environmental life cycle assessment tool
• Data definitions
– Materials names and definitions
– Treatment names and definitions
– Mechanistic properties of materials
– Pavement distress definitions
– Truck type definitions
– Traffic data definitions
– Pavement failure definitions (distresses and smoothness) and M&R treatment trigger levels
– Location reference system

Integration of Models in Caltrans Pavement Tools
• Tools
– Pavement asset management tool
– Materials testing methods
– Construction materials performance related specifications
– Pavement design tools
• Asphalt (Pavement ME)
• Concrete (CalME)
– Project life cycle cost analysis tool
– Project environmental life cycle assessment tool
• Models
– Empirical performance models (distress and IRI, not pavement condition index)
– Traffic and truck growth models
– Mechanistic-empirical damage models
– Mechanistic-empirical distress models
– Mechanistic-empirical design reliability approach
– Cost models
– Life cycle environmental impact models

Note different data owners
Used to communicate with upper management and different data owners

Research arc in detailed road maps for each subject area

ME Simulation Process
strainstress
Climate Materials & structure Traffic
Pavement responses
Time, traffic
Dam
age
Predict distresses
Damage accumulation
Damage with time
Dis
tre
ss
Simulated simultaneously for each distressAdapted from Imad Basheer, Caltrans

• Incremental-recursive
– Characterize material damage process for different strain/stress levels
– Simulate damage process in each time increment of entire life
• Update stiffness after each increment
– Correlation of damage to distress
– Calibrate using data from entire damage process, not just the final “end point” of failure
– Calibrate:
1. Responses are calculated correctly through entire life considering damage process
2. Damage from responses with distresses
– Responses and damage initially calibrated using Heavy Vehicle Simulator sections
– Damage vs cracking and rutting distresses calibrated using Westrack and other tracks
CalME is an Incremental-Recursive Simulation Program

Goals of ME Calibration
• Data based design:
– Simulations that match Caltrans pavement performance
– Simulate the “truth” of pavement performance as best possible
• Data based reliability:
– Probability that pavement won’t fail before intended service life
– Reliability based on observed variability on Caltrans network
– Account for measured variability on the Caltrans network with appropriate reliability

Within project variability
• Calibrate CalME to match cracking within projects for same pavement structure, traffic, climate
• Within Projects Variability used with Monte Carlo Simulation to provide 95% Within Projects Reliability
Within project variability = for a given contractor and material, the variability of the materials production and construction process within the project
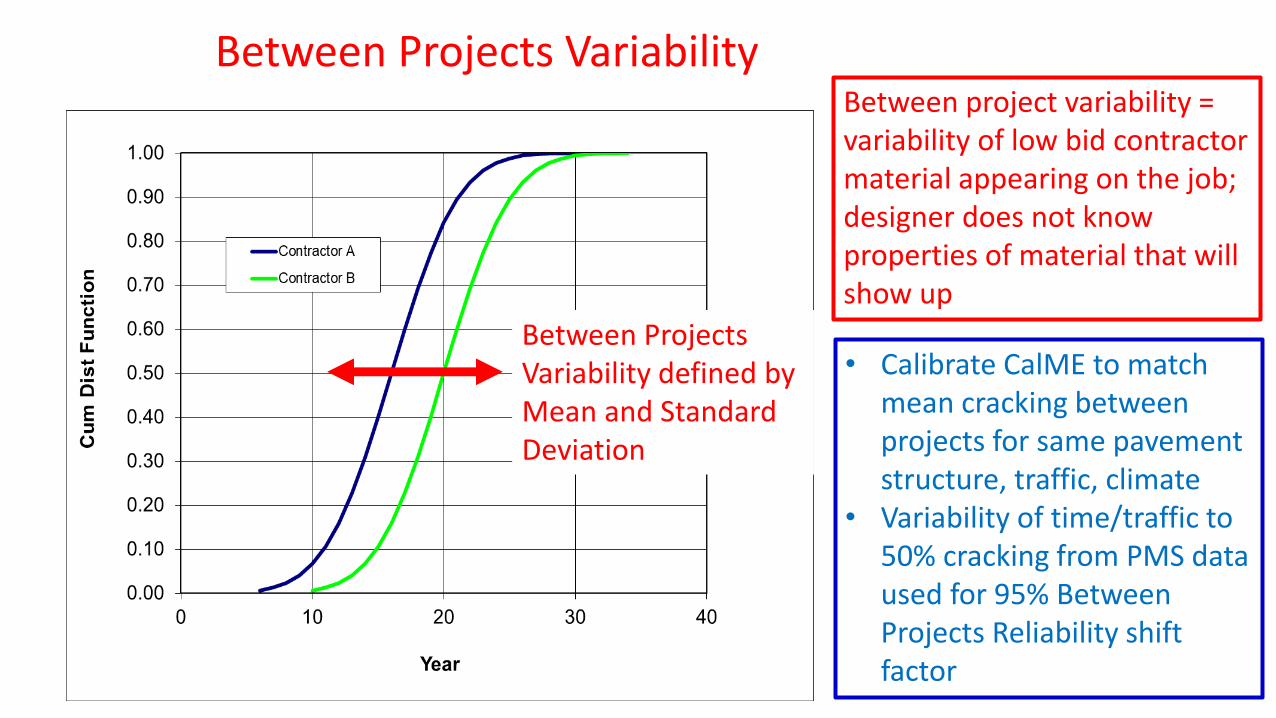
Between Projects Variability
• Calibrate CalME to match mean cracking between projects for same pavement structure, traffic, climate
• Variability of time/traffic to 50% cracking from PMS data used for 95% Between Projects Reliability shift factor
Between Projects Variability defined by Mean and Standard Deviation
Between project variability = variability of low bid contractor material appearing on the job; designer does not know properties of material that will show up

CalME v3 Calibration of Damage to Distress Transfer Functionswith PMS Condition Survey Data
• Conventional approach to ME design calibration– Materials properties sampled on selected test sections, damage simulated for those sections, damage
to distress transfer functions calibrated using PMS data for those sections
– Typically uses about 50 to 200 miles of pavement for calibration
• CalME v3 calibration approach– Entire network in Caltrans complete pavement condition survey database since 1978 used for
calibration
– Calibrated for factors that low-bid project designer knows:• Traffic
• Climate
• Thicknesses
• Material types
– Used state-wide median values for factors that low-bid designer doesn’t know:• ME material properties (stiffness, damage function) for material type
• Within project variability of thicknesses, stiffnesses, damage functions
– Same approach and reliability method used for calibration of Pavement ME concrete design method

Pavement management system performance data used for
CalME v3 calibration
• Time periods for calibration PMS data:
– 1978-2000 about 1/3 of observations
– 2000-2018 about 2/3 of observations
• Used typical materials for these periods for calibration:
– Hveem mix designs
– Pre- and post-QC/QA air-voids
– From UCPRC materials library
Pavement Type Observations Lane-miles
New asphalt pavement: aggregate base
8,5301,021
New asphalt pavement: other base types
3,292 403
Asphalt overlays on asphalt
147,837 19,634
Asphalt overlays on concrete
9,331 1,594

Caltrans PMS fatigue cracking data for HMA thickness, TI traffic, base type, HMA typeAlso considered climate region

Within Project HMA Layer Thickness Variability Check
• Pavement thicknesses from iGPR tool
– 14 different projects from 2000 to 2010
– 33 miles total length
• Conclusion:
– Within project variability values in v2 for use in Monte Carlo are reasonable
Average (mm) Std CoV (%) Thickness (mm) Comments Material Average (mm) Std CoV (%) Thickness (mm) Comments
CAL-4-E-33939-37433(2009) 2.2 198.6 22.7 11.4 152.4 - - - - - - -
CAL-26-E-42530-44344(2005) 1.1 141.5 30.8 21.8 152.4 - - - - - - -
KER-166-E-26443-27014(2010) 1.9 246.0 25.7 10.4 225.6 - AB 301.3 127.1 42.2 466.3 AB-Class 2
ORA-55-N-20271-20839(2002) 0.3 366.3 12.3 3.3 374.9 (HMA+ATPB) CTB 84.1 9.5 11.4 149.4 AB-Class 2
ORA-55-N-20839-21317(2002) 0.3 394.3 27.7 7.0 374.9 (HMA+ATPB) AB 175.2 23.5 13.4 149.4 AB-Class 2
SCL-87-S-2169-6911(2007) 2.5 221.5 20.7 9.4 240.8 (HMA+ATPB) CTB 186.7 15.5 8.3 137.2 CTB-Class A
SCL-680-S-14162-15884(2010) 1.1 235.6 32.9 13.9 289.6 (HMA+HMA) CTB 105.3 15.2 14.5 152.4 LTB
SHA-44-E-29010-33326(2007) 2.7 155.5 16.5 10.6 149.4 - AB 329.0 45.9 13.9 329.2 AB-Class 2
SHA-44-E-43410-45992(2005) 1.6 176.6 27.0 15.3 155.4 - AB 364.0 39.4 10.8 353.6 AB-Class 2
SHA-89-N-47160-69757(2008) 14.2 136.4 13.3 9.8 152.4 - AB 187.3 60.5 32.3 213.4 AB-Class 2
SON-12-W-32510-32768(2004) 0.2 170.3 14.9 8.7 249.9 - CTB 181.6 18.4 10.1 106.7 AS-Class 4
SON-12-W-35343-36067(2010) 0.5 178.5 12.5 7.0 487.7 - CTB 238.0 18.1 7.6 256.0 AS-Class 3
TRI-299-E-76589-78230(2003) 1.6 223.1 40.8 18.3 179.8 - - - - - - -
TUO-108-E-33648-38233(2007) 2.9 175.2 16.9 9.6 228.6 (HMA+ATPB) - - - - - -
Total length (mi) 33.0 10.1 12.4
Project
Median CoV (%) Median CoV (%)
Base Layer ThicknessProject ID Length (mi)
HMA Thickness Project

Within Project HMA Layer Variability Checks
• Similar checks for HMA Stiffness and Damage parameter variability performed using data from UCPRC Materials
– 35 mixes, including HMA and RHMA-G
• Conclusion:
– Values in CalME v2 reasonable
– Some small changes
Mix FMFC FMLC LMLC FMPC Total
RHMA-G 3 4 6 1 14
HMA 6 5 10 0 21
3.30.01-SB154-FMFC
3.30.01-SB154-FMPC
4.50-RAC-4.58RHMA
4.50-RAC-GR
4.50-RAC-SYAR
4.50-RAC-SB154
4.63-MER33-FMLC
4.63-INY395-FMLC
4.63-Lak20-FMLC
3.38-BUT162-FMFC
3.38-BUT162Y0-FMLC
CR-GG-Control
CR-GG-GRN10
IMP111-Y0-FMFC
3.30.01-FMFC-Y0-L2-SD76
3.32.02-FMFCb-Y0-NAPA29
3.30.01-SB154-FMLC-A
3.30.01-SB154-FMLC-B
3.30.01-SB154-LMLC-A
3.30.01-SB154-LMLC-B
3.30.01-SBd138-FMFC
3.32.02-FMFCa-Y0-NAPA29
3.32.02-FMFCy0L2-GLE5
3.33-TEH5-15%RAP-Y4
3.33-TEH5-SB-Y4-RB
3.41Aging-Napa290H-FMLC
4.61-MixA
4.61-MixD
4.61-MixJ
3.38-BUT162Y0-FMFC
CR-DG-Control
CR-DG-GRN15
CR-DG-GRN25
CR-DG-HWY15
CR-DG-HWY25

Long life asphalt pavement mechanistic-empirical design with performance related specifications
• Pavement design goals:– 40-year design life for all structural layers
– Periodic replacement of thin surface layer
• Integration of materials properties, design, construction quality assurance– Material properties from locally available materials are tested
– Results are used to • Set performance related specifications (PRS) for use in procurement
• Set surrogate test properties for construction quality assurance
– Pavement is designed using CalME with the same properties (stiffness, fatigue, permanent deformation) used for the design
– Winning low-bid contractor must prove that their job mix formula (JMF) will have the same properties
– Surrogate tests (faster, cheaper, simpler than PRS tests) used during construction to identify whether mix has changed

AC Long Life Structural Design
• Surface Layer
– Polymer modified
– 15% RAP max
– 6% AV max in place
• Intermediate Layer
– Max 25% RAP
– 6% AV max in place
• Rich Bottom Layer
– +X% Binder
– Max 15% RAP
– 3% AV in place max
Rut and Top-Down Crack Resistant Surface Layer
Stiff, Fatigue Resistant Rich Bottom
Stiff Intermediate LayerRut, crack resistant
Projects to date:I-710 Long Beach (2002)I-5 Red Bluff (2011)I-5 Weed (2011)I-80 Solano (2013)I-5 Sacramento (2020)

Performance Related Tests for Job Mix Formula
• Fatigue/Stiffness (for JMF approval only)– T 321, - Beam Flexural Fatigue test
• Permanent Deformation (New)– T 378, “Flow number test” using AMPT (asphalt mixture
performance tester)
– Using repetitions to permanent axial strain because Flow Number can be hard to pinpoint for California mixes
• Fracture Energy Potential (New)– TP 124, semi-circular beam (SCB) fracture test
• Moisture Sensitivity– T 324 Hamburg wheel tracking test (HWTT)
– T 283 Tensile strength ratio (TSR)

Setting of Baseline Performance Requirements – Flexural Fatigue Life Example
• 95% confidence intervals determined from baseline mix tests
• Contractor average result needs to meet 5% confidence interval
• Intent: take most of testing risk off contractor
• 2-3 weeks to complete specimen preparation and testing
• Most standard volumetric mix design specifications waived to allow innovation

Performance Requirements JMF for Sac-5HMA-LL Performance Requirements
Design parametersTest
methodSample Air
Voids
RequirementHMA-LL, Surface
HMA- LL, Intermediate
HMA-LL, Rich Bottom
Permanent deformation: 1,2
Minimum number of cycles to 3% permanent axial strain
AASHTO T 3783
Mix specific4 2,093 4,131
Not Required
Beam stiffness (psi): 2,5
Minimum stiffness at the 50th
cycle at the given testing strain level
AASHTO T 321
Modified3
Mix specific4
214,000 at
952×10-6
in./in.
789,000 at
446×10-6
in./in.
756,000 at
441×10-6
in./in.
Beam fatigue: 2,5
Minimum of 1,000,000 cycles to failure at this strain
Minimum of 250,000 cycles to failure at this strain
AASHTO T 321
Modified3
Mix specific4
617×10-6
in./in.
952×10-6
in./in.
299×10-6
in./in.
446×10-6
in./in.
306×10-6
in./in.
441×10-6
in./in.

Mix Design Guidance for Contractorshow to meet PRS
Rolling wheel compaction; Contractors built molds at plant
• Mix Design Guidance for Use with Asphalt Concrete Performance-Related Specifications
• http://www.ucprc.ucdavis.edu/PDF/UCPRC-RR-2017-12.pdf
• Example mix design and guidance on how to improve meet PRS
–Gradation
–Aggregate texture
–Binder content
–Binder grade
–Binder supplier

Estimated Potential Pavement-Related Reductions to 2016 California GHG Emissions
http://www.arb.ca.gov/cc/inventory/data/data.htm
PossiblePavement Reductions
MMT/year
Rolling resist to optimum 1.5 to 3.0
Reduce cement use 50% 0.2Reduce virgin asphalt use
50% 0.7
Reduce hauling demolition, oil, stone haul 10% 0.6
TOTAL 3.0 to 4.5
0.7 to 1.0 % of 429 MMT state total1.0 to 3.6 % of 126 MMT transportation total

Assessment of change in pavement damage from electric vehicle implementation
• Study for the legislature to evaluate expected effects of conversion to alternative fuel trucks 2020-2050
• Question:– How much additional pavement cost and GHG
emissions will heavier than ICE powertrains on alternative fuel trucks cause if axle load limits increase 0.1 tons?
– How much is net +/– in GHG emissions?
• Scenarios:– Fast, medium, slow conversion to electric and fuel– State and local networks– Combined ME simulation of asphalt and concrete, cost
analysis, life cycle assessment
• BTW California also has the worst air pollution in the country (even when we are not on fire), highest levels of asthmatic children

Results (under review)
• Introducing heavier alternative fuel trucks, as allowed by AB 2061, is expected to result in only minimal additional damage to local- and state-government-owned pavements
• The cost of additional pavement damage from alternative fuel trucks will be negligible– The estimated annual cost increase for pavement damage is
between zero and $21 million for the state highway network, and between zero and $33 million for the local roads network
• Projected greenhouse gas emissions reductions from alternative fuel truck adoption will far outweigh emissions from additional road maintenance– Study’s least aggressive market penetration scenario yielded a
net reduction in life-cycle, or well-to-wheel, annual truck emissions of about 6.3 million tons by 2050
– Most aggressive scenario yielded a net annual reduction of 34 million tons—nearly 20 percent of California’s entire transportation sector emissions in 2016
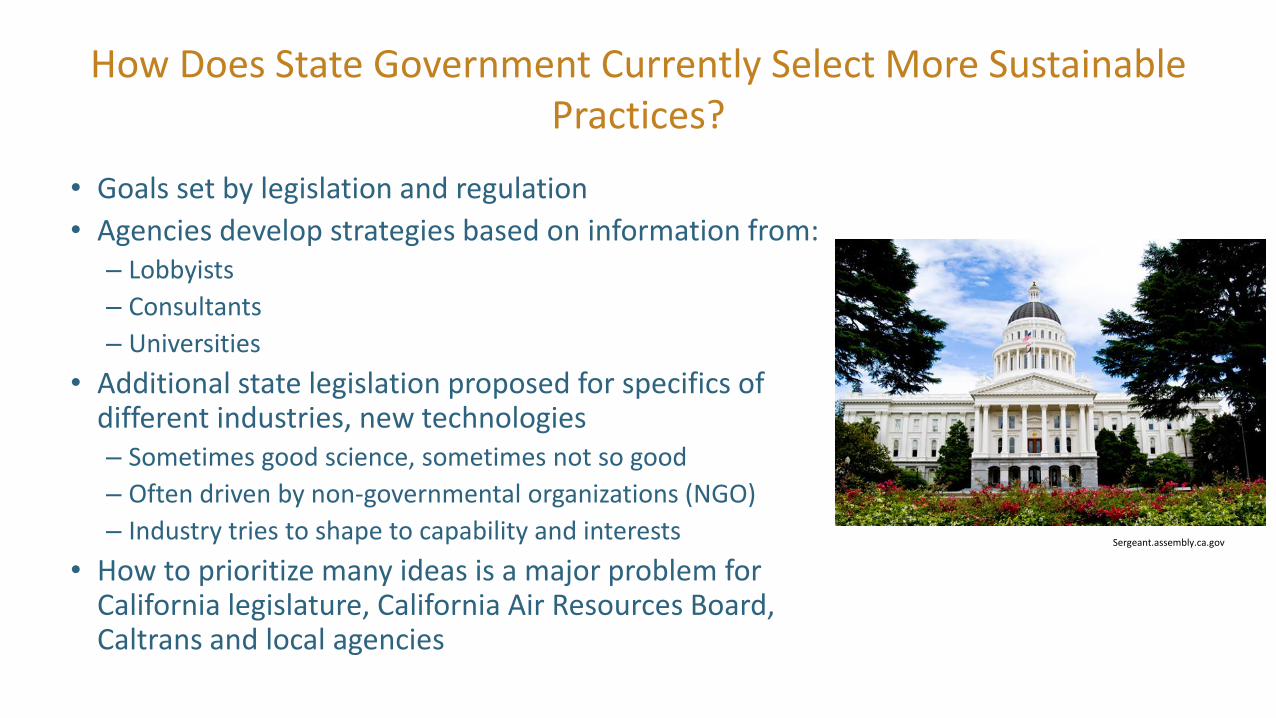
How Does State Government Currently Select More Sustainable Practices?
• Goals set by legislation and regulation
• Agencies develop strategies based on information from:– Lobbyists
– Consultants
– Universities
• Additional state legislation proposed for specifics of different industries, new technologies– Sometimes good science, sometimes not so good
– Often driven by non-governmental organizations (NGO)
– Industry tries to shape to capability and interests
• How to prioritize many ideas is a major problem for California legislature, California Air Resources Board, Caltrans and local agencies
Sergeant.assembly.ca.gov

• Need first-order analysis to prioritize which ideas to further investigate
• “Supply curve”
• Pilot projects at UCPRC, NCST– Caltrans changes to internal
operations
– Local government review of climate action plans

Example Supply Curve Output
-1,000
-800
-600
-400
-200
0
200
400
600
Co
st E
ffec
tive
nes
s ($
/to
nn
e o
f G
HG
em
issi
on
red
uct
ion
)Cumulative GHG Emission Reduction (MMT)
*Note: Abatement shown in strategy's corresponding color on x-axis
Strategy 4 - Increased use of reclaimed asphalt pavement (50% RAP,Soy Oil)Strategy 6 - Solar and wind energy production on state right of way(high electricity price)Strategy 3 - Automation of bridge tolling systems (0% EVs)
Strategy 2 - Energy harvesting using piezo-electric technology (highelectricity price)Strategy 1- Pavement roughness and maintenance prioritization
Strategy 5 - Alternative fuel technology for agency vehicle fleet (all atonce)
1.33 2.34 0.44 0.79
13.07 0.14
http://www.ucprc.ucdavis.edu/PDF/UCPRC-WH-2019-01.pdf

The Forgotten 80% of Our Pavements
National $ Spent on Transportation in 2008 (US Census Bureau)

• Governance: League of California Cities, California State Association of Counties
• Training– Classes
– Certificate program
• Best practices
• Tools– Sample specifications
– Software
• Outreach

Takeaways
• Implementation
– Is necessary to obtain benefits of research
–Requires planning and a coordinated strategy
–Requires data and tools that can be readily used, updated, improved
• In pavement, implementation and continuous improvement facilitated by integration of data and tools
• Implementation of integrated data and tools can achieve cost savings, reduce environmental impacts, answer important questions
• Investment in human capital is essential for successful implementation
• Now is the time: the gray tsunami is upon us!
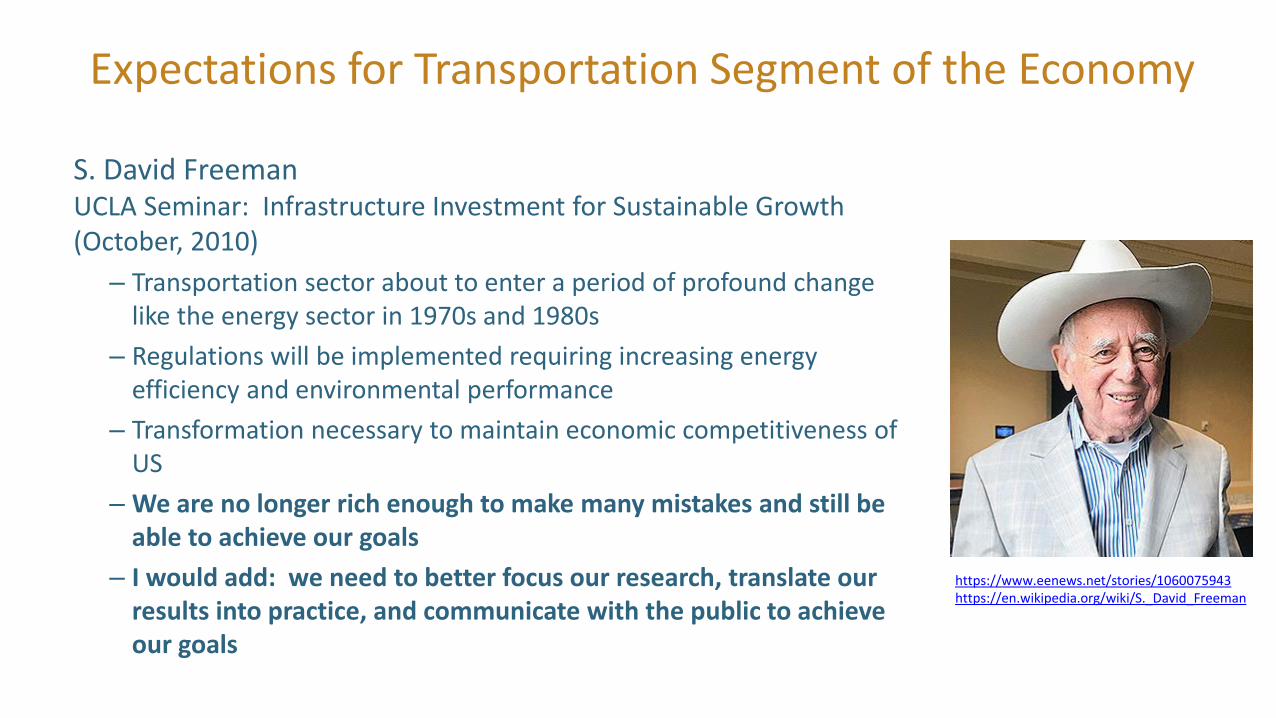
Expectations for Transportation Segment of the Economy
S. David Freeman UCLA Seminar: Infrastructure Investment for Sustainable Growth (October, 2010)
– Transportation sector about to enter a period of profound change like the energy sector in 1970s and 1980s
– Regulations will be implemented requiring increasing energy efficiency and environmental performance
– Transformation necessary to maintain economic competitiveness of US
– We are no longer rich enough to make many mistakes and still be able to achieve our goals
– I would add: we need to better focus our research, translate our results into practice, and communicate with the public to achieve our goals
https://www.eenews.net/stories/1060075943https://en.wikipedia.org/wiki/S._David_Freeman

Thanks to many colleagues
Questions?

How is California doing with regard to GHG emissions?
44
2012 data California Air Resources Board report
CO2-e emissions • per country• per capita
Cal Spain