improving efficiency of water systems: practical … · improving efficiency of water systems:...
TRANSCRIPT

Improving Efficiency of Water Systems: practical examples May 2012
Dr.ir. Slavco VelickovWater Industry Director EMEA

Agenda
1.Bentley at a Glance
2.Water Solutions Overview
3.Trends in the Water Industry
4.Practical Cases:1.Active Leakage Management
2.Lifecycle Asset Management
3.Energy Efficiency Improvement
5.Contact Information & Resources
2 | WWW.BENTLEY.COM

Bentley at a glance
3 | WWW.BENTLEY.COM
Revenues by RegionRevenues by Region

Solutions
Bridges
Oil and Gas
Electric and Gas Utilities
CommunicationsBuildings
Roads
Power Generation
FactoriesCampuses
Cadastre and Land Development
Metals and Mining
Water and Water and
WastewaterWastewater
Rail and Transit
4 | WWW.BENTLEY.COM

The World of Water
5 | WWW.BENTLEY.COM
Rural water systemsUrban water systems
Estuaries and coastal water systems

Water Industry Solutions
sisNET WWater (BentleyWWater)
sisNET WWater (BentleyWWater)
ExpertDesigner
ExpertDesigner
MicroStationMicroStation
GeoSpatial Server & AssetWiseGeoSpatial Server & AssetWise
Interoperability
Connectors
Interoperability
ConnectorsEnterprise
Connectors
Enterprise
Connectors
Web Publishing
Web Publishing
SpatialDocuments
SpatialDatabases
BusinessDocuments
ProprietaryGIS Databases
EnterpriseData Stores
Ancillary Filesw/ RDBWS
sisNET Water
(BentleyWater)
sisNET Water
(BentleyWater) GasAnalysisGasAnalysisHammerHammer StormCAD /
HEC-Pack
StormCAD / HEC-Pack
WebServices
Data FilesData Files
w/ Database Linkages
WaterGEMS/CAD
WaterGEMS/CAD
SewerGEMS / CAD
SewerGEMS / CAD
CivilStorm / PondPack
CivilStorm / PondPack
Industry FrameworkIndustry Framework Modeling FrameworkModeling Framework
AutoCADAutoCAD ArcGISArcGIS
SCADA &Loggers
Modelling products
Webclients
Webclients
GIS products

Water & Wastewater Industry Challenges
• Regulatory Compliance –Adequate Supply & Treatment capacity
–Protecting Water Quality
–Business performance
–Improving efficiency
• Reliability–Consistently achieving target levels of services
–Maintaining aging infrastructure
–Avoiding failure
• Budget–Reducing costs while improving services
–Asset investment planning for aging infrastructure
–Aging workforce
7 | WWW.BENTLEY.COM

The Evolution of Smart Water Networks
8 | WWW.BENTLEY.COM
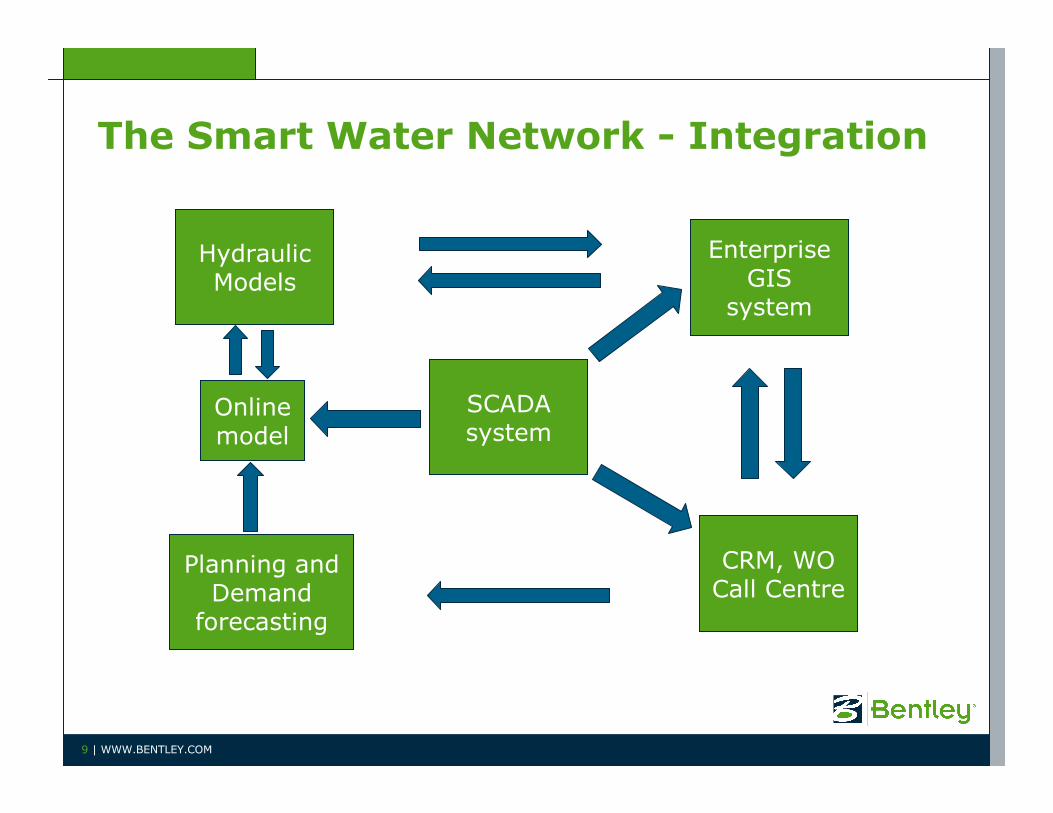
The Smart Water Network - Integration
9 | WWW.BENTLEY.COM
SCADA system
Enterprise GIS
system
CRM, WO Call Centre
Hydraulic Models
Online model
Planning and Demand
forecasting

1) Leakage Reduction Case Studies by pressure management, hydraulic modelling, measured data and optimization techniques
10 | WWW.BENTLEY.COM

A Worldwide Problem: Controlling and Remediating Water Loss Is Complex
• It’s impossible to find and fix all leaks
• Partial implementation of a water loss plan is highly likely to fail
• Coordination between all components of a water loss program is required
11
(Courtesy Dr. Thomas Walski)
“Many practitioners make common
mistakes- they may have the false impression that each time a leak is
repaired, physical loss is reduced by
the volume saved…”Vermersch and Rizzo
Source: IWA’s Water21 Magazine, April 2008
IWA = International Water Association

IWA Standard Water Balance
SystemSystem
InputInput
VolumeVolume
AuthorizedAuthorized
ConsumptionConsumption
RevenueRevenueWaterWater
NonNon
Revenue Revenue
WaterWater
BilledBilledAuthorizedAuthorized
ConsumptionConsumption
UnbilledUnbilledAuthorizedAuthorized
ConsumptionConsumption
ApparentApparentLossesLosses
RealRealLossesLosses
WaterWater
LossesLosses
Billed Metered ConsumptionBilled Metered Consumption
Unbilled Unmetered ConsumptionUnbilled Unmetered Consumption
Unauthorized ConsumptionUnauthorized Consumption
Customer Meter InaccuraciesCustomer Meter Inaccuracies
Leakage on Transmission &Leakage on Transmission &Distribution MainsDistribution Mains
Billed Unmetered ConsumptionBilled Unmetered Consumption
Unbilled Metered ConsumptionUnbilled Metered Consumption
Leakage on Service ConnectionsLeakage on Service Connectionsup to metering pointup to metering point
Leakage and Overflows at Leakage and Overflows at Reservoirs Reservoirs
12 | WWW.BENTLEY.COM

Leakage Types
• Background leakage
– Small flow rates, run continuously but not economically recoverable
• Reported leaks and bursts
– High flow, reported by customers and get fixed quickly
• Unreported leaks and bursts
– Medium flow rates, longest duration and only located by active leakage detection
13 | WWW.BENTLEY.COM

Strategy: A Long-term Approach with Immediate [short-term] Benefits
Implement IWA best / good practices
14
Current AnnualReal Loss Volume
Economic Level Real Loss
UnavoidableReal Loss
Replacing pipes with least impact on
customers
Speed and Qualityof Repairs
Detecting and fixing leaksReplacing/installing meters (DMAs)
ActiveLeakage Control
Pressure
Management
Risk-based asset management for maximum return In
frastructure
Management
Source: The “4 Component” diagram promoted by IWA’s Water Losses Task Force

Current Practice1. Assessment
– water balance or water auditing based upon water infrastructures’ physical data and some statistics
2. Pressure Management– Divide the network in Pressure
Zones and DMAs
– Use hydraulic model for PRVs
– Install PRVs to manage MNF
3. Active Leakage Detection– Sounding for leaks
– Step-testing, smart balls
– Acoustic loggers (noise correlators)
– Smart balls
– Use hydraulic model and measured (Scada) data
15 | WWW.BENTLEY.COM

Pressure Management (Case Study in Cyprus)
16 | WWW.BENTLEY.COM

17
Water Board of LemesosLemesos
� Established in 1951� Semi-government, non-profit organisation
� Area served : 100 km2
� Number of employees : 110
� Supply of potable water
� Population Served : 170 000� Annual water needs : 14 million m3
� Number of consumers : 78 000� Length of pipework : 850 km

18
Pressure range:
� Between 20m and 40m
� Minimum of 15 m if conditions allowed
Pressure control achieved through:
� Pressure reducing valves
� Pressure regulating valves
Types of pressure control:
� Fixed outlet
� Two point control (Time or Flow)
� Flow / Time modulation
� Critical point control
Pressure Management Considerations

19
� Reduce the flow rates (MNF) of all leaks � Reduce surges and excess pressures� Reduce burst rates and background leakage, cut repair costs� Reduce some components of consumption� Effects of change can be hydraulically modelled and predicted
Pressure reducing valve(downstream pressure control, open/close capability )
Strainer(meter protection)District meter
(mechanical “Woltman” type)
Pressure sensor(downstream pressure monitoring)
Pressure reducing valve(downstream pressure control, open/close capability )
Pressure reducing valve(downstream pressure control, open/close capability )
Strainer(meter protection)
Strainer(meter protection)District meter
(mechanical “Woltman” type)District meter
(mechanical “Woltman” type)
Pressure sensor(downstream pressure monitoring)
Pressure sensor(downstream pressure monitoring)
Before pressure reduction
After pressure reduction
Reductionin MNF
Before pressure reduction
After pressure reduction
Reductionin MNF
Reductionin MNF
Pressure Management Objectives

20
DMA categoriesSmall : <1000 propertiesMedium : 1000 – 3000 propertiesLarge : 3000 – 5000 properties
Factors considered in DMAs (re)-design � Use Hydraulic Model (WaterCAD)� Minimum variation in ground level� Single entry point into the DMA� Well defined DMA boundaries� Area meters correctly sized and located� Continuous monitoring
DMAs - Pressure Management

21
Possible pressure reduction of about 0,5 bar
DMA 232DMA 232
before pressure reduction
Pressure Reduction (1/3)

22
DMA 232DMA 232
after pressure reduction
Reduction in AZP from 39 m to 32 m resulted in reduction in MNF from 5.2 m3/hr to 4.3 m3/hr
Pressure Reduction (2/3)

23
Before pressure reduction
After pressure reduction
Reductionin MNF
Pressure Reduction (3/3)

24
DMA(Sector 2)
AZNP (m) Actual MNF(m³/hr)
Backgroundlosses(m³/hr)
Locatable losses(m³/hr)
before after before after before after before after
220 64 32 3,92 2,16 0,63 0,24 1,88 0,51
221 63 36 5,69 3,85 3,39 1,65 0,16 0,07
222 54 28 3,07 2,24 1,53 0,71 0,05 0,03
223 53 29 3,58 2,56 1,70 0,82 0,35 0,20
224 53 29 5,50 2,52 1,68 0,82 2,23 0,11
225 64 34 12,96 9,78 5,42 2,41 4,16 3,99
226 64 34 10,04 6,84 5,62 2,55 0,37 0,24
227 59 38 15,52 10,44 5,91 3,38 5,11 2,56
228 43 39 7,60 7,20 3,42 3,03 0,51 0,50
229 41 36 4,06 3,73 1,13 0,96 2,01 1,85
230 47 40 21,80 18,00 5,57 4,60 9,37 6,54
231 52 42 11,01 7,92 4,63 3,54 2,17 0,18
232 39 32 5,17 4,32 1,32 1,05 2,21 1,63
233 42 33 4,45 3,96 1,48 1,10 1,48 1,37
234 48 38 3,55 2,44 0,32 0,23 2,26 1,24
Total before 117,92 43,75 34,32
Total after 87,96 27,09 21,02
REDUCTION 30 m3/hr(Sector 2) (25%)
Annual water saving = 220 000 m 3
or € 170 000
Minimum Night Flow Summary Results

Leakage Detection using Models and Data
25 | WWW.BENTLEY.COM

Mathematical Optimization Techniques
Search for:
Minimize:
Subject to:
Leakage Nodes:
Where: is the index for leakage node i in group n
is emitter coefficient at leakage node i in group n
is the set of junctions in demand group n
N is the number of demand groups
nL is the total number of leakage nodes
is number of leakage nodes in group n
is the max emitter coefficient for demand group n
nJ
nni KK max0 ≤≤)(XFr
∑=
=N
n
nLKnL1
niK
niLN
nLK
nKmax
nni
ni
ni LKiNnLNKLNX ,...,1;,...,1;);,( ==∈= nJ
r
26 | WWW.BENTLEY.COM

Integrated Framework Leakage Detection & Model Calibration
WaterGEMS (Darwin Calibrator)
27 | WWW.BENTLEY.COM

Case I: system conditions (United Utilities)
• DMA system model
• 12 km pipelines
• 1000 properties
• 5 pressure loggers and one flow meter
28 | WWW.BENTLEY.COM

Case Study I: previously detection
Burst AaA Burst B
aA
KEY
�
DMA Boundary
Leak located<50mDistance
from prediction
150mmMains diam
BURST A
150mDistance from
prediction
8”Mains diam
BURST B
29 | WWW.BENTLEY.COM

Case I: results comparison
Burst A & B
30 | WWW.BENTLEY.COM

60
80
100
120
140
160
180
200
220
240
Apr 01 Apr 15 Apr 29 May 13 May 27 Jun 10 Jun 24
cub.
m/h
r
Raw Measured Value for 08016DM01_02 WALTON SUMMIT (1 Apr 2004 - 1 Jul 2004)
Case I: savings
30m3/hr reduction
Burst A
Burst BSaving > 210,000 Euro / year
31 | WWW.BENTLEY.COM

Case Study I: flow comparison (after)
32 | WWW.BENTLEY.COM

Case II: another DMA
Leakage spots identified with WaterGEMS Leakage Calibrator
Field survey
Actual Leakage
33 | WWW.BENTLEY.COM
15 m3/hr reduction
Savings of 115,000 Euro / year

Important: Check Risk on Transients !
34 | WWW.BENTLEY.COM

Essential Requirements
• Build hydraulic model
• Collect field data (e.g. flows and pressures)
• Prepare and import data
• Calibrate the model and make leakage detection runs
• Analyze results
• Look for consistent predicted leakage hotspots
• Go to the filed: check the identified locations and take a proper acction
35 | WWW.BENTLEY.COM