improving economic backdrop & reasonable valuations...
TRANSCRIPT

Anand Rathi Shares and Stock Brokers Limited (hereinafter “ARSSBL”) is a full service brokerage and equities research firm and the views expressed therein are solely of ARSSBL and not of the companies which have been covered in the Research Report. This report is intended for the sole use of the Recipient and is to be circulated only within India and to no countries outside India. Disclosures and analyst certifications are present in Appendix. Anand Rathi Research India Equities
Dhaval Dama+9122 66266728
Logistics
Sector ReportIndia I Equities
17 January 2013
India Logistics
Improving economic backdrop & reasonable valuations
Indian logistics industry is set to witness robust growth as the economy crosses the threshold of US$1.6trn. Industrial compulsions and customer preferences are slowly forcing systemic acceptance of containerisation & organized logistics. We prefer Gateway Distriparks for its presence across various segments, and Container Corporation of India, the largest container-train operator (CTO) in the country.
Containerisation story to continue in India. Containerized traffic though at a low ~15%, is slowly growing and is likely to gradually level with global average of 80%. Moreover, post the slight decline in trade volumes during 9MFY13, EXIM trade is expected to recover during FY14, which would benefit Indian companies in container freight stations (CFS), multi-modal transport operations (MTO) and CTOs.
Rising thrust on infrastructure brightens prospect. GoI efforts to improve the existing infrastructure facilities to connect major metropolitan cities with the hinterlands would benefit the sector. Indian Railways (IR) is undertaking its most ambitious project, the dedicated freight corridor (DFC), which would traverse 3,300km connecting major cities. It would help CTOs significantly improve operations. Also, under the draft lines of XIIth plan the GoI plans to construct 35,000kms of 2/4 lane highways. We believe this additional thrust on infrastructure would benefit the sector immensely.
Regulatory reforms, new segments to drive growth. GoI plans to introduce the Goods and Services Tax (GST), abolishing several state taxes and leading to centralised warehousing for companies. Recent reforms such as of FDI in retailing would also boost trade in India, leading to more demand for logistical services. New segments like organised warehousing, 3PL, 4PL logistics would also benefit the sector.
Our take. We prefer Gateway Distriparks for its presence across various segments and believe it would be a key beneficiary of improving EXIM trade and FDI in retail. Container Corporation of India (Concor), the largest CTO in the country could be a direct beneficiary of increasing rail freight.
Overweight Sensex: 19818
Nifty: 6002
Key Data RatingCurrent
Price (`) Target Price
(`)M. Cap
(US$ m)FY14 EPS
|(`)EV/Sales
(x)EV/EBIDTA
(x)P/E (x)
PBV (x)
RoAE (%)
RoACE (%)
Container Corporation of India Buy 937 1,132 2,233 75.5 2.0 8.0 12.4 1.8 14.9 15.3
Gateway Distriparks Buy 135 196 275 16.3 1.3 4.5 8.4 1.7 22.1 25.2
Allcargo Logistics Hold 132 159 311 17.7 0.4 3.3 7.4 0.9 14.0 13.1
Source: Company, Anand Rathi Research Note: Prices as on 14 Jan’ 2013

17 January 2013 India Logistics – Improving economic backdrop & reasonable valuations
Anand Rathi Research 2
India Logistics
Improving economic backdrop & reasonable valuations
Containerisation story to continue..................................................................... 3
Rising thrust on infrastructure ........................................................................... 5
Reforms, new segments to aid growth............................................................. 9
Valuation......................................................................................................... 11
Company Section............................................................................................ 12
Container Corporation of India .................................................................13
Gateway Distriparks .................................................................................26
Allcargo Logistics......................................................................................38
Annexure.........................................................................................................50

17 January 2013 India Logistics – Improving economic backdrop & reasonable valuations
Anand Rathi Research 3
Containerisation story to continue
Strong growth in EXIM trade Strong trade growth in India, a favourable investment environment and the country’s position as a key outsourcing hub for MNCs have led to a significant increase in EXIM trade. Over FY00-12, India’s exports have increased from `1.6trn to `14.6trn and imports excl. oil, gold & silver have increased from `1.4trn to `13.1trn at CAGR of 20.2% and 20.5% respectively.
Over the same period, engineering goods, which contributed ~14% to overall exports in FY00, has grown significantly and contributed ~22% in FY12. We believe that, with the pick-up in the global economy, exports of engineering goods could increase again after a slight dip in FY12.
India’s exports to Asia (excl. the Middle East) contribute the highest to export trade and accounted for ~31% of exports during FY12. Europe is the second-highest contributor and exports to the region were ~20% during FY12. With European countries showing signs of improvement in their economies, exports to countries in the region would improve, we believe.
Fig 1 – EXIM trade v/s GDP growth
-5
0
5
10
15
20
25
30
35
FY01
FY02
FY03
FY04
FY05
FY06
FY07
FY08
FY09
FY10
FY11
FY12
GDP growth EXIM growth
(%)
Source: CMIE
Fig 2 – Exports v/s imports
0
3,000
6,000
9,000
12,000
15,000
FY01
FY02
FY03
FY04
FY05
FY06
FY07
FY08
FY09
FY10
FY11
FY12
-10-5051015202530354045
Exports Imports (excl oil, gold & silver)Growth in Exports (RHS) Growth in Imports (RHS)
(`bn) (%)
Source: CMIE
Fig 3 – Product-wise exports
0
25
50
75
100
FY01
FY02
FY03
FY04
FY05
FY06
FY07
FY08
FY09
FY10
FY11
FY12
Agri products Ores & minerals Leather itemsChemicals Engg goods TextilesReadymade garments Others Petroleum productsOther commodities
(%)
Source: CMIE
Fig 4 – Region-wise break-up
0
25
50
75
100
FY01
FY02
FY03
FY04
FY05
FY06
FY07
FY08
FY09
FY10
FY11
FY12
Africa America Asia (excluding Middle East) the Middle East Europe OceaniaOthers
(%)
Source: CMIE

17 January 2013 India Logistics – Improving economic backdrop & reasonable valuations
Anand Rathi Research 4
Over FY00-12 India’s imports (excl. oil and bullion) have increased from `1.4trn to `13.1trn. Its non-POL imports excl. oil & gold accounted for ~52% of imports during FY12. Asia & Europe form major share of imports for India and their share has been improving over the years. Pick-up in Indian economy expected during FY14, we believe, would lead to higher demand for such imported products.
Containerisation on the rise
Significant growth in EXIM over the years has led to an increase in containerised trade. Over FY01-12 container traffic at major ports has increased from 2.47m TEUs to 7.76m at a 10.1% CAGR.
Globally, 80% of cargo is containerised, compared to ~15% in India. Thus, vast scope for containerisation still exists. Given the government’s sharper focus on exports, this is expected to increase. In its Maritime Agenda 2010-20, GoI projected that traffic at major ports is likely to register an 8% CAGR (from 561m tons in FY10 to 1,215m by FY20). At minor ports, traffic would record a 16% CAGR (from 289m tons in FY10 now to 1,270m tons by FY20). India’s trade is expected to pick-up during FY14, which we believe, would lead to an increase in containerised trade in India.
Fig 5 – Product-wise imports
0
25
50
75
100
FY01
FY02
FY03
FY04
FY05
FY06
FY07
FY08
FY09
FY10
FY11
FY12
Food products TextilesChemicals Capital goodsNon-POL items (excl gold & silver) Other commodities
(%)
Source: CMIE
Fig 6 – Region-wise break up
0
25
50
75
100
FY01
FY02
FY03
FY04
FY05
FY06
FY07
FY08
FY09
FY10
FY11
FY12
Africa America Asia (excl. Middle East) the Middle East Europe OceaniaOthers
(%)
Source: CMIE
Fig 7 – Container trade at major ports (000 TEU's) FY01 FY02 FY03 FY04 FY05 FY06 FY07 FY08 FY09 FY10 FY11 FY12
Kolkata Dock System 138 98 106 123 159 203 239 297 302 378 377 412
Haldia Dock Complex 51 93 117 137 128 110 110 128 127 124 149 139
Visakhapatnam 20 22 22 20 45 47 56 71 86 98 145 234
Chennai 352 344 425 539 617 735 886 1,128 1,143 1,216 1,524 1,558
Tuticorin 157 214 213 254 307 321 377 450 439 440 468 477
Cochin 143 152 166 170 185 203 227 254 261 290 312 328
Mumbai 321 254 213 197 219 159 138 118 92 58 72 58
JNPT 1,190 1,573 1,930 2,269 2,371 2,667 3,298 4,060 3,952 4,062 4,270 4,321
Kandla 92 126 157 170 181 148 178 167 138 147 160 166
Total: 2,470 2,884 3,366 3,900 4,233 4,615 5,541 6,712 6,585 6,865 7,539 7,768
Source: Indian Ports Association

17 January 2013 India Logistics – Improving economic backdrop & reasonable valuations
Anand Rathi Research 5
Rising thrust on infrastructure Logistics in India on growth path
The Indian logistics sector has registered vast growth in the past decade, fuelled by consistent growth in the economy and in various sectors such as automobiles, pharmaceuticals, engineering, etc. As per industry estimates during FY12, the logistics sector contributed ~12-13% to GDP. In India, road transport is handled by private operators; rail transport by the Central government. With the second-largest network in the world, roads carry ~60% of freight transport. Road transport is preferred because of its cost effectiveness and flexibility. On the other hand, rail transport is sought for its container facility and ease in transporting containers and wooden crates. (Sea is a complementary mode of transport. Ninety-five per cent of India’s foreign trade is by sea).
Fig 9 – Logistics in India
Indian warehousing industry
Transportation Warehousing Value addedservices
Cold chain3PL, 4PL & 5PLPackeging services
Freight consolidation
Contanier stuffing-de stuffing
LCL consolidation (NVOCC)
Freight forwarding
Customs clearance
GodownsICD’sFTWZ’s
Logistic packs
CFS
Shipyards
Air cargo centres
Express cargoHub
RoadRailWater
Air
Source: Industry
Road transportation needs to improve
Road transportation in India is highly fragmented and largely un-organized – a large number of independent operators with regional or national permits carry freight by road. Often they have a small fleet size - one or two single-axle trucks. This segment carries a large percent of the national load and almost the entire regional load.
Fig 10 – Fleet size in India
Medium fleet operator
(6-20 trucks)15%
Small fleet operator
(1-5 trucks)75%
Large fleet operator
(>20 trucks)10%
Source: Industry
Fig 8 – % of transportation by modes
Road60%
Rail32%
Others8%
Source: Industry

17 January 2013 India Logistics – Improving economic backdrop & reasonable valuations
Anand Rathi Research 6
India has the second-largest road network in the world covering 4.24m km. Its road density is one of the highest in the world -- 1.29 km of roads per sq. km. India’s national highways and expressways, however, constitute only 1.67% of its road length but carry 40% of its road traffic. The percentage of paved roads is only 49.3%, lagging behind both the U.S. and China. Industry sources say India has a meagre 600-700 km of access-controlled expressways compared to 74,000 km of expressways in China. While India’s road freight volumes are rising at a 9.08% CAGR and the number of vehicles (all types) is increasing at a 10.76% CAGR, road length is increasing at only a 4.01% CAGR, indicating the paucity of, and dire need for, roads.
Fig 11 – Road lengths and densities for the U.S., India, China and Brazil Country Road length (m km) Road density (km/sq. km) Year
U.S. 6.5 0.68 2009
India 4.24 1.29 2010
China 3.7 0.39 2008
Brazil 1.75 0.21 2004
Source: World Bank (http://www.worldbank.org), Ministry of Road Transport and Highways, GOI (http://www.morth.nic.in), Bureau of Transportation Statistics, Govt. of U.S. (http://www.bts.gov)
Indian roads can broadly be broken down into four groups: National highways/expressways, state highways, major district roads and rural roads. While national highways and expressways connect important cities and towns of different states across the country, state highways and major district roads connect cities, towns and rural roads within a state with the national highway network.
Fig 12 – Lengths and percentages of different categories of highways/roads Category of highway/road Length (km) % of total road network
National highways/Expressways 70,934 1.67
State highways 154,522 3.65
Major district roads 2,577,396 60.84
Rural roads 1,433,577 33.84
Source: Source: Ministry of Road Transport and Highways, GOI (http://www.morth.nic.in)
Of the 70,934 km of national highways/expressways, 17,752 km (25%) are single/intermediate lanes, 36,995 km (52%) double lanes and 16,187 km (23%) four/six/eight lanes. The shortage of multi-lane highways, coupled with poor road conditions and stoppages and delays, causes congestions, accidents, break-downs and high maintenance costs of roads and vehicles.
A vehicle on Indian roads can clock an average speed of only 20-25 km an hour, covering 250-400 km in a day. In developed countries, a vehicle can cover 700-800 km in a day. Vehicles in India cover only 80,000-100,000 km in a year; in the U.S., vehicles cover up to 400,000 km in a year.
Considering this, it is important for the government to invest heavily in extending, widening and upgrading the highway network, build more quality arterial roads, implement access-control mechanisms and allocate adequate funds for road maintenance. The government should expedite the introduction of the GST across all states. This would significantly reduce paperwork and delays at check-posts.
Rail transport – awaiting the big leap through DFC
The rail network in India traverses the length and breadth of the country, covering 64,015 km (39,777 miles). It is the largest rail network in Asia and the fourth in the world, next to the USA, Russia and Canada. Till 2006, cargo transportation by rail was dominated by Concor. In order to develop

17 January 2013 India Logistics – Improving economic backdrop & reasonable valuations
Anand Rathi Research 7
infrastructure and generate more competition, the government allotted rail licenses to 15 private operators in 2006. They signed concession agreements with IR to run container trains for 20 years, extendable by another 10.
Steady growth in rail freight
Rail transportation in India currently handles ~22% of container trade, lower than other developed nations. Over FY07-12 volumes carried by the Indian Railways have registered a 13.6% CAGR to 38.4m tons. In the same period EXIM volumes at major ports have increased from 73.4m tons in FY07 to 120.2m tons in FY12. We believe that rail freight is less expensive over long distances, compared with road transport; it generally turns more cost effective for distances of over 400 km.
Fig 14 – Volumes transported by rail
0
8
16
24
32
40
FY07
FY08
FY09
FY10
FY11
FY12
EXIM Domestic
(m tons)
Source: Indian Railways
Dedicated freight corridor to boost rail freight business
IR routes connecting the four metropolitan cities of Delhi, Mumbai, Chennai and Howrah, and its Delhi-Chennai and Mumbai-Howrah routes add up to a length of 10,122 km, carrying more than 55% of its revenue-earning freight traffic. The present trunk routes of Howrah-Delhi on the Eastern Corridor and Mumbai-Delhi on the Western Corridor are highly
Fig 13 – List of CTO operators Name Group Rakes Rail Terminals Exim (%) Domestic (%) Other Activities
Adani Logistics Adani 6 2 33 67 Ports, Container terminals, CTO, CFS
Concor IR 253 63 80 20 Multi modal operator
CRRS* DPW 8 - 100 - Ports, Container terminal
CWC PSU - - 100 - Warehousing, CFS
ETA Star Group Dubai 11 - 80 20 Shipping and port services
Gateway Rail Freight GDL 21 3 84 16 CFS, CTO
Hind Terminals MSC 14 - 100 - Shipping/ Freight Forwarding
India Infra. APL 9 - 98 2 Container shipping, infra
SICAL Logistics - 8 - - 100 CFS, container terminal
Boxtrans (India)** JM Baxi & Co. 12 - 10 90 Container terminal, CFS,
TransRail Logistics - 2 - - 100 Trucking
Arshiya Rail Infra. - 20 1 5 95
KRIL - 8 - 4 96 Fertilizers
Inlogistics NOL, Singapore 15 - - -
Total 387 69 76 24
Source: Industry

17 January 2013 India Logistics – Improving economic backdrop & reasonable valuations
Anand Rathi Research 8
saturated, their line capacity utilization varying between 115% and 150%. The surging power needs in the country, booming infrastructure construction and growing international trade have led to the conception of Dedicated Freight Corridors (DFCs) along the eastern and western routes.
The DFCs would have world-class and state-of-the-art technology. Significant improvements are proposed to be made in the present carrying capacity by modifying basic design features. New lines will be constructed with significantly better designs to withstand heavier loads at higher speeds. Simultaneously, in order to optimize productive use of the right of way, dimensions of the rolling stock are proposed to be enlarged. Both these improvements would allow longer and heavier trains to ply on the DFCs.
Project phasing of eastern and western corridors
Both corridors are being constructed simultaneously. By 2017, they are likely to be fully operational over their entire lengths. The following table indicates tentative phases.
Fig 15 – Project phasing Western Corridor Year
Phase I Rewari - Vadodara (920 Kms) 2009-2016
Phase II Vadodara – JNPT (430Kms) 2010-2017
Phase III Rewari – Dadri (140 Kms) 2010-2017
Eastern Corridor
Phase I-APL1 Khurja - Kanpur (343 Kms) 2009-2016
Phase II-APL2 Kanpur - Mughalsarai (390 Kms) 2010-2016
Phase III-APL3 Khurja-Ludhiana (397 Kms) 2011-2016
Phase IV (Funding through PPP) Dankuni - Sonnagar (550 Kms) 2011-2016
Phase Ia (Funding by Ministry of Railways) Sonnagar - Mugal Sarai (125 Kms) 2010-2016
Source: DFCIL
Eastern dedicated freight corridor
The eastern DFC will cover 1,839 km, traversing six states. It is expected to cater to a number of traffic streams - coal from the eastern coal fields for power plants in U.P., Delhi, Haryana, Punjab and parts of Rajasthan; finished steel, food grain, cement, fertilizers, limestone from Rajasthan to steel plants in the east, and general goods. The total traffic in UP direction is projected to go up to 116m tons in 2021-22. Similarly, in the down direction, the traffic level has been projected to increase to 28m tons in 2021-22. The incremental traffic on the route since 2005-06, is expected to increase by a staggering 92m tons and DFC is expected to carry a significant proportion of the same.
Western dedicated freight corridor
The western corridor will cover 1,483 km of double-line electric tracks from JNPT to Dadri via Vadodara, Ahmedabad, Palanpur, Phulera and Rewari. Traffic on the Western Corridor mainly comprises containers from JNPT and the Mumbai port in Maharashtra and ports of Pipavav, Mundra and Kandla in Gujarat destined for inland container depots (ICDs) in northern India, especially at Tughlakabad, Dadri and Dandharikalan. Besides containers, other commodities moving on the Western DFC are POL, fertilizers, foodgrain, salt, coal, iron, steel and cement. The rail share of container traffic on this corridor is slated to increase from 0.69m twenty-feet equivalent units (TEUs) in 2005-06 to 6.2m in 2021-22.
Fig 16 – E-DFC details States KMs
Punjab 88
Haryana 72
Uttar Pradesh 1,049
Bihar 93
West Bengal/Jharkhand 538
Total 1,839
Source: DFCIL
Fig 17 – W-DFC details States KMs
Haryana 192
Rajasthan 553
Gujarat 588
Maharashtra 150
Total 1,483
Source: DFCIL
17 January 2013 India Logistics – Improving economic backdrop & reasonable valuations
Anand Rathi Research 9
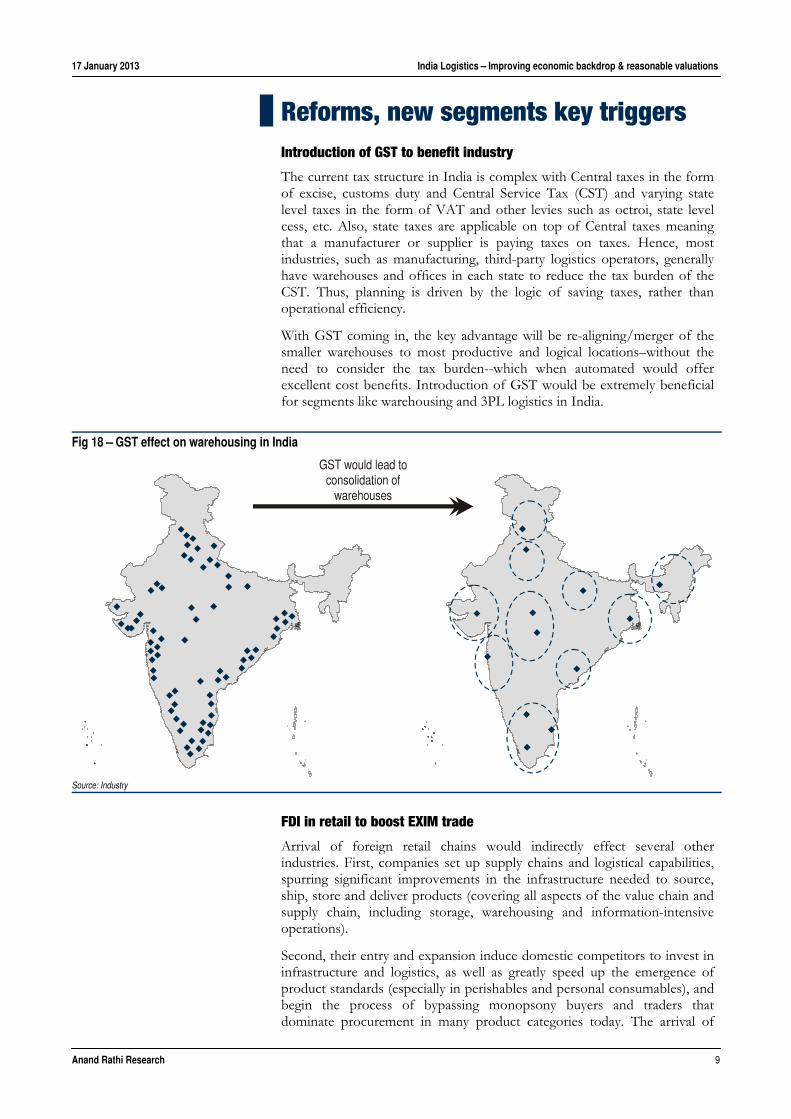
Reforms, new segments key triggers Introduction of GST to benefit industry
The current tax structure in India is complex with Central taxes in the form of excise, customs duty and Central Service Tax (CST) and varying state level taxes in the form of VAT and other levies such as octroi, state level cess, etc. Also, state taxes are applicable on top of Central taxes meaning that a manufacturer or supplier is paying taxes on taxes. Hence, most industries, such as manufacturing, third-party logistics operators, generally have warehouses and offices in each state to reduce the tax burden of the CST. Thus, planning is driven by the logic of saving taxes, rather than operational efficiency.
With GST coming in, the key advantage will be re-aligning/merger of the smaller warehouses to most productive and logical locations–without the need to consider the tax burden--which when automated would offer excellent cost benefits. Introduction of GST would be extremely beneficial for segments like warehousing and 3PL logistics in India.
FDI in retail to boost EXIM trade
Arrival of foreign retail chains would indirectly effect several other industries. First, companies set up supply chains and logistical capabilities, spurring significant improvements in the infrastructure needed to source, ship, store and deliver products (covering all aspects of the value chain and supply chain, including storage, warehousing and information-intensive operations).
Second, their entry and expansion induce domestic competitors to invest in infrastructure and logistics, as well as greatly speed up the emergence of product standards (especially in perishables and personal consumables), and begin the process of bypassing monopsony buyers and traders that dominate procurement in many product categories today. The arrival of
Fig 18 – GST effect on warehousing in India
GST would lead to consolidation of
warehouses
Source: Industry

17 January 2013 India Logistics – Improving economic backdrop & reasonable valuations
Anand Rathi Research 10
large retailers then increases sourcing of products from abroad and increases container volumes in the country. All the above mentioned factors would benefit the logistics sector in India in the long run.
Emerging segments in logistics
3PL logistics
Third-party logistics (3PL) or logistics outsourcing is gaining importance as more and more corporations across the world, unable to manage their complex supply chains, are outsourcing logistics activities to the 3PL or logistics service providers. By outsourcing logistics activities, corporations are able to not only concentrate on their core business operations, but also achieve cost-efficiency and improve delivery performance and customer satisfaction. According to industry sources, companies in India outsource ~50% of logistics. This has led to the rise of third-party logistics (3PL). These operators specialize in integrated transportation and warehousing services customized to meet clients’ needs.
3PL logistics in India is currently restricted to a few industries like autos, retail, telecom, IT hardware. We believe that with increasing demand for such services from other sectors, 3PL logistics service providers will stand to benefit from the same.
Warehousing at a nascent stage
Warehousing plays a key role in inventory management, product safety, last-mile value addition, etc. It constitutes a major cost component of the supply chain and accounts for ~20% of the Indian logistics sector. According to industry sources, India has ~1,800m sq.ft. of warehousing. Of this, only 8% or 144m sq.ft. are in the organised sector. The paucity of modern warehouses has resulted in the colossal waste of farm produce, reckoned at between 20% and 40% of the harvest. The shortage indicates the huge potential for vast quality warehousing space.
With the rapid growth of organised retail and manufacturing sectors, the need for warehousing is increasing. On the entry of foreign manufacturing, retail and 3PL companies, world-class warehousing with all modern amenities is on the rise. Moreover, the coming GST regime has necessitated organised and consolidated warehousing at well-run logistics parks.
Fig 19 – Indian warehousing sector
433m sq ftIndian warehousing
industry
Domestic367m sq ft
Unorganised398m sq ft
Organised36m sq ft
Exim66m sq ft
Source: Industry
The warehousing sector is expected to grow 35-40% annually with nearly 45m sq. ft. expected to be developed in the next five years. About 110 logistics parks are being set up across the country by several leading private players.

17 January 2013 India Logistics – Improving economic backdrop & reasonable valuations
Anand Rathi Research 11
Valuation We expect the logistics sector to be re-rated on account of higher EXIM trade volumes, increase in containerized trade, improving cash flow generation, government thrust on infrastructure spend, emergence of new segments like organized warehousing, 3PL, 4PL logistics etc which will lead to higher revenues and improving profitability for the companies. We prefer Gateway Distriparks (integrated logistics player having presence in CFS, rail transport & cold chain segment), followed by Container corporation (largest player in the CTO segment). Risks are slowdown in global trade, adverse government policies and delay in infrastructure development.
Container Corporation of India. At our price target of `1,132, the stock would trade at 15x Mar’14 earnings (in line with its past three-year average). Its one-year-forward PE in the past three years has largely ranged between 14x and 15x.
Gateway Distriparks. At our price target of `196, the stock would trade at 12x Mar’14e earnings (in line with its past three-year one-year-forward average). GD’s one-year-forward PE in the past three years has largely ranged between 10x and 14x.
Allcargo Logistics. At our price target of `159, the stock would trade at 9x Mar’14e earnings (in line with its past two-year one-year-forward average). ACG’s one-year-forward PE in the past three years has largely ranged between 9x and 11x.
Risks
Rising competition in CFS. Increasing competition at Mumbai CFS has led to slight reduction in margins. Any further increase in competition could be negative for the company.
Slowdown in capex cycle. Delayed pick up in capex cycle would have a negative effect on the P&E segment of the company.
Slowdown in world trade. Further slowdown in trade could have a negative effect on the business.
Fig 20 – Peer comparison Revenues (`m) P/E (x) P/Bv (x) EV/EBITDA (x)
Company M. Cap (US$m) FY12 FY13e FY14e FY12 FY13e FY14e FY12 FY13e FY14e FY12 FY13e FY14e
Container Corporation of India 2,233 41,009 44,337 50,757 13.7 12.5 11.6 2.1 1.9 1.7 8.7 8.9 7.7
Gateway Distriparks 275 8,215 9,653 11,532 10.9 10.6 8.4 2.0 1.9 1.7 5.7 5.5 4.5
Allcargo Logistics 311 42,711 40,706 45,375 6.1 7.9 7.4 1.2 1.0 0.9 4.0 4.0 3.3
Source: Company, Anand Rathi Research

17 January 2013 India Logistics – Improving economic backdrop & reasonable valuations
Anand Rathi Research 12
Company Section

Anand Rathi Shares and Stock Brokers Limited (hereinafter “ARSSBL”) is a full service brokerage and equities research firm and the views expressed therein are solely of ARSSBL and not of the companies which have been covered in the Research Report. This report is intended for the sole use of the Recipient and is to be circulated only within India and to no countries outside India. Disclosures and analyst certifications are present in Appendix Anand Rathi Research India Equities
India I Equities Logistics
Initiating Coverage
Key financials (YE Mar) FY11 FY12 FY13e FY14e FY15e
Sales (`m) 38,992 41,009 44,337 50,757 56,950
Net Profit (`m) 8,764 8,657 9,199 9,812 10,881
EPS (`) 67.4 66.6 70.8 75.5 83.7
Growth (%) 12.7 (1.2) 6.3 6.7 10.9
PE (x) 13.9 14.1 13.2 12.4 11.2
P BV (x) 2.5 2.2 2.0 1.8 1.6
RoE (%) 19.0 16.5 15.6 14.9 14.9
RoCE (%) 17.7 16.3 15.2 15.3 15.6
Dividend Yield (%) 1.7 1.8 1.8 1.9 2.1
Net Gearing (%) (45.5) (48.8) (32.0) (27.3) (25.4)
Source: Company, Anand Rathi Research
Dhaval Dama+9122 66266728
Relative price performance
CCRI
Sensex
800
900
1,000
1,100
Jan-
12
Mar
-12
May
-12
Jul-1
2
Sep-
12
Nov
-12
Jan-
13
Source: Bloomberg
Key data CCRI IN / CCRI.BO52-week high / low `825 / `1104Sensex / Nifty 19987 / 60573-m average volume US$0.9m Market cap `122bn / US$2233mShares outstanding 130m
Shareholding pattern (%) Sep ’12 Jun ’12 Mar ’12
Promoters 63.1 63.1 63.1 - of which, Pledged - - -Free Float 36.9 36.9 36.9 - Foreign Institutions 26.1 25.5 25.6 - Domestic Institutions 7.3 7.1 7.3 - Public 3.5 4.3 4
Rating: Buy Target Price: `1,132
Share Price: `937
17 January 2013
Container Corporation of India
Dominant in rail freight; initiating with Buy
Container Corporation of India (CCI) is the leading container train operator (CTO) in India, with 63 terminals and 253 rakes. It will be the prime beneficiary of Indian Railways’ increased focus on raising rail transport, along with implementation of goods and service tax (GST) and foreign direct investment (FDI) in retail. It is leveraging its balance sheet strength to undertake pre-emptive capex of `62bn during FY13-17 to gear up for taking advantage of the dedicated freight corridors (DFC). We initiate coverage with Buy and price target of `1,132.
Strong network, capex for long-term gains. CCI has access to Indian Railways’ (IR) surplus land at strategic locations at attractive long-term lease rates. It has ~63 rail terminals across the country and operates ~253 rakes. It plans to incur capex of ~`62bn over FY13-17 to set up 12 logistics parks and gear up for the DFC, which would significantly benefit the country’s rail transport.
DFC, other reforms to aid business growth. IR is in the process of implementing its most ambitious project, a direct freight corridor (DFC) spanning ~3,300 km. This will significantly increase rail operators’ asset turnover and cut turnaround time sharply, improving profitability. Rise in EXIM and container trade, along with implementation of reforms such as GST and FDI in retail would immensely benefit CCI.
Leveraging strong balance sheet to fund capex. CCI had cash balance of ~28bn in FY12 and revenue is expected at 11.6% CAGR over FY12-15. We expect it to fund its own capex (~`62bn) through strong cash flows from operations. Net debt-to-equity is expected at (25.4)% in FY15.
Valuation. At our target, the stock would trade at a P/E of 15x Mar’14 earnings (in line with its past two-year average P/E). Risks. Slowdown in trade, government policies.

17 January 2013 Container Corporation of India – Dominant in rail freight; initiating with Buy
Anand Rathi Research 14
Quick Glance – Financials and ValuationsFig 1 – Income statement (`m)
Year-end: Mar FY11 FY12 FY13e FY14e FY15e
Net sales 38,992 41,009 44,337 50,757 56,950 Sales growth (%) 4.5 5.2 8.1 14.5 12.2 - Op. expenses 26,664 28,125 30,460 34,870 39,011 EBIDTA 10,153 10,230 10,907 12,486 14,124 EBITDA margins (%) 26.0 24.9 24.6 24.6 24.8 - Interest 46 50 - - - - Depreciation 1,489 1,621 1,889 2,324 2,621 + Other income 1,971 3,135 3,086 2,749 2,815 - Tax 1,800 3,037 2,905 3,099 3,436 Effective tax rate (%) 17.0 26.0 24.0 24.0 24.0 Reported cons.PAT 8,764 8,657 9,199 9,812 10,881 +/- Extraordinary items - - - - -+/- Minority interest - - - - -Adjusted cons. PAT 8,764 8,657 9,199 9,812 10,881 Adj. FDEPS (`/share) 67.4 66.6 70.8 75.5 83.7 Adj. FDEPS growth (%) 12.7 (1.2) 6.3 6.7 10.9 Source: Company, Anand Rathi Research
Fig 3 – Cash-flow statement (`m) Year-end: Mar FY11 FY12 FY13e FY14e FY15e
Consolidated PAT 8,764 8,657 9,199 9,812 10,881 + Non Cash Items 1,667 1,771 1,889 2,324 2,621 Cash profit 10,431 10,428 11,088 12,136 13,502 - Incr/(Decr) in WC 851 2,622 828 913 787 Operating cash flow 9,580 7,806 10,260 11,223 12,715 - Capex 4,214 212 14,849 9,500 9,000 Free cash flow 5,366 7,595 (4,590) 1,723 3,715 - Dividend 2,345 2,493 2,585 2,737 3,042 + Equity raised (0) - - (0) (0)+ Debt raised 49 45 - - -- Investments 34 491 - - -- Misc. items (0) 0 (1) - -Net cash flow 3,036 4,655 (7,174) (1,014) 674 + Opening cash 19,925 22,961 27,616 20,442 19,428 Closing cash 22,961 27,616 20,442 19,428 20,102 Source: Company, Anand Rathi Research
Fig 5 – PE band
4x
8x
12x
16x
20x
0
200
400
600
800
1,000
1,200
1,400
1,600
Apr-0
8
Aug-
08
Dec
-08
Apr-0
9
Aug-
09
Dec
-09
Apr-1
0
Aug-
10
Dec
-10
Apr-1
1
Aug-
11
Dec
-11
Apr-1
2
Aug-
12
Dec
-12
Source: Bloomberg, Anand Rathi Research
Fig 2 – Balance sheet (`m) Year-end: Mar FY11 FY12 FY13e FY14e FY15e
Share capital 1,300 1,300 1,300 1,300 1,300 Reserves & surplus 48,088 54,252 60,866 67,941 75,780 Shareholders’ fund 49,388 55,552 62,165 69,240 77,080 Debt 473 519 519 519 519 Minority interests - - - - -Deferred Tax Liab (net) 2,288 2,438 2,438 2,438 2,438 Capital employed 52,149 58,508 65,122 72,197 80,036 Net Fixed assets 27,148 25,739 38,699 45,875 52,254 Investments 1,956 2,447 2,447 2,447 2,447 - of which liquid 1,956 2,447 2,447 2,447 2,447 Working capital 84 2,705 3,533 4,446 5,233 Cash 22,961 27,616 20,442 19,428 20,102 Capital deployed 52,149 58,508 65,122 72,197 80,036 Net Debt/Equity (%) (45.5) (48.8) (32.0) (27.3) (25.4)W C turn (days) (3.2) 12.4 25.7 28.7 31.0 Book Value (`/share) 380.0 427.4 478.3 532.7 593.0 Source: Company, Anand Rathi Research
Fig 4 – Ratio analysis @ `937 Year-end: Mar FY11 FY12 FY13e FY14e FY15e
P/E (x) 13.9 14.1 13.2 12.4 11.2 Cash P/E (x) 11.7 11.7 11.0 10.0 9.0 P/B (x) 2.5 2.2 2.0 1.8 1.6 EV/sales (x) 2.5 2.2 2.2 2.0 1.8 EV/EBITDA (x) 9.6 9.0 9.1 8.0 7.1 RoE (%) 19.0 16.5 15.6 14.9 14.9 RoCE (%) 17.7 16.3 15.2 15.3 15.6 Dividend yield (%) 1.7 1.8 1.8 1.9 2.1 Dividend payout (%) 26.8 28.8 28.1 27.9 28.0 Debt to equity (x) 0.0 0.0 0.0 0.0 0.0 Int Coverage (x) 188.8 170.8 - - -Receivables days 2.3 2.7 2.8 2.9 2.9 Payables days 61.0 57.1 59.0 55.0 53.0 Working capital days (3.2) 12.4 25.7 28.7 31.0 Fixed asset T/O (x) 1.5 1.6 1.4 1.2 1.2 Source: Company, Anand Rathi Research
Fig 6 – FY12 revenue breakdown
EXIM80%
Others1%
Domestic19%
Source: Company

17 January 2013 Container Corporation of India – Dominant in rail freight; initiating with Buy
Anand Rathi Research 15
Widest network in industry Strong infrastructure network a key advantage
CCI’s widest rail network is its chief edge over peers. It has 63 strategically located rail terminals, 12 dedicated for domestic traffic, 18 for EXIM and 33 for both. Even six years after 15 private CTOs entered the business, cumulatively they have set up only seven terminals. Of course, CCI benefits from attractive long-term lease rates for IR’s surplus land at strategic locations. Also, it has ~253 rakes, more than its peers’ combined capacity. We believe its strong rail network affords it a greater leverage with major shipping lines which handle most EXIM trade. Also, it is able to pass on to end-customers any rise in rail haulage charges.
Fig 7 – Concor’s infrastructure network
Source: Company
High-margin EXIM business to be highest contributor
The Indian rail CTO business stands at ~38m tons, valued at ~`58bn. It can be divided into two segments – EXIM and domestic. EXIM accounts for ~75% of the market and domestic segment ~25%. At present, 15 container train operators (besides CONCOR) have signed concession agreements with IR to run container trains.
Over FY07-12, volumes transported by rail have increased from 20.3m tons to 38.4m tons, indicating a CAGR of 13.6%.During the same period volumes transported by CCI have increased from 2.1m TEU’s to 2.6m TEU’s.

17 January 2013 Container Corporation of India – Dominant in rail freight; initiating with Buy
Anand Rathi Research 16
Fig 8 – Volumes transported by rail
0
8
16
24
32
40
FY07
FY08
FY09
FY10
FY11
FY12
2.00
2.15
2.30
2.45
2.60
2.75
Total rail volumes Volumes transported by Concor (RHS)
(m tons) (m TEUs)
Source: Company, Anand Rathi Research
About 80% of CCI’s revenues arise from the high-margin EXIM traffic, commanding EBIT margins of ~26-27%. Its domestic traffic generally has margins of ~8-10% (nearly 55% of its business comes from the northern region and from ferrying goods to JNPT and nearby ports.) We expect EXIM trade to pick up in FY14, leading to more container traffic in India, raising CCI’s volumes. Over FY12-15, we expect CCI’s EXIM volumes to record an 8% CAGR and domestic volumes 7% CAGR. In the same period, we expect its overall CTO revenues to record a 12% CAGR.
Fig 11 – TEUs handled, by region FY06 FY07 FY08 FY09 FY10 FY11 FY12
Western 282,853 290,625 395,144 320,262 324,161 372,574 352,282
Eastern 80,612 82,594 101,168 90,865 121,845 129,029 119,018
Southern 289,061 303,468 340,659 345,805 284,357 334,532 355,944
Central 79,665 97,151 107,028 104,897 123,092 127,734 151,705
North Central 152,114 204,973 283,092 288,398 316,980 288,858 282,595
Northern 836,574 889,615 936,362 857,929 898,915 917,029 948,849
South central 82,999 81,846 102,013 111,275 135,053 152,243 139,587
North Western 126,684 154,994 181,843 188,801 216,844 240,298 254,331
Total 1,930,562 2,105,266 2,447,309 2,308,232 2,421,247 2,562,297 2,604,311
Source: Company
Fig 9 – TEUs - EXIM and domestic
0
500,000
1,000,000
1,500,000
2,000,000
2,500,000
3,000,000
FY09
FY10
FY11
FY12
FY13
e
FY14
e
FY15
e
EXIM Domestic
(TEU)
Source: CMIE
Fig 10 – Realisation trend - EXIM and domestic
0
4,000
8,000
12,000
16,000
20,000
FY09
FY10
FY11
FY12
FY13
e
FY14
e
FY15
e
EXIM Domestic
(`/TEU)
Source: Industry

17 January 2013 Container Corporation of India – Dominant in rail freight; initiating with Buy
Anand Rathi Research 17
Fig 12 – EXIM and domestic business FY09 FY10 FY11 FY12 FY13 FY14 FY15
Exim
TEU's 1,854,959 1,882,277 2,018,551 2,136,000 2,264,160 2,445,293 2,689,822
Segment revenue (`bn) 27 29 30 33 36 41 46
Revenue/TEU 14,696 15,399 14,832 15,288 15,747 16,692 17,026
EBIDTA (`bn) 8.68 8.59 9.35 9.84 10.34 12.04 13.74
EBIDTA margin % 32 30 31 30 29 30 30
EBIDTA/TEU 4,680 4,565 4,633 4,605 4,567 4,924 5,108
EBIT (`bn) 7.82 7.59 8.28 8.63 9.09 10.53 11.91
EBIT margin % 29 26 28 26 26 26 26
EBIT/TEU 4,215 4,033 4,103 4,040 4,015 4,306 4,427
Domestic
TEU's 453,273 538,970 543,746 468,311 496,410 536,122 589,735
Segment revenue (`bn) 6.91 8.07 8.40 7.95 8.68 9.94 11.15
Revenue/TEU 15,246 14,977 15,440 16,983 17,493 18,542 18,913
EBIDTA (`bn) 1.14 1.45 1.17 1.03 1.11 1.29 1.45
EBIDTA margin % 17 18 14 13 13 13 13
EBIDTA/TEU 2,521 2,692 2,154 2,203 2,239 2,411 2,459
EBIT (`bn) 0.87 1.12 0.80 0.66 0.71 0.84 0.95
EBIT margin % 13 14 10 8 8 9 9
EBIT/TEU 1,911 2,079 1,474 1,420 1,434 1,576 1,608
Source: Company, Anand Rathi Research
Capex of ~`62bn to drive future growth
Gearing up for completion of IR’s most ambitious project, DFC, in FY17, CCI is undertaking capex of ~`62bn over FY13-17. For this, it is acquiring land to set up 12 strategically located multi-modal logistics parks (MMLP) across India, providing transportation services and value-added ones required for import or export of goods. It also plans to invest a significant amount in acquiring additional rakes and purchasing new equipment. We believe that this capex would reduce its short-term FCF and help in building up base for future growth. During FY13, it has planned a capex of~`15bn.
Fig 13 – FY13 capex plans (~`15bn)
Land43%
Civil6%
ons / Rakes21%
Equipments / Others30%
Source: Company
Fig 14 – FY13-17 capex plans (~`62bn)
Land19%
Civil8%
Equipments / Others41%
Wagons / Rakes32%
Source: Company

17 January 2013 Container Corporation of India – Dominant in rail freight; initiating with Buy
Anand Rathi Research 18
DFC, reforms to grow business Dedicated freight corridor to transform CTO business
DFC is one of the largest infrastructure projects of IR since independence. IR’s routes - connecting the four metropolises (Delhi, Mumbai, Chennai, Kolkata) and the two diagonals (Delhi-Chennai, Mumbai-Howrah) - add up to a route length of 10,122 km. They carry over 55% of the revenue-earning freight traffic.
The present trunk routes of Howrah-Delhi (Eastern Corridor) and Mumbai-Delhi (Western Corridor) are highly saturated, with line-capacity utilization of 115% to 150%. Surging power needs in the country require vast coal movements, booming infrastructure construction and growing international trade. All this had led to the conception of the DFCs.
For this, under the administrative control of the Ministry of Railways, the Dedicated Freight Corridor Corporation of India (DFCCI), a special purpose vehicle was set up. It is constructing two corridors, the Western DFC (Dadri to Mumbai, passing through Delhi, Haryana, Rajasthan, Gujarat and Maharashtra) and the Eastern DFC – from Ludhiana (Punjab) to Dankuni (West Bengal) crossing Haryana, Uttar Pradesh and Bihar. The first phase of the two corridors covers ~3,300 km.
DFCCI envisages long-haul operations, with trailer loads rising from ~4,000 to ~15,000 tons, carrying capacity from 90 containers to 400 (double stacking), maximum speed from 75kmph to 100kmph and station spacing of 7-10 km to 40 km. CTOs would thus be able to reduce costs through greater efficiencies (higher asset turnover and faster turnaround time) and become the reliable/preferred mode for longer-haul freight movement. CCI would, of course, be the chief beneficiary.
Fig 15 – DFC to improve CTO efficiency
Moving dimensions
Feature Existing On DFC
Height7.1m for Western DFC5.1m for Eastern DFC4.265m
Width
3,200 mm 3,660 mm
Containerstack Single stack Double stack
Train length
700 mm 1,500 mm
Train load 4,000 ton 15,000 ton
Source: DFCCIL

17 January 2013 Container Corporation of India – Dominant in rail freight; initiating with Buy
Anand Rathi Research 19
The project cost is `930bn, including `70bn for land. The net requirement for the DFC project is `880bn. Of this, `100bn of Sonnagar- Dankuni (Eastern DFC) will be funded on a PPP basis – IDC: `60bn; Bridges: `60bn. Thus, DFCCI requires funding of `680bn – debt of `420bn (JICA: `280bn and WB: `140bn) and equity of `260bn.
Key reforms such as GST, FDI in retail augur well
Implementation of GST by the Centre would be a significant positive for the logistics sector, particularly for multimodal operators like CCI. At present, multiple and varied state taxes compel most companies to set up warehouses in each state to minimize inter-state movement and associated taxes. Implementation of GST, which aims to level such taxes, would obviate the need for multiple warehouses.
Consequently, companies would function effectively with fewer strategically-located warehouses across the country and adopt a hub-and-spoke model to reduce inventory and carrying costs. Transport requirements would shift from shorter-haul ‘warehouse-to-warehouse’ to longer-haul ‘factory-to-factory’, boosting operators such as CCI, which effectively handles the entire logistics chain.
FDI in multi-brand retail
To transport perishable products from source to end users, CCI has been setting up cold chains. At present, only 10-15% of cold storage operators have such capabilities, primarily due to absence of reefer container links and high cost of power. CCI has huge plans to tap agricultural business opportunities through cold storages. For this, it has constituted a 100% subsidiary, Fresh and Healthy Enterprises (FHE). The approval of FDI in retail could attract established MNCs which could become CCI’s customers.

17 January 2013 Container Corporation of India – Dominant in rail freight; initiating with Buy
Anand Rathi Research 20
Leveraging strong balance sheet
Capex to be funded by internal accruals
The company is incurring capex of ~`62bn over FY13-17. We believe it would generate strong FCF over FY12-15, which would help fund the capex required. We expect it to be debt free with a net debt-to-equity of (25.4)% in FY15. On the completion of its capex, we expect it to generate higher cash flows.
Fig 16 – FCF v/s net D/E
-5,000
-2,500
0
2,500
5,000
7,500
10,000
FY09
FY10
FY11
FY12
FY13
e
FY14
e
FY15
e
-50
-46
-42
-38
-34
-30
-26
FCF Net D/E (RHS)
(`m) (%)
Source: Company, Anand Rathi Research
Strategic JVs to aid business CCI has entered into strategic JVs with others in logistics, from CFS operators to road transport operators. This has helped position it as a total logistics solutions provider, offering door-to-door services to suit customers’ needs. We believe that many of these JVs, which are still at a very nascent stage, would further strengthen its position in logistics.
Cold-chain business to benefit from FDI in retail
CCI’s 100% subsidiary, Fresh and Healthy Enterprises, manages a cold chain. Its major clients are large retailers in India (Walmart, More, Big Bazaar, etc.) and those in the dairy segment (Mother Dairy, etc.). On implementation of FDI in retail, demand would rise considerably, benefiting CCI.
Fig 17 – Details of JVs Particulars Type Holding (%)
Star Track Terminals JV with Maersk India for CFS at Dadri, U.P. 49
Albatross Inland Ports JV with Transworld Group for CFS at Dadri, U.P. 49
Gateway Terminals India JV with APM Terminals for third berth at JN Port, Mumbai 26
CMA-CGM Logistics Park* JV with Ameya Logistics for CFS at Dadri, UP 49
Himalayan Terminals JV with Nepalese Ent & Transworld for management and operation of rail CTO at Birgunj (Nepal) 40
HALCON A arrangement with Hindustan Aeronautics for operating air cargo complex & ICD at Ozar airport, Nasik 50
India Gateway Terminal JV with Dubai Port Int. (DPI) for setting up and managing Container Terminals at Cochin 15
Hind CONCOR Terminals* JV with Hind Terminals for CFS at Dadri, U.P. 49
Infinite Logistics Solutions JV with TCI Ltd.to establish logistics freight terminals and provide integrated logistics services 49
Container Gateway JV with Gateway Rail for operations of existing rail/ road container terminal at Garhi Harsaru, Gurgaon 49
Allcargo Logistics Park JV with Allcargo Global for setting up and running CFS at Dadri 49
CONYK Cartrac JV with NYK Auto Logistics for setting up & dealing in CBU vehicle logistics 50
Source: Company
17 January 2013 Container Corporation of India – Dominant in rail freight; initiating with Buy
Anand Rathi Research 21
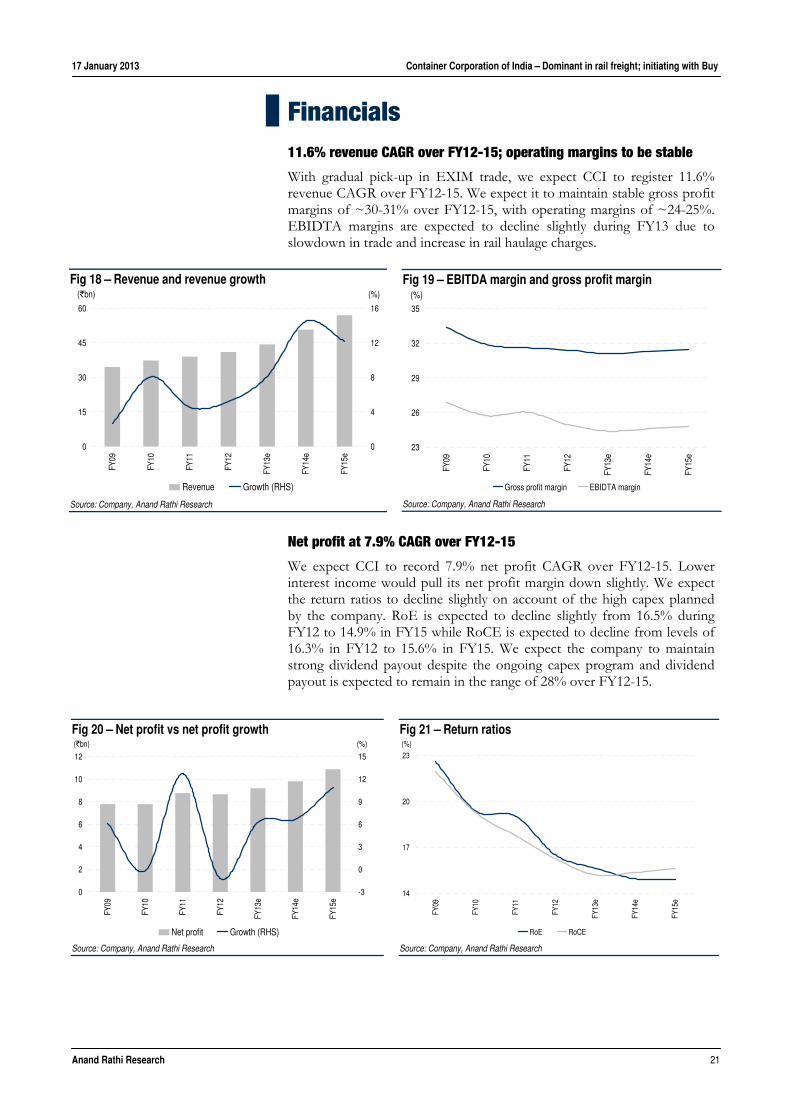
Financials 11.6% revenue CAGR over FY12-15; operating margins to be stable
With gradual pick-up in EXIM trade, we expect CCI to register 11.6% revenue CAGR over FY12-15. We expect it to maintain stable gross profit margins of ~30-31% over FY12-15, with operating margins of ~24-25%. EBIDTA margins are expected to decline slightly during FY13 due to slowdown in trade and increase in rail haulage charges.
Net profit at 7.9% CAGR over FY12-15
We expect CCI to record 7.9% net profit CAGR over FY12-15. Lower interest income would pull its net profit margin down slightly. We expect the return ratios to decline slightly on account of the high capex planned by the company. RoE is expected to decline slightly from 16.5% during FY12 to 14.9% in FY15 while RoCE is expected to decline from levels of 16.3% in FY12 to 15.6% in FY15. We expect the company to maintain strong dividend payout despite the ongoing capex program and dividend payout is expected to remain in the range of 28% over FY12-15.
Fig 18 – Revenue and revenue growth
0
15
30
45
60
FY09
FY10
FY11
FY12
FY13
e
FY14
e
FY15
e
0
4
8
12
16
Revenue Growth (RHS)
(`bn) (%)
Source: Company, Anand Rathi Research
Fig 19 – EBITDA margin and gross profit margin
23
26
29
32
35
FY09
FY10
FY11
FY12
FY13
e
FY14
e
FY15
e
Gross profit margin EBIDTA margin
(%)
Source: Company, Anand Rathi Research
Fig 20 – Net profit vs net profit growth
0
2
4
6
8
10
12
FY09
FY10
FY11
FY12
FY13
e
FY14
e
FY15
e
-3
0
3
6
9
12
15
Net profit Growth (RHS)
(`bn) (%)
Source: Company, Anand Rathi Research
Fig 21 – Return ratios
14
17
20
23
FY09
FY10
FY11
FY12
FY13
e
FY14
e
FY15
e
RoE RoCE
(%)
Source: Company, Anand Rathi Research
17 January 2013 Container Corporation of India – Dominant in rail freight; initiating with Buy
Anand Rathi Research 22
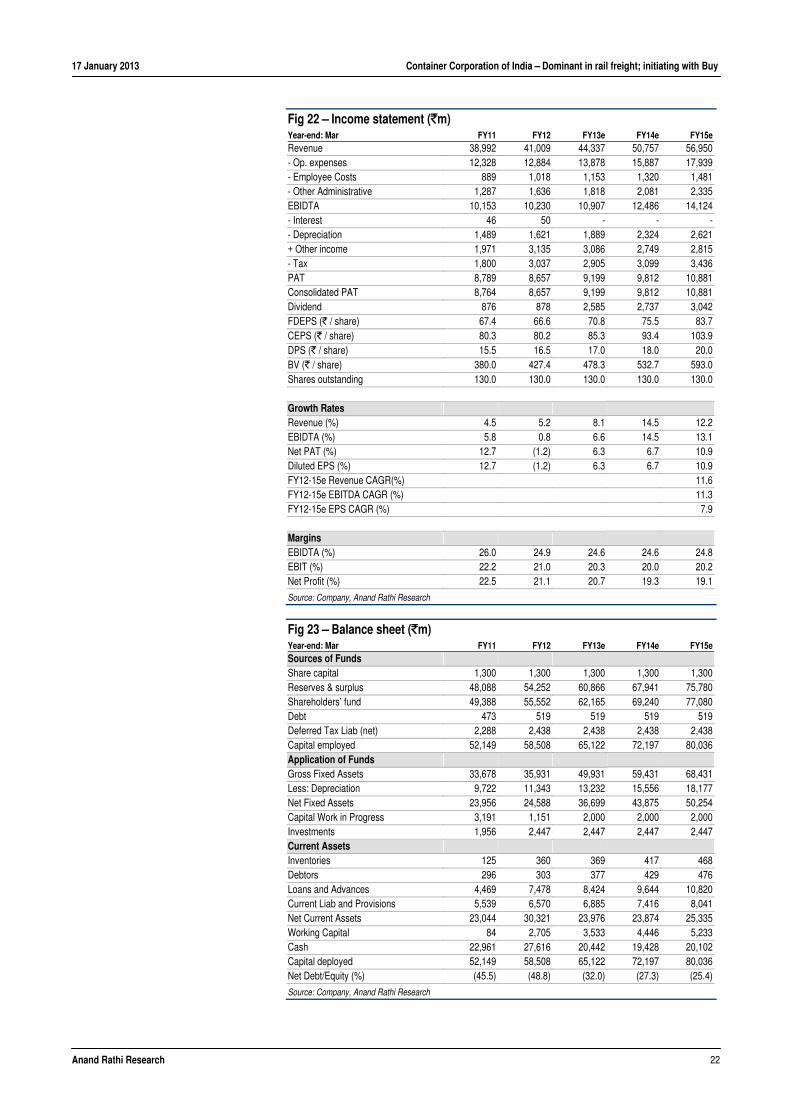
Fig 22 – Income statement (`m) Year-end: Mar FY11 FY12 FY13e FY14e FY15e Revenue 38,992 41,009 44,337 50,757 56,950 - Op. expenses 12,328 12,884 13,878 15,887 17,939 - Employee Costs 889 1,018 1,153 1,320 1,481 - Other Administrative 1,287 1,636 1,818 2,081 2,335 EBIDTA 10,153 10,230 10,907 12,486 14,124 - Interest 46 50 - - -- Depreciation 1,489 1,621 1,889 2,324 2,621 + Other income 1,971 3,135 3,086 2,749 2,815 - Tax 1,800 3,037 2,905 3,099 3,436 PAT 8,789 8,657 9,199 9,812 10,881 Consolidated PAT 8,764 8,657 9,199 9,812 10,881 Dividend 876 878 2,585 2,737 3,042 FDEPS (` / share) 67.4 66.6 70.8 75.5 83.7 CEPS (` / share) 80.3 80.2 85.3 93.4 103.9 DPS (` / share) 15.5 16.5 17.0 18.0 20.0 BV (` / share) 380.0 427.4 478.3 532.7 593.0 Shares outstanding 130.0 130.0 130.0 130.0 130.0 Growth Rates Revenue (%) 4.5 5.2 8.1 14.5 12.2 EBIDTA (%) 5.8 0.8 6.6 14.5 13.1 Net PAT (%) 12.7 (1.2) 6.3 6.7 10.9 Diluted EPS (%) 12.7 (1.2) 6.3 6.7 10.9 FY12-15e Revenue CAGR(%) 11.6 FY12-15e EBITDA CAGR (%) 11.3 FY12-15e EPS CAGR (%) 7.9 Margins EBIDTA (%) 26.0 24.9 24.6 24.6 24.8 EBIT (%) 22.2 21.0 20.3 20.0 20.2 Net Profit (%) 22.5 21.1 20.7 19.3 19.1
Source: Company, Anand Rathi Research
Fig 23 – Balance sheet (`m) Year-end: Mar FY11 FY12 FY13e FY14e FY15e Sources of Funds Share capital 1,300 1,300 1,300 1,300 1,300 Reserves & surplus 48,088 54,252 60,866 67,941 75,780 Shareholders’ fund 49,388 55,552 62,165 69,240 77,080 Debt 473 519 519 519 519 Deferred Tax Liab (net) 2,288 2,438 2,438 2,438 2,438 Capital employed 52,149 58,508 65,122 72,197 80,036 Application of Funds Gross Fixed Assets 33,678 35,931 49,931 59,431 68,431 Less: Depreciation 9,722 11,343 13,232 15,556 18,177 Net Fixed Assets 23,956 24,588 36,699 43,875 50,254 Capital Work in Progress 3,191 1,151 2,000 2,000 2,000 Investments 1,956 2,447 2,447 2,447 2,447 Current Assets Inventories 125 360 369 417 468 Debtors 296 303 377 429 476 Loans and Advances 4,469 7,478 8,424 9,644 10,820 Current Liab and Provisions 5,539 6,570 6,885 7,416 8,041 Net Current Assets 23,044 30,321 23,976 23,874 25,335 Working Capital 84 2,705 3,533 4,446 5,233 Cash 22,961 27,616 20,442 19,428 20,102 Capital deployed 52,149 58,508 65,122 72,197 80,036 Net Debt/Equity (%) (45.5) (48.8) (32.0) (27.3) (25.4)
Source: Company, Anand Rathi Research

17 January 2013 Container Corporation of India – Dominant in rail freight; initiating with Buy
Anand Rathi Research 23
Fig 24 – Cash flow statement (`m) Year-end: Mar FY11 FY12 FY13e FY14e FY15e
Consolidated PAT 8,764 8,657 9,199 9,812 10,881
+ Depreciation 1,489 1,621 1,889 2,324 2,621
+ Deferred Tax 179 150 - - -
+ Other non cash - - - - -
Cash profit 10,431 10,428 11,088 12,136 13,502
- Incr/(Decr) in WC 851 2,622 828 913 787
Operating cash flow 9,580 7,806 10,260 11,223 12,715
- Capex 4,214 212 14,849 9,500 9,000
Free cash flow 5,366 7,595 (4,590) 1,723 3,715
- Dividend 2,345 2,493 2,585 2,737 3,042
+ Equity raised - - - - -
+ Debt raised 49 45 - - -
- Investments 34 491 - - -
- Misc. items - - (1) - -
Net cash flow 3,036 4,655 (7,174) (1,014) 674
+ Opening cash 19,925 22,961 27,616 20,442 19,428
Closing cash 22,961 27,616 20,442 19,428 20,102
Source: Company, Anand Rathi Research
Fig 25 – Ratio analysis @ `937 Year-end: Mar FY11 FY12 FY13e FY14e FY15e
Valuations
P / E 13.9 14.1 13.2 12.4 11.2
P / BV 2.5 2.2 2.0 1.8 1.6
M Cap / Sales 3.1 3.0 2.7 2.4 2.1
EV / Sales 2.5 2.2 2.2 2.0 1.8
EV / EBIDTA 9.6 9.0 9.1 8.0 7.1
Dividend
Dividend yield (%) 1.7 1.8 1.8 1.9 2.1
Dividend payout (%) 26.8 28.8 28.1 27.9 28.0
Leverage
Net Debt / Equity (46) (49) (32) (27) (25)
Int Coverage 189 171 - - -
Return Ratios ROE (%) 19.0 16.5 15.6 14.9 14.9
ROCE (%) 17.7 16.3 15.2 15.3 15.6
Source: Company, Anand Rathi Research

17 January 2013 Container Corporation of India – Dominant in rail freight; initiating with Buy
Anand Rathi Research 24
Valuation At our price target of `1,132, the stock would trade at 15x Mar’14 earnings (in line with its past three-year average). Its one-year-forward PE in the past three years has largely ranged between 14x and 15x. At the current market price of `937, it trades at PE of 13.2x and 12.4x FY13e and FY14e earnings, respectively, and EV/EBITDA of 9.1x and 8x. We initiate coverage with a Buy and a target price of `1,132.
Fig 26 – 12-month-forward PE: Mean and standard deviation
Mean
+1SD
+2SD
-1SD
-2SD
0
5
10
15
20
25
Mar
-08
Jun-
08
Sep-
08
Dec
-08
Mar
-09
Jun-
09
Sep-
09
Dec
-09
Mar
-10
Jun-
10
Sep-
10
Dec
-10
Mar
-11
Jun-
11
Sep-
11
Dec
-11
Mar
-12
Jun-
12
Sep-
12
Dec
-12
Source: Bloomberg, Anand Rathi Research
Risks
Slowdown in EXIM trade. Any slowdown in the world economy would lead to decelerating EXIM trade, hitting CCI.
Increase in rail haulage charges. Further increase in rail haulage charges could affect the company if it isn’t able to pass on the increase in prices. It could lead to higher preference by end customers for other modes of transportation.
Increase in competition. Any further increase in competition by the private players could have a negative effect on the volumes for Container corp.

17 January 2013 Container Corporation of India – Dominant in rail freight; initiating with Buy
Anand Rathi Research 25
Company Overview Established in 1988 to take over the network of seven ICDs from the Indian Railways, the state-owned Container Corp. of India is today the leading CTO operator in the country with a network spanning 63 ICDs/CFSs.
Background
Container Corporation of India Ltd. (CONCOR), was incorporated in March 1988 and commenced operation from November 1989 taking over the existing network of 7 ICDs from the Indian Railways. The company has gone on to become an undisputed market leader having the largest network of 62 ICDs/CFSs in India. In addition to providing inland transport by rail for containers, it has also expanded to cover management of Ports, air cargo complexes and establishing cold-chain. It has and will continue to play the role of promoting containerization of India by virtue of its modern rail wagon fleet, customer friendly commercial practices and extensively used Information Technology. The company developed multimodal logistics support for India’s International and Domestic containerization and trade.
Fig 27 – Revenue breakdown (FY12)
EXIM80%
Domestic19%
Others1%
Source: Company
Key management personnel Managing director – Mr Anil Kumar Gupta
Finance director – Smt P.Alli. Rani
Director, Projects & Services – Mr Harpreet Singh
Director, International Marketing and Operations – Mr Yash Vardhan

Anand Rathi Shares and Stock Brokers Limited (hereinafter “ARSSBL”) is a full service brokerage and equities research firm and the views expressed therein are solely of ARSSBL and not of the companies which have been covered in the Research Report. This report is intended for the sole use of the Recipient and is to be circulated only within India and to no countries outside India. Disclosures and analyst certifications are present in Appendix Anand Rathi Research India Equities
Dhaval Dama+9122 66266728
India I Equities Logistics
Initiating Coverage
Key financials (YE Mar) FY11 FY12 FY13e FY14e FY15e
Sales (`m) 5,991 8,215 9,653 11,532 13,429
Net Profit (`m) 968 1,356 1,402 1,769 2,146
EPS (`) 8.9 12.5 12.9 16.3 19.8
Growth (%) 22.2 40.2 3.4 26.2 21.3
PE (x) 15.3 10.9 10.6 8.4 6.9
P BV (x) 2.1 2.0 1.9 1.7 1.5
RoE (%) 14.7 18.9 18.8 22.1 24.4
RoCE(%) 10.3 15.5 22.1 25.2 28.1
Dividend Yield (%) 4.4 4.4 5.1 5.8 7.3
Net Gearing (%) (5.1) (8.4) (0.2) 0.4 (7.1)
Source: Company, Anand Rathi Research
Relative price performance
GDPL
Sensex
125
135
145
155
165
Jan-
12
Mar
-12
May
-12
Jul-1
2
Sep-
12
Nov
-12
Jan-
13
Source: Bloomberg
Key data GDPL IN / GATE.BO52-week high / low `160 / `125Sensex / Nifty 19987 / 60573-m average volume US$0.3m Market cap `15bn / US$275mShares outstanding 108.4m
Shareholding pattern (%) Sep ’12 Jun ’12 Mar ’12
Promoters 40.4 40.4 40.4 - of which, Pledged 37.3 37.3 43.8Free Float 59.6 59.6 59.6 - Foreign Institutions 24.1 23.4 27.4 - Domestic Institutions 20.2 20.8 17.4 - Public 15.3 15.4 14.8
Rating: Buy Target Price: `196 Share Price: `135
17 January 2013
Gateway Distriparks
Integrated play on logistics; initiating with Buy
Gateway Distriparks (GD), an integrated logistics company in container freight stations, rail freight and cold storage, is expected to be a key beneficiary of the rising containerization in India. Over FY12-15, its revenue and profit are expected to record CAGR of 17.8% and 16.5% respectively. We recommend Buy with a price target of `196.
CFS business to be the cash cow. In Q2FY13, the slowing global trade hit volumes at its JNPT container freight station (CFS) facility. On the expected revival in EXIM traffic after FY13, its JNPT CFS volumes are expected to record 6% CAGR over FY12-15. We expect 9.6% CAGR in its CFS revenue over FY12-15. Its net profit margin is expected to remain high (~33%) and bring in 66% to profit in FY15 (from 79% at present).
Rail business to normalize soon. India’s largest private container train operator (21 rakes, +700 wagons), GD, plans to add 6-9 rakes in FY13. It has inland container depots (ICD) at Garhi, Ludhiana, Kalamboli and one coming up at Assauti (Faridabad). With new ICDs (and new routes) commencing, we expect its rail volumes to rise. In FY14, profit would rise on pass-through of higher rail-haulage charges. Over FY12-15, we expect 18.4% revenue CAGR from the rail segment.
FDI in retail to benefit subsidiary. Snowman Frozen Foods (SFF), a subsidiary, is engaged in transportation and storage of frozen foods. It has 28,000 pallets, over 100 reefer trucks and operations spanning more than 14 major cities. SFF plans to raise its pallet capacity to 46,000 by end-FY13. This could benefit GD immensely in view of GoI’s recent directive allowing 51% FDI in multi-brand retailing.
Valuation. At our price target, the stock would trade at a P/E of 12x Mar’14 earnings (in line with its last two-year average P/E). Risks. Slowdown in trade, adverse government policies.

17 January 2013 Gateway Distriparks – Integrated play on logistics; initiating with Buy
Anand Rathi Research 27
Quick Glance – Financials and ValuationsFig 1 – Income statement (`m)
Year-end: Mar FY11 FY12 FY13e FY14e FY15e
Net revenues 5,991 8,215 9,653 11,532 13,429 Revenue growth (%) 16.0 37.1 17.5 19.5 16.4 - Op. expenses 3,342 4,527 5,551 6,573 7,655 EBIDTA 1,597 2,484 2,688 3,333 3,908 EBITDA margin (%) 26.7 30.2 27.8 28.9 29.1 - Interest expenses 182 135 174 239 232 - Depreciation 502 628 681 758 824 + Other income 129 144 169 202 235 - Tax 44 508 546 692 841 Effective tax rate (%) 4.2 27.3 27.3 27.3 27.3 Reported PAT 997 1,356 1,456 1,846 2,245 +/- Extraordinary items - - - - -+/- Minority interest (30) - (54) (77) (99)Adjusted PAT 968 1,356 1,402 1,769 2,146 Adj. FDEPS (`/share) 8.9 12.5 12.9 16.3 19.8 Adj. FDEPS growth (%) 22.2 40.2 3.4 26.2 21.3 Source: Company, Anand Rathi Research
Fig 3 – Cash-flow statement (`m) Year-end: Mar FY11 FY12 FY13e FY14e FY15e
PAT 968 1,356 1,402 1,769 2,146 + Non-cash items 455 628 681 758 824 Cash profit 1,422 1,984 2,083 2,527 2,970 - Incr./(Decr.) in WC 369 173 416 113 87 Operating cash-flow 1,054 1,812 1,667 2,414 2,883 - Capex 1,625 973 1,386 1,450 900 Free-cash-flow (572) 838 281 964 1,983 - Dividend 756 755 887 1,013 1,267 + Equity raised 10 50 - - -+ Debt raised (945) (117) 600 400 (500)- Investments (20) (130) - - -- Misc. items 4 (9) - - -Net cash-flow 711 156 (6) 350 216 + Op. cash & bank bal. 795 1,506 1,662 1,656 2,006 Cl. cash & bank bal. 1,506 1,662 1,656 2,006 2,223 Source: Company, Anand Rathi Research
Fig 5 – PE band
3x
6x
9x
12x
15x
0
50
100
150
200
250
Apr-0
8
Aug-
08
Dec
-08
Apr-0
9
Aug-
09
Dec
-09
Apr-1
0
Aug-
10
Dec
-10
Apr-1
1
Aug-
11
Dec
-11
Apr-1
2
Aug-
12
Dec
-12
Source: Bloomberg, Anand Rathi Research
Fig 2 – Balance sheet (`m) Year-end: Mar FY11 FY12 FY13e FY14e FY15e
Share capital 1,080 1,083 1,083 1,083 1,083 Reserves & surplus 5,799 6,395 6,910 7,666 8,545 Net worth 6,879 7,478 7,993 8,749 9,628 Total debt 1,154 1,037 1,637 2,037 1,537 Minority interest 610 663 663 663 663 Def. tax liab. (net) 140 140 140 140 140 Capital employed 11,741 12,276 13,391 14,547 14,926 Net fixed assets 9,825 9,861 10,559 11,251 11,327 Investments 130 310 317 317 317 - of which, Liquid 90 - - - -Net working capital 270 443 859 972 1,059 Cash and bank balance 1,506 1,662 1,656 2,006 2,223 Capital deployed 11,741 12,276 13,391 14,547 14,926 Net debt/Equity (%) (5.1) (8.4) (0.2) 0.4 (7.1)WC days 5.2 15.9 24.6 29.0 27.6 Book value (`/sh) 63.7 69.1 73.8 80.8 88.9 Source: Company, Anand Rathi Research
Fig 4 – Ratio analysis @ `135 Year-end: Mar FY11 FY12 FY13e FY14e FY15e
P/E (x) 15.3 10.9 10.6 8.4 6.9 Cash P/E (x) 10.4 7.5 7.1 5.9 5.0 P/B (x) 2.1 2.0 1.9 1.7 1.5 EV/sales (x) 2.4 1.7 1.5 1.3 1.1 EV/EBITDA (x) 9.0 5.7 5.5 4.5 3.6 RoE (%) 14.7 18.9 18.8 22.1 24.4 RoCE (%) 10.3 15.5 22.1 25.2 28.1 Dividend yield (%) 4.4 4.4 5.1 5.8 7.3 Dividend payout (%) 78.1 55.6 63.2 57.3 59.0 Debt to equity (x) 0.2 0.1 0.2 0.2 0.2 Int Coverage (x) 6.0 13.7 11.5 10.8 13.3 Receivables days 39.8 28.6 35.0 40.0 37.0 Payables days 92.4 57.4 55.0 55.0 52.0 Working capital days 5.2 15.9 24.6 29.0 27.6 Fixed asset T/O (x) 0.6 0.8 0.9 1.1 1.2 Source: Company, Anand Rathi Research
Fig 6 – FY12 revenue break-up
Rail54%
CFS38%
Snowman8%
Source: Company

17 January 2013 Gateway Distriparks – Integrated play on logistics; initiating with Buy
Anand Rathi Research 28
CFS business to be the cash cow Strategic CFS locations advantageous
One of the largest CFS operators in India, GD operates four CFSs (two at Navi Mumbai and one each at Chennai and Vizag). It has recently started operations at its new CFS at Kochi. All its operational CFSs are strategically located near major container ports (JNPT, Chennai and Vizag, which collectively handle ~75% of India’s container traffic), giving it an unparalleled edge over other CFS operators.
Fig 8 – Details about CFS facilities
Location Capacity
(TEUs) Expansion
Expected (TEUs) Remarks
Mumbai (1 & 2) 3 300,000 60,000 Mild capacity addition expected, 150 owned trailers
Chennai 90,000 Scouting for land for expansion
Vizag 50,000 Minor capacity expansion possible
Kochi 50,000 Not yet fully operational
Source: Company
CFS the key contributor to profits so far
JNPT CFS handles more than 65% of the company’s total TEUs. During Q2FY13 volumes handled at the JNPT CFS declined while the ‘dwell time’ at the CFS also came down. Mumbai CFS’ EBIDTA margin declined due to reduced dwell time, in line with one of its larger peers, and is expected to be subdued in FY13. Volumes are expected to pick up in H2FY13 when its Punjab Conware facility would be restored. This would help it provide various value-added services which would, in turn, help improve realisations. We expect EXIM trade to pick up during FY14, adding to volumes in its CFS business at JNPT. Also, planned expansion at JNPT terminal will augur well for CFS operators in the region. We expect volumes at the JNPT CFS to record a 6% CAGR over FY12-15 while revenues are expected to come at a 4% CAGR.
Fig 9 – Volume & realisation trend at JNPT CFS
0
60,000
120,000
180,000
240,000
300,000
FY06
FY07
FY08
FY09
FY10
FY11
FY12
FY13
e
FY14
e
FY15
e
6,000.0
7,000.0
8,000.0
9,000.0
10,000.0
11,000.0
Volume Revenue/TEU (RHS)
(TEUs) (`/TEUs)
Source: Company, Anand Rathi Research
Since its second-largest CFS, at Chennai, has been operating at peak capacity, the company plans to purchase land to raise capacity there. In the past few quarters heavy congestion at Chennai port has led to a slight decline in volumes at GD’s CFS facility. We expect volumes to recover in FY14 and GD to benefit from the same. The company might also look to acquire additional land at Chennai to increase its capacity.
Fig 7 – CFS locations Location Distance from port
Navi Mumbai 15 km from JNPT
Vizag 10 km from Vizag port
15 km of Chennai port Chennai
15 km from Ennore port
Source: Company

17 January 2013 Gateway Distriparks – Integrated play on logistics; initiating with Buy
Anand Rathi Research 29
In Aug’05 GD started operating at Vizag (capacity: 50,000 TEUs) and hiked tariffs during Q1FY13. In volumes (and revenues, realizations as well) this CFS has grown steadily over FY09-FY12 increasing from `3,570/TEU to `5,430/TEU. It operated at peak capacity during FY12, which is expected to continue through FY13. Realisations have risen considerably due to the great degree of congestion, and we expect this to continue. We expect Chennai and Vizag to register 22% CAGR in revenues over FY12-15 due to the high utilization levels, price hikes and longer ‘dwell time’ stemming from congestion.
Also, GD has recently commissioned a CFS at Vallarpadam, near the fast-growing Kochi port, in a 60:40 joint venture with Chakiat Agencies. The Cochin Port Trust has leased 2.58 hectares at Vallarpadam for 30 years. Operations at Kochi have recently commenced and management expects capacity utilization to touch ~80% in the first year itself. Initial capacity at Kochi would be 50,000 TEUs, which the company plans to expand, and towards which it has already acquired land. We expect Kochi terminal to benefit from lesser competition and locational advantage of the facility.
Revenue from CFS to record 9.6% CAGR
The CFS business, which contributed ~38% of revenue and ~79% of profits in FY12, is expected to grow them at 9.6% and 9% CAGR respectively. Cash flows from this segment are expected to be strong, given the commissioning of capacity and no major capex in the pipeline.
Fig 12 – Revenue and growth in CFS
0
900
1,800
2,700
3,600
4,500
FY07
FY08
FY09
FY10
FY11
FY12
FY13
e
FY14
e
FY15
e
-20
-8
4
16
28
40
Revenue Growth (RHS)
(`m) (%)
Source: Company, Anand Rathi Research
Fig 13 – Net profit and margins in CFS
-100
200
500
800
1,100
1,400
FY07
FY08
FY09
FY10
FY11
FY12
FY13
e
FY14
e
FY15
e 25
33
41
49
57
Net profit Margin (RHS)
(`m) (%)
Source: Company, Anand Rathi Research
Fig 10 – TEUs at various CFS
0
80,000
160,000
240,000
320,000
400,000
FY06
FY07
FY08
FY09
FY10
FY11
FY12
FY13
e
FY14
e
FY15
e
Mumbai Chennai Vizag
(TEU)
Source: Company, Anand Rathi Research
Fig 11 – Realisation trend at various CFS
0
3,500
7,000
10,500
14,000FY
06
FY07
FY08
FY09
FY10
FY11
FY12
FY13
e
FY14
e
FY15
e
Mumbai Chennai Vizag
(`/TEU)
Source: Company, Anand Rathi Research

17 January 2013 Gateway Distriparks – Integrated play on logistics; initiating with Buy
Anand Rathi Research 30
Rail business to normalize in FY14 Leading private operator in container rail freight
After the state-run Container Corp. of India, GD is the largest, private, operator in rail freight in India, operating through subsidiary Gateway Rail Freight (GRF). Infrastructure comprises 21 rakes, three operational ICDs (Garhi, Ludhiana and Kalamboli), more than 700 wagons and 1,500 containers.
Fig 14 – Rail business infrastructure Rakes 21
Garhi
Kalamboli
LudhianaICDS / Rail Terminals
Faridabad
Wagons +700
Containers +1,500
Source: Company
At present, all operational ICDs have combined capacity of ~0.2m TEUs, which is expected to go up to ~0.3m by FY13 on the commencement of the Faridabad ICD. Further, the company is planning to have ICDs/rail terminals at other locations across the country.
In addition to running container trains through its own ICDs, GRF uses the container rail terminals (CRT) of the Indian Railways for container loading and unloading. At present, it has 21 rakes and plans to add six to eight rakes in the next two years. GRF now makes 5-6 trips per rake per month. It runs scheduled container trains on five routes as mentioned in fig 15.
Fig 16 – ICD wise capacity Location Train Services Capacity (TEUs) per year Area (acres)
Garhi Services to JNPT, Mundhra, Pipavav; Double stack services to Mundhra and Pipavav, Reefer Services to Kalamboli
120,000 90
Kalamboli Sanand, Jodhpur 75,000 17
Ludhiana Mundhra, JNPT, Pipavav 144,000 57
Faridabad Rail Work in Progress. Expected to scale up capacity to 120,000 by FY14.
50,000 66
Source: Company
Rise in haulage charges to hit profitability in FY13
IR recently increased container-rail-freight charges, to be implemented in two phases (Dec’12 and Feb’13). It has divided the present 20-ton category into two: up to 10 tons and 10-20 tons. It expects to improve viability of rail-freight movement up to 10-ton capacity. Haulage rates for 20-foot-equivalent containers are expected to increase ~31% for containers weighing between 10 and 20 tons, and 16% for containers weighing above that. At present, GD obtains ~15% of its revenue from the 0 to 20-ton category.
GD expects to pass on ~75-80% of the increase in charges to its end-customers. This would have an impact of ~`90m a year on its rail segment EBIDTA.
Fig 15 – Major routes for GD Garhi (NCR) - Kalamboli (Navi Mumbai) - Garhi
Garhi/Ludhiana - JNPT/Mundra - Garhi/Ludhiana
Orissa - NCR/Punjab
Rajasthan - JNPT/Mundra
Surat - Kolkatta/Orissa
Rajasthan - Kolkatta/ Orissa
Source: Company

17 January 2013 Gateway Distriparks – Integrated play on logistics; initiating with Buy
Anand Rathi Research 31
Fig 17 – Rail haulage rates Distance (km) (JNPT- NCR)
Effective date 0-10 tonnes 10-20 tonnes 20-26 tonnes >26 tonnes
Empty container
Empty flat wagons
1351 - 1400 Jan-11 14,672 14,672 18,914 21,196 9,537 8,804
1351 - 1400 1-Dec-12 13,371 17,898 20,514 22,931 11,634 10,739
1351 - 1400 1-Feb-13 14,334 19,188 21,992 24,584 12,472 11,513
1-Dec-12 -9 22 8 8 22 22
1-Feb-13 7 7 7 7 7 7Haulage rate hike (%)
Overall hike -2 31 16 16 31 31
Source: Indian Railway
Sharper focus on EXIM
GD is one of the few private railway operators focused on the high-margin EXIM segment (accounts for ~85% of GD’s turnover). It has successfully managed to turn around its rail-freight business from a loss-making segment in FY11 to a profitable one. GRF brought in ~55% to GD’s FY12 consolidated revenue. Volume growth in this business in 1HFY13 was subdued owing to the general slowdown in trade. We expect trade to pick up during FY14 on account of the improving global economic scenario which would benefit GD’s rail freight business.
The company has started double-stack operations on the Garhi-Mundra and Garhi-Pipavav routes from Oct’11. At present, the proportion of double-stack operations to total operations is less than 5% and is expected to increase in future. The company also plans to set up rail-linked terminal ICDs at Jaipur, Ahmadabad and Nagpur, a domestic rail-linked terminal at Chennai and a bonded rail-linked warehouse at Mundra.
We expect margins in the segment to improve post FY13, following deeper penetration, new routes and pass through of increase in rail haulage charges. Supported by these factors, over FY12-15 we expect GRF to register CAGR of 18.4% in revenue and 21.1% in EBITDA.
GD’s rail freight business will also benefit from the Dedicated freight corridors which are being established by the Indian Railways and the company will be in a strong position to take advantage of the same.
Fig 18 – Volume and volume growth
0
70,000
140,000
210,000
280,000
350,000
FY09
FY10
FY11
FY12
FY13
e
FY14
e
FY15
e
0
20
40
60
80
100
Volume Growth (RHS)
(TEUs) (%)
Source: Company, Anand Rathi Research
Fig 19 – Revenue and growth in its rail freight segment
0
2,000
4,000
6,000
8,000
FY09
FY10
FY11
FY12
FY13
e
FY14
e
FY15
e
-25.00
35.00
95.00
155.00
215.00
Revenue Growth (RHS)
(`m) (%)
Source: Company, Anand Rathi Research

17 January 2013 Gateway Distriparks – Integrated play on logistics; initiating with Buy
Anand Rathi Research 32
Cold chain business to grow rapidly Organized pan-India operator in the segment
In Nov’06, to enter the cold-chain logistics business, GD acquired 50.1% stake in Snowman Frozen Foods (SFF). Subsequently, it raised its stake to 53%. At present, SFF has +19 cold storages in major Indian cities, including Mumbai, Bangalore, Chennai and Hyderabad. Its storage capacity includes 28,000 freezer pallets, 622 chilled pallets and cold warehousing space of over 117,000 sq. ft. Besides, its portfolio includes more than 100 refrigerated trucks, handling over 20,000 tons of goods. GD plans to increase the number of pallets from present levels to 46,000 by end-FY13 and further to 0.1m pallets by FY15.
Marquee clientele & huge opportunity
SFF provides cold storage and transportation solutions for products such as ice cream, dairy products, sea food, fruit and vegetables, poultry, etc. It has several marquee clients—Amul, ITC, Vadilal, Mother Dairy, Pizza Hut, KFC, HUL, Parle Agro, etc. It is one of the largest organized pan-India player in cold storage and cold-chain logistics, currently a `10bn-plus market. According to government estimates, approx. 35% of all fruit and vegetables produced in India is lost for want of storage and transport facilities. This offers sizeable opportunities in cold storage. In efforts to reduce wastage, the govt has supported development on this front by announcing tax breaks on import of refrigeration equipment and on setting-up costs, ultimately leading to reduction in overall costs.
FDI in retail to benefit the segment
The recent announcement by the government of India to allow 51% FDI in retail would benefit the cold chain industry. Increasing orgainsed retail in India would lead to higher demand for frozen foods and transportation. We believe that GD is in a sweet spot to tap the opportunity that would arise upon the implementation of FDI.
Revenue growth to be robust
With the planned increase in capacity by GD and due to increasing demand in the segment we expect revenues in this segment to record a strong growth of 41.9% CAGR over FY12-15. Net profit margins in the segment are expected to remain steady in the range of ~10%.
Fig 20 – Snowman Frozen Foods’ revenue
0
400
800
1,200
1,600
2,000
FY08
FY09
FY10
FY11
FY12
FY13
e
FY14
e
FY15
e
0
12
24
36
48
60
Revenue Growth (RHS)
(`m) (%)
Source: Company, Anand Rathi Research
Fig 21 – Profitability at Snowman Frozen Foods
0
40
80
120
160
200
FY09
FY10
FY11
FY12
FY13
e
FY14
e
FY15
e
0
3
6
9
12
15
Net profit Margins (RHS)
(`m) (%)
Source: Company, Anand Rathi Research

17 January 2013 Gateway Distriparks – Integrated play on logistics; initiating with Buy
Anand Rathi Research 33
Financials With increased container trade leading to better utilisation at its present CFS facilities, rising revenue from its rail segment and greater capacity and demand in the cold-chain business, we expect GD to record 17.8% CAGR in revenues over FY12-15. We expect its net profit to increase from `1.3bn in FY12 to `2.1bn in FY15.
17.8% revenue CAGR over FY12-15; operating margin to be stable
An expected pick-up in EXIM trade during FY14 would benefit GD’s CFS and rail-freight businesses, leading to higher utilisation levels and increasing revenues in its rail segment. Consequent on its higher capacity and implementation of reforms such as FDI in retail, we expect demand in its cold-chain business to rise. We expect it to register a 17.8% CAGR in revenue over FY12-15, with a stable gross profit margin (~42-43%) and an operating margin of ~28-29%.
Return ratios to improve significantly
We expect GD to record a 16.5% CAGR in net profit over FY12-15, with a slight dip in its rail and CFS business margins. Return ratios are expected to improve over FY12-15. Its FY12 RoE was 18.9% and is expected to come at 24.4% in FY15 while its RoCE, which was 15.5% in FY12, is expected to come at 28.1% in FY15.
Fig 22 – Revenue and revenue growth
0
3,500
7,000
10,500
14,000
FY08
FY09
FY10
FY11
FY12
FY13
e
FY14
e
FY15
e
0
20
40
60
80
CFS Rail Snowman Growth (RHS)
(`m) (%)
Source: Company, Anand Rathi Research
Fig 23 – EBITDA margin and gross-profit margin
0
12
24
36
48
60FY
08
FY09
FY10
FY11
FY12
FY13
e
FY14
e
FY15
e
Gross profit margin EBITDA margin
(%)
Source: Company, Anand Rathi Research
Fig 24 – Net profit vs net-profit growth
0
500
1,000
1,500
2,000
2,500
FY08
FY09
FY10
FY11
FY12
FY13
e
FY14
e
FY15
e
-11
0
11
22
33
44
Net profit Growth (RHS)
(`m) (%)
Source: Company, Anand Rathi Research
Fig 25 – Return ratios
5
10
15
20
25
30
FY08
FY09
FY10
FY11
FY12
FY13
e
FY14
e
FY15
e
RoE RoCE
(%)
Source: Company, Anand Rathi Research

17 January 2013 Gateway Distriparks – Integrated play on logistics; initiating with Buy
Anand Rathi Research 34
Fig 26 – Income statement (`m) Year-end: Mar FY11 FY12 FY13e FY14e FY15e Revenue 5,991 8,215 9,653 11,532 13,429 - Op. expenses 2,649 3,687 4,103 4,959 5,775 - Employee Costs 293 385 454 530 618 - Other Administrative 759 818 961 1,096 1,249 EBIDTA 1,597 2,484 2,688 3,333 3,908 - Interest 182 135 174 239 232 - Depreciation 502 628 681 758 824 + Other income 129 144 169 202 235 - Tax 44 508 546 692 841 PAT 997 1,356 1,456 1,846 2,245 + Minority Interests (30) - (54) (77) (99)+ Share of profit from Associates - - - - -Consolidated PAT 968 1,356 1,402 1,769 2,146 Dividend 108 105 887 1,013 1,267 FDEPS (` / share) 8.9 12.5 12.9 16.3 19.8 CEPS (` / share) 13.1 18.3 19.2 23.3 27.4 DPS (` / share) 6.0 6.0 7.0 8.0 10.0 BV (` / share) 63.7 69.1 73.8 80.8 88.9 Shares outstanding 108.0 108.3 108.3 108.3 108.3 Growth Rates Revenue (%) 16.0 37.1 17.5 19.5 16.4 EBIDTA (%) 27.8 55.6 8.2 24.0 17.3 Net PAT (%) 22.2 40.2 3.4 26.2 21.3 Diluted EPS (%) 22.2 40.2 3.4 26.2 21.3 FY12-15e Revenue CAGR(%) 17.8 FY12-15e EBITDA CAGR (%) 16.3 FY12-15e EPS CAGR (%) 16.5 Margins EBIDTA (%) 26.7 30.2 27.8 28.9 29.1 EBIT (%) 18.3 22.6 20.8 22.3 23.0 Net Profit (%) 16.2 16.5 14.5 15.3 16.0
Source: Company, Anand Rathi Research
Fig 27 – Balance sheet (`m) Year-end: Mar FY11 FY12 FY13e FY14e FY15e Sources of Funds Share capital 1,080 1,083 1,083 1,083 1,083 Reserves & surplus 5,799 6,395 6,910 7,666 8,545 Shareholders’ fund 6,879 7,478 7,993 8,749 9,628 Debt 1,154 1,037 1,637 2,037 1,537 Deferred Tax Liab (net) 140 140 140 140 140 Minority interests 610 663 663 663 663 Capital employed 11,741 12,276 13,391 14,547 14,926 Application of Funds Gross Fixed Assets 11,540 12,128 13,528 15,028 16,028 Less: Depreciation 2,210 2,838 3,519 4,277 5,101 Net Fixed Assets 9,329 9,290 10,009 10,751 10,927 Capital Work in Progress 496 571 550 500 400 Investments 130 - - - -Goodwill - 310 317 317 317 Current Assets Debtors 624 664 1,188 1,340 1,383 Loans and Advances 706 909 965 1,096 1,276 Current Liab and Provisions 1,105 1,209 1,413 1,618 1,800 Net Current Assets 1,776 2,105 2,515 2,979 3,282 Working Capital 270 443 859 972 1,059 Cash 1,506 1,662 1,656 2,006 2,223 Capital deployed 11,741 12,276 13,391 14,547 14,926 No. of shares (m) 108.0 108.3 108.3 108.3 108.3 Net Debt/Equity (%) (5.1) (8.4) (0.2) 0.4 (7.1)
Source: Company, Anand Rathi Research

17 January 2013 Gateway Distriparks – Integrated play on logistics; initiating with Buy
Anand Rathi Research 35
Fig 28 – Cash flow statement (`m) Year-end: Mar FY11 FY12 FY13e FY14e FY15e
Consolidated PAT 968 1,356 1,402 1,769 2,146
+ Depreciation 502 628 681 758 824
+ Deferred Tax (47) 0 - - -
+ Other non cash - - - - -
Cash profit 1,422 1,984 2,083 2,527 2,970
- Incr/(Decr) in WC 369 173 416 113 87
Operating cash flow 1,054 1,812 1,667 2,414 2,883
- Capex 1,625 973 1,386 1,450 900
Free cash flow (572) 838 281 964 1,983
- Dividend 756 755 887 1,013 1,267
+ Equity raised (26) (3) - - -
+ Debt raised (945) (117) 600 400 (500)
- Investments (20) (130) - - -
- Misc. items 4 (9) - - -
Net cash flow 711 156 (6) 350 216
+ Opening cash 795 1,506 1,662 1,656 2,006
Closing cash 1,506 1,662 1,656 2,006 2,223
Source: Company, Anand Rathi Research
Fig 29 – Ratio analysis @ `135 Year-end: Mar FY11 FY12 FY13e FY14e FY15e
Valuations
P / E 15.3 10.9 10.6 8.4 6.9
P / BV 2.1 2.0 1.9 1.7 1.5
M Cap / Sales 2.5 1.8 1.5 1.3 1.1
EV / Sales 2.4 1.7 1.5 1.3 1.1
EV / EBIDTA 9.0 5.7 5.5 4.5 3.6
Dividend
Dividend yield (%) 4.4 4.4 5.1 5.8 7.3
Dividend payout (%) 78.1 55.6 63.2 57.3 59.0
Leverage
Net Debt / Equity (5) (8) (0) 0 (7)
Int Coverage 6 14 12 11 13
Return Ratios
ROE (%) 14.7 18.9 18.8 22.1 24.4
ROCE (%) 10.3 15.5 22.1 25.2 28.1
Source: Company, Anand Rathi Research

17 January 2013 Gateway Distriparks – Integrated play on logistics; initiating with Buy
Anand Rathi Research 36
Valuation At our price target of `196, the stock would trade at 12x Mar’14e earnings (in line with its past three-year one-year-forward average). GD’s one-year-forward PE in the past three years has largely ranged between 10x and 14x. At the ruling market price, it trades at PE of 10.6x and 8.4x and EV/EBITDA of 5.5x and 4.5x FY13e and FY14e earnings, respectively. We initiate coverage with a Buy and a price target of `196.
Fig 30 – 12-month-forward PE: Mean and standard deviation
Mean
+1SD
+2SD
-1SD
-2SD
0
5
10
15
20
25
Apr-0
8
Sep-
08
Feb-
09
Jul-0
9
Dec
-09
May
-10
Oct
-10
Mar
-11
Aug-
11
Jan-
12
Jun-
12
Nov
-12
Source: Bloomberg, Anand Rathi Research
Risks
Keener competition in CFS. The increasing competition at Mumbai CFS has led to slight reduction in margins. Any further increase in competition could be negative for the company.
Increase in rail haulage rates. Any increase in rail haulage charges could make road transportation a cheaper mode of transportation as compared to rail.
Slowdown in EXIM. Further slowdown in trade could have a negative effect on the business.

17 January 2013 Gateway Distriparks – Integrated play on logistics; initiating with Buy
Anand Rathi Research 37
Company Overview An integrated logistics operator in India in the CFS, rail-haulage business and the fast-growing cold-chain segment, GD is the country’s largest private container train operator (CTO) and the largest CFS operator in India.
Company background
Promoted by Newsprint Trading & Sales Corp. (NTSC), Windmill International Pvt. Ltd. and Parameswara Holdings as an Indo-Singapore joint venture, Gateway Distriparks was incorporated in 1994 for general and bonded warehousing, handling and clearing of sea-borne EXIM container cargo at Navi Mumbai. Today it is the only logistics facilitator in India with three synergistic verticals capable of being interlinked – container freight stations, inland container depots with rail movement of containers to major maritime ports, and cold-chain storage and logistics.
It operates two CFSs at Navi Mumbai, one at Chennai and one at Visakhapatanam (total capacity: over 600,000 TEUs). Its rail operations are handled by a subsidiary, Gateway Rail Freight, in which The Blackstone Group of the USA has made private equity investment through Blackstone GPV Capital Partners (Mauritius) V-H. The subsidiary provides inter-modal logistics and operates its own ICDs/dry ports. The third vertical consists of cold-chain logistics solutions at 19 locations in India through subsidiary Snowman FF in which Mitsubishi, Nicherei and IFC (International Finance Corp.) of the World Bank are investors. Snowman has all-India operations, offering comprehensive warehousing, transportation and distribution services.
Fig 31 – Revenue break-up (FY12)
Rail54%
CFS38%
Snowman8%
Source: Company
Key management personnel
Chairman, Mr Gopinath Pillai
Deputy Chairman & MD, Mr Prem Kishan Gupta
President Marketing & Operations, Mr Govindarajan Kannan
CEO – Gateway Rail Freight, Vishal Sharma
Dy CEO – Gateway Rail Freight, Sachin Bhanushali

Anand Rathi Shares and Stock Brokers Limited (hereinafter “ARSSBL”) is a full service brokerage and equities research firm and the views expressed therein are solely of ARSSBL and not of the companies which have been covered in the Research Report. This report is intended for the sole use of the Recipient and is to be circulated only within India and to no countries outside India. Disclosures and analyst certifications are present in Appendix Anand Rathi Research India Equities
Dhaval Dama+9122 66266728
India I Equities Logistics
Initiating Coverage
Key financials (YE Mar) CY10 FY12* FY13e FY14e FY15e
Sales (`m) 28,633 42,711 40,706 45,375 51,895 Net Profit (`m) 1,659 2,849 2,178 2,317 2,996 EPS (`) 12.7 21.8 16.7 17.7 22.9 Growth (%) 20.0 71.9 (23.5) 6.4 29.3 PE (x) 10.4 6.1 7.9 7.4 5.8 P BV (x) 1.5 1.2 1.0 0.9 0.8 RoE (%) 16.3 22.3 14.6 14.0 16.1 RoCE(%) 15.3 19.4 12.2 13.1 15.3 Dividend Yield (%) 2.3 1.1 1.5 3.0 3.8 Net Gearing (%) 19.9 42.5 36.0 23.8 9.3 Source: Company, Anand Rathi Research *FY12 period is 15m
Relative price performance
AGLL
Sensex
100
115
130
145
160
Jan-
12
Mar
-12
May
-12
Jul-1
2
Sep-
12
Nov
-12
Jan-
13
Source: Bloomberg
Key data AGLL IN / ACLL.BO52-week high / low `156 / `108Sensex / Nifty 19987 / 60573-m average volume US$0.1m Market cap `17bn / US$311mShares outstanding 130.5m
Shareholding pattern (%) Sep ’12 Jun ’12 Mar ’12
Promoters 72.1 71.5 69.8 - of which, Pledged - - -Free Float 27.9 28.5 30.2 - Foreign Institutions 10.8 10.2 11.2 - Domestic Institutions 0.2 0.5 0.8 - Public 16.9 17.8 18.2
Rating: Hold Target Price: `159 Share Price: `132
17 January 2013
Allcargo Logistics
P&E business overhang; initiating with Hold
Allcargo Logistics (ACL), the second-largest CFS operator in India with major operations at JNPT (Mumbai) and Chennai, is also No. 2 NVOCC (non-vessel-owning container consolidator) globally. It recently commissioned a new CFS at JNPT and added equipment to its project-equipment (P&E) division. The company would benefit from improved capex cycle and trade volumes in FY14, and post CAGR of 6.7% in revenue and 1.7% in net profit in FY12-15 (FY12 period was 15 months). We initiate coverage with Hold and TP of `159.
Major player in CFS, NVOCC. ACL is the second-largest CFS operator in India with facilities at JNPT, Mundra (Gujarat) and Chennai. Commissioning of the new CFS at JNPT has raised its capacity to 0.44m TEUs. It is also second largest in NVOCC globally, which gives competitive edge in the CFS business. With expected recovery in trade volumes during FY14, revenues in the CFS and NVOCC segments are expected to post CAGR of 4.2% and 8.3%, respectively, over FY12-15.
P&E orderbook cause for concern. Over CY07-FY12, ACL invested ~`8.5bn in its P&E division. Its current order book in this division, at `2bn, however offers low revenue visibility for FY14. We expect order inflows in this segment to pick up in FY14, but await further clarity.
Cash flow generation to improve. During CY07-FY12, ACL invested `18bn across businesses, and does not intend to undertake any major capex in FY12-15. With the commissioning of new CFS at JNPT and reduced capex, cash-flow generation is expected to improve over FY12-15. We estimate FCF of ~`7.6bn in FY12-15 and higher return ratios (RoE up from 14.6% in FY13 to 16.1% in FY15).
Valuation. At our price target, the stock would trade at a P/E of 9x and a P/BV of 1.1x FY15e earnings. Risks. Slowdown in the global economy, increasing competition.

17 January 2013 Allcargo Logistics – P&E business overhang; initiating with Hold
Anand Rathi Research 39
Quick Glance – Financials and ValuationsFig 1 – Income statement (`m)
Year-end: Mar CY10 FY12* FY13e FY14e FY15e
Net sales 28,633 42,711 40,706 45,375 51,895Sales growth (%) 38.9 49.2 (4.7) 11.5 14.4- Op. expenses 20,063 28,580 27,517 30,583 34,873EBIDTA 2,718 5,203 4,722 5,309 6,124EBITDA margins (%) 9.5 12.2 11.6 11.7 11.8- Interest 194 683 674 714 648- Depreciation 550 1,337 1,686 1,796 1,838+ Other income 266 534 536 274 313- Tax 480 734 580 615 790Effective tax rate (%) 21.4 19.8 20.0 20.0 20.0Reported cons. PAT 1,759 2,977 2,318 2,459 3,161+/- Extraordinary items (0) (4) - - -+/- Minority interest (100) (141) (140) (142) (165)Adjusted cons. PAT 1,659 2,849 2,178 2,317 2,996Adj. FDEPS (`/share) 12.7 21.8 16.7 17.7 22.9Adj. FDEPS growth (%) 20.0 71.9 (23.5) 6.4 29.3Source: Company, Anand Rathi Research *FY12 period is 15m
Fig 3 – Cash-flow statement (`m) Year-end: Mar CY10 FY12* FY13e FY14e FY15e
Consolidated PAT 1,659 2,845 2,178 2,317 2,996 + Non-cash items 779 1,682 1,856 1,796 1,838 Cash profit 2,438 4,527 4,035 4,113 4,833 - Incr./(Decr.) in WC (200) 1,743 807 1,270 1,518 Operating cash-flow 2,638 2,784 3,228 2,842 3,316 - Capex 4,654 7,906 1,104 600 80 Free-cash-flow (2,016) (5,121) 2,124 2,242 3,236 - Dividend 459 226 261 522 653 + Equity raised 139 49 (6) - -+ Others 789 468 (53) (89) (111)+ Debt raised 1,733 3,901 500 (500) (950)- Investments (349) (821) 1,500 - -Net cash-flow 513 (86) 804 1,131 1,522 + Opening cash 916 1,430 1,344 2,148 3,279 Closing cash 1,430 1,344 2,148 3,279 4,801 Source: Company, Anand Rathi Research *FY12 period is 15m
Fig 5 – PE band
2x
4x
6x
8x
10x
0
50
100
150
200
250
Apr-0
8
Aug-
08
Dec
-08
Apr-0
9
Aug-
09
Dec
-09
Apr-1
0
Aug-
10
Dec
-10
Apr-1
1
Aug-
11
Dec
-11
Apr-1
2
Aug-
12
Dec
-12
Source: Bloomberg, Anand Rathi Research
Fig 2 – Balance sheet (`m) Year-end: Mar CY10 FY12* FY13e FY14e FY15e
Share capital 261 261 255 255 255 Reserves & surplus 11,539 14,629 16,502 18,208 20,440 Shareholders’ fund 11,812 14,899 16,757 18,463 20,695 Debt 3,778 7,678 8,178 7,678 6,728 Minority interests 262 311 311 311 311 Deferred Tax Liab (net) 408 753 923 923 923 Capital employed 16,260 23,642 26,169 27,375 28,657 Net Fixed assets 12,042 18,610 18,028 16,832 15,074 Investments 1,319 498 1,998 1,998 1,998 - of which liquid 1,319 498 1,998 1,998 1,998 Working capital 1,447 3,189 3,996 5,267 6,784 Cash 1,430 1,344 2,148 3,279 4,801 Capital deployed 16,260 23,642 26,169 27,375 28,657 Net Debt/Equity (%) 19.9 42.5 36.0 23.8 9.3 W C turn (days) 19.7 19.8 32.2 37.3 42.4 Book Value (`/share) 90.4 114.1 128.4 141.4 158.5 Source: Company, Anand Rathi Research *FY12 period is 15m
Fig 4 – Ratio analysis @ `132 Year-end: Mar CY10 FY12* FY13e FY14e FY15e
P/E (x) 10.4 6.1 7.9 7.4 5.8Cash P/E (x) 7.1 3.8 4.5 4.2 3.6 P/B (x) 1.5 1.2 1.0 0.9 0.8 EV/sales (x) 0.6 0.5 0.5 0.4 0.3 EV/EBITDA (x) 6.3 4.0 4.0 3.3 2.5 RoE (%) 16.3 22.3 14.6 14.0 16.1 RoCE (%) 15.3 19.4 12.2 13.1 15.3 Dividend yield (%) 2.3 1.1 1.5 3.0 3.8 Dividend payout (%) 27.6 8.0 14.0 26.4 25.5 Debt to equity (x) 0.3 0.6 0.5 0.4 0.3 Int Coverage (x) 11.1 5.7 4.5 4.9 6.6 Receivables days 31.1 26.1 37.0 40.0 42.0 Payables days 60.6 52.1 65.0 65.0 60.0 Working capital days 19.7 19.8 32.2 37.3 42.4 Fixed asset T/O (x) 3.5 3.8 3.0 3.5 4.5 Source: Company, Anand Rathi Research *FY12 period is 15m
Fig 6 – FY12 revenue break-up
MTO80%
P&E12%
CFS8%
Source: Company

17 January 2013 Allcargo Global – P&E business overhang; initiating with Hold
Anand Rathi Research 40
Major player in CFS and NVOCC Second-largest CFS operator in India
During 2003, ACL commenced its CFS operations at JNPT. CFS and ICD operations of the company encompass import/export cargo stuffing and de-stuffing, customs clearance and other related ancillary services to both importers and exporters. It is the second largest CFS operator in the country with capacity of 441,000 TEUs per annum.
In the past three years, the company has entered into joint ventures with Hind terminal at Kheda and Concor at Dadri, to establish ICDs. The one at Dadri commenced operations in Nov’11. ACL’s installed capacity for ICDs is 88,000 TEUs per annum.
JNPT CFS to drive revenue growth
JNPT is India’s busiest port, handling ~55% of its container traffic. It handles a huge amount of import volumes which have a higher dwell time, 12-14 days, compared with 2-4 days for exports. Hence, imported containers command higher margins for CFS operators. ACL’s CFS at JNPT has been operating at ~90% utilisation and mostly handling containers which are imported. It currently has a market share of ~5% at JNPT for the CFS volumes.
To obtain a higher share in CFS volumes at JNPT, the company recently commissioned a 0.1m TEU capacity there in JV with Trans India Logistics. The new CFS capacity spans 46 acres and offers scope for expansion by a further ~0.1m TEUs. ACL incurred capex of ~`1.2bn on this. Utilisation levels for the new CFS capacity at Mumbai are expected to be ~50-60% during FY14, rising to 100% in FY15. Combined revenues from the CFSs at JNPT are expected to record an 8.1% CAGR over FY12-15, while EBIDTA margin is expected to be ~50%.
ACL also operates CFS facilities at Chennai and Mundra at utlisation of ~75% and 50%, respectively, which are expected to remain at the same levels in FY13. Margins during 1HFY13 have declined to ~25% at Mundra CFS owing to the slowdown in trade and are expected to remain at the same levels for FY13. Volumes at Chennai and Mundra are expected to pick up with recovery in trade.
CFS business key contributor to EBIDTA
During FY12 (15 months), the CFS business of the company brought in ~7.9% of revenues and ~32% of EBIDTA, with 52% EBIDTA margin. On the establishment of the new CFS capacity at Mumbai, the share of revenue from the CFS business is expected to increase in FY14 to 8% after a slight decline during FY13. EBIDTA margin of the expanded CFS business is expected to slip during FY13 on account of the current slowdown and increasing competition at JNPT. Margin is expected to hold within the range of ~45-47% through FY12-15.
We expect a pick-up in EXIM trade during FY14 which would lead to higher containerisation and would benefit the company. In FY12-15, volumes and revenues in CFS are expected to increase at a CAGR of 3.6% and 4.3% respectively.
Fig 7 – Location wise CFS capacity break up Location CFS Capacity (TEU)
JNPT 144,000
New CFS - JNPT 100,000
Chennai 120,000
Mundra 77,000
Total 441,000
Source: Company

17 January 2013 Allcargo Global – P&E business overhang; initiating with Hold
Anand Rathi Research 41
Fig 8 – CFS business, location-wise CY08 CY09 CY10 15MFY12 FY13e FY14e FY15e
JNPT
Capacity (TEU) 144,000 144,000 144,000 168,000 144,000 144,000 144,000
Volume handled (TEU) 107,831 131,877 123,194 149,726 126,720 129,600 132,480
% growth (13.8) 22.3 (6.6) 21.5 (15.4) 2.3 2.2
Revenue/TEU (`/TEU) 9,899 9,761 13,064 13,193 13,325 13,591 13,863
Revenue (`m) 1,067 1,287 1,609 1,975 1,689 1,761 1,837
EBIDTA margin (%) 61% 57% 60% 60% 50% 52% 52%
JNPT New
Capacity (TEU) 100,000 100,000 100,000
Volume handled (TEU) 10,000 50,000 70,000
% growth - 400 40
Revenue/TEU (`/TEU) 9,090 9,272 9,457
Revenue (`m) 91 464 662
EBIDTA margin (%) 50% 52% 52%
Chennai
Capacity (TEU) 120,000 120,000 120,000 120,000 120,000 120,000 120,000
Volume handled (TEU) 48,386 73,378 90,056 108,991 90,000 92,400 96,000
% growth 17.5 51.7 22.7 21.0 (17.4) 2.7 3.9
Revenue/TEU (`/TEU) 7,196 7,263 9,321 9,310 9,636 9,829 10,025
Revenue (`m) 348 533 839 1,015 867 908 962
EBIDTA margin (%) 47% 41% 44% 43% 42% 42% 42%
Mundra
Capacity (TEU) 77,000 77,000 77,000 77,000 77,000 77,000 77,000
Volume handled (TEU) 17,634 21,542 34,371 44,549 35,420 38,500 38,500
% growth 42.0 22.2 59.6 29.6 (20) 9 -
Revenue/TEU (`/TEU) 5,659 6,142 8,414 8,624 8,797 9,060 9,332
Revenue (`m) 100 132 289 384 312 349 359
EBIDTA margin (%) 23% 28% 36% 34% 25% 25% 27%
Source: Company, Anand Rathi Research
Dominance in NVOCC a boon for CFS
The MTO segment involves NVOCC operations related to less-than-a-container-load (LCL) consolidation and full-container-load (FCL) forwarding in India and across the world through ECU Line, its wholly-owned subsidiary. ACL is the second-largest NVOC consolidator in the world. ECU Line has a network in 62 countries, with 142 offices and nearly 200 agents and franchisees. The company’s strong relations with major shipping lines across the globe help it getting business for its CFS segment - as indicated by the strong utilisation levels at its CFS capacities.
Fig 9 – MTO business model – helping CFS
NVOCC consolidator
Shipping line
Being the second largest CFS operator ACGL can
generate business for CFS facilities
A shipping line decides at which CFS facility a container is stored
CFS 1
CFS 2
CFS 3
CFS 4
Exporter 1
Exporter 2
Exporter 3
Exporter 4
Source: Company

17 January 2013 Allcargo Global – P&E business overhang; initiating with Hold
Anand Rathi Research 42
Revenue diversification in MTO business
ACL’s MTO business is widespread, helping in risk diversification as it can withstand decline in container trade in a particular region. Major revenue streams are from India, Europe, Far East and North and South America.
Fig 10 – Regional revenue break-up trend
0
9,000
18,000
27,000
36,000
45,000
CY0
8
CY0
9
CY1
0
15M
FY12
India Africa AmericaFar East Australia & New Zealand EuropeMediterrean
(`m)
Source: Company
Asset light NVOCC business major contributor to revenues
ACL’s MTO business which is an asset light model bought in ~80% of FY12 revenues. We believe that with increasing volumes in the business segment, would lead to increase in operating leverage for ACL resulting in higher margins in the segment. The company is also on the lookout to acquire new companies in the segment and also plans to increase its stake in certain subsidiaries of ECU line.
Despite the current slowdown across the globe, especially in Europe, ACL has managed to register a slight uptick in volume growth in its NVOCC segment during 1HFY13. Volume growth in the NVOCC segment is expected to be subdued in FY13 and recover in FY14, following various economic measures by European countries leading to recovery in the region. We expect revenues in this segment to register an 8.3% CAGR over FY12-15.
Fig 11 – Revenue & revenue growth
0
9,000
18,000
27,000
36,000
45,000
CY0
8
CY0
9
CY1
0
15M
FY12
FY13
e
FY14
e
FY15
e
-20
-5
10
25
40
55
Revenue Growth (RHS)
(`m) (%)
Source: Company, Anand Rathi Research

17 January 2013 Allcargo Global – P&E business overhang; initiating with Hold
Anand Rathi Research 43
P&E order inflows cause concern Significant amount invested
ACL’s project and engineering (P&E) solutions division provides integrated end-to-end project engineering and logistic services through a diverse fleet of owned/rented special equipment like cranes, hydraulic axles, barges to carry ODC/OWC cargo as well as project engineering solutions across various sectors. The company has invested ~`8.5bn in the segment and also acquired MHTC for a consideration of `200m. ACL also has a strategic alliance with Mammoet, world‘s leading tailor-made heavy lifting and multimodal transport solutions specialist. This has helped ACL become one of the top three key infrastructure logistics companies in India and a one-stop-shop for many of the large Indian conglomerates.
Fig 13 – Equipment list for P&E business (nos.) CY10 FY12
Trailers 425 497
Cranes 115 148
Forklifts 66 57
Reach Stackers 29 36
Prime Mover 4 11
Hydraulic Axles 52 182
Barges 0 1
Girder Bridge 0 1
Source: Company
Current order book a concern
P&E has an order book of `2bn which would be executed by FY13 end. It is in the process of bidding for certain orders to the tune of ~`1bn. Management expects a recovery in the capex cycle across various industries such as oil & gas, metals & mining, power, etc., in FY14, and believes that the company would be in a strong position to benefit. We, however, expect revenue growth in the P&E division to be subdued and await improvement in order flows over FY12-15 due to low visibility on order book, while EBIDTA margin in the segment is estimated at ~30%.
Fig 14 – Revenue and revenue growth
0
1,100
2,200
3,300
4,400
5,500
CY0
8
CY0
9
CY1
0
15M
FY12
FY13
e
FY14
e
FY15
e
-80
30
140
250
360
470
Revenue Growth (RHS)
(`m) (%)
Source: Company, Anand Rathi Research
Fig 12 – Crane deployment
Wind Energy34%
Infrastructure21%
Engineering19%
Port & CFS3%
Thermal Power
5%
Others9%
Oil & gas9%
Source:

17 January 2013 Allcargo Global – P&E business overhang; initiating with Hold
Anand Rathi Research 44
Strong cash-flow generation In the past five years, the company has invested ~`18bn in various businesses including its new, capex-intensive, P&E business. With increasing revenues from the high-cash-flow-generating CFS segment and with capex in P&E coming down, we expect the company to generate FCF of `2.2bn and `3.2bn in FY14 and FY15, respectively. It will incur capex of ~`500-600m in FY14 for its various businesses.
Fig 15 – FCF v/s debt
-6,000
-4,000
-2,000
0
2,000
4,000
CY0
8
CY0
9
CY1
0
15M
FY12
FY13
e
FY14
e
FY15
e
FCF Debt
(`m)
Source: Company, Anand Rathi Research
Return ratios to improve post FY13
The NVOCC business operated at EBIT margins of 4-5% over CY06-10. EBIT margin in the segment improved considerably during FY12, to 6%, and is expected to come at ~6.0% over FY12-15. The high-margin CFS business, which has low asset turnover, generates high RoCE. EBIT margins in the segment over CY06-FY12 have been 45-55%. We expect margins in the CFS segment to decline slightly. P&E division has a low asset turnover of ~0.5x and EBIDTA margins of ~30-35%, resulting in lower RoCE. We believe that the company would not invest heavily in its P&E division. Return ratios for FY13 are expected to decline owing to the 15-month period for FY12, which resulted in higher profits. RoE is expected to improve from 14.6% in FY13 to 16.1% in FY15 owing to lower contribution from P&E business, while RoCE is expected to improve from 12.2% in FY13 to 15.3% in FY15.
Fig 16 – Segment-wise revenues
0
15,000
30,000
45,000
60,000
CY0
8
CY0
9
CY1
0
15M
FY12
FY13
e
FY14
e
FY15
e
MTO CFS P&E Others
(`m)
Source: Company, Anand Rathi Research

17 January 2013 Allcargo Global – P&E business overhang; initiating with Hold
Anand Rathi Research 45
Financials On commencement of the new JNPT CFS and expected improvement in EXIM trade, we expect ACL’s revenue to register 6.7% CAGR over FY12-15 (FY12 period 15m). We expect its net profit to increase from `2.8bn in FY12 (15m) to `3bn in FY15.
6.7% revenue CAGR over FY12-15; operating margins to improve
On the gradual pick-up in EXIM trade and commencement of its JNPT CFS, we expect ACL to register a 6.7% CAGR in revenue over FY12-15. With the increasing share of revenue from the high-margin CFS business, its EBIDTA margin is expected to improve from 11.6% currently to 11.8% in FY15.
Net profit over FY12-15 at 1.7% CAGR
We expect 1.7% CAGR in net profit over FY12-15, as FY12 was for a duration of 15 months. Net profit margin is expected at ~5.5-6%. Return ratios are expected to improve over FY12-15. RoE was 22.3% in FY12 (15 months) and is expected to come at 16.1% in FY15 while its RoCE, which was 19.4% in FY12, is expected to come at 15.3% in FY15.
Fig 19 – Net profit vs net profit growth
0
500
1,000
1,500
2,000
2,500
3,000
CY0
8
CY0
9
CY1
0
15M
FY12
FY13
e
FY14
e
FY15
e
-40
-20
0
20
40
60
80
Net profit Growth (RHS)
(`m) (%)
Source: Company, Anand Rathi Research
Fig 20 – Return ratios
10
12
14
16
18
20
22
24
CY0
8
CY0
9
CY1
0
15M
FY12
FY13
e
FY14
e
FY15
e
RoE RoCE
(%)
Source: Company, Anand Rathi Research
Fig 17 – Revenue and revenue growth
0
10,000
20,000
30,000
40,000
50,000
CY0
8
CY0
9
CY1
0
15M
FY12
FY13
e
FY14
e
FY15
e
-15
0
15
30
45
60
Revenue Growth (RHS)
(`m) (%)
Source: Company, Anand Rathi Research
Fig 18 – EBITDA margin and gross-profit margin
9
10
11
12
13
CY0
8
CY0
9
CY1
0
15M
FY12
FY13
e
FY14
e
FY15
e
29
31
33
35
37
EBIDTA margin Gross Profit margin (RHS)
(%) (%)
Source: Company, Anand Rathi Research

17 January 2013 Allcargo Global – P&E business overhang; initiating with Hold
Anand Rathi Research 46
Fig 21 – Income statement (`m) Year-end: Mar CY10 15MFY12 FY13e FY14e FY15e Revenue 28,633 42,711 40,706 45,375 51,895 - Op. expenses 8,570 14,132 13,189 14,792 17,021 - Employee Costs 3,973 6,104 5,699 6,398 7,369 - Other Administrative 1,879 2,825 2,768 3,085 3,529 EBIDTA 2,718 5,203 4,722 5,309 6,124 - Interest 194 683 674 714 648 - Depreciation 550 1,337 1,686 1,796 1,838 + Other income 266 534 536 274 313 - Tax 480 734 580 615 790 PAT 1,759 2,977 2,318 2,459 3,161 + Minority Interests (100) (141) (140) (142) (165)Consolidated PAT 1,659 2,845 2,178 2,317 2,996 Dividend 178 204 305 611 764 FDEPS (` / share) 12.7 21.8 16.7 17.7 22.9 CEPS (` / share) 18.6 34.8 29.6 31.5 37.0 DPS (` / share) 3.0 1.5 2.0 4.0 5.0 BV (` / share) 90.4 114.1 128.4 141.4 158.5 Shares outstanding 130.7 130.5 130.5 130.5 130.5 Growth Rates Revenue (%) 38.9 49.2 (4.7) 11.5 14.4 EBIDTA (%) 24.0 91.5 (9.3) 12.4 15.3 Net PAT (%) 27.7 71.5 (23.4) 6.4 29.3 Diluted EPS (%) 22.1 71.6 (23.4) 6.4 29.3 FY12-15e Revenue CAGR (%) 6.7 FY12-15e EBITDA CAGR (%) 5.6 FY12-15e EPS CAGR (%) 1.7 Margins EBIDTA (%) 9.5 12.2 11.6 11.7 11.8 EBIT (%) 7.6 9.1 7.5 7.7 8.3 Net Profit (%) 5.8 6.7 5.4 5.1 5.8
Source: Company, Anand Rathi Research
Fig 22 – Balance sheet (`m) Year-end: Mar CY10 15MFY12 FY13e FY14e FY15e Sources of Funds Share capital 261 261 255 255 255 Reserves & surplus 11,539 14,629 16,502 18,208 20,440 Shareholders’ fund 11,812 14,899 16,757 18,463 20,695 Debt 3,778 7,678 8,178 7,678 6,728 Deferred Tax Liab (net) 408 753 923 923 923 Minority interests 262 311 311 311 311 Capital employed 16,260 23,642 26,169 27,375 28,657 Application of Funds Gross Fixed Assets 10,429 16,952 18,552 19,252 19,432 Less: Depreciation 2,338 3,818 5,505 7,300 9,138 Net Fixed Assets 8,091 13,134 13,048 11,952 10,294 Capital Work in Progress 559 897 500 400 300 Investments 1,319 498 1,998 1,998 1,998 Goodwill 3,391 4,580 4,480 4,480 4,480 Current Assets Inventories 70 125 154 194 232 Debtors 2,528 3,575 4,677 5,268 6,675 Loans and Advances 3,159 3,715 4,681 5,218 5,968 Current Liab and Provisions 4,396 4,650 5,982 5,926 6,654 Net Current Assets 2,876 4,533 6,144 8,545 11,585 Working Capital 1,447 3,189 3,996 5,267 6,784 Cash 1,430 1,344 2,148 3,279 4,801 Capital deployed 16,260 23,642 26,169 27,375 28,657 Net Debt/Equity (%) 19.9 42.5 36.0 23.8 9.3
Source: Company, Anand Rathi Research

17 January 2013 Allcargo Global – P&E business overhang; initiating with Hold
Anand Rathi Research 47
Fig 23 – Cash flow statement (`m) Year-end: Mar CY10 15MFY12 FY13e FY14e FY15e
Consolidated PAT 1,659 2,845 2,178 2,317 2,996
+ Depreciation 550 1,337 1,686 1,796 1,838
+ Deferred Tax 229 345 170 - -
+ Other non cash - - - - -
Cash profit 2,438 4,527 4,035 4,113 4,833
- Incr/(Decr) in WC (200) 1,743 807 1,270 1,518
Operating cash flow 2,638 2,784 3,228 2,842 3,316
- Capex 4,654 7,906 1,104 600 80
Free cash flow (2,016) (5,121) 2,124 2,242 3,236
- Dividend 459 226 261 522 653
+ Equity raised 11 (0) (6) - -
+ Others 789 468 (53) (89) (111)
+ Debt raised 1,733 3,901 500 (500) (950)
- Investments (349) (821) 1,500 - -
- Misc. items 23 (23) - - -
Net cash flow 513 (86) 804 1,131 1,522
+ Opening cash 916 1,430 1,344 2,148 3,279
Closing cash 1,430 1,344 2,148 3,279 4,801
Source: Company, Anand Rathi Research
Fig 24 – Ratio analysis @ `132 Year-end: Mar CY10 15MFY12 FY13e FY14e FY15e
Valuations (x)
P / E 10.4 6.1 7.9 7.4 5.8
P / BV 1.5 1.2 1.0 0.9 0.8
M Cap / Sales 0.6 0.4 0.4 0.4 0.3
EV / Sales 0.6 0.5 0.5 0.4 0.3
EV / EBIDTA 6.3 4.0 4.0 3.3 2.5
Dividend (%)
Dividend yield 2.3 1.1 1.5 3.0 3.8
Dividend payout 27.6 8.0 14.0 26.4 25.5
Leverage
Net Debt / Equity (%) 20 43 36 24 9
Int Coverage (x) 11 6 5 5 7
Return Ratios (%)
ROE 16.3 22.3 14.6 14.0 16.1
ROCE 15.3 19.4 12.2 13.1 15.3
Source: Company, Anand Rathi Research

17 January 2013 Allcargo Global – P&E business overhang; initiating with Hold
Anand Rathi Research 48
Valuation At our price target of `159, the stock would trade at 9x Mar’14e earnings (in line with its past two-year one-year-forward average). ACL’s one-year-forward PE in the past three years has largely ranged between 9x and 11x. At the current market price of `132, the stock trades at PE of 7.9x and 7.4x FY13e and FY14e earnings respectively and EV/EBITDA of 4x and 3.3x. We initiate coverage with a Hold recommendation and a price target of `159.
Fig 25 – 12-month-forward PE: Mean and standard deviation
Mean
+1SD
+2SD
-1SD
-2SD
0
2
4
6
8
10
12
14
16
18
20
Apr-0
8
Sep-
08
Feb-
09
Jul-0
9
Dec
-09
May
-10
Oct
-10
Mar
-11
Aug-
11
Jan-
12
Jun-
12
Nov
-12
Source: Bloomberg, Anand Rathi Research
Risks
Rising competition in CFS. Increasing competition at Mumbai CFS has led to slight reduction in margins. Any further increase in competition could be negative for the company.
Slowdown in capex cycle. Delayed pick up in capex cycle would have a negative effect on the P&E segment of the company.
Slowdown in world trade. Further slowdown in trade could have a negative effect on the business.

17 January 2013 Allcargo Global – P&E business overhang; initiating with Hold
Anand Rathi Research 49
Company Overview In the Indian logistics sector, ACL is a leading operator, providing services in CFS, NVOCC and project & engineering logistics.
Background
ACL is in the CFS business and operates such facilities at JNPT, Chennai and Mundra. It is the second-largest NVOCC in the world, focusing on LCL consolidation. It has 140 offices in 62 countries and is supported by an even larger network of franchisees across the world. It is also involved in project & engineering logistics and has several marquee clients in this segment.
Fig 26 – Revenue breakdown – FY12
MTO80%
P&E12%
CFS8%
Source: Company
Key management personnel Chairman and managing director - Shashi Kiran Shetty
Executive director - Adarsh Hegde
Director, Umesh Shetty
Director (Finance), S. Suryanarayanan

17 January 2013 India Logistics – Improving economic backdrop & reasonable valuations
Anand Rathi Research 50
Annexure – Cargo Traffic at Major ports FY01 FY02 FY03 FY04 FY05 FY06 FY07 FY08 FY09 FY10 FY11 FY12
Crude + Petroleum products (m tons)
Calcutta 3.7 2.7 4.2 5.2 5.5 4.9 5.2 4.5 3.4 0.7 0.9 0.7 Haldia 10.6 11.3 12.2 15.0 16.5 17.7 18.1 17.8 16.9 9.3 9.7 7.9 Paradip 2.2 2.0 1.9 1.4 0.8 0.9 1.4 1.7 4.8 11.6 12.8 15.1 Vishakapatnam 18.3 18.6 16.9 17.4 14.6 16.9 18.2 19.8 19.8 18.3 19.3 18.4 Ennore - - - 0.1 0.2 0.2 0.3 0.4 0.4 - 0.5 0.5 Chennai 8.9 8.5 8.9 9.2 11.7 13.1 13.0 12.8 13.1 13.4 14.0 13.3 Tuticorin 0.5 0.4 0.5 0.6 0.7 0.8 0.7 0.5 0.5 0.5 0.7 0.8 Cochin 9.7 8.6 9.4 10.0 10.3 9.6 10.5 11.3 10.5 12.0 12.1 14.0 New Mangalore 10.9 9.9 13.5 18.0 21.4 22.4 21.9 21.8 21.3 21.3 21.6 22.2 Mormugoa 1.1 1.2 1.1 1.3 1.0 0.8 0.8 0.9 0.9 1.0 0.9 0.9 Mumbai 15.6 15.7 16.0 18.6 19.4 27.8 32.2 37.1 34.4 34.6 33.2 33.3 JNPT 1.8 1.7 1.9 1.9 2.5 2.5 2.6 2.2 4.6 5.1 5.0 5.1 Kandla 25.1 22.7 23.0 23.6 22.1 24.3 29.7 38.2 45.5 47.2 48.4 46.9 All Ports 108.3 103.3 109.6 122.2 126.4 142.1 154.3 168.9 176.1 175.5 179.2 179.3
Iron Ore (m tons)
Calcutta - - - 0.0 0.0 0.1 0.2 0.5 0.3 0.8 0.1 0.5 Haldia 0.4 1.8 2.7 3.8 5.4 7.9 8.3 9.8 8.7 7.7 6.0 3.9 Paradip 3.0 3.5 4.7 5.9 9.1 10.3 11.9 13.0 14.3 16.2 13.9 6.6 Vishakapatnam 9.3 9.2 10.4 12.4 16.6 16.2 14.7 18.7 17.5 18.1 19.3 16.2 Ennore - - - 0.5 0.5 1.7 2.2 1.1 0.9 - 0.4 -Chennai 7.0 7.4 7.9 8.4 9.6 9.5 10.5 10.8 8.4 7.9 2.3 0.1 Tuticorin - 0.0 - - 0.0 - - - - 0.0 0.1 0.0 Cochin - - - - - - - - 0.0 - - -New Mangalore 5.1 5.8 6.1 5.4 10.3 9.3 6.2 9.3 9.8 7.1 3.7 3.0 Mormugoa 15.7 18.0 18.7 22.9 24.7 25.3 26.7 27.3 33.8 40.6 40.6 29.4 Mumbai - - - - - - - - - - - -JNPT - - - - - - - - - - - -Kandla - - - - - 0.0 0.2 0.4 0.1 0.7 0.6 1.0 All Ports 40.5 4.5 50.6 58.8 76.2 79.2 80.6 92.0 94.0 99.9 87.1 60.6
Fertilizer finished (m tons)
Calcutta - - - - - - - - - 0.0 0.0 0.0 Haldia 0.2 0.3 0.4 0.2 0.2 0.3 0.4 0.4 0.3 0.2 0.3 0.2 Paradip - - - - - - 0.1 0.1 0.2 0.1 0.2 0.3 Vishakapatnam 0.8 1.0 0.7 0.8 1.4 3.0 2.6 3.3 3.4 2.9 3.3 3.7 Ennore - - - - - - - - - - - -Chennai 0.5 0.5 0.4 0.4 0.6 0.7 0.7 0.6 0.5 0.4 0.4 0.4 Tuticorin 0.3 0.3 0.1 0.2 0.3 0.5 0.7 1.1 1.1 1.2 1.2 1.1 Cochin 0.0 0.1 0.1 0.1 0.1 0.1 0.1 0.1 0.2 0.1 0.1 0.1 New Mangalore 0.2 0.2 0.2 0.2 0.4 0.7 1.0 0.8 0.9 0.8 0.8 0.8 Mormugoa 0.1 0.2 0.2 0.1 0.2 0.2 0.2 0.2 0.2 0.1 0.2 0.1 Mumbai 0.1 0.1 0.1 0.1 0.2 0.2 0.1 0.1 0.1 0.2 0.2 0.2 JNPT 0.2 0.3 0.1 0.1 - - - - - - - -Kandla 0.5 0.6 0.5 0.5 0.7 1.7 2.0 3.9 5.2 4.9 5.8 5.3 All Ports 3.0 3.5 2.9 2.9 3.8 6.6 7.9 10.6 12.2 10.9 12.4 12.2
Fertilizer Raw materials (m tons)
Calcutta - - - - - - 0.0 0.0 0.0 0.0 0.0 0.0 Haldia 0.5 0.4 0.4 0.4 0.3 0.5 0.4 0.4 0.2 0.1 0.2 0.3 Paradip 2.7 2.8 2.4 1.6 2.6 1.6 2.9 3.4 3.4 3.5 4.2 4.5 Vishakapatnam 0.7 0.7 0.6 0.7 0.7 0.9 0.8 0.7 0.7 0.8 0.8 0.8 Chennai 0.5 0.3 0.3 0.3 0.3 0.4 0.4 0.3 0.3 0.2 0.3 0.3 Tuticorin 0.4 0.5 0.7 0.6 0.7 1.0 0.7 0.6 0.7 0.9 0.7 0.9 Cochin 0.5 0.4 0.5 0.4 0.5 0.6 0.5 0.3 0.3 0.2 0.4 0.3 New Mangalore 0.0 0.0 0.0 - 0.0 - 0.0 0.0 0.0 0.0 0.0 0.0 Mormugoa - - - - - - - - - - 0.0 -Mumbai 0.6 0.6 0.3 0.4 0.4 0.4 0.3 0.2 0.2 0.2 0.3 0.2 JNPT 0.1 0.1 0.1 0.1 0.0 - - - - - - -Kandla 0.3 0.3 0.3 0.3 0.3 0.3 0.2 0.2 0.3 0.8 0.6 0.8 All Ports 6.1 6.0 5.7 4.7 5.8 5.6 6.2 6.1 6.1 6.8 7.6 8.2 Source: Indian Ports Association

17 January 2013 India Logistics – Improving economic backdrop & reasonable valuations
Anand Rathi Research 51
Annexure – Cargo Traffic at Major ports (contd.) FY01 FY02 FY03 FY04 FY05 FY06 FY07 FY08 FY09 FY10 FY11 FY12
Coal – Thermal (m tons)
Calcutta - - - - - - - - - - - -Haldia 3.7 2.9 3.4 3.2 3.2 3.4 2.4 1.8 1.9 1.5 2.2 2.4 Paradip 8.2 8.9 9.9 11.0 10.9 12.5 12.5 13.3 14.7 14.8 13.3 16.4 Vishakapatnam 5.4 3.9 3.2 2.5 2.5 2.7 2.4 2.9 3.4 3.7 3.5 3.2 Ennore - 3.4 8.5 9.3 8.9 8.4 8.8 9.1 9.7 9.3 9.3 12.6 Chennai 11.9 7.2 2.8 1.8 2.0 1.9 2.2 2.3 2.4 1.8 1.4 0.6 Tuticorin 5.6 5.2 5.0 5.3 5.4 6.1 5.6 6.1 5.7 5.8 5.3 6.1 Cochin 0.2 0.1 0.2 0.1 0.2 0.2 0.2 0.2 0.3 0.1 0.0 0.0 New Mangalore - - - - - - - - - - - -Mormugoa 0.4 - 0.1 0.1 0.3 0.4 0.4 0.4 0.4 1.0 1.6 1.2 Mumbai - - - - - - 2.5 3.0 3.3 3.7 3.9 4.3 JNPT - - - - - - - - - - - -Kandla - - - - - 0.1 0.3 0.9 1.4 2.3 3.1 4.1 All Ports 35.3 31.6 33.0 33.3 33.3 37.7 37.3 40.0 43.3 44.1 43.6 50.8
Coal – Coking (m tons)
Calcutta - - - - - - - - - 0.0 0.0 0.0 Haldia 4.0 4.0 4.3 4.5 5.1 5.4 5.4 5.5 5.9 6.0 6.0 4.9 Paradip 1.7 1.4 1.9 2.2 3.3 3.8 4.3 4.7 5.4 5.0 6.2 5.5 Vishakapatnam 4.7 5.7 6.3 6.1 6.5 7.1 6.7 7.5 7.6 7.4 7.9 6.8 Ennore - - - - - - - - - - 0.1 0.5 Chennai 0.6 0.6 1.0 1.0 1.3 1.2 1.2 1.7 1.7 1.5 0.6 0.4Tuticorin - - - - - - - - - - - -Cochin - - - - - - - - - - - -New Mangalore 0.2 0.2 0.2 0.1 0.3 0.5 1.0 1.7 1.9 2.8 2.9 4.0 Mormugoa 0.9 2.0 1.6 1.6 2.7 2.9 3.6 3.9 4.1 3.8 4.9 5.7 Mumbai - - - - - - - - - - - -JNPT - - - - - - - - - - - -Kandla 0.6 0.4 - - 0.2 0.3 0.4 0.2 0.5 0.9 0.4 0.2 All Ports 12.8 14.2 15.2 15.5 19.2 21.1 22.7 25.2 27.1 27.5 29.1 27.9
Container – Tonnage (m tons)
Calcutta 2.0 1.4 1.5 1.7 2.4 3.2 4.0 5.1 5.5 6.6 6.2 6.8 Haldia 0.8 1.5 1.9 2.3 2.0 1.9 1.9 2.2 2.4 2.0 2.8 2.6 Paradip 0.0 0.0 0.0 0.1 0.0 0.0 0.0 0.1 0.0 0.0 0.1 0.1 Vishakapatnam 0.3 0.3 0.3 0.3 0.6 0.6 0.8 1.1 1.4 1.7 2.6 4.2 Ennore - - - - - - - - - - - -Chennai 5.8 5.9 7.2 8.6 9.9 11.8 14.2 18.0 20.6 23.5 29.4 30.1 Tuticorin 1.6 2.2 2.3 2.7 3.2 3.4 4.0 5.6 5.5 6.6 8.2 9.2 Cochin 1.8 1.9 2.1 2.1 2.3 2.5 2.9 3.2 3.3 3.9 4.4 4.7 New Mangalore 0.0 0.0 0.1 0.1 0.1 0.1 0.3 0.3 0.4 0.5 0.6 0.6 Mormugoa 0.0 0.1 0.1 0.1 0.1 0.1 0.1 0.1 0.1 0.2 0.2 0.2 Mumbai 4.4 3.7 3.1 2.8 2.6 2.1 1.6 1.6 1.3 0.6 0.7 0.6 JNPT 14.3 18.5 22.9 27.8 28.7 33.8 40.8 51.8 50.6 53.1 56.4 58.3 Kandla 1.3 1.8 2.2 2.4 2.8 2.3 2.8 2.6 2.1 2.4 2.6 2.8 All Ports 32.2 37.2 43.7 51.0 54.8 62.0 73.4 92.1 93.1 101.2 114.1 120.2
Container – TEU’s (m TEU’s)
Calcutta 0.1 0.1 0.1 0.1 0.2 0.2 0.2 0.3 0.3 0.4 0.4 0.4 Haldia 0.1 0.1 0.1 0.1 0.1 0.1 0.1 0.1 0.1 0.1 0.1 0.1 Paradip - - 0.0 0.0 0.0 0.0 0.0 0.0 0.0 0.0 0.0 0.0 Vishakapatnam 0.0 0.0 0.0 0.0 0.0 0.0 0.1 0.1 0.1 0.1 0.1 0.2 Chennai 0.4 0.3 0.4 0.5 0.6 0.7 0.9 1.0 1.1 1.2 1.5 1.6 Tuticorin 0.2 0.2 0.2 0.3 0.3 0.3 0.4 0.5 0.4 0.4 0.5 0.5 Cochin 0.1 0.2 0.2 0.2 0.2 0.2 0.2 0.3 0.3 0.3 0.3 0.3 New Mangalore 0.0 0.0 0.0 0.0 0.0 0.0 0.0 0.0 0.0 0.0 0.0 0.0 Mormugoa 0.0 0.0 0.0 0.0 0.0 0.0 0.0 0.0 0.0 0.0 0.0 0.0 Mumbai 0.3 0.3 0.2 0.2 0.2 0.2 0.1 0.1 0.1 0.1 0.1 0.1 JNPT 1.2 1.6 1.9 2.3 2.4 2.7 3.3 4.1 4.0 4.1 4.3 4.3 Kandla 0.1 0.1 0.2 0.2 0.2 0.1 0.2 0.2 0.1 0.1 0.2 0.2 All Ports 2.5 2.9 3.4 3.9 4.2 4.6 5.5 6.6 6.6 6.9 7.5 7.8 Source: Indian Ports Association

Appendix Analyst Certification The views expressed in this Research Report accurately reflect the personal views of the analyst(s) about the subject securities or issuers and no part of the compensation of the research analyst(s) was, is, or will be directly or indirectly related to the specific recommendations or views expressed by the research analyst(s) in this report. The research analysts are bound by stringent internal regulations and also legal and statutory requirements of the Securities and Exchange Board of India (hereinafter “SEBI”) and the analysts’ compensation are completely delinked from all the other companies and/or entities of Anand Rathi, and have no bearing whatsoever on any recommendation that they have given in the Research Report.
Anand Rathi Ratings Definitions
Analysts’ ratings and the corresponding expected returns take into account our definitions of Large Caps (>US$1bn) and Mid/Small Caps (<US$1bn) as described in the Ratings Table below:
Ratings Guide Buy Hold Sell Large Caps (>US$1bn) >15% 5-15% <5% Mid/Small Caps (<US$1bn) >25% 5-25% <5%
Anand Rathi Research Ratings Distribution (as of 29 Oct 2012) Buy Hold Sell Anand Rathi Research stock coverage (155) 65% 25% 10% % who are investment banking clients 5% 3% 0% Other Disclosures This report has been issued by ARSSBL which is a SEBI regulated entity, and which is in full compliance with all rules and regulations as are applicable to its functioning and governance. The investors should note that ARSSBL is one of the companies comprising within ANAND RATHI group, and ANAND RATHI as a group consists of various companies which may include (but is not limited to) its subsidiaries, its affiliates, its group companies who may hold positions, views, stakes and may service the companies covered in this report independent of ARSSBL. Investors are cautioned to be aware that there could arise a potential conflict of interest in the views held by ARSSBL and other companies of Anand Rathi who maybe affiliated, connected or catering to the companies mentioned in the Research Report; even though, ARSSBL and Anand Rathi are fully complaint with all procedural and operational regulatory requirements. Thus, investors should not use this as a sole basis for making their investment decision and should consider the recommendations mentioned in the Research Report bearing in mind the aforementioned.
Further, the information herein has been obtained from various sources which we believe is reliable, and we do not guarantee its accuracy or completeness. Neither the information nor any opinion expressed herein constitutes an offer, or an invitation to make an offer, to buy or sell any securities or any options, futures or other derivatives related to such securities (hereinafter referred to as “Related Investments”). ARSSBL and/or Anand Rathi may trade for their own accounts as market maker / jobber and/or arbitrageur in any securities of the companies mentioned in the Research Report or in related investments, and may be on taking a different position from the ones which haven been taken by the public orders. ARSSBL and/or Anand Rathi and its affiliates, directors, officers, and employees may have a long or short position in any securities of the companies mentioned in the Research Report or in Related Investments. ARSSBL and/or Anand Rathi, may from time to time, perform investment banking, investment management, financial advisory or any other services not explicitly mentioned herein, or solicit investment banking or other business from, any entity and/or company mentioned in this Research Report; however, the same shall have no bearing whatsoever on the specific recommendations made by the analyst(s), as the recommendations made by the analyst(s) are completely independent of the views of the other companies of Anand Rathi, even though there might exist an inherent conflict of interest.
Furthermore, this Research Report is prepared for private circulation and use only. It does not have regard to the specific investment objectives, financial situation and the specific financial needs or objectives of any specific person who may receive this Research Report. Investors should seek financial advice regarding the appropriateness of investing in any securities or investment strategies discussed or recommended in this Research Report, and, should understand that statements regarding future prospects may or may not be realized, and we can not guarantee the same as analysis and valuation is a tool to enable investors to make investment decisions but, is not an exact and/or a precise science. Investors should note that income from such securities, if any, may fluctuate and that each security's price or value may rise or fall. Past performance is not necessarily a guide to future performance. Foreign currency rates of exchange may adversely affect the value, price or income of any security or related investments mentioned in this report.
© 2012 Anand Rathi Shares and Stock Brokers Limited. All rights reserved. This report or any portion thereof may not be reprinted, sold or redistributed without the prior written consent of Anand Rathi Shares and Stock Brokers Limited.
Additional information on recommended securities/instruments is available on request.