improving customer service through effective supply …
TRANSCRIPT

IMPROVING CUSTOMER SERVICE THROUGH EFFECTIVE SUPPLY CHAIN MANAGEMENT IN A
PHARMACEUTICAL COMPANY
By
Donné Rothner 193403610
Submitted in partial fulfilment of the requirements for the degree of Masters in Business Administration at the Nelson Mandela
Metropolitan University
November 2010
Supervisor: Ms Wendy Groenewald

ii

iii
ABSTRACT
All organisations compete on the basis of service. In today‘s highly competitive
world, organisations need to compete to retain their customers and to offer good
customer service that will give them a competitive advantage. In the South
African pharmaceutical market, the introduction of the Single Exit Price (SEP)
and generic substitution have led to the price of equivalent medicines no longer
being the differentiating factor in a customer deciding which manufacturer‘s
product to purchase. The availability of generic medicines at the pharmacy or
hospital has become the differentiating factor.
Two types of customers exist in any organisation, namely, external customers
and internal customers. Much has been written about the external customer, but
less about the internal customer. Many managers do not perceive internal
customer service as a priority. Any organisation attempting to deliver quality
service to their external customers must begin by serving the needs of their
internal customers. Internal service quality is characterised by the attitudes that
people have towards one another and in the way that employees serve one
another inside the organisation. By improving customer service, the organisation
can improve its profitability, sustainability and customer retention.
The aim of this study was to determine whether the levels of internal customer
service between the three sections of Aspen Pharmacare are optimal.
Determining the current performance levels between the staff of the sections will
assist in highlighting the areas that require attention. The three sections of Aspen
Pharmacare that are internal customers of one another and have been used in
the study are:
production;
demand planning; and
distribution.

iv
The results of the study show that all three sections rate three service quality
dimensions (communication, tangibles and reliability) as important. The results
were used to develop an internal customer service model for Aspen Pharmacare.

v
DEDICATION
To my parents and partner, with love and in gratitude for their support and
understanding.

vi
ACKNOWLEDGEMENTS
I wish to thank the following people for their support and guidance during the
compilation of my treatise:
My parents and my partner for their love, unwavering support and
encouragement throughout my MBA studies.
My colleague, Shane Thompson, for his patience and willingness to assist
with my thesis.
My manager, Graham Sutherland, for his understanding and support.
My colleague, Brian Schroëder, for always being there to listen and
advise.
My supervisor, Ms Wendy Groenewald, for her assistance and guidance.
The NMMU Bird Street librarian, Anneret Cloete, for her willingness to
assist with my requests.
My friends and family, who have been neglected throughout the year, but
whose support and encouragement has never ceased.
Without your support and guidance, my MBA studies and treatise would have
been a more difficult path to follow and complete.

vii
GLOSSARY/ABBREVIATIONS/ACRONYMS
HR Human Resources
SEP Single Exit Price: the price of medicines with the same active
ingredient will be the same. The SEP is set by the South African
Medicines Control Council.
TQM Total Quality Management

viii
TABLE OF CONTENTS
DECLARATION BY CANDIDATE……………………………………………………………………… ii ABSTRACT. .............................................................................. ……………………………………….iii DEDICATION .................................................................................................................................... v ACKNOWLEDGEMENTS ................................................................................................................ vi GLOSSARY/ABBREVIATIONS/ACRONYMS ................................................................................ vii 1.0 CHAPTER ONE............................................................................................................. 1 1.1 INTRODUCTION ............................................................................................................ 1 1.2 PROBLEM STATEMENT ............................................................................................... 2 1.3 RESEARCH OBJECTIVES ............................................................................................ 6 1.3.1 Research objective ................................................................................................ 6 1.3.2 Research design objectives................................................................................... 8 1.4 RESEARCH METHODOLOGY ...................................................................................... 8 1.4.1 The sample ............................................................................................................ 9 1.4.2 The measuring instrument ..................................................................................... 9 1.5 OUTLINE OF THE STUDY .......................................................................................... 10 1.6 SUMMARY .................................................................................................................... 11 2.0 CHAPTER TWO .......................................................................................................... 12 2.1 INTRODUCTION .......................................................................................................... 12 2.2 CUSTOMER SERVICE AND ITS BENEFITS .............................................................. 13 2.3 TOTAL QUALITY MANAGEMENT AND QUALITY IMPROVEMENTS ........................ 21 2.4 THE ROLE OF HUMAN RESOURCES IN CUSTOMER SERVICE ............................ 28 2.5 MODELS OF CUSTOMER SERVICE .......................................................................... 39 2.5.1 Service Quality Model according to Shemwell, Yavas and Bilgin ....................... 39 2.5.2 Service Quality Model according to Haywood-Farmer ........................................ 40 2.5.3 Customer Service Model according to Swartzlander .......................................... 42 2.5.4 Service-Profit Chain ............................................................................................. 44 2.6 THE DIMENSIONS OF SERVICE QUALITY ............................................................... 47 2.7 INTERNAL CUSTOMER SERVICE AND QUALITY .................................................... 54 2.8 INTERNAL MARKETING ............................................................................................. 59 2.9 CONCLUSION ............................................................................................................. 64 3.0 CHAPTER THREE ...................................................................................................... 65 3.1 INTRODUCTION .......................................................................................................... 65 3.2 RESEARCH DESIGN .................................................................................................. 65 3.3 DESIGN AND STRUCTURE OF THE QUESTIONNAIRE ........................................... 68 3.3.1 The sample .......................................................................................................... 70 3.3.2 Sample size ......................................................................................................... 70 3.3.3 Pilot Study............................................................................................................ 70 3.3.4 Administration of the questionnaire ..................................................................... 71 3.4 DATA ANALYSIS METHOD ......................................................................................... 72 3.5 PROBLEMS EXPERIENCED ...................................................................................... 72 3.6 SUMMARY ................................................................................................................... 73 4.0 CHAPTER FOUR ........................................................................................................ 74 4.1 INTRODUCTION .......................................................................................................... 74 4.2 QUESTIONNAIRE RESULTS ANALYSIS .................................................................... 74 4.2.1 Classification Question Data Analysis ................................................................. 74 4.2.2 Tangibles Dimension ........................................................................................... 79 4.2.3 Reliability Dimension ........................................................................................... 81 4.2.4 Responsiveness Dimension ................................................................................ 83 4.2.5 Competence Dimension ...................................................................................... 86

ix
4.2.6 Courtesy Dimension ............................................................................................ 88 4.2.7 Credibility Dimension ........................................................................................... 90 4.2.8 Security Dimension .............................................................................................. 92 4.2.9 Access Dimension ............................................................................................... 94 4.2.10 Communication Dimension.................................................................................. 96 4.2.11 Understanding The Customer Dimension ........................................................... 98 4.3 SUMMARY ................................................................................................................. 101 5.0 CHAPTER FIVE ........................................................................................................ 103 5.1 INTRODUCTION ........................................................................................................ 103 5.2 RESEARCH QUESTIONS ANSWERED ................................................................... 103 5.3 RECOMMENDATIONS FOR THE PHARMACEUTICAL COMPANY ......................... 111 5.4 LIMITATIONS OF THE STUDY ................................................................................... 117 5.4.1 Exclusion of the Support Sections ...................................................................... 117 5.4.2 The Questionnaire Design .................................................................................. 118 5.5 RECOMMENDATIONS FOR FUTURE RESEARCH .................................................. 118 5.6 CONCLUSION ............................................................................................................ 119 LIST OF SOURCES……….……………………………………………………………………………121 APPENDICES…………………………………………………………………………………………...128 APPENDIX A…………………………………………………………………………………………….128 APPENDIX B…………………………………………………………………………………………….131

x
LIST OF FIGURES
Figure 1.1 Internal customer service interaction of Aspen Pharmacare
7
Figure 2.1 Linkages between Marketing, Customer Services and Quality 18
Figure 2.2 TQM and Productivity Linkage 24
Figure 2.3 Conceptual Framework of Cook and Verma 26
Figure 2.4 Framework for Service Quality Management 33
Figure 2.5 Relationship between employee behaviour and customer satisfaction
36
Figure 2.6 Conceptual Model of Shemwell, Yavas and Bilgin 40
Figure 2.7 Service Quality Trade-off Continuum and Suggested Positions 41
Figure 2.8 Customer Service Model of Swartzlander 43
Figure 2.9 Service-Profit Chain 45
Figure 2.10 The employee-customer-bottom line linkages
46
Figure 4.1 Average percentages of the tangibles dimension ratings 81
Figure 4.2 Average percentages of the reliability dimension ratings 83
Figure 4.3 Average percentages of the responsiveness dimension ratings 85
Figure 4.4 Average percentages of the competence dimension ratings 88
Figure 4.5 Average percentages of the courtesy dimension ratings 90
Figure 4.6 Average percentages of the credibility dimension ratings 92
Figure 4.7 Average percentages of the security dimension ratings 94
Figure 4.8 Average percentages of the access dimension ratings 96
Figure 4.9 Average percentages of the communication dimension ratings 98
Figure 4.10 Average percentages of the understanding the customer dimension ratings
101
Figure 5.1 Importance ratings of each dimension 107
Figure 5.2 Overall performance percentages 109
Figure 5.3 Ideal Customer Service Model for Aspen Pharmacare 111
xi
LIST OF TABLES
Table 2.1 Comparisons between Determinants of Service Quality
48
Table 4.1 Respondents‘ personal statistics: Gender 75
Table 4.2 Respondents‘ personal statistics: Age Group 75
Table 4.3 Respondents‘ personal statistics: Language 76
Table 4.4 Respondents‘ personal statistics: Years of working for Aspen
Pharmacare 77
Table 4.5 Respondents‘ personal statistics: Section worked in 78
Table 4.6 Tangibles Dimension: Production Performance ratings 79
Table 4.7 Tangibles Dimension: Demand Planning Performance ratings 79
Table 4.8 Tangibles Dimension: Distribution Performance ratings 80
Table 4.9 Reliability Dimension: Production Performance ratings 82
Table 4.10 Reliability Dimension: Demand Planning Performance ratings 82
Table 4.11 Reliability Dimension: Distribution Performance ratings 82
Table 4.12 Responsiveness Dimension: Production Performance ratings 84
Table 4.13 Responsiveness Dimension: Demand Planning Performance
ratings
84
Table 4.14 Responsiveness Dimension: Distribution Performance ratings 85
Table 4.15 Competence Dimension: Production Performance ratings 86
Table 4.16 Competence Dimension: Demand Planning Performance ratings 87
Table 4.17 Competence Dimension: Distribution Performance ratings 87
Table 4.18 Courtesy Dimension: Production Performance ratings 88
Table 4.19 Courtesy Dimension: Demand Planning Performance ratings 89
Table 4.20 Courtesy Dimension: Distribution Performance ratings 89
Table 4.21 Credibility Dimension: Production Performance ratings 90
Table 4.22 Credibility Dimension: Demand Planning Performance ratings 91
Table 4.23 Credibility Dimension: Distribution Performance ratings 91
Table 4.24 Security Dimension: Production Performance ratings 93
Table 4.25 Security Dimension: Demand Planning Performance ratings 93
Table 4.26 Security Dimension: Distribution Performance ratings 93
Table 4.27 Access Dimension: Production Performance ratings 95
Table 4.28 Access Dimension: Demand Planning Performance ratings 95
Table 4.29 Access Dimension: Distribution Performance ratings 95
Table 4.30 Communication Dimension: Production Performance ratings 97
Table 4.31 Communication Dimension: Demand Planning Performance 97

xii
ratings
Table 4.32 Communication Dimension: Distribution Performance ratings 98
Table 4.33 Understanding the Customer Dimension: Production
Performance ratings
99
Table 4.34 Understanding the Customer Dimension: Demand Planning
Performance ratings
99
Table 4.35 Understanding the Customer Dimension: Distribution
Performance ratings
100
Table 5.1 Production Section: Importance percentages 104
Table 5.2 Demand Planning Section: Importance percentages 105
Table 5.3 Distribution Section: Importance percentages 106

1
1.0 CHAPTER ONE
PROBLEM STATEMENT AND SCOPE OF STUDY
1.1 INTRODUCTION
A large number of generic pharmaceutical manufacturers compete for the
pharmaceutical market in South Africa. Many of these are members of the
National Association of Pharmaceutical Manufacturers (NAPM). Members are
manufacturers and suppliers of drugs, most of which are generics. The members
include: Aspen Pharmacare, Be-tabs Pharmaceuticals, Bodene, Cipla Medpro,
Columbia Pharmaceuticals, Dr Reddy‘s Laboratories Pty. Ltd., Merck Generics,
Omnimed Pty Ltd, Pharma Dynamics, Pharmafrica, Ranbaxy SA, Sandoz SA,
Sekpharma and Thebe Medicare (NAPM, n.d.).
The pharmaceutical industry develops, produces and supplies pharmaceutical
products that are required to save lives, prevent illness and to assist in improving
the quality of life. The generics market remains a major growth area in the global
healthcare market, due in large part to government seeking to promote the use of
generic products over higher-priced originator products (PRLog, 2008). With the
introduction of the Single Exit Price (SEP) and generic substitution becoming
mandatory in South Africa (South Africa, 1997:26), the price of equivalent
medicines will no longer be the differentiating factor in deciding which
manufacturer‘s product to purchase. The availability of generic medicines at the
pharmacy or hospital will become the differentiating factor.
All organisations compete to some degree on the basis of service, and it is
difficult to name any industry in which service matters are not important. As
manufacturing companies find it increasingly difficult to establish sustainable and
technology-based competitive advantages, they will need to direct extra attention
and resources to value-added service as a source of superiority (Zeithaml,
Parasuraman & Berry, 1990:1-2).

2
In order for a pharmaceutical company, particularly a generic manufacturer to be
successful, its customer service to both the external and internal customer is
vital. Management, marketing, operations and human resource functions all need
to be involved in building customer service. Hallowell, Schlesinger and Zornitsky
(1996:21) believe that all organisations attempting to deliver service quality to
their external customers must begin by serving the needs of their internal
customers. According to McDermott and Emerson (1991:61), employees (internal
customers) cannot satisfy external customers unless they are treated well by
their own companies and suggest that developing performance standards can
help to improve internal customer service.
This study will examine the internal customer service levels and expectations of
various sections within Aspen Pharmacare. The information gathered during this
study will be used to develop a model for improving internal customer service
within the company. The proposed model will assist management to improve
external customer service through the improvements in internal customer service
and service quality.
1.2 PROBLEM STATEMENT
There is a need to determine whether the levels of internal customer service
between the three sections of Aspen Pharmacare are being performed optimally.
Determining the current performance levels of the service quality between the
staff of the three sections will assist in highlighting the areas that require
attention.
Developing a model for internal customer service at Aspen Pharmacare should
result in better inter-departmental communication and customer service. By
improving internal customer service, Aspen Pharmacare may improve their ability
to get their products to the market at the right time, and this may decrease ‗out of
stock‘ situations. The decrease in ‗out of stock‘ situations, in turn, will minimise

3
the threat posed by opposition generic manufacturers who may have stock of
their particular generic product available when Aspen Pharmacare does not. This
will minimise a loss of future sales of that generic product.
An additional benefit to improving internal customer service may be that Aspen
Pharmacare could get their generic into the market first when the patent on an
originator product expires. Aspen Pharmacare has more than 200 dossiers
awaiting registration from the South African Medicines Authority (Aspen
Pharmacare, n.d.). By Aspen Pharmacare being the first to market with their
generics, doctors have the option of prescribing the Aspen Pharmacare generic
product to first-time patients. This would result in repeat prescriptions for this
product and guarantee future sales of the product.
Internal customers include every employee in the company. Internal service
quality has received little attention in the empirical literature, although aspects
have been discussed as far back as 1938 (Hallowell et al., 1996:20). Lawrence
and Wiswell (1998:45) state that it is crucial to maintain customer satisfaction for
an organisation‘s survival and success, and note that it is equally important to
consider the customer satisfaction of internal customers. Exceptional customer
service cannot be delivered to external customers unless all employees support
each other (Swartzlander, 2004:38).
SERVQUAL has become a widely adopted technology for measuring and
managing service quality since it was introduced in 1985 by innovators
Parasuraman, Zeithaml and Berry (Buttle, 1996:8). SERVQUAL has been used in
many studies and Rust and Zahorik (1993:200) have observed that ―the general
SERVQUAL dimensions…should probably be put on any first pass as a list of
attributes of service‖. SERVQUAL has become a widely accepted model for
measuring how well a company is meeting its customers‘ expectations (Homburg
& Rudolph, 2001:15). The service quality dimensions of SERVQUAL are the
most widely used dimensions in determining service quality levels and constructs

4
(Rosen & Karwan, 1994:40). Lings and Brooks (1998:326) comment that the
SERVQUAL tool is easily modified to suit different service situations and has
been widely used. Carman (1990:50) states that while the service quality
dimensions of SERVQUAL are impressive, they are not generic to all service
types.
Ten dimensions of service quality are identified and measured by the
SERVQUAL technology, and these service quality dimensions will form the basis
for analysis in this study. The service quality dimensions are:
tangibles;
reliability;
responsiveness;
competence;
courtesy;
credibility;
security;
access;
communication; and
understanding the customer (Zeithaml et al., 1990:23).
Pieterse, van der Merwe, Lourens and Murray (2010:97-99) comment that
service quality is harder to measure than product quality and identify SERVQUAL
and its dimensions as a way for a company to accurately assess what a
customer wants and needs, in terms of service quality.
Longenecker and Meade (1995:78) describe customer service as having an
impact on the operations of an organisation, but that managers do not generally
perceive internal customer service as a priority. This may lead to a gap between
external and internal customer service. Aspen Pharmacare manufactures generic
medicines, and has three major sections which are internal customers of one
another, namely:

5
production;
demand planning; and
distribution.
Some studies have been performed regarding internal customer service, but
these have not been done for a specific pharmaceutical company. The
researcher could find no articles related to internal customer service in a
pharmaceutical company despite searching a number of databases.
Michael (2003:2427) completed a dissertation on the implementation and
evaluation of an internal customer service program for a public sector
organisation and recommends that organisations identify, measure and manage
their internal resources so that internal service quality and customer service are
encouraged and supported. Chaston (1994a:380) conducted a study on internal
customer management and service within the National Health Service in the
United Kingdom by using a modified version of the SERVQUAL model. He
concluded that many gaps in internal customer management existed. Some
obstacles to increased future emphasis on internal customer management
included insufficient resources to service internal customer needs and a lack of
trust between sections of an organisation.
The difference in the emphasis between external and internal customer service
was realised by Davis (1992:34): ―In the Eighties, U.S. business learned new
skills for identifying and satisfying external customers. Inevitably, this experience
led to recognition that the needs of internal work processes and internal
customers were critical to external service delivery‖. Davis (1992:34) states that
enhancements to internal customer service can support improved external
customer service.
Conclusions drawn from this study may contribute to improving Aspen
Pharmacare‘s internal customer service. The study will assess the internal

6
customer service offered and received by the three sections of the Aspen
Pharmacare supply chain in terms of the ten service quality dimensions. This will
enable an internal customer service model for Aspen Pharmacare to be
developed. An internal customer service model for each section will need to be
proposed to create an overall internal customer service model. This model can
be utilised by the Human Resources Department to improve internal customer
service. Improved customer service that is provided by competent staff, who are
aware of the principles of good customer service through training, would be a
positive outcome.
1.3 RESEARCH OBJECTIVES
1.3.1 Research objective
The primary research objective of this study is to assess what the supply chain in
Aspen Pharmacare needs to do to improve and formalise its internal customer
service. The recognition of the needs of internal customers are critical to a
company‘s external service delivery but are not treated with the same importance
as external customer service. This may lead to a gap within the company‘s
customer service. The proposed model should allow Aspen Pharmacare to
improve overall customer service.
Five research questions have been developed in an attempt to identify the most
important service quality dimensions of internal customer service for each
section, to identify variances in the performance of the dimensions in each
section and to identify areas in the current performance levels which can be
improved.
The research questions are:
7
What does the Production section of Aspen Pharmacare consider to be
the important service quality dimensions of the internal customer service
that they receive and offer?
What does the Demand Planning section of Aspen Pharmacare consider
to be the important service quality dimensions of the internal customer
service that they receive and offer?
What does the Distribution section of Aspen Pharmacare consider to be
the important service quality dimensions of the internal customer service
that they receive and offer?
In which service quality dimensions are there the biggest variances in
each section?
What are the key service quality dimensions that will be most valuable in
improving Aspen Pharmacare‘s customer service?
Answering these research questions will allow the primary research objective to
be met.
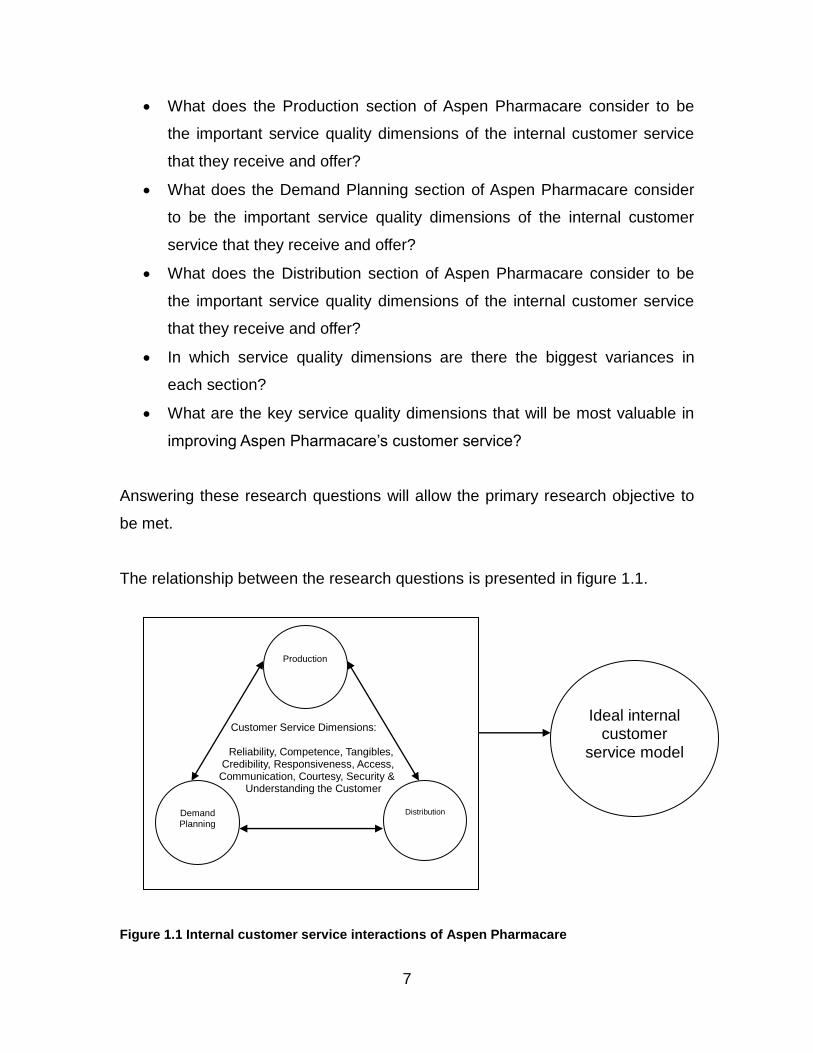
The relationship between the research questions is presented in figure 1.1.
Figure 1.1 Internal customer service interactions of Aspen Pharmacare
Customer Service Dimensions:
Reliability, Competence, Tangibles, Credibility, Responsiveness, Access, Communication, Courtesy, Security & Understanding the Customer
Demand Planning
Distribution
Production
Ideal internal
customer service model

8
1.3.2 Research design objectives
The following research design objectives will be pursued in this study:
To conduct a literature review to assess the existing body of knowledge
and research on internal and external customer service as well as
related topics such as Total Quality Management and internal
marketing.
Based on the literature review, to construct a questionnaire which will
be used to collect the primary data on the dimensions of internal
customer service for the three sections of the supply chain at Aspen
Pharmacare.
To execute the empirical component of this study, the questionnaire will
be emailed to the senior management of the three sections to achieve
a judgemental sample of at least seventy-five respondents in the three
sections.
Data gathered relating to each section will be captured using the
Microsoft Excel computer software program.
Data will be analysed using the informal data analysis technique.
The data will be interpreted and a model for each section of the supply
chain and an overall model will be proposed.
To provide recommendations to senior management of the Production,
Demand Planning and Distribution sections of Aspen Pharmacare
regarding their internal customer service.
1.4 RESEARCH METHODOLOGY
The research project will follow a qualitative approach because the study
requires an analysis of the nature of the factors which impact on customer
service within the supply chain. The relationships among variables will not be
statistically tested, as this would have required a quantitative approach.

9
1.4.1 The sample
The ideal sample is twenty-five participants from each section of the supply chain
as the judgemental sample group (N = 75) for this study. This minimal sample
size (N= 75), together with the predetermined criteria, will allow for the sample
group to be representative of the population. The sample size was determined
after a discussion between the researcher and the Nelson Mandela Metropolitan
University‘s Research Methodology lecturer, Professor Cecil Arnolds.
A structured questionnaire will be distributed by e-mail to the senior managers of
each section. Anonymity and confidentiality will be strictly guaranteed.
1.4.2 The measuring instrument
The ten service quality dimension version of Zeithaml et al.‘s (1990) SERVQUAL
instrument will be used to measure the dimensions of service quality in this study.
All ten original service quality dimensions will be assessed individually in this
study.
The statements in the above-mentioned instrument will be anchored on a five-
point Likert scale. Importance and performance ratings for internal customer
services appear to work best when a five-point scale is used (Slack, 1994:73).
The questionnaire is divided into two sections. Section one consists of
demographic data. Section two consists of the statements that the respondent is
required to rate on the Likert scale relating to the individual‘s view of internal
customer service between the three supply chain sections.

10
The levels of the ten service quality dimensions will be measured by calculating
the scores for the responses to the individual statements on two factors,
performance and importance. It has been found that for a given importance, the
priority for importance increases as performance decreases; while for a given
performance level, the priority for improvement increases as importance
decreases (Slack, 1994:64). Rating both importance and performance is a useful
method to get closer to understanding a customer‘s level of satisfaction with the
way a function or service is performed as well as the importance of that function
or service to the customer (Cook, 2002:100-1). Importance and performance act
together to determine a priority for improvement for an organisation (Slack,
1994:64).The differences between the performance ratings of the responses per
section will also be analysed for each statement and dimension.
1.5 OUTLINE OF THE STUDY
The study will be divided into five chapters.
The first chapter will outline the study, the problem statement, the objective of the
study, the research questions and the research methodology.
Chapter two will discuss the nature of customer service and service quality, their
importance and the benefits of internal and external customer service. Various
models of customer service, internal marketing, Total Quality Management and
the role of the Human Resources department in customer service will also be
discussed.
The research methodology and design will be outlined in chapter three. The
research approach that was followed in order to meet the primary objective of the
study in order to answer the five research questions is explained. This chapter
will also cover the sampling method and the criteria used to determine the
11
participants of the study, as well as the measuring instrument. The pilot study, the
data analysis method and problems experienced will be detailed.
Chapter four will describe and discuss the empirical results of the study.
Finally, the empirical results of the study will be interpreted, summarised and the
managerial, marketing, operations and human resource department implications
discussed in the fifth chapter. The five research questions raised in this study will
be answered. The chapter will also indicate the areas of importance that should
be addressed to improve internal customer service between the three sections of
the supply chain. Recommendations will be provided and conclusions will be
drawn on the internal customer service offering of these sections. Limitations of
the study and recommendations for future research arising from this study will
also be presented.
1.6 SUMMARY
The problem statement of whether the levels of internal customer service
between the three sections of Aspen Pharmacare are being performed as well as
they could be was introduced. The main research objective, as well as the five
research questions that will be addressed in order to solve the main objective,
were presented. The research methodology to be used and the outline of the
study were also described.
The next chapter will address the literature study of prior research performed
regarding customer service and service quality. Various issues related to
customer service and service quality such as Total Quality Management and
internal marketing will be discussed in order to explore the relationships between
customers, managers and workers and between total quality, marketing, service
and the survival of a company.

12
2 CHAPTER TWO
CUSTOMER SERVICE AND QUALITY LITERATURE REVIEW
2.1 INTRODUCTION
The aim of chapter two is to discuss the nature of customer service and service
quality, their importance and the benefits of internal and external customer
service.
Customer service is an important mechanism through which an organisation can
differentiate itself from its competitors. The relationship between customer
service and marketing is explained.
Total Quality Management introduced the concept of an internal customer. The
introduction and proper usage of Total Quality Management in the workplace
helps to create connections between customers, managers and workers and
makes everyone responsible for ensuring high levels of quality in their work. It
also links productivity, quality and marketing and produces increased productivity
and profitability as well as improved internal and external customer satisfaction.
The Human Resources department of an organisation play a key role in
developing and implementing the processes to hire, train and retain quality staff.
The responsibilities of the Human Resources department and of management in
ensuring the best employees are hired and become customer-focussed are
highlighted.
Various models of customer service exist. Some of these models are explored in
this chapter as alternatives to the SERVQUAL model which was used as the
basis of the questionnaire for this study.

13
The determinants of service quality of various authors are compared. The
dimensions of the SERVQUAL model are expanded by using prior research
regarding the dimensions and determinants.
All employees become both service providers and customers to the staff that they
work with at various times. Internal customer service and quality is important to
ensure that internal customers are serviced in a manner that will lead to
improvements in external customer service. Internal marketing is a method that is
used to bring marketing, human resources and management together to
continuously improve the employees‘ service to both internal and external
customers. Internal marketing is employee-focussed and aims to build
relationships between the employees in an organisation.
The various elements of the literature review have been undertaken to develop
an understanding that will help to predict which of these customer service and
service quality factors have an impact at Aspen Pharmacare. It will also give
leverage to Aspen Pharmacare to influence these factors, and in so doing to
have a positive effect on the customer service provided in the interactions
between the staff of the three sections of the Aspen Pharmacare supply chain.
2.2 CUSTOMER SERVICE AND ITS BENEFITS
Customer service can be defined as the behaviours and attitudes of the staff of
an organisation towards customers during all interactions and communications
with them. Customer service is considered to be exceptional when it consistently
meets and exceeds a customer‘s needs and expectations (Swartzlander,
2004:1). All jobs in an organisation are a part of the chain that provides service to
customers. An organisation consists of a number of stakeholders, including
employees and customers, and building better relationships amongst all the
stakeholders will assist the organisation in developing ―intangible but valuable
assets which can be sources of competitive advantage‖ (Zhang, 2010:112).

14
Over recent years organisations have been placing an increasing emphasis on
customer service as a means of gaining a competitive advantage (Brown,
Churchill & Peter, 1993:127; Brooks, 1997:1; Cardy, 2001:12). A ―sustained
competitive advantage is rooted in resources that are valuable and inimitable‖
(Rapp, Trainor & Agnihotri, 2010:1229-1230). The ability of an organisation to
remain in business is a function of its competitiveness and its ability to win
customers from its competitors. The customer is the foundation of the
organisation and is the reason for its existence. Creating value for the customer
should be the main focus of an organisation (Brooks, 1997:1). Employees need
to understand their customer and become ―customer conscious‖ in order to
deliver good customer service (Hogg, Carter & Dunne, 1998:883).
Building a competitive advantage has become an important factor in the success
and sustainability of an organisation. Organisations can no longer compete on
price alone, and they are turning to developing strategies of superior customer
care and service, for their customers, in order to differentiate themselves and
their products and services from competitors, and through this to gain a lasting
competitive advantage (Ghobadian, Speller & Jones, 1994:44; Cook, 2002:1).
The employees are a critical resource in an organisation as they are the users of
the technology in an organisation (Cardy, 2001:12).
Another enduring competitive advantage can be gained by building strong
relationships with the customer, because, while products can be copied, good
customer service takes a long time to develop and will be difficult for a competitor
to imitate and reach the same level of customer service excellence (Cook &
Verma, 2002:49; Rapp et al., 2010:1230-1231). Customer satisfaction, loyalty
and acquisition can all result from an organisation‘s capability in building and
cementing external customer relationships (Rapp et al., 2010:1231). Johnson
(2004:3199) comments that customer satisfaction has become an important
business metric. He defines customer satisfaction as ―a customer‘s evaluation of

15
their purchase and consumption experience with a product, service, brand or
company‖. Customer satisfaction is increased when performance exceeds the
customer‘s expectation and it decreases when the performance is below
expectation. Customer satisfaction can be increased or decreased by the
interactions between customers and the front line staff of an organisation
(Culbertson, 2009:76).
Another form of competitive advantage for an organisation, which is again difficult
for the competitors to imitate, can be developed by having high quality products
that are easily manufactured, in conjunction with a dependable process which
emphasises the building of quality both in and out of the environment of
continuous improvement (Flynn, Schroeder & Sakakibara, 1994:342). They
comment, however, that achieving a competitive advantage at any specific time
does not mean that the organisation will remain competitive in the future. The
organisation must continuously improve its quality management and
performance. The competitive advantage of an organisation that maintains
continuous improvement throughout, is that it is difficult for the competitors to
copy because the target they need to aim at is always moving (Flynn et al.,
1994:344).
Every instance when a customer or a key buyer interacts with an organisation, its
products, people, facilities and communications represents an important ―moment
of truth‖ because each instance can shape a customer‘s impression and
judgement of the organisation (George, 1990:64; Joseph, 1996:55). Employees
shape these important ―moments of truth‖, not only by the tasks they perform, but
also by the way they look, act, speak and interact with the customer and with
their fellow workers. This implies that employee behaviour must be carefully
orchestrated and managed.
Customer service is an important determinant of a customer‘s perception of
product quality. The quality of products, relative to the competitor‘s products is

16
the most significant factor that affects customer perceptions of an organisation.
Achieving quality leadership is not only a function of pioneering product attributes
and image, but is also a function of superior customer service. Another facet of
the relationship between service quality and product strategy concerns service
support emerging as an important area in which firms seek to develop
competitive advantage. Service orientation is defined as the disposition to be
helpful, thoughtful, considerate and cooperative (Bowen, Siehl & Schneider,
1989:79; 85).
Service quality has also become an important topic because of its relationships to
costs, profitability, customer satisfaction, customer retention and positive word of
mouth. It is widely regarded as being a driver of corporate marketing and
financial performance (Ballantyne, Christopher & Payne, 1995:8; Buttle, 1996:8).
An empirical analysis of the Profit Impact of Marketing Strategy database has
shown a positive relationship between perceived quality and the financial
performance of an organisation (Ghobadian et al., 1994:43).
Rapp et al. (2010:1232) state that strong external customer relationships can
lead to shorter sales cycles and lower service costs. They comment that when a
customer has a strong relationship with an organisation, the customer is less
likely to buy from rivals and is more receptive to the marketing efforts of the
organisation. This results in a quicker acceptance of new products with
accelerated cash flows, an increased shareholder value and a strengthening of
the competitiveness of the organisation (Rapp et al., 2010:1232). The personal
interaction between the customer and the front line staff has a large influence on
customer satisfaction, brand loyalty and a strengthening of the bond between the
organisation, their brand and the customer (Brexendorf, Muhlmeier, Tomczak &
Eisand, 2010:1148).
Customer service and quality are key drivers in the exchange relationships
between an organisation and their customers and this influences the third link,

17
the marketing section of the organisation (Christopher, 1991:3-4). This is
illustrated in figure 2.1. The model in figure 2.1 illustrates that customer service
levels of an organisation need to be determined by measurements of a
customer‘s needs and of their competitor‘s performance. These customer service
levels need to take the different marketing segments into account. Quality needs
to be determined from a customer perspective. The Total Quality concept, which
is discussed in more detail in section 2.3, must influence the process and people
elements by correcting the weak points in the processes and by managing the
customer encounters with the organisation. These three areas of marketing,
customer service and quality need to work in union. The challenge is to bring
these three critical areas into closer alignment as they have previously often
been treated as separate and unrelated. The result of treating these areas as
unrelated is that marketing management has had a difficult time implementing
marketing strategies. Relationship marketing is the focal point for integrating
customer service and quality with a market orientation.
Christopher (1991:4) feels that customer service decisions are a part of the
marketing strategy. The delineation between production, distribution and
marketing functions allows an overlap in responsibility between quality
management and marketing, often to the detriment of the quality and service
perceived by the customer. An important new responsibility for marketing is to
take charge or collaborate in service quality management in terms of planning
and organising improvements, as well as monitoring customer service
requirements externally and internal service support processes.
Customers‘ high expectations of the service they receive translate into a need for
courteous, helpful, respectful and knowledgeable customer service providers
(Swartzlander, 2004:4). Consumers are likely to ignore brand or organisation
loyalty and switch their purchasing power to organisations and products that
provide ―hassle-free‖ and above-average value and service (McDermott &
Emerson, 1991:62). Marketing departments should not just please customers,

18
Figure 2.1: Linkages between Marketing, Customer Services and Quality Source: Christopher (1991:4).
but also cultivate profitable customer relationships through satisfaction with the
product and service offerings related to the organisation (Scharitzer & Kollarits,
2000:967). The more technologically sophisticated a generic product is, the more
dependent its sales are on the quality and availability of its accompanying
services (Bowen et al., 1989:88). Staff should display a professional attitude
when dealing with customers as this adds value to the interaction. ―Judgement,
advice, autonomy, diagnostic ability, self-motivation, knowledge and discretion
are among the hallmarks of professionalism‖ (Haywood-Farmer, 1988:22). All
employees should have elements of these characteristics. The greater the ability
of an employee to act like a professional and to exercise their judgement, the
higher the quality of the service they offer to the customer (Haywood-Farmer,
1988:22).

19
Shemwell, Yavas and Bilgin (1998:155) state that service quality and consumer
satisfaction are both at the core of the marketing concept of an organisation.
Their view is that delivering high quality service and having satisfied customers
are indispensable for gaining a sustainable advantage in a highly competitive
environment, especially with the understanding that keeping a loyal base of
customers is far more profitable for an organisation than having to attract new
customers. According to the Technical Assistance Research Project, it costs
approximately four times more to attract new customers to an organisation than
to keep the existing customers (Ghobadian et al., 1994:44). Six times the number
of people will hear about a negative customer experience than will hear about a
positive one (Ghobadian et al., 1994:44). A positive word of mouth can be a
powerful tool to attract new customers, while a negative word of mouth can have
a devastating impact on efforts to attract new customers and therefore on the
credibility and effectiveness of an organisation‘s efforts to attract new customers.
A positive word of mouth along with repeat sales and customer loyalty are
determined largely by the customer‘s level of satisfaction (Homburg & Rudolph,
2001:15). A customer updates their expectations about the service or goods of an
organisation each time they receive relevant information about the service or
goods through word of mouth or other forms of communication from within the
organisation or from other contacts (Boulding, Kalra, Staelin & Zeithaml, 1993:8).
Pharmaceutical manufacturers, especially generic manufacturers, face the
challenge of retaining customers on a daily basis. If one of the manufacturer‘s
products is unavailable to the dispenser at the time of purchase, it is very easy
for the dispenser to switch the customer to an opposition product. This is
especially true because generic substitution is mandated and that equivalent
generics have an SEP. A competitor‘s generic product performs the same
function as the original product, does not cost the customer more than the
original product and if available when required may result in generic brand
switching. Winning the customer back to the original Aspen Pharmacare generic
20
product will be a difficult task and results in lost sales of that generic for that
customer.
Organisations that can adapt to the new marketplace and deliver on business
performance will survive. The key business performance metrics that make a
business sustainable are customer satisfaction and inventory turns. Customer
satisfaction includes supplier capability and performance, manufacturing
efficiency, sales performance, schedule accuracy and forecast accuracy. The
inventory turns metric reflects the efficiency between the sales, planning,
manufacturing and distribution systems (Chatterjee, n.d.). Proper alignment of its
manufacturing processes to match their marketing section‘s intended markets will
ensure that an organisation survives (Rosen & Karwan, 1994:43). The ability of
the staff from different sections to work together across sections and functions
will ensure that the correct information is available to the staff that require it.
Working together to supply the correct product or information may minimise ‗out-
of-stock‘ situations, maximise sales, minimise generic brand switching and keep
the customer satisfied and loyal.
Magidson and Polcha (1992:37) say that unresponsive internal sections make it
difficult for an organisation to adjust to changing customer needs and to meet
competitive challenges. They comment that many organisations studied their
internal processes as a result of problems such as:
inferior quality of internally produced products and services;
a lack of cooperation between divisions and departments;
rising headcounts in support departments;
increasing overhead costs; and
a widespread apathy amongst affiliated divisions and departments.
Lawrence and Wiswell (1998:45) agree with Magidson and Polcha (1992:37) and
state that in most organisations many different sections rely heavily on each
other‘s services on a daily basis. In the ever-changing business environment, an

21
organisation cannot afford to have sections that cannot work together. Internal
service needs to be addressed to improve cooperation and the level of service
between the internal sections to improve the responsiveness to the external
market of that organisation.
Cook (2002:2) lists the following benefits that an organisation, amongst others,
can gain by focusing on the customer:
differentiate itself from the competitor;
improve its image in the eyes of the customer;
improve profitability;
increase customer satisfaction and retention;
achieve a maximum number of advocates for the organisation;
enhance its reputation;
ensure products and services are delivered ‗right first time‘;
improve staff morale;
increase employee satisfaction and morale;
increase productivity and reduce costs;
encourage employee participation;
foster internal customer/supplier relationships; and
bring about continuous improvements to the operations of the
organisation.
2.3 TOTAL QUALITY MANAGEMENT AND QUALITY IMPROVEMENTS
The quality movement introduced the concept of internal and external customers.
Traditionally the focus was on external customers with very little thought given to
how internal staff and sections interacted. Improving relationships with internal
customers and suppliers assists in the delivery of better customer service to
external customers through reduced lead times, increased quality and better
communication (Swinton, n.d.). Organisations are implementing customer service

22
and total quality training programs in order to provide employees with the
knowledge and skills to achieve customer satisfaction and loyalty (McDermott &
Emerson, 1991:62; Homburg & Rudolph, 2001:15). Gaining the commitment and
involvement of every employee is vital, and focus needs to be placed on
developing and shaping the potential of every individual towards the
development of the organisation (Lakhe & Mohanty, 1994:23). The TQM
movement has also led to a greater focus being placed on the measurement of
customer satisfaction (Homburg & Rudolph, 2001:15).
Total quality management (TQM) may be defined as ―a continuous quest for
excellence by creating the right skills and attitudes in people to make prevention
of defects possible and to satisfy customers and product or service users
completely at all times, and it is an organisation-wide activity that has to reach
every individual within an organisation‖ (Lakhe & Mohanty, 1994:9). Another
definition of TQM is given as ―a comprehensive approach to improving
competitiveness, effectiveness and flexibility through planning, organising and
understanding each activity, and involving each individual at each level in all
types of organisations‖ (Oakland, 2003:41).
Lakhe and Mohanty (1994:12-13) give the following ways in which a TQM
approach differs from a traditional management approach:
TQM focuses on customers absolutely. The customer focus brings
competitive edge to an organisation.
‗Products conquer markets‘ is the basic edifice of TQM.
TQM takes the view that profits follow quality, not the other way around.
TQM views total quality as having multi-dimensional attributes.
TQM creates goal-directed connections between customers, managers
and workers. Everyone is motivated to contribute towards quality. TQM
empowers each and every employee, regardless of level, to find better
ways to work. Traditional management, in contrast, is monolithic: workers
work and managers manage the workers.

23
TQM is process-orientated, as against the traditional results-orientated
approach.
TQM favours a long span of control, with authority pushed down almost to
the lowest level, as against short spans and many layers of authority in
traditional management cultures. Accountability is embedded at every
level.
TQM requires a multi-skilled workforce with job rotation, in contrast to
division of labour.
In essence, TQM is collectively owned by the entire workforce of the organisation
and it is everybody‘s concern to improve quality continuously (Lakhe & Mohanty,
1994:12-13). TQM promotes the collaboration of managers from different
sections to improve quality and productivity with quality becoming the integrating
concept between production and marketing (Ballantyne et al., 1995:8).
Figure 2.2 shows the link between productivity and TQM (Lakhe & Mohanty,
1994:21). They explain that TQM adopts a three-pronged approach: a
commitment from management, teamwork and participation, and quality systems.
Teamwork and participation assist in bringing about a cultural change that result
in an enhanced work environment which then improves worker morale. An
enhanced work environment and high worker morale are essential for creating
better service and product quality. Improvements in organisational culture and
internal communication also improve both internal and external customer
satisfaction. These are vital for growth of market share and profitability. The
quality system is fundamental to reducing waste, inventory and bottlenecks. The
result is the continuous production of higher quality products with an improved
service quality from the staff. TQM brings together the leadership and the
workforce in an environment of teamwork and participation within quality

24
systems. This leads to improved customer satisfaction, increased market share,
customer loyalty and profitability.
Figure 2.2: TQM and Productivity Linkage
Source: Lakhe and Mohanty (1994:21).
The relationship between quality, customer service and marketing is changing. In
respect of quality, the traditional production based concept of a ―conformance to
specifications‖ is giving way to a market orientation of quality that is based on
customer perceived quality. Customer service is now set in a broader context, as
a cross-functional coordination issue, and it impacts on relationships with specific
markets across a range of an organisation‘s activities. The idea of total quality
across all functions extends the scope of quality management to the total
relationship between an organisation and its customers, supplier and other key
markets on an ongoing basis (Christopher, 1991:2). The extensive failure of

25
marketing initiatives in meeting customer requirements and in meeting
management and staff expectations is a matter of concern (Christopher, 1991:2).
Successful marketing initiatives offer a product-service package that appeals to
the needs and desires of a particular segment of customers in an organisation,
but the effort is pointless if the organisation does not have the ability or staff to
design, produce, support and manage the distribution and delivery process
(Cook & Verma, 2002:44). In response to increased global pressures, many firms
have adopted practices such as TQM, reengineering, benchmarking and other
improvement-orientated programs (Cook & Verma, 2002:44).
A conceptual framework which proposes that employees‘ perceptions of the
organisations‘ quality system are linked to the determinants of service quality,
which in turn are linked to both monetary and non-monetary performance
measures, has been developed by Cook and Verma (2002:45). This is presented
in figure 2.3. This framework again emphasises the link between a quality
system, service quality and performance. The quality system should have a focus
on the customer, the market and on the human resources of the organisation.
Service quality should be determined by the service quality dimensions of
tangibles, reliability, responsiveness, assurance and empathy (SERVQUAL
dimensions). The overall performance of an organisation is defined in terms of its
monetary and value gains.
Chaston (1994b:45) states that when an organisation is advised about
implementing a TQM program, it is frequently stressed that quality should not be
managed just as the interface between customer and supplier, but should instead
be encompassing of all of the relationships within the organisation through the
creation of an internal marketing program. Internal marketing has been used by
organisations who wish to create a service-orientated and customer-orientated

26
Figure 2.3 Conceptual Framework of Cook and Verma
Source: Cook and Verma (2002:45).
culture among their employees with the aim of improving the customer‘s
perceptions of service quality and satisfaction (Hogg et al., 1998:881; Kang,
James & Alexandris, 2002:278). Internal marketing will be discussed in more
detail in section 2.8. Christopher, Payne and Ballantyne (cited in Chaston,
1994b:45) suggest that ―quality has become the integrating concept between
production and marketing…making operational the connection between what the
customer wants and the activities of the firm‖.
Farner, Luthans and Sommer (2001:351) provide a process perspective with a
theoretical underpinning for internal customer service. Two theoretical concepts
are suggested: process management and continuous improvement. Process
management refers to management practices that emphasise the processes of
an operation and involves examining all organisational activities in the order in
which they occur. Emphasis is placed on what precedes each activity (the
inputs), what occurs within each activity and what follows it (the outputs). A
flowchart is developed which allows all activities to be examined in sequence of
occurrence and by pinpointing the trouble spots, quality can be improved. The
other theoretical concept is continuous improvement where organisations
continuously strive to improve their products and services.

27
Continuous improvement is a key philosophy in TQM to achieve both product
and process excellence (Pieterse et al., 2010:101). Adopting a continuous
improvement stance forces an organisation to recognise that future changes will
be needed to ensure future competitiveness, regardless of current success. The
term ―internal customer‖ evolved from both the process and continuous
improvement principles. Internal customer service serves as a useful framework
for implementing a process approach to quality management on a continuous
basis (Farner et al., 2001:351). When staff participate in the quality improvement
process, the beneficiaries are the staff themselves as well as shareholders and
customers (Christopher, 1991:12). Marshall, Baker and Finn (1998:382)
comment that a successful internal customer service system is a key principle of
most TQM initiatives, in which all organisation members are trained to view co-
workers up and down the value-adding chain as important customers.
TQM can be seen as the integration of two functions: total quality control and
quality management. Total quality control incorporates customer satisfaction,
employee satisfaction and product quality assurance at all stages; along with
continuous improvement and innovation. Quality management is a way of
facilitating and integrating the capabilities of the employees of an organisation for
continuous improvement through planning, organising and directing.
Implementing TQM in an organisation brings the staff together to improve product
and process quality, the work environment and the culture of the organisation.
TQM can be seen as the mechanism for integrating processes and people in a
quality conscious environment (Lahke and Mohanty, 1994:10).
Dick, Gallimore and Brown (2001:52) examined the relative importance attached
by certain manufacturing organisations to internal and external dimensions of
quality and analysed the relationship between these quality dimensions to the
importance placed on the possession of a Quality Certificate. Only a small
percentage of the organisations that achieved certification showed any gains.
These benefits were largely internal rather than benefiting external dimensions

28
such as market share. Dick et al. (2001:54) found that when an organisation
obtained a certificate purely as a means to improving quality rather than for show,
they used the quality certificate as a means of improving the internal processes,
and/or to help lower the quality costs and to increase customer focus within the
organisation.
Lakhe and Mohanty (1994:13; 15) agree with Dick et al.‘s (2001) findings
regarding quality certification and also comment that many organisations use
many of the popular quality management tools and techniques but that they use
these techniques, procedures and systems in a superficial manner. They further
contend that although industries had a traditional approach to quality matters, the
adoption of programs such as ISO 9000 has given a new drive to the quality
movement and is beginning to be reflected by a commitment of top management
through better investments, rewards and equality. This will occur when TQM and
ISO 9000, amongst others, are used to improve quality and not simply as
window-dressing or a quick way to enter export markets that require certification.
2.4 THE ROLE OF HUMAN RESOURCES IN CUSTOMER SERVICE
People are responsible for customer service. The hiring, training and retaining of
quality employees is the responsibility of both the Human Resources (HR)
Department and of management. The recruitment of capable staff is the first step
to ensuring that the staff are in the right positions and the level of customer
service offered by these employees is satisfactory. The recruitment and selection
of personnel with interpersonal competence is limited by human resource
management‘s focus on cognitive ability and this may lead to an expansion of the
criteria for determining performance to include factors such as effective
customer-contact actions and implementing behaviourally based selection
procedures (Bowen et al., 1989:83). People are hired based on having skills that
match those that have been identified as part of the job profile (Cardy, 2001:12).

29
The traditional measures of the losses incurred as a result of employee turnover
concentrated mainly on the cost of recruiting, hiring and training replacements,
but the real cost of employee turnover is the resultant loss of productivity and
decreased customer satisfaction (Heskett, Jones, Loveman, Sasser and
Schlesinger, 1994:167). The HR Department of an organisation needs to keep
this in mind in their attempts to minimise staff turnover in order to maintain a high
level of customer satisfaction. Management should also try to reduce turnover
amongst staff, especially the customer-contact staff and should assist in
enhancing the employee‘s job skills and not leave this solely to the HR
department (Heskett et al., 1994:169). Low turnover leads to employee retention
which is strongly linked to improved service quality and customer service
(Marshall, 2001:11). Providing a healthy environment for employees minimises
stress and enhances satisfaction and commitment which in turn leads to trust
between the employee and the organisation. This increased level of trust can
lower labour costs as the employees are less likely to leave if they are satisfied
(Zhang, 2010:113).
Employees need to learn how to serve their customers better as well as how to
set customer-focussed performance goals and standards. Employees need the
knowledge, skills, resources and the authority to take care of their customers and
to offer them exceptional service (Swartzlander, 2004:56-7). Magidson and
Polcha (1992:40) concur and add that improved internal relations require staff of
the organisation to understand the other parts of the organisation‘s system and to
receive direct and immediate feedback on their actions. Customer feedback is
seen as an important tool whether the feedback is received from an external or
an internal customer (Longenecker & Meade, 1995:78).
Sections should not be isolated from each other and each employee should know
what each section and staff member does in order to understand how they fit into
the organisation‘s role of satisfying the customer (Swartzlander, 2004:56-7). Any
barriers of distrust which may exist between sections need to be removed. This

30
should be accompanied by actions geared towards developing a greater
confidence in managing the change towards improving the quality of internal
customer service. The benefits of increased organisational productivity through
enhancing active cooperation between the sections of an organisation can also
be demonstrated when the distrust between sections is removed (Chaston,
1994b:55). He further says that participation in these initiatives will lead to a
greater awareness and understanding of why effective management of internal
customers is an integral part of ensuring the survival of an organisation in an
increasingly complex and competitive world.
It is important for employees to be provided with the necessary training and
support so that they are both willing and able to provide excellent service to both
internal and external customers. Another important aspect is to have service
functions and processes in place that will allow the different sections to work
together to support each other (Davis, 1992:37). Management and the HR
department need to motivate and encourage the staff from different sections to
connect and work together to gain commitment, improve understanding, explore
solutions that incorporate the interests and recommendations of all staff, and to
establish linked accountability. This will repair any damage to staff commitment
that may have occurred when the sections were not connecting and working
together (Davis, 2001:45-7).
Management needs to ensure that:
employees are capable of performing their job;
effective teams are created if necessary in the workplace or department;
supervisor controls are established; and
any occurrences of role conflict are minimised (Chaston, 1994b:54).
A climate of nurturing the service culture should be created through suitable staff
training, staff benefits, and by providing incentives which will all encourage a
sense of belonging (Cook & Verma, 2002:49). Management and HR need to

31
focus on the following six issues in order to create a quality service experience
for their employees:
Membership.
Socialisation.
Identity.
Environmental.
Structural.
Interpersonal (George, 1990:66).
Motivation and sources of satisfaction vary amongst employees and using the
correct motivational drivers for the various employee groups can assist in
developing the right programs and rewards that will satisfy everyone (Joseph,
1996:57). An integration of the internal and external customer requirements and
the development of effective communication through training and education
should take place as part of the business plan of an organisation (Lakhe &
Mohanty, 1994:29-30). Training programs that will help the employees to be more
responsive to customers, training in data-handling systems, newsletters and
upgraded facilities are good ways to improve employee skill levels. The costs of
these training programs are worthwhile (Rust & Zahorik, 1993:211).
All staff members, especially the front line staff, need to be suitably trained,
supported and motivated to allow them to perform their tasks effectively, and in
order to be motivated staff require a suitable and clear career path and
opportunities, remuneration and recognition systems, a measurement system
and appraisal procedures (Ghobadian et al., 1994:47). Front line staff have a
great impact on levels of customer satisfaction as a result of their interactions
with the customer (Heskett, 1987:123; Homburg & Rudolph, 2001:30). This is an
important reason for HR to ensure the correct staff are hired for front line
positions. They need appropriate training on a continuous basis to allow them to
interact positively with customers in order to increase customer satisfaction.
Service-focussed behaviours should be recognised, communicated and

32
rewarded. This can be done effectively through including customer contact and
customer service responsibilities into every job description and profile (George,
1990:68). Having good communication and coordination between the front line
employees and the support employees assists in ensuring the delivery of
effective service to the customer (Kang et al., 2002:278).
Christopher (1991:17; 19) feels that loosely coordinated systems result in high
output inconsistency. To alleviate or minimise this, staff should work together
across sections to allow the overall system to flow smoothly irrespective of the
number of sections the system brings together. Staff selection and job training
are important in an organisation to ensure that staff can work together
(Christopher, 1991:17; 19). To achieve this, a generic framework for service
quality management was proposed by Christopher (1991:19-20) and is shown in
figure 2.4.
In this framework, the service quality management system begins with a
customer service research-based benchmarking study and then moves to a
diagnosis of the service issues. Implementation of improvements to the system
on a continuous basis follows, with feedback measures to support further
diagnostic and problem solving activities. These measures reveal the need for
good staff selection and job training. Staff attitudes, behaviour and style are an
intangible part of the value built into products and the services offered. The HR
Department needs to work with management to ensure that the organisation
becomes market focussed, with compartmentalisation of functions such as
production, finance, marketing and purchasing falling away thus allowing for a
smooth flow of information across the various functions (Christopher, 1991: 20).

33
Figure 2.4: Framework for Service Quality Management
Source: Christopher (1991:20).
Personality plays a role in all employee interactions and HR should take this into
account when recruiting and aim to retain the staff who are socialised to be
sensitive and responsive in their dealings with others (George, 1990:66).
Candidates who are applying for a position in the organisation should be
screened to determine if they have any task-oriented skills, if they have the ability

34
to work as part of a team, how dedicated they are to maintaining high levels of
quality, and their motivation and willingness to continuously improve (Flynn et al.,
1994:348). This will result in the recruitment of staff who will fit into an
organisation with a TQM system and a quality-conscious environment where
continuous improvement is a way of life.
People issues in the workplace can be confusing, disagreeable and stressful to
all staff concerned, and, because behaviour in organisations is multi-dimensional
and complex, the dynamics around behaviour needs to be understood and
examined (Cremona, n.d.). There are four levels of interaction in an organisation
and each level shows that individuals are responsible for what happens at each
of these levels (Cremona, n.d.). Levels one and two are the most common ways
that people view people issues, but they are limited in that some of the more
complex behavioural issues are not involved at these lower levels.
Cremona (n.d.) explains the levels as follows:
Level one is the ―individual or intrapersonal‖ level that views the source
and solution to people problems or behaviour as residing in a person. This
level emphasises a person‘s skills, personality and competence with little
emphasis being placed on others or on how a person relates to others.
Level two is the ―interpersonal‖ level and the focus is on the quality and
types of relationships between people and takes factors such as
communication style, listening skills and giving feedback into account.
Level three is the ―group-as-a-whole‖ level where the behaviour of groups
or teams is seen as a social system made up of the sum of its parts. A
person‘s behaviour cannot be explained away by their personality or style
but is viewed as a synthesis of, and interaction with, the group‘s life and
mentality.
Level four is the ―organisational‖ level that sees problems as paralleling or
acting-out a wider organisational dynamic. A parallel process is when
dynamics in one part of the organisation replicate sub-group, inter-group,

35
inter-organisational, societal or global contexts or dynamics and can be
seen when a person treats others in the same way as their superiors have
treated them.
Level three is often the level that will require some effort and HR assistance. The
different tasks, technical, social, and environmental demands of working in an
organisation can raise tension and anxiety of varying degrees in all staff
members. Group members play various roles from the troublemaker (the
outspoken person) to the scapegoat (the person that others deposit their
unwanted emotions onto and then want to get rid of because they find them
difficult to work with). Managers and the HR Department need to ensure that the
troublemaker or scapegoat is in fact the person causing the problems. If the
troublemaker is not the cause of the problem, but was simply the person brave
enough to voice the general opinion, removing them from the group will not solve
the underlying problem. The same issues arise when a new troublemaker fills the
role left vacant, leaving the causative issues unresolved and unaddressed
(Cremona, n.d.).
All employees‘ behaviour should be carefully orchestrated and managed by the
organisation to ensure that the time that they spend interacting with the
customers will shape a positive feeling and judgement about the organisation for
the customer (Joseph, 1996:55-6). Positive employee behaviour will result in
constructive actions for the employee, the organisation and the customer.
Negative behaviour, however, can destroy a productive working environment and
can lead to stress, minor illnesses and even cause depression in the employees
(Kattara, Weheba & El-Said, 2008:310). Internal problems between employees
do not stay internal for long and will often spread to various departments and
cause product quality or increased costs for the customer and the organisation‘s
bottom line (Hart, 1995:64).

36
Figure 2.5 shows the relationship between employee behaviour, customer
perception of service quality and customer satisfaction. Positive employee
behaviour has a positive impact on customer satisfaction, and negative
behaviour has a negative effect. If a customer is satisfied with an employee, the
customer will probably maintain a long term relationship with the organisation.
Service quality, customer satisfaction and loyalty are all influenced by the actions
of employees, and the provision of outstanding service will enhance the
company‘s image and result in improved service quality (Kattara et al., 2008:312;
315). They comment that when customers are satisfied with their interactions
with employees, they may forgive other problems that may occur (Kattara et al.,
2008:321). Hagan (1997:20) states that employees are less likely to be
dissatisfied with minor service problems from other employees if they feel that
the employee will be able to address all their queries.
Figure 2.5: Relationship between employee behaviour and customer satisfaction
Source: Kattara, Weheba and El-Said, 2008:312.
Good planning and coordination, determining that the correct roles are carried
out by all staff, and prior knowledge about customers can assist in ensuring a
successful encounter with a customer. This can be done by an organisation
ensuring that its staff are well-trained and dedicated. High employee turn-over,
inexperienced new employees and low morale amongst professional employees
can all undermine the performance of an organisation during each encounter with
a customer (Joseph, 1996:56). Paying attention to the conditions that allow an

37
employee to perform their job well will result in loyal customers and a resultant
increase in revenue and profits (Brooks, 2000:41).
The design of policies and performance measures by management and HR in an
organisation should lead to improved internal customer service and increase the
fulfilment of the customer‘s needs (Heskett, 1987:123). When employees have a
positive view of the HR policies of an organisation, customers generally have a
positive view of the quality of service that they receive from the organisation. If
employees are satisfied, customers are satisfied. Employee satisfaction is the
ability to consistently meet and even to exceed employees‘ needs, wants and
expectations throughout the period of the employee relationship with an
organisation. This results in employee motivation, loyalty to the employer,
increased productivity and excellent service to the customer. Employee
satisfaction also increases employee loyalty. Fairness in the management of the
human resources of an organisation also contributes to employee commitment to
that organisation. Commitment to an organisation is shown by employees being
more willing to go the extra mile for their customers. If employees are satisfied
and loyal, employee absenteeism, lack of productivity and turnover decrease
while productivity and performance improve (Swartzlander, 2004:59).
Using customer satisfaction measures as an instrument for developing,
controlling and measuring product and service offerings as well as in assessing,
motivating and remunerating employees is used in many organisations
(Scharitzer & Kollarits, 2000:957). Cook and Verma (2002:46) comment that
employees should be seen as a valuable resource for competing successfully in
the marketplace. There is much evidence that satisfied employees create
satisfied customers. A climate for service and employee well-being are highly
correlated with the employee‘s experiences with both the organisation‘s service
climate and the HR department being reflected in the customer‘s experience
during their interaction (Cook & Verma, 2002:46). Bowen and Lawler (cited in
Cook & Verma, 2002:46) observed that motivated and empowered employees

38
who understand the importance of service quality to the organisation will provide
superior service to their customers, and that this superior service should result in
greater customer satisfaction.
Capability opens up new possibilities for employees and organisations.
Throughout the learning process the capabilities of employees are shaped
through a constant path-dependant feedback to the goals that were originally set
for the employee. New or improved employee capabilities can open up the
possibility of setting new goals for the employee. Actions that are taken with the
intention of achieving the set goals could also assist in the appearance of new
capabilities or even of modifications of previous capabilities (Canibano, Encinar &
Munoz, 2006:317). Learning cannot occur without feedback that links an action to
a result (Kaydos, 1991:9). The HR department and management need to be
aware that employees may develop new capabilities through their work by
problem-solving and by undergoing training. These new capabilities need to be
utilised fully so that the employees will feel useful and satisfied. Core capabilities
in an organisation can also be developed by the organisation creating a
customer-orientated culture that allows for the building of strong customer
relationships (Rapp et al., 2010:1231).
The traditional factors of hiring, compensating, training, empowerment,
evaluation, recognition and rewards, advancement and retention are handled
mainly by the HR department and the relevant line manager. Brewster, Carey,
Grobler, Holland and Warnich (2008:128) state that talent management
processes need to be more strategic, connected and broad-based than they
were in the past and should include workforce planning, talent-gap analysis,
recruitment, selection, education and development, retention, talent reviews,
succession planning and evaluation.
Swanepoel, Erasmus, van Wyk and Schenk (2003:13) comment that all aspects
relating to the interaction between the employees and the organisation must be

39
managed to ensure that there is a good fit between all the parties involved in the
employment relationship. They state that because the human factor is central to
operations and to the success of an organisation, it is essential for each
organisation to formulate and implement processes, practices and systems that
enhance the fit between the employees and the organisation. The ultimate aim is
the creation of an employment relationship that is reciprocal and beneficial to
both the employee as well as to all other organisational stakeholders.
2.5 MODELS OF CUSTOMER SERVICE
Numerous models of customer service and service quality have been developed.
Some of these models will be discussed in this section in order to show the
various ways that customer service and service quality interact with factors such
as organisational systems, satisfaction, strategy and performance.
2.5.1 Service Quality Model according to Shemwell, Yavas and Bilgin
Shemwell et al. (1998:156) developed a model which shows the relationships
between service quality, satisfaction and selected behavioural outcomes. The
model was developed in order to explain the underlying processes through which
improvements in service quality lead to higher levels of customer satisfaction and
to desired outcomes such as lesser complaints, emotional bonding, and a
commitment to continue existing relationships. This is shown in figure 2.6. Their
study affirmed the relationships between the various factors. Service quality has
a positive relationship with perceived satisfaction. Perceived satisfaction is
negatively correlated to complaint behaviour and this relationship is significant
but not very strong. Perceived satisfaction is positively linked to affective
commitment. Perceived satisfaction has a direct positive relationship with
continuous improvement. Affective commitment has a positive relationship with
continuous improvement. This model shows that if an organisation improves its

40
service quality, improved customer satisfaction results. Increased customer
satisfaction should see a decrease in complaints regarding the service the
organisation offers. Commitment to the organisation also increases which should
lead to loyal customers.
FIGURE 2.6: Conceptual Model of Shemwell, Yavas and Bilgin
Source: Shemwell, Yavas and Bilgin (1998:163).
2.5.2 Service Quality Model according to Haywood-Farmer
Figure 2.7 shows Haywood-Farmer‘s service quality model. Ghobadian et al.
(1994:59) explain Haywood-Farmer‘s model as follows: The key element in
attaining high quality is the identification of customer‘s service requirements and
expectations. The attributes are then separated into groups. Haywood-Farmer
(1988:23) provides three types of basic service attributes which are placed at the
three apexes of the triangle: physical facilities, processes and procedures;
people‘s behaviour and conviviality; and professional judgement. Management
needs to determine where their organisation lies within the apexes, and this will
enable them to provide a service whose elements are internally consistent and

41
are focused on meeting the needs of a specific segment of the target market.
Three operational factors should be considered to determine the position of the
Figure 2.7: Service Quality Trade-off Continuum and Suggested Positions
Source: Ghobadian, Speller and Jones (1994:60).

42
service of an organisation: the degree of service customisation, the degree of
labour intensity, and the degree of contact and interaction. The model is helpful in
terms of identifying the quality trade-offs and the links between quality and
operational factors. The model has the potential to enhance understanding but it
does not offer a practical procedure to help management to identify service
quality problems or a practical means of improving service quality (Ghobadian et
al., 1994:59).
An appropriate balanced mix of the three service attributes is required to ensure
good quality service. The appropriate mix is determined partly by the relative
degrees of service process customisation, labour intensity and by the level of
contact and interaction between the final customer and the service process
(Haywood-Farmer, 1988:28).
The three dimensions of Haywood-Farmer (1988) correspond to three operations
management concerns, namely: the labour content of the task, the
standardisation of the task and the standardisation of output of the organisation
(Rosen & Karwan, 1994:42). They further comment that in effective
organisations, a relationship exists between the three operational dimensions
and the service quality dimensions, which are based on the perceptions and
expectations of the customer.
2.5.3 Customer Service Model according to Swartzlander
Swartzlander (2004:12-13; 18) provides a model of customer service (see figure
2.8) where the customer is the focus and is placed in the centre of the model.
The other parts of the model are the customer service strategy, systems, and
people. Each part affects and interacts with the other components. Customer
service is built from and by the strategy of the organisation and its management
through its mission, values and vision. The organisation needs to be committed

43
FIGURE 2.8: Customer Service Model of Swartzlander
Source: Swartzlander (2004:18).
to the customer and design its products and their delivery to fulfil the customer‘s
needs and expectations in terms of quality of product and quality of customer
service. An organisation needs quality products and needs to execute well in the
other areas. Operation systems are based on the set of activities that create
goods and services by transforming inputs into outputs. The operation systems
are planned and managed with the customer in mind. The environment, including
the equipment and physical appearance of the organisation, contribute to
customer service. People are the final component and their behaviour, action and
skills influence customer service. Attitude, work ethic, knowledge, and
communication, teamwork and management skills influence customer

44
experience. Employees must be recruited, trained, motivated, evaluated and
rewarded for excellent customer service.
2.5.4 Service-Profit Chain
The service-profit chain establishes relationships between profitability, customer
loyalty, and employee satisfaction, employee loyalty and productivity (figure 2.9).
Heskett et al. (1994:164-5) explain that the links in the chain should be regarded
as propositions. The links are:
Profit and growth are stimulated primarily by customer loyalty.
Loyalty is a direct result of customer satisfaction.
Satisfaction is largely influenced by the value of services provided to
customers.
Value is created by satisfied, loyal and productive employees.
Employee satisfaction results primarily from high-quality support services
and policies that enable employees to deliver results to customers.
Heskett et al. (1994:168) comment that leaders who understand the service-profit
chain develop and maintain a corporate culture that centres on employee‘s
service to customers and to fellow employees.
Samuel (2005:11) provides additional insight into some of the links. He states
that a customer must be satisfied (feel positive emotions) long enough and
consistently enough to become loyal and that the customer‘s perception of value
they have received largely determines their level of satisfaction. He proceeds to
say that employee productivity is the primary driver of value and loyalty is the
major determinant of productivity, therefore, loyal employees will go the extra
mile for customers and their managers. Employees are loyal to an organisation
when they feel satisfied. A satisfied worker is more loyal and productive than their
unmotivated, dissatisfied counterparts. Employee satisfaction is largely driven by

45
FIGURE 2.9: Service Profit Chain
Source: Samuel (2005:10).
the internal quality (the feelings that employees have toward their jobs, co-
workers and the organisation) of the working environment. Cronin and Taylor
(1992:55) also noted that service quality has an effect on customer satisfaction,
and that customer satisfaction increases buying from the organisation.
Farner et al. (2001:351) mention that the concepts of process management and
continuous improvement (refer to section 2.3) are operationalised in the service-
profit chain. This model is based on the premise that internal service quality
drives or predicts employee satisfaction, which in turn, enables the organisation
to deliver high value service, resulting in customer satisfaction and loyalty. This
ultimately leads to increased profits (Farner et al., 2001:351; Homburg &
Rudolph, 2001:15). This is in agreement with the service quality model proposed
by Shemwell et al. (1998:163) which was discussed in section 2.5.1.
The Service-Profit Chain perspective highlights the fact that service quality
should be integrated along the entire supplier-customer chain, reflecting ―a basic
business strategy that provides goods and services that completely satisfy both

46
internal and external customers by meeting their explicit and implicit demands‖
(Tenner & DeToro cited in Marshall et al., 1998:381).
Cook and Verma (2002:53) demonstrate that the employee‘s perception of
service delivery quality (tangible, reliability, responsiveness and empathy) impact
the performance of an organisation as measured by both monetary and value
gain which is consistent with the service-profit chain. The elements in the service
profit chain are ―interdependent and complex; the strength and size of their
influence varies by industry, market segment and even by organizational
function‖ (Brooks, 2000:40). The connections in the service profit chain can be
measured in order to determine what is important to both customers and
employees in relation to increasing revenues and profits. Figure 2.10 shows the
linkages in the service profit chain that are most valuable in linking employees to
customers and finally to the revenue and profits that an organisation can realise.
Figure 2.10: The employee-customer-bottom line linkages.
Source: Brooks, 2000:41.
47
2.6 THE DIMENSIONS OF SERVICE QUALITY
Ghobadian et al. (1994:52-55) provide a table, as seen in table 2.1, that depicts
the determinants of quality identified by Parasuraman, Zeithaml and Berry
(1985:47) and Haywood-Farmer (1988:21) for profit-making services, as well as
three sets of determinants for non-profit making services, and one set of
determinants for products. Ghobadian et al.‘s (1994:55) comparison of the
determinants of quality shows:
―the commonality of reliability, responsiveness and access;
the degree of correspondence between the determinants of private and
public service‘s quality; and
the extent of similarity between service and product determinants of
quality.‖
This approach attempts to develop a theoretical bridge to the customer‘s vantage
point. The importance and the effectiveness value of each determinant of quality
is dependant on the nature of the service offered.
Parasuraman, Zeithaml and Berry (1991:445-6) clarify that their SERVQUAL
technology is a useful starting point, but not the final answer, for organisations
wishing to assess and improve their service quality. Its standard dimensional
structure provides a meaningful framework for monitoring an organisation‘s
service quality performance over time. The service quality performance of one
organisation can also be compared against the performance of competitors
through the administration of SERVQUAL.
SERVQUAL is most valuable when it is used to track service quality trends and
when it is used in conjunction with other forms of service quality measurement
(Parasuraman, Zeithaml and Berry, 1988:31). The service quality dimensions
that are important to an external customer will not necessarily be the same as the
service quality dimensions that are important to internal customers (Kang et al.,
2002:281).

48
Table 2.1: Comparison between Determinants of Service Quality

49
Table 2.1: Comparison between Determinants of Service Quality cont
Source: Ghobadian, Speller and Jones (1994:53-4).

50
Garvin (1987:104) states that high quality means pleasing customers, not just
shielding them from problems. He proposes eight dimensions or categories of
quality which are specific to products. The eight product quality dimensions are:
performance;
features;
reliability;
conformance;
durability;
serviceability;
aesthetics; and
perceived quality.
These product quality dimensions can serve as a framework for strategic
analysis in an organisation because a product or service can rank high on one
dimension of quality and low on another. Strategic quality management takes into
account the fact that sometimes an improvement in one dimension may be
achieved only at the expense of another. Managers in operations and marketing
need to learn to compete on the selected dimensions that make strategic sense
(Garvin, 1987:104). Kaydos (1991:18-19) gives the same product quality
dimensions. Marketing and operations need to work together to ensure that the
organisation is moving in the same direction as the customer (Rosen & Karwan,
1994:39).
The most traditional dimensions, namely, conformance and reliability, remain
important but only form part of a larger strategic framework. An organisation need
not pursue all eight of the product quality dimensions concurrently as this may
result in having to charge higher prices for their products than the price of the
opposition products. An organisation should bring in the product quality
dimensions that are important to customers, ignore those that are unimportant,
and should give attention to the dimensions that the customers consider critical
(Garvin, 1987:108-9). Determining which product quality dimensions are

51
important to customers and are most cost effective to an organisation will require
interaction between the marketing and operational staff. By creating products
with a design and quality that meet the customers‘ expectations better than the
competitors‘ products will result in an increased market share for an organisation
(Flynn et al., 1994:347).
Swartzlander (2004:62-3) feels that important work ethic characteristics are
reliability, responsibility and adaptability. These correspond with some of the
service quality dimensions of the SERVQUAL model.
Customers prefer to deal with people they can trust, and who are knowledgeable,
technically able, and are friendly and polite (Cook, 2002:15). Customers expect
reliability in their dealing with staff as they would like their services to be
performed in a similar manner every time they are served by the service provider
(McDermott & Emerson, 1991:63).
McDermott and Emerson (1991:63) give the following as the basic expectations
of the quality of service they expect from internal staff:
―that the departments have adequate resources available to meet
commitments;
the departments respond quickly to requests for information;
the departments have few errors in written reports;
that the departments provide adequately prepared staff members to satisfy
their needs; and
that the departments have a willingness to fix problems when they occur
by doing everything possible to correct the problem.‖
These expectations correspond closely with SERVQUAL‘s service quality
dimensions and will be addressed in the study questionnaire and results.

52
Staff that experience internal customer service identify the following as indicators
of good quality service: responsiveness, other staff trying to meet deadlines set
by circumstances beyond their control, and simply meeting a deadline that has
been set for them (Lawrence & Wiswell, 1998:46).
In their study on the applicability of internal service quality dimensions to internal
supplier-customer interactions, Brooks, Lings and Botschen (1999:58) found that
eight of the ten SERVQUAL service quality dimensions were important to internal
customers. They found that the tangibles dimension was not important to internal
customers, and that the security dimension, although important to external
customers, was also unimportant to internal customers.
Information services in all industries, including the pharmaceutical industry, are
important as information provision is a significant element in the core activities of
an organisation. Ensuring that information services are serving the needs of the
organisation and the customer base stimulates quality assurance within a quality-
orientated organisation. Relevance, accuracy and timeliness of information
appear to be key indicators of quality in the information services of organisations
(Kinnell, 1997:3-4).
Bowen et al. (1989:83) discuss the SERVQUAL technology‘s service quality
dimensions and group all of the service quality dimensions, except tangibles,
together as intangibles. They further state that manufacturing firms that pursue
goals which are service-related and have high levels of customer contact and
interaction, need to ensure that the intangible service quality dimensions
(reliability, responsiveness, competence, access, courtesy, communication,
credibility, security and understanding the customer) are as important in their
product design as the tangible dimensions (such as product styling) are (Bowen
et al., 1989:83). The intangibles that an organisation provides may be the most
important source of value added in the new business economy (Bowen et al.,
1989:92).

53
Chaston (1994b:47) completed a study of certain United Kingdom manufacturing
organisations and these organisations identified the accuracy and dependability
with which tasks were carried out as being the most important service quality
dimensions and factors in their performance evaluation. This result was obtained
using a modified version of the SERVQUAL research tool.
In their study regarding the relative importance attached to internal and external
dimensions of quality, Dick et al. (2001:52; 55) found that the reliability dimension
(the ability to perform the promised service dependably and accurately) was the
most critical driver of customer service quality, and they felt that the reliability
dimension equated to the conformance dimension of Garvin (1987:104).
Reliability was demonstrated as being the most important service quality
dimension with empathy, a composite of understanding the customer and access,
being the most unimportant across a variety of service types (Rosen & Karwan,
1994:41). They also note that the tangibles dimension was often unimportant in
studies using a variation of SERVQUAL. The tangibles and security dimensions
were found to be unimportant to internal customers (Kang et al., 2002:281-283).
Kang et al. (2002:288) comment that the reliability and responsiveness
dimensions are critical to both the perceptions of internal service quality and to
providing external customers with a quality service. They also noted that in their
study the reliability and responsiveness dimensions influenced overall service
quality perception. This implies that ―employees perceive some quality aspects to
be more important than others for determining the quality of the service they
receive from other internal providers‖ (Kang et al., 2002:287). An organisation
needs to determine which service quality dimensions are the most important and
therefore require the most attention. These influential service quality dimensions
should be monitored to ensure that employees receive a continuously high level
of internal service (Kang et al., 2002:288).

54
Cook and Verma (2002:44; 47) used the SERVQUAL model in their study which
explored the linkages between quality systems, employee service-quality culture,
and performance excellence. They found that customers considered the following
five service quality dimensions in their assessment of service quality: reliability,
responsiveness, assurance, empathy and tangibles. They say that these
dimensions represent how the customer organises information about service
quality in their minds. Customers can sometimes use all of the service quality
dimensions to determine service quality and at other times they may only
consider a limited subset of these service quality dimensions (Cook & Verma,
2002:47).
Kattara et al. (2008:318-319) also used the SERVQUAL dimensions as part of
their study. They found that the reliability dimension rated the highest, followed by
responsiveness, tangibles, assurance and, lastly, assurance. They comment that
employees should ensure that they improve on the reliability and responsiveness
dimensions by minimising negative behaviour and increasing positive behaviour
at the time of customer contact.
2.7 INTERNAL CUSTOMER SERVICE AND QUALITY
Customer service is found at every point of contact between customers and
employees. All of an organisation‘s employees, supervisors and support sections
including organisation executives, need to support staff in meeting the customer
needs and expectations. All employees then become customer service providers
for either external or internal customers through all communication channels
such as personal contact, by telephone, via email or over the internet.
Exceptional customer service cannot be delivered to external customers unless
all employees provide support to each other (McDermott & Emerson, 1991:62;
Kang et al., 2002:278-9; Swartzlander, 2004:2; 38). ―There is a direct link
between internal market outcomes (e.g. satisfied employees) and external

55
market outcomes (e.g. customer favourable perception of service quality or
customer satisfaction)‖ (Brooks et al., 1999:49).
Internal service can be seen as the sum of an organisation‘s systems, processes,
and relationships between employees. ―Internal service is a product of the
organization‘s tools, information systems, policies and procedures, collaboration
among departments, management support, goal alignment, training,
communication, and appropriate recognition and reward for delivering value‖
(Brooks, 2000:40).
Many employees are support personnel and they do not have contact with
external customers, but they indirectly influence the service received by the
customer (George, 1990:67). These support personnel can be seen as ―part-time
marketers‖ as they need to recognise the front line employees as their internal
customers. The support personnel should perform marketing-type activities for
the front line employees, (their internal customers), as a means of assisting the
front line employees in servicing the external customer (George, 1990:67).
An organisation consists of an interdependent chain of individuals and functional
units, with each taking inputs from one another and turning them into external
customer service. The basic assumption is that if everybody strives to provide
their internal customer with better service, then the end customer will receive
higher quality service (Rafiq & Ahmed, 1993:221; Farner et al., 2001:350).
Internal guarantees are a method that has been used successfully to ensure the
delivery of promised goods or services to internal customers on time and in a
satisfactory way. If the service is not satisfactory or completed on time, a penalty
is imposed (Hart, 1995:64). An internal guarantee creates a ―virtuous circle:
internal processes are debugged so employee morale and commitment rise,
internal and external customers are better satisfied, further boosting employee
morale and performance, and so on‖ (Hart, 1995:73). In line with the service
profit chain concept, improvements in internal service quality should also lead to

56
improved external service quality (Lings & Brooks, 1998:330; Marshall et al.,
1998:381-2). Kang et al. (2002:288) agree that both internal and external service
quality are important to an organisation in order to be more competitive.
While there are similarities between an external and an internal customer, a large
difference between the two is that external customers consume both services
and goods, while internal customers mainly consume services offered by the
other sections of the organisation (Marshall et al., 1998:383). Internal service
quality is characterised by the attitudes that people have towards one another
and in the way that employees serve one another inside the organisation
(Marshall et al., 1998:381-2).
It is very difficult for an internal customer to go elsewhere for the service they
require should it not be forthcoming in the required timeframe, as the service has
to be supplied internally. Internal customers have little or no choice about where
to do business, in contrast an external customer has a choice about where they
want to do business and can change their supplier (Rafiq & Ahmed, 1993:221;
Marshall et al., 1998:383; Farner et al., 2001:352).
Farner et el. (2001:352) states that in free market situations an external customer
has the option of exiting relationships with their suppliers, but for internal
operations, the opportunity does not traditionally exist for their internal customers
to exit the relationship unless the service is outsourced to an outside supplier.
Internal customers are also viewed as having been paid for their services by the
organisation and are trained consumers of the services they use. As such the
internal customer is more familiar and knowledgeable regarding the services that
are provided to them than most external customers would be about the same
services (Rafiq & Ahmed, 1993:221; Marshall et al., 1998:383).
Organisational sections should provide a high level of service quality to their
internal customers for the same reasons that they provide it to their external

57
customers, namely, more effective performance, lower waste and lower costs
(Marshall et al., 1998:381).
Each employee serves two interchangeable service roles with fellow staff, as a
giver and as a receiver, but not at the same time and all employees participate in
a customer/supplier relationship (McDermott & Emerson, 1991:62; Lawrence &
Wiswell, 1998:46; Marshall et al., 1998:382; Farner et al., 2001:350-1). The tasks
and employees of an organisation will determine which internal services are
important and also how important the quality of the internal services are
(Hallowell et al., 1996:20).
Internal customers need high-quality suppliers to be effective, yet internal
suppliers are frequently insensitive to customer needs (Longenecker & Meade,
1995:81-2). They feel that managers and executive-level personnel must address
the following critical questions as a way of incorporating customer service
thinking in their management style and to become willing to adapt their style to
internal procedures at every level:
Why does my department exist? What value-added function do we serve?
Who are my customers and what do they need from this department to
function?
Are my people clear about their roles and responsibilities in serving
internal customers?
How do we know when we are doing a good job of satisfying our internal
customers?
What policies, procedures and practices prevent us from effectively
servicing our internal customers?
Are we encouraging internal customer dialogue to continuously improve
delivery systems and solve service problems?
If I encourage my department to become customer-orientated, can I avoid
being taken hostage to a misunderstanding of frivolous wants and drop-
dead, have-to-have needs?

58
Employee relationships can be improved in many ways, including establishing an
internal customer service strategy, creating an internal marketing plan, providing
interpersonal relations training, developing performance standards and by
conducting brainstorming meetings (McDermott & Emerson, 1991:61). Farner et
al. (2001:352) comment that periodic evaluations of each department are
necessary for accurate feedback in cases where the internal sections are treated
as customers. Marshall et al. (1998:383) state that in order to deliver high levels
of service quality, the providers of internal service functions need to understand
the service requirements of their customers and to ask these customers to
evaluate their department against their requirements.
Groups of internal users can be visualised as segments with different needs. In
order to adopt an internal customer segmentation approach to internal customer
service delivery, the internal sections are required to improve customisation of
their service offerings to fit the unique needs of the different user groups
(Marshall et al., 1998:390-1). This customisation can take the form of:
using different ways of communicating service offerings within the
organisation such as face-to-face or the intranet web page;
varying product forms such as using different report styles and content for
different users;
using variable cost structures for different service level requirements such
as charging a premium rate for a service delivery which is required
sooner than normal; and
using alternative means of service delivery such as telephone or fax.
This approach contributes to the value-adding capability of that department‘s
position in the service profit chain of the organisation, which results in greater
organisational efficiencies as well as more satisfied internal and external
customers (Marshall et al., 1998:390-1).

59
Internal service quality is defined as ―employee satisfaction with the service
received from internal service providers‖ (Davis, 1992:34). Satisfied employees
are a prerequisite to the satisfaction of external customers (Kang et al.,
2002:279).
Internal service quality is important as it links to both customer satisfaction and
job satisfaction. An organisation should devote as much time to evaluating
internal employee satisfaction as it does to external customer satisfaction (Davis,
1992:34). Employee opinion surveys are important for tracking the relationship
between internal employee satisfaction and external customer satisfaction
(Davis, 1992:35). Internal employee satisfaction should be evaluated and treated
with importance. The basic needs of internal customers should be satisfied in a
similar manner to how the external customer needs are satisfied. The satisfaction
of internal customers is necessary before an organisation will be able to provide
quality service to their external customers (Farner et al., 2001:352-3). This is
known as internal marketing and will be discussed in section 2.8.
Assessing internal service quality and by having an understanding of how the
service quality dimensions impact on the organisations‘ overall service quality
should allow the organisation to design an appropriate service delivery process.
Allocation of internal resources to provide improved internal customer service
and thereby better external customer service can be determined by identifying
the internal strengths and weaknesses linked to the service quality dimensions.
Feldman (1991:58) states that internal customer relations are needed to ensure
that employees understand the importance of what they do and how it affects
others in the chain if they do not complete their work correctly or on time.
2.8 INTERNAL MARKETING
Joseph (1996:55) gives the following definition of internal marketing: ―Internal
marketing is the application of marketing, human resources management, and

60
allied theories, techniques and principles to motivate, mobilise, co-opt and
manage employees at all levels of the organisation to continuously improve the
way they serve external customers and each other. Effective internal marketing
responds to employee needs as it advances the organisation‘s mission and
goals‖. This definition suggests that the term ―customer orientation‖ should be
broadened to include external as well as internal customers, with internal
customers being any section that is serviced by another section within the same
organisation (Joseph, 1996:55).
Internal marketing programmes should be aimed at the internal sections of an
organisation in order to complement the external marketing programme. These
internal sections are made up of a variety of employees who fulfil a number of
functions and jobs. This relates to the internal customer and supplier concept in
which an organisation is divided into different sections each with different wants
and needs (Lings & Brooks, 1998:327-328). Internal marketing affects how the
employee sees their role in the organisation and how their role is related to the
wider organisational environment (Hogg et al., 1998:893).
Gremler, Bitner and Evans (cited in Joseph, 1996:55) report that an employee‘s
satisfaction with their organisation can be influenced appreciably by the service
encounters they experience from the internal service providers. Internal
marketing should focus on achieving effective internal exchanges between the
organisation and its employees as a qualification for having a successful
relationship with the external customer (George, 1990:50). Successful internal
marketing is employee-focussed with the ultimate goal of building effective
service strategies that serve external customers (Joseph, 1996:57). The
recognition that the quality of relationships within the organisation is critical to the
success of the marketing plans forms an important tenet of internal marketing
(Christopher, 1991:7). Marketing, HR and management need to work together to
set service levels, as internal marketing is the responsibility of all sections not the
sole responsibility of a single section (Rafiq & Ahmed, 1993:228).
61
An organisation should have a ―strategic service vision‖, which helps the
marketing and operations staff to work together, and an ―inner-directed vision‖
(George, 1990:64). This ―inner-directed vision‖ should include the following
elements:
targeting important employee segments;
development of a service concept designed with the needs of the
employees in mind;
codification of an operating strategy to support the service concept; and
design of a service delivery system to support the operating strategy.
If the service concept is developed correctly, it should lead to low staff turnover,
low training costs and the chance to develop shared goals and values which will
allow management to create a healthy organisation (George, 1990:64).
Christopher (1991:7; 9) explains two aspects of internal marketing. The first
aspect involves the idea of the internal customer (every person working in an
organisation is both a supplier and customer) and what can be done to improve
customer service and quality at the individual level in an organisation. The
second aspect is concerned with how staff work together across functional
boundaries so that work is aligned to the organisation‘s mission, value, strategy
and goals. ―The internal market…is the subject of all change processes as well
as the author of them. The task is to work more cross-functionally, more
participatively, more politically in the common interest of customers, staff and
shareholders, building a platform from which to grow‖ (Christopher, 1991:21).
Gronroos (cited in Chaston, 1994b:45-6) states that the importance of sustaining
customer loyalty by emphasising the capability of employees to deliver consistent
service quality requires the adoption of an internal marketing strategy to develop
quality conscious employees. Internal marketing should be seen as a process of
integrating the multiple functions of an organisation by ensuring that employees
62
understand all aspects of the business operations and that they are motivated to
act in a service-orientated manner (Rafiq & Ahmed, 1993:220; Chaston,
1994b:45-6). The conclusion reached is that attention to the integration of
processes which provide service processes across an entire organisation must
precede the organisation attempting to build stronger relationships with external
customers (Chaston, 1994b:46; Kang et al., 2002:281).
Hayes and Hill (cited in Cook & Verma, 2002:46) investigated the effects of
employee motivation, vision and organisational learning on the perceived service
quality in a service organisation. They found that employee motivation, vision,
and organisational learning all positively affected the perceived service quality.
Internal marketing has been seen as a strategic weapon in achieving high quality
service delivery which results in greater customer satisfaction (George, 1990:50).
It is worthwhile for organisations to identify, measure and manage their internal
resources so that internal service quality and service may be encouraged and
supported. Internal customer service and service quality need to be addressed
and managed to ensure a strong organisation which understands that their
employee‘s service to each other leads to a higher level and quality of service to
external customers (Michael, 2003:2427). Many organisations are ―filled with
unresolved conflict, turf wars, rumours, folklore and frustration over the fact that
many sections are insensitive to the needs of their internal customers…and not
only do internal systems fail to anticipate customer needs, they frequently allow
internal suppliers to ignore, antagonize, and even tyrannize internal customers‖
(Longenecker & Meade, 1995:77). Chason (1994a:380) goes further by saying
that there is often a lack of trust between sections leading to low levels of
confidence about the abilities of an organisation to manage its internal service
system.
Irrespective of what performance criteria an employee is rated against, achieving
any performance standard cannot occur unless the organisation has established

63
appropriate working conditions. Barriers to effective performance, including
inadequate information or lack of training in the delivery of internal services, may
still occur (Chaston, 1994b:50). Delivering the highest possible quality of service
can only be achieved in organisations where organisational behaviour elements
are reinforced by the importance which management assigns to meeting the
needs of the external customer (Chaston, 1994b:53). Positive service indicators
of a service quality culture are: a commitment of resources, programs to
continuously improve quality, rewarding staff who place service above efficiency,
the setting of performance goals and formal systems for setting of these
performance goals. The same attributes are necessary to achieve internal
customer service goals (Chaston, 1994b:53). He states that for all employees to
be willing and able to deliver service quality, management must ensure that they
are capable of fulfilling their job role through activities such as creating effective
teams, establishing supervisory controls and minimising the occurrence of
conflict.
Service features relating to both performance and empathy are based on tangible
and intangible factors such as performance, quality, reliability and cost as well as
on courtesy, willingness to help and the ability to solve problems (Cook, 2002:7).
These factors relate strongly to the service quality dimensions of the SERVQUAL
model and its ten service quality dimensions. These factors and dimensions are
not only important to external customers, but are just as important to the internal
customers that each staff member interacts with. Having reliable reports both for
and from the internal customer/supplier, along with their ability to solve problems
and their willingness to improve internal functioning in an organisation will
improve external customer service.
While operating an organisation as groups of internal customers may shift the
focus and the organisation‘s goals in an undesirable direction, the purpose of
developing the concept of internal customer service is to utilise the concepts of
process management, continuous improvement and forcing individual sub-units
64
to demonstrate the value that they add to the process. These concepts are
necessary for organisations that wish to improve quality and to remain
competitive in the global economy. The internal customer concept should assist
these organisations to operationalise and implement quality concepts and
improvements (Farner et al., 2001:357).
2.9 CONCLUSION
Customer service and quality were discussed in this chapter along with the role
of the HR department. Some of the models of customer service and quality along
with various dimensions used to rate and determine customer service and quality
were explained. The role of TQM within an organisation wanting to improve
service quality was also discussed.
Chapter three will cover the research methodology used in this study. The
questionnaire, its method of administration, the pilot study and problems
encountered will be discussed.

65
3 CHAPTER THREE
DESCRIPTION OF THE RESEARCH METHODOLOGY, STRUCTURE OF THE
QUESTIONNAIRE AND THE METHOD BY WHICH IT WAS ADMINISTERED
3.1 INTRODUCTION
In chapter three the research methodology and design will be discussed. The
research approach that was followed in order to meet the primary objective of the
study and to answer the five research questions will be explained. In order to
achieve this, a questionnaire was compiled and administered to the sample
group of employees of Aspen Pharmacare. The questionnaire, which covers the
service quality dimensions of customer service and quality as identified from the
literature, allows the dimensions to be assessed from the point of view of each
section and will determine the importance of the service quality dimensions to the
three sections of Aspen Pharmacare. This chapter will also cover the sampling
method and the criteria used to determine the participants of the study, as well as
the measuring instrument.
3.2 RESEARCH DESIGN
Research methodology is also known as the research paradigm. A paradigm is a
mindset, a philosophy or a way of thinking. A paradigm can be used at three
levels: to reflect basic beliefs about the world, to provide guidelines about how
the researcher should conduct his or her endeavours, and to specify the methods
and techniques which should ideally be adopted when conducting the research
(Collis & Hussey, 2003:47). As a result, it is important to recognise and
understand the paradigm used in the research, as it determines the way in which
the research is designed, how the data is collected and analysed, and the way
66
the thesis is written. Two types of paradigms have been identified, namely the
positivistic and phenomenological paradigms (Collis & Hussey, 2003:47).
In a phenomenological paradigm, also known as a qualitative paradigm, a
smaller sample is examined with the understanding of human behaviour from the
participant‘s own frame of reference being the main concern. A case study may
consist of as little as one participant. Interviews and open-ended questions are
often used to gather the information needed in the study. Reliability is normally
low and validity high in this paradigm. This paradigm is concerned with
generating theories and generally produces qualitative data. The
phenomenological paradigm generalises from one setting to another. The nature
and importance of the variables are assessed by the qualitative paradigm (Collis
& Hussey, 2003:53-55).
In a positivistic paradigm, also known as a quantitative paradigm, a larger sample
size is utilised in comparison with the phenomenological paradigm. The data
generated tends to be quantitative, and involves working with numbers, and is
highly specific and precise. This paradigm is used when testing relationships
between variables and uses hypothesis testing to assist is determining these
relationships. Reliability is high and validity low in this paradigm. This paradigm
generalises from the sample to the population (Collis & Hussey, 2003:52-53; 55).
The research project will follow a qualitative paradigm approach because the
study requires an analysis of the nature of the factors which impact on customer
service within the supply chain of a pharmaceutical company. The relationships
among variables will not be statistically tested, which would have required a
quantitative approach.
In order to resolve the research objective, five research questions were
developed:

67
Research question 1: What does the Production section of Aspen Pharmacare
consider to be the important service quality dimensions of the internal customer
service that they receive and offer?
Research question 2: What does the Demand Planning section of Aspen
Pharmacare consider to be the important service quality dimensions of the
internal customer service that they receive and offer?
Research question 3: What does the Distribution section of Aspen Pharmacare
consider to be the important service quality dimensions of the internal customer
service that they receive and offer?
Research question 4: In which service quality dimensions are there the biggest
variances in each section?
Research question 5: What are the key service quality dimensions that will be
most valuable in improving Aspen Pharmacare‘s customer service?
The procedure used to meet the research objective and to answer the research
questions was as follows:
A comprehensive literature study was undertaken to meet the research
objective.
The empirical study is presented in chapters four and five and the results
analysed in order to answer the five research questions. A questionnaire
was constructed and administered to the staff of the three sections of the
supply chain of Aspen Pharmacare being analysed in this study.

68
3.3 DESIGN AND STRUCTURE OF THE QUESTIONNAIRE
The questionnaire was developed based on the dimensions of service quality
identified in the literature review (see Appendix A). The statements used in the
questionnaire were selected to address each of the ten dimensions of service
quality on two factors, namely performance and importance. The questionnaire
will assist in determining the levels of performance and importance within the
three sections of Aspen Pharmacare. The questionnaire will also help to
determine which dimensions are the most important to each section, as well as to
determine in which dimensions the largest variation in performance is evident.
The questionnaire consisted of a number of statements related to each of the
dimensions of service quality. The service quality dimensions addressed were:
Tangibles: referring to physical facilities, equipment, personnel and
communication material.
Reliability: referring to the ability of the staff of the other two sections to
perform the promised service dependably and accurately.
Responsiveness: referring to the willingness of the other section‘s staff to
help and provide prompt service.
Competence: referring to the possession of the other section‘s staff of the
required knowledge and skills to perform the required service.
Courtesy: referring to politeness, respect, consideration and friendliness;
Credibility: referring to the trustworthiness, believability and honesty of the
staff providing the service.
Security: referring to record-keeping.
Access: referring to the approachability and ease of contact with the other
sections.
Communication: referring to use of language that is clearly and easily
understandable.
Understanding the customer: referring to making an effort to know your
customer (the other section‘s staff) and their needs.

69
The definitions of each dimension are those used by Zeithaml et al. (1990:21-2).
A five point Likert scale was used to anchor both factors of the statements in
section two of the questionnaire. This is in line with Slack‘s (1994:73)
recommendation of using a five-point scale to rate internal services in an
organisation.
Scoring for the performance factor of the questionnaire was as follows:
1 = very poor;
2 = poor;
3 = neutral;
4 = good; and
5 = excellent.
The scoring for the importance factor of the questionnaire was as follows:
1 = very unimportant;
2 = unimportant;
3 = neutral;
4 = important; and
5 = very important.
The questionnaire was divided into two sections, namely:
section one: this section covers the demographic data of the respondents;
and
section two: this section covers the individual view of internal customer
service relating to each of the ten service quality dimensions.

70
3.3.1 The sample
Non-probability sampling which is arbitrary and subjective was used.
Judgemental sampling was used as this allowed sample members to be selected
who conformed to the predetermined criteria. The decision of the sample group
was made, and no other contacts were pursued during the course of the study.
The predetermined criteria for the judgemental sampling were that the:
Participant be a permanent staff member;
Participant be in lower to middle management or have a job with a high
level of responsibility; and
Participant must have regular direct dealings with internal customers of
the other section/s of the supply chain.
3.3.2 Sample size
A judgemental sample group (N = 75) was used for this study and it was
anticipated that at least twenty-five participants from each section of the supply
chain. This minimal sample size (N= 75), together with the predetermined criteria,
would allow for the sample group to be representative of the population.
3.3.3 Pilot Study
It is essential to pilot the questionnaire as fully as possible before distributing it to
the respondents to allow for errors to be noted before the final draft is sent out
(Collis & Hussey, 2003:175). This allows for corrections to be made which
otherwise may have resulted in actual respondents finding difficulty in completing
or in understanding the questions posed to them in the questionnaire (Schnetler
as cited by Leedy, 1997:143). A pilot group of four employees within the
distribution section were selected owing to their close proximity to the researcher.

71
This allowed for easy direct contact with the selected employees for the
delivering and collection of the pilot study questionnaires, as well as receiving
face-to-face feedback and suggestions.
The pilot questionnaire was printed and given by hand to the selected employees
with the request to make any corrections and suggestions on the print-out. The
employees then returned the questionnaire with their comments added. The
selected employees made suggestions to improve and clarify certain statements,
as well as correcting any spelling and grammar mistakes. The questionnaire was
amended to address the suggestions and comments of the selected employees.
This resulted in improved readability of the questionnaire.
The updated questionnaire was printed and again given by hand to the four
selected employees with the request to assist in making the statements specific
to Aspen Pharmacare and these suggestions were also incorporated into the
questionnaire.
The final version of the questionnaire was then printed and taken to two other
employees to complete as though they were respondents and they were asked to
comment accordingly. Both employees responded that they found the
questionnaire to be easy to understand with clear instructions on how to
complete the questionnaire. The employees commented positively about the fact
that anonymity of respondents would be maintained as no names were required
on the questionnaire, and felt that this would encourage others to be honest in
their rating of the statements. This final version of the questionnaire was sent to
the senior managers of the various sections.
3.3.4 Administration of the questionnaire
Due to the wide geographical distribution of the sample group, the structured
questionnaire was distributed by e-mail survey to the senior managers of the

72
sections of Aspen Pharmacare that were relevant to the study. Staff from the
Johannesburg, Port Elizabeth and East London sites participated. Anonymity
and confidentiality were strictly guaranteed. Follow-ups were conducted to the
senior managers to ensure a good response rate.
The confidentiality of the respondents was guaranteed by not requiring them to
fill in their names or job titles as part of the questionnaire. A covering letter (see
Appendix B) was also sent to the senior managers along with the questionnaire
in which confidentiality was guaranteed. The covering letter also explained the
purpose of the questionnaire. The questionnaires were administered and
returned over a two-and-a-half week period.
3.4 DATA ANALYSIS METHOD
The researcher analysed the data using Microsoft Excel. The data was captured
and analysed per statement and per service dimension. This is explained in more
detail in chapter four and five.
3.5 PROBLEMS EXPERIENCED
No problems were experienced in the administration of the questionnaires.
Problems were, however, experienced in the collection of the questionnaires.
Managers were requested to return the questionnaires within a specific time
frame, but in some cases, no responses were received. A follow-up email was
sent to the managers who had not responded. Most managers sent their
completed questionnaires through within a few days of receiving the reminder
email. Another problem encountered was caused by a manager going out of town
on business, and forgetting to send the questionnaires through before he left.
The manager sent the questionnaires through to the researcher upon his return
to the office a week later.

73
Despite numerous emails to the senior managers of the Demand Planning
section, the response was poor. Only eighteen completed questionnaires were
received from the possible respondents in this section. For the purposes of this
study, the Outsource Departments were included in the Demand Planning section
as although they are involved with production, they place the demand on a third
party supplier and are not directly involved with production at the Aspen
Pharmacare manufacturing facilities. The Demand Planning sample will be the
least representative of its population. Only eighteen responses were received
from the staff of this section and the ideal of twenty-five responses per section
was not achieved for the Demand Planning section.
The privacy of the respondents was maintained, and the few questionnaires that
were returned incomplete, were discarded. In the majority of these cases, the
respondent failed to complete half of the questionnaire, in that the rating of the
statements linked to importance were not filled in.
3.6 SUMMARY
The results of the performance responses received from the empirical survey will
be analysed and interpreted in chapter four. This will be done in order to
calculate the gaps in each dimensions‘ performance and will allow a model of
internal customer service to be developed. This model will serve as the basis for
the improvement of internal customer service between the three sections of
Aspen Pharmacare.
The importance ratings will be used in chapter five to answer some of the
research questions. There will not be a need to analyse the importance results of
each dimension or section if the majority of the respondents‘ responses rate the
statements as being important or very important to them in their current position.

74
4 CHAPTER FOUR
RESULTS AND DISCUSSION OF THE EMPIRICAL STUDY
4.1 INTRODUCTION
Chapter four covers the analysis of the responses received through the
administration of the Internal Customer Service questionnaire. The analyses of
the responses are required to answer the five research questions posed in the
study. The results will be presented in the form of tables and graphs in order to
provide a visual and unambiguous understanding of the analysis of the
responses.
4.2 QUESTIONNAIRE RESULTS ANALYSIS
The classification question analysis will follow and thereafter the results and
analysis will be completed for each dimension for the production, demand
planning and distribution sections from section two of the questionnaire.
The importance ratings are not addressed in chapter four as the majority of the
respondents rated all of the statements as being important or very important. This
was expected as all ten dimensions are important in service quality and customer
service (Zeithaml et al., 1990). The importance ratings will be addressed in
chapter five when the research questions are answered.
4.2.1 Classification Question Data Analysis
Number of questionnaires returned: 97
Number of questionnaires used: 94
Number of incomplete questionnaires: 3

75
The respondents‘ gender classification data is presented in table 4.1.
Table 4.1: Respondents’ personal statistics: Gender
GENDER PRODUCTION DEMAND
PLANNING
DISTRIBUTION COMBINED TOTAL
BY GENDER
TOTAL NUMBER OF
RESPONDENTS
39 18 37 94
MALE 13 5 26 44
PERCENTAGE (%) 33 28 70 47
FEMALE 26 13 72 50
PERCENTAGE (%) 67 72 30 53
Table 4.1 shows that the overall percentage of female respondents (53 per cent)
was six percent higher than the percentage of male respondents (47 per cent).
Examination of each section reveals that the highest percentage of male
respondents in a section was in Distribution (70 per cent) and of females was in
Demand Planning (72 per cent). As per the senior managers of the three
sections, this is a representative sample of the population.
Table 4.2: Respondents’ personal statistics: Age Group
AGE (YEARS) PRODUCTION DEMAND
PLANNING
DISTRIBUTION COMBINED TOTAL
BY AGE GROUP
TOTAL/SECTION 39 18 37 94
UNDER 21 0 0 1 1
PERCENTAGE (%) 0 0 2 1
21 -30 19 4 11 34
PERCENTAGE (%) 49 22 30 36
31 – 40 12 10 10 32
PERCENTAGE (%) 31 56 27 34
41 - 50 6 2 5 13
PERCENTAGE (%) 15 11 14 14
51 – 60 2 2 8 12
PERCENTAGE (%) 5 11 22 13
61 AND OVER 0 0 2 2
PERCENTAGE (%) 0 0 5 2

76
The respondents‘ classification data with regard to age is presented in table 4.2.
The majority of the respondents are aged between twenty-one and forty years
old, with thirty-six per cent of respondents being in the age group of twenty-one
to thirty and a further thirty-four per cent in the age group of thirty-one to forty
years old. Only one respondent was under twenty-one and two were over sixty,
with all three of these respondents working in the Distribution section. Of the
three sections, the Distribution section has the widest range of ages. Twenty-
seven per cent of respondents were between the ages of forty-one and sixty. The
range of ages is representative of the population, as per the senior managers of
the sections.
The respondents‘ language classification data is presented in table 4.3.
Table 4.3: Respondents’ personal statistics: Language
LANGUAGE PRODUCTION DEMAND
PLANNING
DISTRIBUTION COMBINED TOTAL
BY LANGUAGE
TOTAL/SECTION 39 18 37 94
ENGLISH 18 12 15 45
PERCENTAGE (%) 46 67 41 48
AFRIKAANS 12 4 13 29
PERCENTAGE (%) 31 22 35 31
XHOSA 8 0 7 15
PERCENTAGE (%) 21 0 19 16
ZULU 0 1 2 3
PERCENTAGE (%) 0 5.5 5 3
OTHER 1 1 0 2
PERCENTAGE (%) 2 5.5 0 2
A total of forty-five respondents (48 per cent) spoke English as their home
language, with a further twenty-nine (31 per cent) responding that Afrikaans was
their home language. Fifteen respondents (16 per cent) were Xhosa-speaking.
Xhosa was expected to be the highest percentage of the African languages
reported by the respondents, as the Eastern Cape‘s black population is

77
predominantly Xhosa-speaking and many respondents were from Port Elizabeth
and East London. The Zulu and other home language respondents were most
likely respondents from the Johannesburg office, as many Durban workers were
transferred to Johannesburg and Zulu is predominantly spoken in the Kwazulu-
Natal area.
English was the most spoken home language and Afrikaans the second most
spoken language across all three sections. Demand Planning had the highest
percentage of English speaking respondents (67 per cent). Distribution had the
highest percentage of Afrikaans speaking respondents (35 per cent), with
Production having the highest percentage of Xhosa speaking respondents (21
per cent).
The respondents‘ classification data with regard to years of working for Aspen
Pharmacare is presented in table 4.4.
Table 4.4: Respondents’ personal statistics: Years of working for Aspen Pharmacare
NO OF YEARS
SERVICE TO
ASPEN
PRODUCTION DEMAND
PLANNING
DISTRIBUTION COMBINED TOTAL
BY YEARS
TOTAL/SECTION 39 18 37 94
0 -5 22 9 21 52
PERCENTAGE (%) 56 50 57 55
6 – 10 8 7 6 21
PERCENTAGE (%) 21 39 16 22
11 – 15 5 1 2 8
PERCENTAGE (%) 13 5.5 5.5 9
16 – 20 1 0 4 5
PERCENTAGE (%) 2.5 0 10.5 6
21 – 25 2 0 0 2
PERCENTAGE (%) 5 0 0 2
26 – 30 0 1 2 3
PERCENTAGE (%) 0 5.5 5.5 3
30 AND OVER 1 0 2 3
PERCENTAGE (%) 2.5 0 5.5 3

78
The majority of the respondents had been working for Aspen Pharmacare for less
than ten years, with fifty-two respondents (55 per cent) having worked at Aspen
Pharmacare for five years or less, and a further twenty-two per cent working for
between six and ten years.
Eight respondents had been working for Aspen Pharmacare for over twenty-one
years, with four of these being in the Distribution section, and one each from the
Production and Demand Planning sections. The small number of long service
respondents corresponds with the low percentage of respondents who were aged
fifty-one and over as seen in table 4.2. Demand Planning respondents showed
the lowest long service numbers, with only one respondent having worked at
Aspen Pharmacare for more than fifteen years.
The range of service periods show that the sample is representative of the
population with all lengths of service addressed in the questionnaire being
represented. This was confirmed by the senior managers in each section.
The respondents‘ classification data with regard to which section of Aspen
Pharmacare they work in is presented in table 4.5.
Table 4.5: Respondents’ personal statistics: Section worked in
SECTION NUMBER OF
RESPONDENTS
PERCENTAGE
(%)
PRODUCTION 39 42
DEMAND
PLANNING
18 19
DISTRIBUTION 37 39
TOTAL 94 100

79
4.2.2 Tangibles Dimension
Analysis of the performance ratings of the tangibles dimension by the three
sections of Aspen Pharmacare are examined in this section. Tables 4.6 to 4.8
show the rating of the tangibles dimension statements as compiled from the
empirical data from the Production, Demand Planning and Distribution sections
respectively.
Table 4.6: Tangibles Dimension: Production Performance ratings
STATEMENT EXCELLENT GOOD NEUTRAL POOR VERY POOR
I work in a pleasant
environment.
10.3% 48.7% 41.0% 0% 0%
Written materials I use are
easy to understand.
10.3% 66.7% 23.0% 0% 0%
The technology I use is up
to date.
15.5% 48.7% 23.0% 12.8% 0%
The tools used to perform
my job are adequate.
7.7% 51.3% 35.9% 5.1% 0%
AVERAGE 10.95% 53.85% 30.73% 4.48% 0%
Table 4.7: Tangibles Dimension: Demand Planning Performance ratings
STATEMENT EXCELLENT GOOD NEUTRAL POOR VERY POOR
I work in a pleasant
environment.
11.1% 72.2% 5.6% 11.1% 0%
Written materials I use are
easy to understand.
16.7% 55.6% 27.7% 0% 0%
The technology I use is up
to date.
16.7% 61.0% 16.7% 5.6% 0%
The tools used to perform
my job are adequate.
16.7% 61.0% 16.7% 5.6% 0%
AVERAGE 15.3% 62.45% 16.68% 5.58% 0%
No respondents rated the performance of the tangibles statements by the other
sections as very poor. The Production section gave the highest percentages of
neutral ratings for their dealings with the Demand Planning and Distribution
sections. The Demand Planning section gave the highest percentage of poor

80
ratings of their dealings with the other two sections. The Distribution section gave
the lowest ratings for the performance of the tangibles statements. This indicates
that all three sections need to improve their tangible elements to allow their staff
to be more satisfied with their physical surroundings. Overall job satisfaction
could be increased, which should result in more satisfied employees and better
customer service (Kang et al., 2002:279). Upgraded facilities is a way to make
employees more responsive to their customers (Rust & Zahorik, 1993:211). The
environment, including equipment and physical appearance, can contribute to
customer service (Swartzlander, 2004:18). Improving the tangible environment
may lead to an improvement in performance.
Table 4.8: Tangibles Dimension: Distribution Performance ratings
STATEMENT EXCELLENT GOOD NEUTRAL POOR VERY POOR
I work in a pleasant
environment.
10.8% 70.3% 16.2% 2.7% 0%
Written materials I use are
easy to understand.
21.6% 70.3% 8.1% 0% 0%
The technology I use is up
to date.
29.7% 45.9% 24.3% 0% 0%
The tools used to perform
my job are adequate.
18.9% 67.6% 13.5% 0% 0%
AVERAGE 20.25% 63.53% 15.53% 0.68% 0%
Figure 4.1 shows the average ratings of the tangibles statements by each
section. Overall, nearly 60 per cent of the respondents from all the sections rated
the performance of the tangibles dimension by the other staff as good with a
further 21 per cent rating the performance as neutral.
The largest variance in the tangibles dimension was shown for the ratings given
by the Distribution section. Their ratings varied from less than one per cent (poor)
to nearly 64 per cent (good) whereas the ratings by the other sections were more
evenly spread with percentages between 4 and 62 per cent.

81
0
20
40
60
80
Excellent Good Neutral Poor Very Poor
Perc
en
tag
e
Rating
Production
Demand Planning
Distribution
Figure 4.1: Average percentages of the tangibles dimension ratings
4.2.3 Reliability Dimension
Four statements were linked to the reliability service quality dimension of the
study. The performance ratings of these statements by the Production, Demand
Planning and Distribution sections are presented in tables 4.9, 4.10 and 4.11
respectively.
A small percentage of the Production section respondents rated the reliability of
the other sections as very poor. They also gave the highest percentage of
neutral responses, namely 48 per cent. The Demand Planning section gave the
highest percentage of good responses. There were only a small percentage of
excellent responses across all three sections. There is a need for an overall
improvement in the reliability of responses of all staff, in terms of both report
accuracy and timeliness.
The performance ratings of each statement show that 22.2 per cent of the
Demand Planning section rated the timely receipt of responses from the other
two sections as being poor. This statement showed the highest percentages of
neutral and poor responses of all four statements. Although the Demand
Planning section had the highest percentage of poor ratings for statement one,

82
they showed the highest percentage of good ratings for all statements when
compared to the other sections‘ responses.
Table 4.9: Reliability Dimension: Production Performance ratings
STATEMENT EXCELLENT GOOD NEUTRAL POOR VERY POOR
Responses received are
timely.
2.6% 38.4% 48.7% 7.7% 2.6%
Staff do what I request of
them.
2.6% 48.7% 43.6% 5.1% 0%
Reports given are error
free.
5.1% 43.6% 43.6% 7.7% 0%
Responses are correct the
first time.
2.6% 33.3% 56.4% 7.7% 0%
AVERAGE 3.23% 41.0% 48.01% 7.05% 0.65%
Table 4.10: Reliability Dimension: Demand Planning Performance ratings
STATEMENT EXCELLENT GOOD NEUTRAL POOR VERY POOR
Responses received are
timely.
5.6% 50.0% 22.2% 22.2% 0%
Staff do what I request of
them.
11.1% 55.6% 33.3% 0% 0%
Reports given are error
free.
0% 72.2% 27.8% 0% 0%
Responses are correct the
first time.
11.1% 66.7% 22.2% 0% 0%
AVERAGE 6.95% 61.13% 26.38% 5.55% 0%
Table 4.11: Reliability Dimension: Distribution Performance ratings
STATEMENT EXCELLENT GOOD NEUTRAL POOR VERY POOR
Responses received are
timely.
8.1% 45.9% 35.2% 10.8% 0%
Staff do what I request of
them.
13.5% 48.6% 35.2% 2.7% 0%
Reports given are error
free.
2.7% 51.4% 43.2% 2.7% 0%
Responses are correct the
first time.
5.5% 48.6% 45.9% 0% 0%
AVERAGE 7.45% 48.63% 39.88% 4.05% 0%

83
Figure 4.2 depicts the average percentages of the reliability dimension ratings.
0
20
40
60
80
Excellent Good Neutral Poor Very Poor
Pe
rce
nta
ge
Rating
Production
Demand Planning
Distribution
Figure 4.2: Average percentages of the reliability dimension ratings
The majority of the respondents rated the performance of the reliability
dimensions as good. The Demand Planning section had the highest percentage
(61 per cent) of good ratings. When examining the overall average of all three
sections, 50 per cent of statements were rated as good with a further 38 per cent
rated as neutral.
The Demand Planning section showed the largest variance of ratings for the
reliability dimension as they gave more good responses and less neutral
responses than the other sections. The average percentages of the other two
sections were much closer to each other.
4.2.4 Responsiveness Dimension
The responsiveness dimension performance ratings are presented in tables 4.12
to 4.14. A total of three statements were linked to this dimension. Both the
Production and Demand Planning sections gave poor ratings totalling more than
ten per cent for the performance of the responsiveness dimension. The
Distribution rating of poor was only slightly lower with an average of nearly nine

84
per cent. The Demand Planning section awarded the highest average percentage
of good ratings (63 per cent), while Distribution gave the highest average of
excellent ratings (9 per cent).
Two sections, Production and Distribution, awarded ratings of poor to the
performance statement related to a quick response time. This highlights the fact
that a poor response time to problems does occur in the interactions between the
three sections. This needs to be improved. Unresponsive internal sections make
it difficult for the organisation to meet competitive challenges (Magidson &
Polcha, 1992:37). Training programs will help the employees to become more
responsive to their customers (Rust & Zahorik, 1993:211).
Table 4.12: Responsiveness Dimension: Production Performance ratings
STATEMENT EXCELLENT GOOD NEUTRAL POOR VERY POOR
Other section‘s staff are
willing to assist with my
problems.
5.1% 51.3% 35.9% 7.7% 0%
Other section‘s staff adhere
to my timeframes.
2.6% 33.3% 48.7% 15.4% 0%
Response time in dealing
with a problem is quick.
5.1% 28.2% 56.4% 7.7% 2.6%
AVERAGE 4.27% 37.6% 47% 10.27% 0.87%
Table 4.13: Responsiveness Dimension: Demand Planning Performance ratings
STATEMENT EXCELLENT GOOD NEUTRAL POOR VERY POOR
Other section‘s staff are
willing to assist with my
problems.
22.2% 55.55% 16.65% 5.6% 0%
Other section‘s staff adhere
to my timeframes.
0% 66.7% 22.2% 11.1% 0%
Response time in dealing
with a problem is quick.
0% 66.7% 16.65% 16.65% 0%
AVERAGE 7.40% 62.98% 18.50% 11.12% 0%

85
Table 4.14: Responsiveness Dimension: Distribution Performance ratings
STATEMENT EXCELLENT GOOD NEUTRAL POOR VERY POOR
Other section‘s staff are
willing to assist with my
problems.
10.8% 48.6% 35.2% 5.4% 0%
Other section‘s staff adhere
to my timeframes.
2.7% 29.7% 59.5% 5.4% 2.7%
Response time in dealing
with a problem is quick.
13.6% 29.7% 48.6% 5.4% 2.7%
AVERAGE 9.03% 36.00% 47.77% 5.4% 1.8%
The average percentages of the ratings of the responsiveness dimensions are
presented in figure 4.3. An overall average percentage of 45 of respondents
across the three sections rated responsiveness as good and a further 38 per cent
as neutral. Improving cooperation between the three internal sections will lead to
improved responsiveness between the sections as well as to external customer
(Laurence & Wiswell, 1998:45).
0
20
40
60
Excellent Good Neutral Poor Very Poor
Perc
en
tag
e
Rating
Production
Demand Planning
Distribution
Figure 4.3: Average percentages of the responsiveness dimension ratings
The Demand Planning section‘s ratings showed the largest variance for the
responsiveness dimension. They gave far fewer neutral responses (18.5 per
cent) than the other sections (47 and 47.7 per cent respectively) and a higher

86
percentage of good ratings (nearly 63 per cent) when compared to 38 and 45.5
per cent for Production and Distribution respectively.
4.2.5 Competence Dimension
The empirical data of the competence dimension ratings by the respondents of
the Production, Demand Planning and Distribution sections is presented in tables
4.15, 4.16 and 4.17 respectively. There were no ratings of ―very poor‖ by any
respondents. A small percentage of each section rated the performance of the
other sections as being ―poor‖. This implies that the data provided by each
section is not always up to date or appropriate. Staff may not know how to use
software, such as Baan (internal system software) skilfully. Training programs in
software should improve employees‘ skill levels (Rust & Zahorik, 1993:211) and
allow the employees to extract the appropriate data for their internal and external
customers.
Table 4.15: Competence Dimension: Production Performance ratings
STATEMENT EXCELLENT GOOD NEUTRAL POOR VERY POOR
Data provided to me is
appropriate.
12.8% 71.8% 12.8% 2.6% 0%
Data provided to me is up
to date.
15.4% 61.5% 20.5% 2.6% 0%
Other section‘s staff are
able to use computer
software, such as Baan,
skilfully.
15.4% 56.4% 23.1% 5.1% 0%
AVERAGE 14.53% 63.23% 18.80% 3.43% 0%

87
Table 4.16: Competence Dimension: Demand Planning Performance ratings
STATEMENT EXCELLENT GOOD NEUTRAL POOR VERY POOR
Data provided to me is
appropriate.
16.7% 61.0% 16.7% 5.6% 0%
Data provided to me is up
to date.
16.7% 55.5% 22.2% 5.6% 0%
Other section‘s staff are
able to use computer
software, such as Baan,
skilfully.
27.8% 50.0% 22.2% 0% 0%
AVERAGE 20.40% 55.50% 20.37% 3.73% 0%
Table 4.17: Competence Dimension: Distribution Performance ratings
STATEMENT EXCELLENT GOOD NEUTRAL POOR VERY POOR
Data provided to me is
appropriate.
10.8% 59.5% 27.0% 2.7% 0%
Data provided to me is up
to date.
27.0% 48.6% 21.7% 2.7% 0%
Other section‘s staff are
able to use computer
software, such as Baan,
skilfully.
24.3% 29.8% 40.5% 5.4% 0%
AVERAGE 45.90% 45.97% 29.73% 3.6% 0%
The average percentages of the ratings of the competence dimension are
depicted in figure 4.4. The largest percentage of responses were rated as good
with neutral and excellent ratings forming the majority of the balance of the
responses.
For the competence dimension, the Production section showed the biggest
variance in ratings. They awarded more good ratings (63 per cent), less neutral
(18.8 per cent) and excellent ratings (14.5 per cent) than the other sections.

88
0
20
40
60
80
Excellent Good Neutral Poor Very Poor
Perc
en
tag
e
Rating
Production
Demand Planning
Distribution
Figure 4.4: Average percentages of the competence dimension ratings
4.2.6 Courtesy Dimension
This dimension consisted of three statements. Tables 4.18 to 4.20 show the
rating of the courtesy related statements. Only a small percentage of the
Production respondents gave a very poor rating to the performance by the
Demand Planning and Distribution sections for the courtesy dimension. This
dimension had the third highest overall percentage rating (24 per cent) of
excellent of all ten of the service quality dimensions.
Table 4.18: Courtesy Dimension: Production Performance ratings
STATEMENT EXCELLENT GOOD NEUTRAL POOR VERY POOR
Other section‘s staff…
..have a pleasant manner
when dealing with me in
person.
20.5% 53.8% 20.5% 2.6% 2.6%
..are not rude when I ask
them questions.
17.9% 51.3% 25.6% 2.6% 2.6%
..are consistently polite
when talking to me on the
phone.
15.4% 56.4% 23.1% 5.1% 0%
AVERAGE 17.93% 53.83% 23.07% 3.43% 1.73%

89
Table 4.19: Courtesy Dimension: Demand Planning Performance ratings
STATEMENT EXCELLENT GOOD NEUTRAL POOR VERY POOR
Other section‘s staff…
..have a pleasant manner
when dealing with me in
person.
27.7% 55.6% 16.7% 0% 0%
..are not rude when I ask
them questions.
22.2% 61.1% 11.1% 5.6% 0%
..are consistently polite
when talking to me on the
phone.
22.2% 50.0% 16.7% 11.1% 0%
AVERAGE 24.03% 55.57% 14.83% 5.57% 0%
Table 4.20: Courtesy Dimension: Distribution Performance ratings
STATEMENT EXCELLENT GOOD NEUTRAL POOR VERY POOR
Other section‘s staff…
..have a pleasant manner
when dealing with me in
person.
29.7% 62.2% 5.4% 2.7% 0%
..are not rude when I ask
them questions.
35.1% 51.4% 13.5% 0% 0%
..are consistently polite
when talking to me on the
phone.
24.3% 51.4% 24.3% 0% 0%
AVERAGE 29.7% 55.0% 14.4% 0.9% 0%
The average percentages of the performance ratings of the courtesy dimension
are shown in figure 4.5. More than 50 per cent of respondents rated the
performance as good. Bowen et al. (1989:83) comment that courtesy, as one of
the intangible service quality dimensions, is important when there are high levels
of customer contact. Internal customers often deal with each other on a daily
basis, and courtesy is always an added source of value.

90
0
20
40
60
Excellent Good Neutral Poor Very Poor
Perc
en
tag
e
Rating
Production
Demand Planning
Distribution
Figure 4.5: Average percentages of the courtesy dimension ratings
The Distribution section showed the largest variances in the percentages of the
ratings. They have the largest differences in their average percentages for each
of the ratings when compared to the other sections.
4.2.7 Credibility Dimension
The ratings of the three statements linked to the credibility dimension are shown
in tables 4.21 to 4.23.
Table 4.21: Credibility Dimension: Production Performance ratings
STATEMENT EXCELLENT GOOD NEUTRAL POOR VERY POOR
The staff in the other
sections I work with have a
good professional
reputation.
10.3% 64.0% 23.1% 2.6% 0%
The responses given by
each section are as
trustworthy as the others.
10.3% 46.1% 41.0% 2.6% 0%
The other section‘s staff
give honest answers to my
questions.
10.3% 41.0% 48.7% 0% 0%
AVERAGE 10.3% 50.37% 37.6% 1.73% 0%

91
No respondents rated the performance by the other sections as ―very poor‖. The
only ―poor‖ ratings were given by the Production section. Over 50 per cent of the
respondents from each section rate the performance of the other section‘s staff
as ―good‖. There is a big difference between the percentages of the neutral
responses between Demand Planning and the other two sections (15 per cent
compared to over 35 per cent).
Table 4.22: Credibility Dimension: Demand Planning Performance ratings
STATEMENT EXCELLENT GOOD NEUTRAL POOR VERY POOR
The staff in the other
sections I work with have a
good professional
reputation.
27.7% 55.6% 16.7% 0% 0%
The responses given by
each section are as
trustworthy as the others.
22.3% 66.6% 11.1% 0% 0%
The other section‘s staff
give honest answers to my
questions.
16.7% 66.6% 16.7% 0% 0%
AVERAGE 22.23% 62.93% 14.83% 0% 0%
Table 4.23: Credibility Dimension: Distribution Performance ratings
STATEMENT EXCELLENT GOOD NEUTRAL POOR VERY POOR
The staff in the other
sections I work with have a
good professional
reputation.
19.0% 54.0% 27.0% 0% 0%
The responses given by
each section are as
trustworthy as the others.
13.5% 45.9% 40.6% 0% 0%
The other section‘s staff
give honest answers to my
questions.
19.0% 45.9% 35.3% 0% 0%
AVERAGE 17.17% 48.6% 35.3% 0% 0%
Figure 4.6 presents the average percentages of the performance rating of the
credibility dimension. Credibility of employees can be diminished if they do not

92
have a good reputation or if they do not provide honest answers to questions. A
negative word of mouth can have a devastating impact on an employee or
section (Homburg & Rudolph, 2001:15).
The credibility dimension had the largest variance in the Demand Planning
section. The Demand Planning sections had a lower average percentage of
neutral ratings than the other two sections, and a higher ―good‖ and ―excellent‖
rating. The rating percentages of the other two sections were very similar to each
other.
0
20
40
60
80
Excellent Good Neutral Poor Very Poor
Perc
en
tag
e
Rating
Production
Demand Planning
Distribution
Figure 4.6: Average percentages of the credibility dimension ratings
4.2.8 Security Dimension
There were three statements linked to the security dimension and the ratings are
depicted in tables 4.24, 4.25 and 4.26. The Production respondents gave the only
―very poor‖ ratings for the performance of this dimension. All three sections had
―poor‖ ratings for the statement linked to other staff knowing where the staff keep
their records. Not knowing where records are stored could delay a report or
response if the staff member normally responsible for the records is not available.
The safety of equipment used to perform their jobs was not rated as ―poor‖ or
―very poor‖ by any respondents.

93
Table 4.24: Security Dimension: Production Performance ratings
STATEMENT EXCELLENT GOOD NEUTRAL POOR VERY POOR
Other staff know where my
records are kept.
5.1% 35.9% 46.2% 7.7% 5.1%
Records are protected from
unauthorised use.
35.9% 41.0% 20.5% 0% 2.6%
It is safe to use the
equipment I use to perform
my job.
30.7% 46.2% 23.1% 0% 0%
AVERAGE 23.90% 41.03% 29.93% 2.57% 2.57%
Table 4.25: Security Dimension: Demand Planning Performance ratings
STATEMENT EXCELLENT GOOD NEUTRAL POOR VERY POOR
Other staff know where my
records are kept.
11.1% 33.3% 44.5% 11.1% 0%
Records are protected from
unauthorised use.
22.2% 38.9% 33.3% 5.6% 0%
It is safe to use the
equipment I use to perform
my job.
27.7% 66.7% 5.6% 0% 0%
AVERAGE 20.33% 46.30% 27.80% 5.57% 0%
Table 4.26: Security Dimension: Distribution Performance ratings
STATEMENT EXCELLENT GOOD NEUTRAL POOR VERY POOR
Other staff know where my
records are kept.
21.7% 37.8% 37.8% 2.7% 0%
Records are protected from
unauthorised use.
37.8% 51.4% 10.8% 0% 0%
It is safe to use the
equipment I use to perform
my job.
37.8% 54.1% 8.1% 0% 0%
AVERAGE 29.1% 47.77% 18.9% 0.9% 0%
The average percentages of the security dimension is presented in figure 4.7.
Bowen et al. (1989:83) comment that security, as one of the intangible service
quality dimensions, is important when there are high levels of customer contact.

94
0
10
20
30
40
50
Excellent Good Neutral Poor Very Poor
Perc
en
tag
e
Rating
Production
Demand Planning
Distribution
Figure 4.7: Average percentages of the security dimension ratings
Distribution showed the greatest variance in the security dimension. Their
average percentage of neutral ratings was lower than the other sections and the
excellent ratings were higher. The average percentages of the ratings of the other
two sections were more similar.
4.2.9 Access Dimension
Tables 4.27 to 4.29 present the performance ratings of the access dimension.
Only a small percentage of Production respondents rated the performance as
―very poor‖. All three sections gave some poor ratings to the statement that the
appropriate staff member could be reached by telephone. The Production and
Distribution sections both gave ratings of ―poor‖ to the statement that an alternate
staff member is available if the normal staff member is unavailable. With most
staff being accessible to other staff via both telephone and email, performance of
the access related statements should be higher. The appropriate staff should be
available to others through one of the two media, or by having an alternate staff
member available if they are not available.

95
Table 4.27: Access Dimension: Production Performance ratings
STATEMENT EXCELLENT GOOD NEUTRAL POOR VERY POOR
It is easy…
..to reach the appropriate
staff member by telephone.
25.6% 43.6% 20.5% 7.7% 2.6%
..to reach the appropriate
staff member by email.
41.0% 41.0% 15.4% 2.6% 0%
An alternate staff member
is available if the normal
staff member I deal with is
unavailable.
10.2% 38.5% 33.3% 15.4% 2.6%
AVERAGE 25.60% 41.03% 23.07% 8.57% 1.73%
Table 4.28: Access Dimension: Demand Planning Performance ratings
STATEMENT EXCELLENT GOOD NEUTRAL POOR VERY POOR
It is easy…
..to reach the appropriate
staff member by telephone.
33.3% 44.4% 5.6% 16.7% 0%
..to reach the appropriate
staff member by email.
50.0% 38.9% 11.1% 0% 0%
An alternate staff member
is available if the normal
staff member I deal with is
unavailable.
33.3% 44.4% 22.3% 0% 0%
AVERAGE 38.87% 42.57% 13.00% 5.57% 0%
Table 4.29: Access Dimension: Distribution Performance ratings
STATEMENT EXCELLENT GOOD NEUTRAL POOR VERY POOR
It is easy…
..to reach the appropriate
staff member by telephone.
16.2% 48.7% 24.3% 10.8% 0%
..to reach the appropriate
staff member by email.
29.8% 45.9% 18.9% 5.4% 0%
An alternate staff member
is available if the normal
staff member I deal with is
unavailable.
18.9% 32.5% 37.8% 10.8% 0%
AVERAGE 21.63% 42.37% 27.0% 9.0% 0%

96
The average percentages of the access dimension ratings are presented in figure
4.8. Demand Planning awarded the highest percentage of ―excellent‖ ratings to
the performance of the access dimension by the other sections. Although many
respondents rated the performance as ―excellent‖, all staff need to ensure that
they notify internal customers of who should be contacted if they are unavailable.
0
10
20
30
40
50
Excellent Good Neutral Poor Very Poor
Perc
en
tag
e
Rating
Production
Demand Planning
Distribution
Figure 4.8: Average percentages of the access dimension ratings
The access variable shows the greatest variance in the Demand Planning
section when compared to the other two sections. The neutral ratings had a lower
average percentage when compared to the other two sections while the excellent
rating had a higher average percentage. The other two sections‘ average
percentages for each rating showed less variability.
4.2.10 Communication Dimension
There were three statements for this dimension. Tables 4.30 to 4.32 show the
performance ratings per section. A small percentage of Production staff gave
ratings of very poor to the statement regarding whether the other staff
communicate if they cannot meet a deadline. This same statement received poor
ratings from all three sections. Trying to meet a set deadline is mentioned by

97
Lawrence and Wiswell (1998:46) as being identified with by those staff that
experience good internal customer service.
Table 4.30: Communication Dimension: Production Performance ratings
STATEMENT EXCELLENT GOOD NEUTRAL POOR VERY POOR
Other section‘s staff…
..demonstrate
understanding of my query
when I contact them.
10.3% 61.5% 25.6% 2.6% 0%
..communicate the
solutions to my query
clearly.
7.7% 53.8% 35.9% 2.6% 0%
..communicate if they
cannot meet a deadline on
a task.
10.3% 38.5% 33.3% 15.3% 2.6%
AVERAGE 9.43% 51.27% 31.6% 6.83% 0.87%
Table 4.31: Communication Dimension: Demand Planning Performance ratings
STATEMENT EXCELLENT GOOD NEUTRAL POOR VERY POOR
Other section‘s staff…
..demonstrate
understanding of my query
when I contact them.
22.2% 55.6% 22.2% 0% 0%
..communicate the
solutions to my query
clearly.
11.1% 66.7% 22.2% 0% 0%
..communicate if they
cannot meet a deadline on
a task.
5.55% 66.7% 22.2% 5.55% 0%
AVERAGE 12.95% 64.0% 22.2% 1.85% 0%
Figure 4.9 presents the average percentages of each section of the
communication dimension. An overall average of the three sections gave a
performance rating of over 56 percent. This leaves room for an improvement in
the performance of this dimension.

98
Table 4.32: Communication Dimension: Distribution Performance ratings
STATEMENT EXCELLENT GOOD NEUTRAL POOR VERY POOR
Other section‘s staff…
..demonstrate
understanding of my query
when I contact them.
13.5% 70.3% 16.2% 0% 0%
..communicate the
solutions to my query
clearly.
13.5% 59.5% 27.0% 0% 0%
..communicate if they
cannot meet a deadline on
a task.
10.8% 32.5% 48.6% 8.1% 0%
AVERAGE 12.6% 54.1% 30.6% 2.7% 0%
The Demand Planning sections showed the largest variance in average
percentages in this dimension. The ratings of the other two sections are similar to
each other.
0
20
40
60
80
Excellent Good Neutral Poor Very Poor
Perc
en
tag
e
Rating
Production
Demand Planning
Distribution
Figure 4.9: Average percentages of the communication dimension ratings
4.2.11 Understanding The Customer Dimension
There were four statements for this dimension. Over 50 percent of the
respondents for each section awarded ratings of good to the performance of this
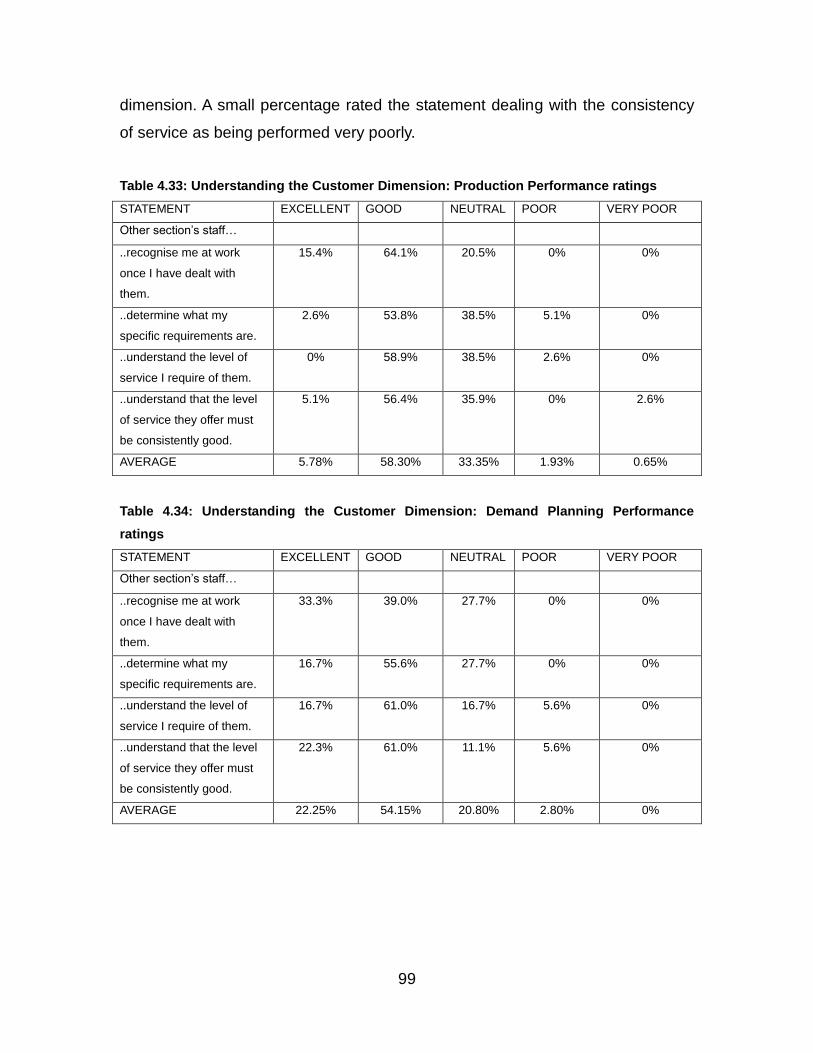
99
dimension. A small percentage rated the statement dealing with the consistency
of service as being performed very poorly.
Table 4.33: Understanding the Customer Dimension: Production Performance ratings
STATEMENT EXCELLENT GOOD NEUTRAL POOR VERY POOR
Other section‘s staff…
..recognise me at work
once I have dealt with
them.
15.4% 64.1% 20.5% 0% 0%
..determine what my
specific requirements are.
2.6% 53.8% 38.5% 5.1% 0%
..understand the level of
service I require of them.
0% 58.9% 38.5% 2.6% 0%
..understand that the level
of service they offer must
be consistently good.
5.1% 56.4% 35.9% 0% 2.6%
AVERAGE 5.78% 58.30% 33.35% 1.93% 0.65%
Table 4.34: Understanding the Customer Dimension: Demand Planning Performance
ratings
STATEMENT EXCELLENT GOOD NEUTRAL POOR VERY POOR
Other section‘s staff…
..recognise me at work
once I have dealt with
them.
33.3% 39.0% 27.7% 0% 0%
..determine what my
specific requirements are.
16.7% 55.6% 27.7% 0% 0%
..understand the level of
service I require of them.
16.7% 61.0% 16.7% 5.6% 0%
..understand that the level
of service they offer must
be consistently good.
22.3% 61.0% 11.1% 5.6% 0%
AVERAGE 22.25% 54.15% 20.80% 2.80% 0%

100
Table 4.35: Understanding the Customer Dimension: Distribution Performance ratings
STATEMENT EXCELLENT GOOD NEUTRAL POOR VERY POOR
Other section‘s staff…
..recognise me at work
once I have dealt with
them.
16.2% 64.9% 18.9% 0% 0%
..determine what my
specific requirements are.
10.8% 51.3% 35.2% 2.7% 0%
..understand the level of
service I require of them.
16.2% 45.9% 35.2% 2.7% 0%
..understand that the level
of service they offer must
be consistently good.
18.9% 40.6% 37.8% 2.7% 0%
AVERAGE 15.53% 50.68% 31.78% 2.03% 0%
Figure 4.10 depicts the average percentages of the understanding your customer
dimension. Management and the HR department need to motivate and
encourage the staff from different sections to connect with each other, work
together and improve understanding of what is required of them (Davis, 2001:
45-7). Employees need to understand their customer and become ―customer
conscious‖ in order to deliver good customer service (Hogg et al., 1998:883).
Marshall et al. (1998:383) state that in order to deliver high levels of service
quality, the providers of internal service functions need to understand the service
requirements of their customers.

101
0
20
40
60
Excellent Good Neutral Poor Very Poor
Perc
en
tag
e
Rating
Production
Demand Planning
Distribution
Figure 4.10: Average percentages of the understanding the customer dimension ratings
The performance of this dimension can be improved by getting the staff from the
different sections to work together. This will allow the understanding of what is
required to be improved and the neutral and poor ratings can be improved upon.
The Production section shows the biggest variance in the ―understanding your
customer‖ dimension. Their neutral rating was higher than the other sections and
their excellent rating much lower.
4.3 SUMMARY
The analysis of results obtained from the empirical study was covered in this
chapter. The study consisted of a questionnaire which was administered to staff
of the Production, Demand Planning and Distribution sections of Aspen
Pharmacare. The aim of the questionnaire was to assess the level of internal
customer service between the three sections based on ten dimensions of service
quality, with the statements being rated on two factors, namely, performance and
importance.
The performance ratings of each dimension were compared across the three
sections. The largest variances per dimension were also identified. These results
will assist in answering the five research questions that were developed.

102
The last chapter will conclude the study by answering the research questions,
presenting recommendations to improve internal customer service and quality.
Final conclusions will also be made.

103
5 CHAPTER FIVE
DISCUSSION OF RESULTS, RECOMMENDATIONS AND CONCLUSIONS
5.1 INTRODUCTION
The five research questions raised by this study will be answered in this chapter.
The chapter will also indicate the areas of importance that should be addressed
in order to improve internal customer service between the three sections. The
empirical results of the study will be interpreted, summarised and the managerial,
marketing, operations and human resource department implications discussed.
The researcher will provide recommendations and draw conclusions about the
internal customer service between the Production, Demand Planning and
Distribution sections of Aspen Pharmacare.
The study will close by presenting the limitations of the study as well as by
making recommendations for future research arising from this study.
5.2 RESEARCH QUESTIONS ANSWERED
An organisation needs to determine which service quality dimensions are the
most important and therefore require the most attention. These influential service
quality dimensions should be monitored to ensure that employees receive a
continuously high level of internal service (Kang et al., 2002:288). Research
questions one to three address the service quality dimension importance.
The question, what does the Production section of Aspen Pharmacare consider
to be the important dimensions of the internal customer service that they receive
and offer, was posed as research question one.

104
As part of the questionnaire, respondents were asked to rate statements
regarding ten service quality dimensions on a Likert scale of one (very
unimportant) to five (very important). By summing the totals of the responses to
the statements related to each dimension and calculating the percentage, the
most important dimensions per section were determined.
Communication (90.6 per cent) was the highest rated service quality dimension
in relation to importance. Access was rated second (89.9 per cent), tangibles
third (89.1 per cent), competence fourth (87.7 per cent) and reliability fifth (87.2
per cent). Courtesy (83.9 per cent) was rated as the least important of the service
quality dimensions by the Production section.
The importance results for the Production section are presented in table 5.1 with
the five most important dimensions highlighted in bold.
Table 5.1: Production Section: Importance percentages
DIMENSION PERCENTAGE RANKING
Tangibles 89.1 3
Reliability 87.2 5
Responsiveness 86.3 6
Competence 87.7 4
Courtesy 83.9 10
Credibility 86.0 7
Security 85.3 9
Access 89.9 2
Communication 90.6 1
Understanding the Customer 85.6 8
Research question two posed the question: what does the Demand Planning
section of Aspen Pharmacare consider to be the important dimensions of the
internal customer service that they receive and offer?

105
As with the Production section, the totals of the responses to the statements
related to each service quality dimension were totalled and the percentage was
calculated, to determine the most important dimensions for the Demand Planning
section.
Tangibles (92.2 per cent) was the highest rated service quality dimension in
terms of importance. Responsiveness and communication were both rated
second (91.5 per cent each), credibility was rated fourth (90.4 per cent), and
reliability fifth (89.7 per cent). Understanding the customer was rated as the least
important of the service quality dimensions by the Demand Planning section with
a score of 85.3 per cent.
The importance results for the Demand Planning section are depicted in table 5.2
with the five most important dimensions highlighted in bold.
Table 5.2: Demand Planning Section: Importance percentages
DIMENSION PERCENTAGE RANKING
Tangibles 92.2 1
Reliability 89.7 5
Responsiveness 91.5 2
Competence 89.6 6
Courtesy 87.0 8
Credibility 90.4 4
Security 86.7 9
Access 88.1 7
Communication 91.5 2
Understanding the Customer 85.3 10
The question: what does the Distribution section in Aspen Pharmacare consider
to be the important dimensions of the internal customer service that they receive
and offer, was posed as research question three.

106
The totals of the responses to the statements related to each service quality
dimension were totalled and the percentage of importance was calculated, to
determine the most important dimensions for the Distribution section.
Communication (87.7 per cent) was the highest rated service quality dimension
in respect to importance. Competence and security were both rated second (87.4
per cent), and tangibles and reliability were both rated fourth (87.3 per cent).
Courtesy was rated as the least important of the service quality dimensions by
the Distribution section with a score of 83.8 per cent.
The importance results for the Distribution section is presented in table 5.3 with
the five most important dimensions highlighted in bold.
Table 5.3: Distribution Section: Importance percentages
DIMENSION PERCENTAGE RANKING
Tangibles 87.3 4
Reliability 87.3 4
Responsiveness 86.3 6
Competence 87.4 2
Courtesy 83.8 10
Credibility 85.9 7
Security 87.4 2
Access 85.9 7
Communication 87.7 1
Understanding the Customer 85.1 9
The ratings of the importance of the service quality dimensions of each section
are presented in figure 5.1. The ratings are shown from least important (1) to
most important (10).

107
0
1
2
3
4
5
6
7
8
9
10
Rat
ing:
Le
ast
Imp
ort
ant
(1))
to
Mo
st Im
po
rtan
t (1
0)
Tan
gib
les
Rel
iab
ility
Res
po
nsi
ven
ess
Co
mp
eten
ce
Co
urt
esy
Cre
dib
ility
Secu
rity
Acc
ess
Co
mm
un
icat
ion
U/s
tan
d C
ust
om
er
Service Quality Dimensions
Production
Demand Planning
Distribution
Figure 5.1: Importance ratings of each dimension
Research question four posed the question: in which service quality dimensions
are there the biggest variances in each section?
The method used to determine the variances was to study the average
percentages of the performance ratings of each service quality dimension for
each section. The sections which showed the biggest variance between highest
and lowest percentages or the biggest variance when compared to the other two
sections‘ percentages was classified as having the biggest variance. The staff of
one section are rating the other section‘s staff differently to how they are rated in
order for these large variances to be apparent.
The Production section showed the largest variance in the competence and
understanding the customer dimensions.

108
The Demand Planning section showed the largest variance in the reliability,
responsiveness, credibility, access and communication dimensions. The fact that
this section had a smaller number of respondents could be the reason why they
show the largest variances in their ratings when compared to the other two
sections.
The Distribution section showed the largest variance in the tangibles, courtesy
and security dimensions.
Research question five posed the question: what are the key dimensions that will
be most valuable in improving Aspen Pharmacare‘s customer service and
quality?
The most important service quality dimensions need to be addressed as part of
an internal customer strategy and form part of an internal marketing plan
(McDermott & Emerson, 1991:61). The following dimensions are the most
important to the sections: communication, tangibles and reliability (in the top five
for all three sections) and competence (in the top five importance ratings for two
sections).
The overall performance percentages of each section and dimension are
presented in figure 5.2. The totals of the responses to the statements related to
each service quality dimension of each section were totalled and the percentage
of performance was calculated. This determined the best performed dimensions
of each section. Competence was rated as the best performed dimension by the
Production section; access was rated as the best performed by the Demand
Planning section; and courtesy by the Distribution section. Reliability and
communication were rated in the bottom four of performance by all three
sections.

109
0
10
20
30
40
50
60
70
80
90
Pe
rce
nta
ge
Tan
gib
les
Rel
iab
ility
Res
po
nsi
ven
ess
Co
mp
eten
ce
Co
urt
esy
Cre
dib
ility
Secu
rity
Acc
ess
Co
mm
un
icat
ion
U/s
tan
d C
ust
om
er
Service Quality Dimensions
Production
Demand Planning
Distribution
Figure 5.2: Overall Performance percentages
The key dimensions that will be most valuable in improving Aspen Pharmacare‘s
customer service and quality are communication, tangibles, reliability,
competence and responsiveness. These dimensions were determined to be key
because three of the dimensions (communication, tangibles and reliability) were
considered to be most important for internal service quality by all three sections
and yet two of these, communication and reliability, were rated in the bottom of
the performance ratings. The performance of these dimensions should be
improved as they have been rated to be of importance to employees when
dealing with their fellow staff. Improvements in internal communication improve
both internal and external customer satisfaction (Lakhe & Mohanty, 1994:21).
The finding that the tangibles dimension was important to the internal customers
at Aspen Pharmacare is contradictory to the finding of Brooks et al. (1999:58),
which showed that the tangibles dimension was not important to internal
customers. The finding that the security dimension is unimportant to internal

110
customers (Brooks et al., 1999:58) matches the security importance ratings of
the Production and Demand Planning sections, but was not proven in the
Distribution section. The findings of Kang et al. (2002:281-2) agree with the
findings of Brooks et al. who showed that tangibles and security were
unimportant but reliability and responsiveness were important as they influence
overall service quality. The findings in this study support the findings of Kang et
al. (2002:288) regarding reliability and responsiveness.
Competence was added as the fourth service quality dimension as it was rated in
the importance top five service quality dimensions by two sections (Production
and Distribution). Various authors (Lawrence & Wiswell, 1998:46; Swartzlander,
2004:62-3; Kattara et al., 2008:318-319) found that responsiveness was an
important service quality dimension and hence responsiveness was included as
the last key dimension. Responsiveness was rated the lowest on the
performance ratings by all three sections.
Assessing internal service quality and having an understanding of how the
service quality dimensions impact on overall service quality will allow Aspen
Pharmacare to design an appropriate service delivery process. Better external
customer service can be achieved by identifying the internal strengths and
weaknesses linked to the service quality dimensions, and by then allocating
internal resources to provide improved internal customer service (Kang et al.,
2002:28).
The model of internal customer service that was developed is shown in figure
5.3. The dimensions next to each section show which dimension that section
rates as their most important service quality dimensions. The most important
service quality dimensions for each section led to the model of the key service
quality dimensions which will be most valuable to the three sections of the Aspen
Pharmacare supply chain. The most valuable dimensions should be incorporated
into all future staff appointments and should be addressed with all current staff to

111
improve internal customer service. These five dimensions will require the most
effort and training to improve their performance and allow the staff to offer
improved service to each other and indirectly to the external customer.
Figure 5.3: Ideal Customer Service Model for Aspen Pharmacare
5.3 RECOMMENDATIONS FOR THE PHARMACEUTICAL COMPANY
Having unresponsive internal sections makes it difficult for any organisation to
adjust to changing customer needs and to meet competitive challenges
(Magidson & Polcha, 1992:37). Teamwork and participation between the three
sections will result in an enhanced work environment which then improves
worker morale (Lakhe & Mohanty, 1994:21).
Demand Planning
Distribution
Production
MODEL: Reliability,
Communication, Tangibles,
Competence. Responsiveness.
Communication Access Tangibles Competence Reliability
Tangibles Responsiveness Communication Credibility Reliability
Communication Competence Security Tangibles Reliability

112
Generic pharmaceutical manufacturers, like Aspen Pharmacare, face the
challenge of retaining customers on a daily basis. If sales are lost through an ‗out
of stock‘ situation, winning the customer back to the original product will be a
difficult task and may result in lost sales of that generic for that customer. The
communication and understanding between the marketing department and the
operational management of the three sections of Aspen Pharmacare‘s supply
chain, namely, Production, Demand Planning and Distribution, is critical. This is
important to ensure that the products that are required for the market are
produced so as to minimise out of stocks and lost sales.
Aspen Pharmacare should develop a flowchart of each activity, including what
precedes the activity (inputs) and what follows it (outputs), so that all activities
can be examined in sequence. This will allow problem areas to be identified
(Farner et al., 2001:351). Improved internal relations require the staff to
understand the other aspects of the organisational system in order to offer good
quality service, to lower barriers of distrust and to improve productivity by
enhancing cooperation (Magidson & Polcha, 1992:40; Chaston, 1994b:55;
Swartzlander, 2001:56-7). Management and the HR department need to motivate
and encourage the staff from the different sections to connect with each other
and to work together to gain commitment, improve understanding, and explore
solutions that incorporate the interests and recommendations of all staff (Davis,
2001:45-7).
Proper alignment of manufacturing processes with the marketing section‘s
intended markets will ensure that an organisation survives (Rosen & Karwan,
1994:43). High inventory turn-over is a sign of a healthy company and the
inventory turns metric reflects the efficiency of the sales, planning, manufacturing
and distribution systems (Chatterjee, n.d.). If the sections of Aspen Pharmacare
work together and align manufacturing and marketing, a high inventory turn-over
would result as the right items would be produced in the right quantity. This would

113
assist in minimising ‗out of stock‘ situations as well as high inventory carrying
costs due to over-production.
The failure of marketing initiatives in meeting customer requirements and in
meeting management and staff expectations is a matter of concern that Aspen
Pharmacare should address (Christopher, 1991:2). An important new
responsibility for marketing is to take charge or collaborate in service quality
management in terms of planning and organising improvements, as well as to
monitor both customer service requirements externally and internal service
support processes (Christopher, 1991:4). Quality has become the integrating
concept between production and marketing (Chaston, 1994b:45).
The reliability dimension related to the responses that the staff receive from the
other sections being received on time, that these responses are correct the first
time and are received without errors. The last statement was related to the staff
receiving what they request of the other sections staff. In order to improve the
performance of this dimension, the Human Resources Department could draw up
a standard set of requirements that all staff who deal with other staff should
adhere to. The fact that this dimension was shown to be important to the three
sections in this study is in agreement with the findings that reliability is a critical
driver of service quality (Dick et al., 2001:55).
The communication dimension related to other staff understanding the query put
to them, whether they communicated the solutions clearly and whether they let
the staff member who requested the task know if they could not meet the
deadline. To improve this dimension, staff should be made aware of the
importance of informing other staff if they need more time to complete a report or
seek more clarity if they are not sure what is required of them. This could be
addressed by the managers of the sections. By seeking clarity of the nature of
the task and what is required of them, the recipient should be able to provide
clear and correct solutions to the queries requested of them.

114
Improving communication will assist in improving internal relationships between
the three sections and should also lead to improved external customer service
(Swinton, n.d.). Improvements in internal communication also improve both
internal and external customer satisfaction which are both vital for growing
market share and profitability (Lakhe & Mohanty, 1994:21).
The tangibles dimension included statements that related to working in a
pleasant environment, easy to understand written materials, technology used
being up to date and that the tools used to perform their job are adequate. To
improve on this dimension the managers can ensure that the staff have facilities
with functional and comfortable furniture and equipment. The IT department need
to ensure that all staff have the latest versions of programs used to ensure that
technology is up to date and the tools that the staff use are adequate and are the
best available.
The competence dimension incorporated statements related to the data provided
by the other sections being appropriate and up to date, and that the other staff
are able to use computer software, such as Baan, skilfully. This could be
improved by offering training on the software used by external training providers
for programs such as Microsoft Word and Excel or internal training by the IT
department for programs such as Baan which are job specific. Staff members
should receive the necessary Baan training before they begin their job, and
receive refresher courses as necessary, or when a need is highlighted.
Minimising staff turn-over would also allow for staff to develop competencies
which results in high levels of customer satisfaction (Heskett et al., 1994:169).
The responsiveness dimension related to the staff of the other sections being
willing to assist with problems and adhering to the timeframes given to them. The
response time on a query was also addressed. Adhering to a timeframe in terms
of responsiveness links strongly to the communication dimension where

115
statements also addressed whether the staff member communicates the fact that
they will not be able to meet a deadline. Internal service needs to be addressed
in order to improve cooperation and the level of service between the sections to
improve an organisation‘s responsiveness to the external market (Lawrence &
Wiswell, 1998:45).
The managers of each section should compile guidelines for their staff on how to
respond to queries. If the query requires some time to resolve, the staff member
should acknowledge the request. If an answer cannot be found within a pre-
determined timeframe, a second email should be sent to confirm that the request
is being worked on, and finally a response should be sent. This would assist in
improving performance of both the communication and responsiveness
dimensions.
The access dimension included statements relating to whether other staff are
available by telephone or by email, and whether an alternate staff member is
available if the normal contact is unavailable. This dimension can be improved by
ensuring that emails sent while the staff member is not at their desk are
acknowledged as soon as possible when the staff member is back at their desk.
Messages left on the telephone should also be followed up with the caller. If a
staff member goes on leave, they should leave an out of office message on their
telephone and email to provide the dates that they are unavailable and who will
be assisting in their absence. This would greatly improve access to staff and to
information and would improve the performance of this dimension.
Although the dimension of understanding the customer did not rate as an
important dimension, it would be a worthwhile exercise for each section to
develop an understanding of what the service requirements of the other sections
that they work with are and to ask the sections to evaluate the service provider
against these requirements (Marshall et al., 1998:383).

116
Aspen Pharmacare can confirm that they possess the basic expectations of the
quality of service they expect from internal staff by asking the following questions:
Do the sections have adequate resources available to meet their
commitments?
Do the sections respond quickly to requests for information?
Do the sections have few errors in written reports?
Are all the sections staffed by adequately trained staff members to satisfy
other sections‘ needs?
Do the staff of the three sections exhibit a willingness to correct problems
when they occur by doing everything possible to correct the problem?
(adapted from McDermott & Emerson, 1991:63).
Answering the above questions will assist Aspen Pharmacare managers in
operations (Production, Demand Planning and Distribution) and marketing to
learn how to compete on the selected service quality dimensions that are
strategically important (Garvin, 1987:104). Further, answering these questions
will allow the organisation to move in the same direction as the external customer
(Rosen & Karwan, 1994:39). The managers need to understand the
organisation‘s products and services and have enough seniority to influence the
strategy of the organisation (Slack, 1994:62).
Employee relationships can be improved in many ways, including establishing an
internal customer service strategy, creating an internal marketing plan, providing
interpersonal relations training, developing performance standards and by
conducting brainstorming meetings (McDermott & Emerson, 1991:61).
An internal marketing plan should be developed for the three sections of the
Aspen Pharmacare supply chain covered in this study. The plan could be
expanded to include the support sections. The recognition that the quality of
relationships within the organisation is critical to the success of the marketing
plans forms an important tenet of internal marketing (Christopher, 1991:7). The

117
marketing, HR, operations and management departments should work together
to establish service levels because internal marketing is the responsibility of all
sections, not the sole responsibility of a single section (Rafiq & Ahmed,
1993:228).
The HR department can minimise employee turnover by hiring and retaining the
best employees and through implementing correct rewards and remuneration
strategies (Heskett et al., 1994:169). HR and management need to motivate and
encourage staff from the different sections to work together to gain commitment,
improve understanding of the internal customer‘s needs and to incorporate
accountability across the organisation (Davis, 2001:45-47).
5.4 LIMITATIONS OF THE STUDY
A number of limitations of the study were noted retrospectively. These included
the exclusion of the support departments (discussed in section 5.4.1) and the
questionnaire design (discussed in section 5.4.2).
A variable which could not be controlled may also have affected the responses.
The variable is the fact that the responses are based on an individual‘s
perception of the service they are receiving from the other sections. If the
respondent had a good or bad experience during the time preceding their
completion of the questionnaire, their perception and rating of the statements
could have been biased by that experience. A recent good or bad experience
may override the regular service offered by the other sections.
5.4.1 Exclusion of the Support Sections
This study addressed the three largest sections of Aspen Pharmacare. Although
the results of the study have shown a similarity of the results of the importance of

118
the dimensions and the gaps between performance and importance for the three
sections involved in the study, a comprehensive study of all the support functions
of the manufacturer should be carried out.
5.4.2 The Questionnaire Design
The questionnaire was designed so that each section assessed the other two
sections together. Many factors affect the respondents‘ work experience, such as
their job satisfaction and remuneration. These factors were not addressed as
part of this study, because this study investigated which dimensions were
important and where the gaps between performance and importance were.
5.5 RECOMMENDATIONS FOR FUTURE RESEARCH
A comprehensive study of all the sections within the manufacturer would ensure
that all interactions between internal departments are assessed and any other
dimensions or gaps are identified. These gaps could then be addressed as part
of an overall program to formalise and improve customer service between all the
sections of Aspen Pharmacare.
The questionnaire could be administered to the same sections, but each
respondent could complete two questionnaires, one for each of the other
sections. This would allow an assessment by each section of the other two
sections individually. One section may offer better (or worse) service than the
other section, but the overall rating is higher (or lower) due to the one section‘s
very good (or bad) service. Results could be skewed by one section‘s
assessment.
A model for each section could be designed by asking all the other sections to
rate the service quality dimensions of that section only. This would lead to a

119
comprehensive model for each section being developed, so that the senior
management of each section could work with the HR department to address the
gaps and to assist in improving the performance of the most important
dimensions.
5.6 CONCLUSION
This study succeeded in answering the research questions that were posed in
chapter one and an overall internal customer service model was developed. The
dimensions identified from the literature study addressed the areas of customer
service and service quality. The intention was to identify the areas requiring
attention to improve internal customer service at Aspen Pharmacare. The study
showed a similarity in the service quality dimensions that each section rated as
important. Some of these importance ratings of the service quality dimensions
matched the literature findings, while others were different to the literature
findings of importance for internal customer service.
An organisation needs to determine which service quality dimensions are the
most important and therefore require the most attention. This study may assist
senior management of Aspen Pharmacare to determine which service quality
dimensions are important to the three sections included in the study. These
influential service quality dimensions should be monitored to ensure that
employees receive a continuously high level of internal service (Kang et al.,
2002:288).
The performance levels of the service quality dimensions were also determined
for each of the sections. The performance levels highlighted the need for training
and education to improve the performance of some of the service quality
dimensions.

120
Senior management of Aspen Pharmacare has been offered the tools and data
from which a formal internal marketing plan can be developed. The ideal service
quality model presented in figure 5.3 can be used as a starting point.
Management, operations, HR and marketing should work together to improve
internal customer service and align this with the organisation‘s business strategy
(Garvin, 1987:104).
Swartzlander (2004: 38) confirms that improving internal customer service leads
to an improvement in external customer service which may lead to Aspen
Pharmacare growing its market further and to continue to delight customers. The
improvement in internal service quality will lead to increased employee
satisfaction, retention of employees and improved productivity which in turn will
lead to enhanced external customer service and satisfaction. This will increase
customer loyalty, generate repeat business, and improve the revenues and
profitability of the organisation (Cook & Verma, 2002:53).
The following statement by Brooks (2000:41) provides an appropriate closing
remark:
―If you pay attention to those conditions that enable employees to do a good job,
customers will stick around – and revenue and profits will grow‖.

121
LIST OF SOURCES
Aspen Pharmacare. n.d. [Online] Available: http://www.aspenpharma.com/default.aspx?pid=96&stepid=1&oid=133 [Accessed 11 March 2009]. Ballantyne, D., Christopher, M & Payne, A. 1995. Improving the Quality of Services Marketing: Service (Re)design is the Critical Link. Journal of Marketing Management, 11:7-24. Boulding, W., Kalra, A, Staelin, R. & Zeithaml, V.A. 1993. A Dynamic Process Model of Service Quality: From Expectations to Behavioral Intentions. Journal of Marketing Research, 30:7-27. Bowen, D.E., Siehl, C. & Schneider, B. 1989. A framework for analysing customer service orientations in manufacturing. Academy of Management Review, 14(1):75-95. Brewster, C., Carey, L., Grobler, P., Holland, P. & Warnich, S. 2008. Contemporary Issues in Human Resources Management: gaining a competitive advantage. Third Edition. Cape Town: Oxford University Press Southern Africa. Brexendorf, T.O., Muhlmeier, S., Tomczak, T. & Eisand, M. 2010. The impact of sales encounters on brand loyalty. Journal of Business Research, 63(11):1148-1155). Brooks, I. 1997. 6 Strategies for creating superior customer value. Birkenhead: Nahanni Publishing Limited. Brooks, R. 2000. Why Loyal Employees and Customers Improve the Bottom Line. Association for Quality & Participation, 23(2):40-45. Brooks, R.F., Lings, A.N. & Botschen, M.A. 1999. Internal Marketing and Customer Driven Wavefronts. The Service Industries Journal, 19(4):49-67. Brown, T.J., Churchill, G.A. & Peter, J.P. 1993. Improving the Measurement of Service Quality. Journal of Retailing, 69(1):127-139. Buttle, F. 1996. SERVQUAL: review, critique, research agenda. European Journal of Marketing, 30(1):8-32. Canibano, C., Encinar, M-I. & Munoz, F-F. 2006. Evolving capabilities and innovative intentionality: Some reflections on the role of intention within innovation processes. Innovation: management, policy & practice, 8(4-5):310-321.

122
Cardy, R.L. 2001. Employees as Customers? Marketing Management, 10(3):12-13. Carman, J.M. 1990. Consumer perceptions of service quality: as assessment of the SERVQUAL dimensions. Journal of Retailing, 66(1):33-35. Chaston, I. 1994a. Internal customer management and service gaps within the National Health Service. International Journal of Nursing Studies, 31(4):380-390. Chaston, I. 1994b. Internal Customer Management and Service Gaps within the UK Manufacturing Service. International Journal of Operations & Production Management, 14(9):45-56. Chatterjee, B. n.d. Achieving bottom line continuous improvement value. [Online] Available: http://www.pharmamanufacturing.com/articles/2010/027.html [Accessed 7 May 2010]. Christopher, M. 1991. Relationship Marketing: Bringing quality, customer service and marketing together. Unpublished Working Paper, Cranfield University, Cranfield, UK. http://dspace.lib.cranfield.ac.uk/handle/1826/621. Collis, J. & Hussey, R. 2003. Business Research. Second Edition. Palgrave: MacMillan. Cook, S. 2002. Customer Care Excellence. How to create an effective customer focus. Fourth Edition. London: Kogan Page Limited. Cook, L.S. & Verma, R. 2002. Exploring the Linkages between Quality System, Service Quality, and Performance Excellence: Service Providers‘ Perspectives. Quality Management Journal, 9(2):44-56. Cremona, K. n.d. A framework for understanding organisational dynamics. [Online] Available: http://www.peoplesavvyconsulting.com/documents/Aframeworkforunderstandingorganisationaldynamics.pdf [Accessed 2 July 2010]. Cronin, J.J. & Taylor, S.A. 1992. Measuring Service Quality: A Reexamination and Extension. Journal of Marketing, 56:55-68. Culbertson, S.S. 2009. Do Satisfied Employees Mean Satisfied Customers? Academy of Management Perspectives, 1(4):76-77. Davis, L. 2001. Performance breakthroughs are the result of human choices, not technological wizardry. Journal for Quality & Participation, 24(4):42-47.

123
Davis, T.R.V. 1992. Satisfying internal customers: the link to external customer satisfaction. Planning Review (a publication of the Planning Forum), 20(1):34-38. Dick, G., Gallimore, K. & Brown, J.C. 2001. Does ISO 9000 Give Quality Emphasis Advantage? A Comparison of Large Service and Manufacturing Organizations. Quality Management Journal, 8(1):52-61. Farner, S., Luthans, F. & Sommer, S.M. 2001. An empirical assessment of internal customer service. Managing Service Quality, 11(5):350-358. Feldman, S. 1991. Keeping the Customer Satisfied–Inside and Out. Management Review, 80(11):58-60. Flynn, B.B., Schroeder, R.G. & Sakakibara, S. 1994. A framework for quality management research and an associated measurement instrument. Journal of Operations Management, 11(4):339-366. Garvin, D.A. 1987. Competing on the eight dimensions of quality. Harvard Business Review, 65(6):101-109. George, W.R. 1990. Internal Marketing and Organizational Behavior: A Partnership in Developing Customer-Conscious Employees at Every Level. Journal of Business Research, 20:63-70. Ghobadian, A., Speller, S. & Jones, M. 1994. Service Quality. Concepts and Models. International Journal of Quality & Reliability, 11(9): 43-66. Hagan, B. 1997. Improving Employee Perception of Benefits by Focusing on ―Customers‖. Benefits Quarterly, 13(1):19-20. Hallowell, R., Schlesinger, L.A. & Zornitsky, J. 1996. Internal service quality, customer and job satisfaction: linkages and implications for management. Human Resource Planning, 19(2):20-32. Hart, C.W.L. 1995. The power of Internal Guarantees. Harvard Business Review, 73(1):64-73. Haywood-Farmer, J. 1988. A Conceptual Model of Service Quality. International Journal of Operations & Production Management, 8(6):19-29. Heskett, J.L. 1987. Lessons in the service sector. Harvard Business Review, 65(2):118-126. Heskett, J.L., Jones, T.O., Loveman, G.W., Sasser Jr, W.E. & Schlesinger, L.A. 1994. Putting the Service-Profit Chain to Work. Harvard Business Review, 72(2):164-174.

124
Hogg, G., Carter, S. & Dunne, A. 1998. Investing in People: Internal Marketing and Corporate Culture. Journal of Marketing Management, 14:879-895. Homburg, C. & Rudolph, B. 2001. Customer satisfaction in industrial markets: dimensional and multiple role issues. Journal of Business Research, 52(2001):15-33. Johnson, M.D. 2004. Customer Satisfaction. International Encyclopedia of the Social & Behavioural Sciences, 3198-3202. Joseph, W.B. 1996. Internal Marketing Builds Service Quality. Journal of Healthcare Marketing, 16(1):54-59. Kattara, H.S., Weheba, D. & El-Said, O.A. 2008. The impact of employee behaviour on customers‘ service quality perceptions and overall satisfaction. Tourism and Hospitality Research, 8(4):309-323. Kang, G-D., James, J. & Alexandris, K. 2002. Measurement of internal service quality: application of the SERVQUAL battery to internal service quality. Managing Service Quality, 12(5):278-291. Kaydos, W. 1991. Measuring, managing and maximising performance. Cambridge, Massachusetts: Productivity Press. Kinnell, M. 1997. Benchmarking for information service excellence: The pharmaceutical industry. Total Quality Management, 8(1):3-13. Lakhe, R.R. & Mohanty, R.P. 1994. Total Quality Management. Concepts, Evolution and Acceptability in Developing Economies. International Journal of Quality & Reliability Management, 11(9):9-33. Lawrence, H.V. & Wiswell, A.K. 1998. How to make internal customers cooperate (dealing with ‗internal‘ corporate clients). Training & Development, 52(3):45-48. Leedy, P.D. 1997. Practical research: planning and design. Sixth Edition. New Jersey: Prentice-Hall. Lings, I.N. & Brooks, R.F. 1998. Implementing and Measuring the Effectiveness of Internal Marketing. Journal of Marketing Management, 14:325-351. Longenecker, C.O. & Meade II, W.K. 1995. Marketing as a management style (improving internal customer service). Business Horizons, 38(4):77-84.

125
Magidson, J. & Polcha, A.E. 1992. Creating market economies within origanizations: a conference on ―internal markets.‖ Planning Review (a publication of the Planning Forum), 20(1):37-41. Marshall, J. 2001. Employee Retention Linked To Better Customer Service. Financial Executive, 17(2):11-12. Marshall, G.W., Baker, J. & Finn, D.W. 1998. Exploring internal customer service quality. Journal of Business & Industrial Marketing, 13(4/5):381-392). McDermott, L.C. & Emerson, M. 1991. Quality and service for internal customers. Training & Development, 45(1):61-65. Michael, W.A. 2003. The implementation and evaluation of an internal customer service program for a public sector organization. Dissertation Abstracts International: Section B: The Sciences and Engineering, 64(5B):2427. NAPM. n.d. [Online] Available: http://www.napm.co.za/about_us.html [Accessed 11 April 2009]. Oakland, J.S. 2003. TQM, Text with cases. Oxford: Butterworth-Heinemann Publications. Parasuraman, A., Zeithaml, V.A. & Berry, L.L. 1985. A Conceptual Model of Service Quality and Its Implications for Future Research. Journal of Marketing, 49:41-50. Parasuraman, A., Zeithaml, V.A. & Berry, L.L. 1988. SERVQUAL: A Multiple-Item Scale for Measuring Consumer Perceptions of Service Quality. Journal of Retailing, 64(1):12-40. Parasuraman, A., Zeithaml, V.A. & Berry, L.L. 1991. Refinement and Reassessment of the SERVQUAL Scale. Journal of Retailing, 67(4):420-450. Pieterse, K., van der Merwe, K., Lourens, A. & Murray, A. 2010. Implementing Lean in South African Industry. Port Elizabeth: Trilean Publishing. PRLog. 2008. High growth is expected in the generic market globally in the next five years. [Online] Available: http://prlog.org/10161279 [Accessed 10 March 2009]. Rafiq, M. & Ahmed, P.K. 1993. The Scope if Internal Marketing: Defining the Boundary Between Marketing and Human Resource Management. Journal of Marketing Management, 9:219-232.

126
Rapp, A., Trainor, K.J. & Agnihotri, R. 2010. Performance implications of customer-linking capabilities: Examining the complementary role of customer orientation and CRM technology. Journal of Business Research, 63(11):1229-1236. Rosen, L.D. & Karwan, K.R. 1994. Prioritizing the Dimensions of Service Quality. International Journal of Service Industry Management, 5(4):39-52. Rust, R.T. & Zahorik, A.J. 1993. Customer Satisfaction, Customer Retention, and Market Share. Journal of Retailing, 69(2):193-215. Samuel, G. 2005. The Relationship between Leadership and Internal Customer Satisfaction within a Motor Manufacturing Company in Gauteng. Unpublished MBA thesis, Rhodes University, Grahamstown. Scharitzer, D. & Kollarits, H.C. 2000. Satisfied customers: profitable relationships: pharmaceutical marketing: how pharmaceutical sales representatives can achieve economic success through relationship management with settled general practitioners—an empirical study. Total Quality Management, 11(7):956-967. Shemwell, D.J., Yavas, U. & Bilgin, Z. 1998. Customer-service provider relationships: an empirical test of service model of service quality, satisfaction and relationship-orientated outcomes. International Journal of Service Industry Management, 9(2):155-168. Slack, N. 1994. The Importance-Performance Matrix as a Determinant of Improvement Priority. International Journal of Operations & Production Management, 14(5):59-75. South Africa. 1997. Medicines and Related Substances Control Amendment Act No 90 of 1997:26. Government Gazette, 390(18505):1-42, 12 December. Available: http://www.info.gov.za/view/DownloadFileAction?id=70836 [Accessed 11 March, 2009]. Swanepoel, B., Erasmus, B., Van Wyk, M. & Schenk, H. 2003. South African Human Resource Management: Theory and Practice. Third edition. Cape Town: Juta & Co Ltd. Swartzlander, A. 2004. Serving internal and external customers. New Jersey: Pearson Education. Swinton, L. n.d. The 9 Principles of Quality Customer Service. [Online] Available: http://www.mftrou.com/quality-customer-service.html [Accessed 28 June 2010]. Zeithaml, V.A., Parasuraman, A. & Berry, L.L. 1990. Delivering Quality Service – Balancing Customer Perceptions and Expectations. New York: The Free Press.

127
Zhang, J. 2010. Employee Orientation and Performance: An Exploration of the Mediating Role of Customer Orientation. Journal of Business Ethics, 91:111-121.

128
APPENDIX A

129

130

131
APPENDIX B