improving content-based target and change …research.cs.aalto.fi/cbir/papers/ar27_molinier.pdf ·...
TRANSCRIPT

IMPROVING CONTENT-BASED TARGET AND CHANGE DETECTION IN ALOSPALSAR IMAGES WITH EFFICIENT FEATURE SELECTION
Matthieu Molinier(1)(2), Ville Viitaniemi(2), Markus Koskela(2), Jorma Laaksonen(2), Yrjo Rauste(1), AnneLonnqvist(1), and Tuomas Hame(1)
(1)VTT Technical Research Centre of Finland, Digital Information Systems, P.O. Box 1000 - VM3, FI-02044 VTT,Finland, Email: [email protected]
(2)Helsinki University of Technology, Department of Information and Computer Science, P.O. Box 5400, FI-02015 TKK,Finland, Email: [email protected]
ABSTRACT
Self-Organising Maps (SOMs) have been successfullyapplied to content-based image retrieval (CBIR). In thisstudy, we investigate the potential of PicSOM, an imagedatabase browsing system, applied to quad-polarisedALOS PALSAR images. Databases of small images wereartificially created, either from a single satellite imagefor object detection, or two satellite images when con-sidering change detection. Polarimetric features were ex-tracted from the images to allow image indexing. Byquerying the databases, it was possible to detect targetclasses, as well as changes between the two images. Re-sults open a full range of applications, from structure de-tection to change detection, to be embedded in a sameoperative system. The framework may be particularlysuitable for long-term monitoring of strategic sites.
Key words: content-based information retrieval, self-organising maps, high resolution satellite images, polari-metric spaceborne SAR, change detection.
1. INTRODUCTION
Three latest generation SAR satellites have beenlaunched - ALOS PALSAR, TerraSAR-X and Radarsat-2. The availability of dual-polarisation and fully polari-metric data, instead of earlier single-polarisation data,will enable a deeper analysis of backscattering processesand thereby pave the way for many new applications ofspaceborne SAR data. At the same time, these satellitemissions generate a huge amount of data at a higher reso-lution than previous spaceborne SAR sensors.
Current Earth Observation archiving systems typi-cally support queries by sensor type, acquisition date,imagery coverage or a combination of them. Concur-
rently, security-concerned applications relying on satel-lite imagery often demand repeated or continuous mo-nitoring, and intelligent access to the extracted informa-tion. There is therefore a growing interest in the remotesensing community to access databases directly by theinformation contained in images. Content-based imageretrieval (CBIR) allows management of large imagearchives [1–6], as well as satellite image annotation andinterpretation [2, 7–9].
Our work extends and improves the potential of PicSOM,a CBIR system based on Self-Organising Maps (SOMs),for remote sensing image analysis [10]. In the PicSOMimage database browsing system [11], several thou-sands of images are mapped onto Self-Organising Maps(SOMs) [12], through the extraction of image descriptorsincluding textural and color features. After the SOMsare trained, the user can visually query the database andthe system automatically finds images similar to those se-lected. This approach has been successfully applied todatabases of conventional images [13, 14] as well as man-made structure and change detection in high-resolutionsatellite optical images [10].
This article presents our latest experiments with PicSOMon a spaceborne polarimetric ALOS PALSAR dataset.The key idea of our study, first presented at ESA-EUSC2005 conference [15], is to artificially generate a databaseof small images (or imagelets) from each full satelliteimage to be analysed. PicSOM can be trained on thatvirtual database, then queried for finding objects of inte-rest. Imagelets can be extracted for the detection of man-made structures or other targets, or to detect changes iftwo scenes are available.
The data consists of two fully polarimetric scenes ac-quired in March and May 2007 over Kuortane, in cen-tral Finland. Typically, a scene was divided into seve-ral thousands of imagelets of size 16 × 16 pixels. Wehave extended PicSOM to include widely used polari-metric features (e.g. co-polarised and cross-polarised ra-

tios, among many others). Polarimetric features extractedpixel by pixel were grouped into imagelet-wise featurevectors in several ways, including averaging and his-tograms by vector quantisation. Evaluation of the meth-ods for feature selection were provided using classifica-tion images. Change detection was also performed andevaluated versus a reference change map and ground truthof clearcuts obtained from the local forest administra-tion of Kuortane. Potential applications of this work arehigh-resolution satellite image annotation, or monitoringof sensitive areas for undeclared human activity, both inan interactive way.
2. DATA AND PRE-PROCESSING
2.1. Satellite imagery
Two quad-polarised ALOS PALSAR images were ac-quired on 29th March 2007 and 14th of May 2007 overKuortane, in central Finland (62◦48’33”N, 23◦30’50”E).The off-nadir angle was 21.5 degrees and incidence an-gle 24 degrees. The fully polarimetric scenes cover anarea of 35km wide and 70km long. The were incoher-ently averaged into 6-look images in the Stokes matrixdomain. Although Kuortane area is relatively flat (eleva-tion 38-230 m), the original scenes were rectified using aDigital Elevation Model. Rectified 6-look data had a re-solution of 25m in both azimuth and range. The refinedLee speckle filter [16] was applied with window size 3x3pixels to reduce noise.
Kuortane area is dominated with small areas of differentland cover types [17]. There are a few built-up areas butthese mostly belong to discontinuous fabric of individualsingle family houses. Built-up areas contain lots of ma-ture trees. The dominant soil type is glacial drift, but sandareas exist also. Coniferous forest on mineral soil is thedominating forest type, second type being mixed forestson mineral soil.
In the March scene, the lakes were covered with ice andsome floating water on top of it. The ice was totally meltin the May scene. Fig. 1 shows the Pauli decompositionof the May image of Kuortane. In this image, powerscattered by single or odd-bounce targets (HH + V V )is represented in blue (associated with surface scattering- e.g. water or fields), double bounce (HH − V V ) in redor white (built-up areas) and volume scattering (HV ) ingreen (vegetated areas).
2.2. Database preparation
The whole scenes were considered as the study area.PicSOM image retrieval system typically requires seve-ral thousands of images in a database in order to pro-duce relevant indexing. Each image was thus cut into9241 non-overlapping small images or imagelets, of size16× 16 pixels (only imagelets containing actual data and
Fig. 1. Pauli decomposition of rectified PALSAR Mayimage over Kuortane, Finland. c©JAXA and METI 2006
no null value resulting from registration procedure werekept). After the splitting into imagelets, the amount ofcontents in each image is reduced, from many classes inthe study scene (bare soil, buildings, forest...) to only afew in each imagelet.
In order to evaluate methods quantitatively [18], a refe-rence image was created by classifying each SAR imagewith PolSARpro [19] supervised classifier, using 5 land-cover classes {water, field, forest, marsh, urban}. CorineLand Cover 2002 data was used to delineate trainingareas. Average classification accurracy was 80% for bothscenes, but it was significantly lower for the urban class(buildings). This is probably because the scenes containrather sparsely inhabited areas or relatively small buil-dings. In addition, a reference change image was createdusing AutoChange [20], an automatic change detectionsoftware originally developed for forestry.
3. METHODS
The PicSOM system used in this study has originallybeen developed for content-based image retrieval (CBIR)research [13, 14, 21]. It is based on using the Self-Organising Map (SOM) [12] as an efficient indexingstructure for the images. We show how this same tech-nique might also be applied in the semi-automated, inter-active analysis of satellite images.

3.1. Self-Organising Maps
The Self-Organising Map (SOM) [12] is a neurally-motivated unsupervised learning technique, forming anonlinear mapping of a high-dimensional input space toa typically two-dimensional grid of neural units. DuringSOM training, the model vectors in its neurons get valueswhich form a topology-preserving mapping: neighboringvectors in the input space are mapped into nearby units inthe SOM grid. Patterns mutually similar in respect to afeature are closely located on the SOM surface. Trainingis initialised with random values of model vectors mi foreach map unit i. For each input sample x(t), the “win-ner” or best-matching map unit (BMU) c(x) is identifiedon the map by the condition
∀i : ‖x(t)−mc(x)(t)‖ ≤ ‖x(t)−mi(t)‖ , (1)
where ‖ · ‖ is commonly the Euclidean metric. After fin-ding the BMU, a subset of the model vectors constitutinga neighborhood centered around node c(x) are updatedas
mi(t + 1) = mi(t) + h(t; c(x), i)(x(t)−mi(t)) . (2)
with h(t; c(x), i) a decreasing “neighborhood function”of the distance between the i-th and c(x)-th nodes on themap grid. Training is iterated over the available samples,and h(t; c(x), i) is allowed to decrease in time to guaran-tee convergence of prototype vectors mi. After training,all input samples x are once more mapped to the SOM,each in its BMU. Every SOM unit is then assigned a vi-sual label from the imagelet whose feature vector was thenearest to the model vector.
3.2. PicSOM for content-based image retrieval
The PicSOM system [11] implements two essential CBIRtechniques, query by examples (QBE) and relevancefeedback. These methods can be used for interactive re-trieval of any type of visual or non-visual content.
In interactive QBE, the system presents in a visual in-terface some images to the user, who then marks a sub-set of them as relevant to the query. This relevance in-formation is fed back to the system, which seeks moresimilar images and returns them in the next query round.In PicSOM, multiple SOMs are used in parallel, eachcreated with a different low-level visual feature. Thedifferent SOMs and their underlying feature extractionschemes impose different similarity functions on the ima-ges, allowing PicSOM to adapt to different retrieval tasks.
Relevance feedback has been implemented by using theparallel SOMs. Each image presented in PicSOM isgraded by the user as either relevant or non-relevant. Allthese relevance grades are then projected to the BMUsof the graded images on all SOM surfaces. Maps wherethere are many relevant images mapped in same or nearbySOM units agree well with the user’s conception on therelevance and semantic similarity of the images.
The relevance information placed in the SOM units isspread also to the neighboring units. Each image is givena total qualification value obtained as a sum of the qua-lification values from its BMUs from the different fea-ture SOM surfaces. Those yet unseen images which havethe highest qualification values will then be shown to theuser on the next query round. In PicSOM, features thatfail to coincide with the user’s conceptions always pro-duce lower qualification values than those descriptors thatmatch the user’s expectations. More can be found in [10].
As an illustrative example obtained from a satellite opti-cal image, Fig. 2 displays a SOM created from the texturefeature [10]. The water regions are mapped into two se-parate areas due to the different textures of the calm andwavy water surfaces, to bottom right and top left cornersof the map, respectively. This demonstrates how PicSOMorganises imagelets in the database according to a spe-cific feature.
Fig. 2. Organisation of the imagelets by their texture con-tent on a 16×16 SOM surface - original image : Quick-bird from western Finland, September 2005 [10]
3.3. Feature extraction
Features have to be extracted from the imagelets to al-low their indexing by the Self-Organising Map. The ori-ginal PicSOM features were developed for RGB opticalimages. Features used in CBIR usually describe genericimage properties, like color distribution, texture or shapes[9].
In the case of polarimetric radar imagery, meaningful po-larimetric features have to be considered instead. Firstthe polarimetric features were extracted for each pixel ofthe full size radar images. Then for each imagelet, thepixel-wise features were grouped in three different waysto form feature vectors representing the imagelet.

3.3.1. Pixel-wise features
Six groups of polarimetric features were extracted fromimagelets [18] (citations below refer to example of pre-vious polarimetric studies with those features for a givenapplication) :
BACKSCATTER : the 3 backscattering coefficientsin HH, HV and VV polarisations [22–24].
HH-VV : amplitude of correlation between HH andVV channels [23, 24] and phase difference betweenHH and VV [22, 23].
LOGRATIOS : ratio HV/VV in dB [24], co-polarised and cross-polarised ratios [25].
RATIOS : co-polarisation ratio γ [22] and depolari-sation ratio δ [22, 23]
H-A-α : entropy/anisotropy/α angle from theCloude-Pottier decomposition [26]
TOUZI : 4 discriminators related to the degree ofpolarisation and extracted from the Mueller matrix[27]
In case of Cloude-Pottier decomposition and Touzi dis-criminators, the features were extracted from 6-look datain moving windows of 3x3 pixels.
The features were computed for each pixel and storedfor later use. In previous studies features were not nor-malised : we tested normalisation of each vector com-ponent to zero mean and unit variance, expecting animprovement comparing to unscaled vectors, especiallywith the high dynamic range of input PALSAR images.
3.3.2. Imagelet-wise feature vectors
In the experiments we wanted to study how the six ba-sic feature groups could be used most efficiently foranalysing the content of the imagelets. Pixel-wise fea-tures were grouped into imagelet-wise feature vectors inthree different ways :
• the pixel-wise feature values were averaged over the256 pixels in each imagelet,
• the pixel-wise feature values were averaged per 8×8pixel blocks - 4 blocks per imagelet,
• histograms were created to describe the distributionof the feature vector values more precisely.
The feature vector histograms were generated as follows.A Self-Organising Map (SOM) of size WxH map unitswas initialised. One pixel was then randomly picked from
the full size image and its feature vector value was usedto adapt the SOM. This random selection and adaptationwas iterated 10 million times to obtain a trained SOM.The SOM was then used as a codebook or vector quan-tiser, the tesselation regions of which were used as binsin histogram creation. For each imagelet, the 256 pixel-wise feature vectors were mapped to their nearest mapunits on the SOM and the total number of hits in each unitor bin constituted the imagelet-wise histogram feature.For comparing the similarity of the histogram features weused the Euclidean distance between them. In the expe-riments we varied the WxH-size of the SOM used in thehistogram feature calculation in order to find an optimalnumber of histogram bins.
In addition to polarimetric features vectors, a xy-coordinate feature was carried along the whole analysisprocess. The xy-coordinate feature allowed to keep trackof the position of any imagelet within the full image (asrow/column indexes), and completed the framework forchange detection.
3.3.3. SOM training on feature vectors
In PicSOM, several SOMs are trained in parallel (oneper feature). Each feature vector was used 100 times intraining (Eqs. (1) and (2)). The map sizes were set to64×64 units for the visual features SOMs, and 125×125for the coordinate SOM. There were on the average9241/4096 ≈ 2.25 imagelets mapped in each map unit ofthe visual SOMs, and exactly one image location on thecoordinate map (units mapping to locations on the regis-tration canvas of the original image were not consideredin the SOM).
3.4. PicSOM for target detection
The visual querying presented in early works [10] wasnot carried out with the PALSAR data, as 16x16 pixelimagelets of Pauli decomposition were not suitable forvisual querying based on image content. PicSOM sys-tem could however be used to perform automatic detec-tion of target classes. The qualification value assignedto each imagelet by the PicSOM system is a discrimi-nation value, which indicates the likeliness that the spe-cific imagelet belongs to that semantic class (label) [10].Imagelets can be sorted by decreasing order of similarityto a given class, and a threshold can then be set to re-trieve the imagelets most similar to that semantic class.This was done for the 5 semantic classes, and combinedto ”greedy” sequential forward selection of features.
3.5. Content-based unsupervised change detection
We devised a method for finding pairs of imagelets, onefrom March image and the other from May, which dif-fered the most in the sense of some of the extracted fea-

tures. Only the true changes in the imagelet’s contentwould then give rise to such a striking change in the fea-ture vector’s value that its projection on the SOM surfaceis moved to a substantially different location. The sub-stantiality of the change can therefore be measured as thedistance between the best matching units (BMUs) of thedifferent months’ feature vectors on a same SOM.
Imagelet pairs were ordered by descending pair-wiseBMU distance on a given feature SOM – the higher thedistance, the more substantial change in content occurred.A fixed number of imagelet pairs were then regardedas the locations where the most substantial changes hadtaken place. Several feature SOMs can be used simulta-neously, in which case the pair-wise BMU distances ondifferent SOMs were normalised then combined [10].
4. RESULTS AND DISCUSSION
We divided both SAR images into two parts : the up-per part and the lower part. One of the four parts wasthen in turn used as a training set for creating the modelsfor the 5 landcover classes. By using all the remainingthree parts for three different tests, we could obtain per-formance measures for both intra-image and inter-imagegeneralisation ability. For the latter, we could furtherdistinguish between cases where the training and testingdata were from same or different location. In the case ofsame location we were also able to perform unsupervisedchange detection between the two images as in [10].
4.1. Performance evaluation of features in retrievaltasks
The results of our first experiment showed that theTOUZI and BACKSCATTER features were the twobest ones for both the average and histogram featuretypes - Tab 1. The mutual order of TOUZI andBACKSCATTER was dependent on the landcover classstudied. BACKSCATTER seemed to be the best featurefor detecting fields and especially water. However, thesetwo classes were often mixed with each other in the re-trieval tasks, so other features should be used to sepa-rate them. TOUZI was another good feature overall, andbest one for detecting marshes. From the five landcoverclasses the urban class was found to be the most difficultone to retrieve, as expected. H-A-α seemed to work rela-tively well for retrieving the urban class.
Our main interest was, however, to find out whether thehistogram method or the average method was superior.The results showed that in four cases out of six the his-togram method was better.
For each feature and each class, the 10 and 100 most re-levant imagelets were retrieved and considered truly rele-vant if the target class was present in the reference image.The higher the number of truly relevant imagelets, thebetter the feature or feature combination was - Tab 1.
4.2. Feature selection to improve overall accuracy
In a second experiment we wanted to study which com-bination of the individual features studied earlier couldproduce the best total average precision in the PicSOMsystem. For feature selection, we used the ”greedy” se-quential forward selection algorithm. The results showedthat a proper combination of the best-performing featuresperformed usually better than any of the individual fea-tures. This was especially true on the number of truly re-levant images retrieved with feature selection comparedto any feature alone.
Tab 1 shows the average precision values obtained withthe best features for a given target class, and consid-ering several testing schemes. Under each target classrow is indicated the number of imagelets containing thatclass in the reference images and the percentage of to-tal imagelets. The columns ”same”, ”diff”, and ”cross”refer to cases where the test set is either the other halfof the same image, the same half of the other image, orthe other half of the other image, respectively, than thetraining set. These are repeated four times, i.e. for thedifferent permutations of the training set, and then avera-ged. The mean average precision over these three casesis shown in column ”mean avg. precision”. When loo-king at the columns ”same”, ”diff”, and ”cross”, resultssuggest that for a given feature vector, all testing schemesreturned similar results, underlining the robustness of themethod. For each target class in Tab 1, the feature vectorproviding the best mean average precision and the high-est number of relevant imagelets for 10 or 100 retrievedimagelets are shown in bold. It is clear that feature selec-tion tends to improve the results, for all classes but waterin our experiments.
4.3. PicSOM for unsupervised change detection
In the last experiment, we replicated for polarimetricSAR images our earlier studies on optical images in usingSOMs for unsupervised change detection [10]. 50, 100,150 and 300 most relevant imagelets regarding to changeswere considered and the results were visually comparedto the reference change images.
Compared to the clearcut ground truth, theBACKSCATTER plain feature produced the bestresult. The stands that have been cut between March andMay 2007 around Kuortane represented tiny areas thatwere challenging to detect with the imagelet method.A significant part of the 50 most relevant imagelets forthe BACKSCATTER feature matched some locationsof actual clearcuts. It was understandable as the HVbackscattering coefficient is strongly linked to biomassindex even at L-band. However not all the clearcuts wereretrieved, as the imagelet-based approach only retrievewide changes.
Histograms of LOGRATIOS and POLRATIOS were thebest features to retrieve changes over water bodies,

Table 1. Average precision of the best features versus reference classification images, within several training schemes.The columns ”rel@10” and ”rel@100” refer to the numbers of relevant imagelets found on average among the 10 and100 first retrieved imagelets given a feature vector.
class type mean avg. precision same diff cross rel@10 rel@100 featurefield global avg 0,758 0,771 0,754 0,751 9,25 86,25 BACKSCATTER21% 4-zone avg 0,730 0,733 0,735 0,722 8,08 83,50 BACKSCATTER928 histogram 0,864 0,878 0,849 0,866 9,83 95,42 BACKSCATTER
feature sel. 0,864 0,878 0,851 0,861 9,83 97,83forest global avg 0,987 0,986 0,987 0,987 10,00 99,67 POLRATIOS82% 4-zone avg 0,985 0,987 0,983 0,985 9,92 99,17 H-A-α3769 histogram 0,993 0,995 0,992 0,991 10,00 99,83 TOUZI
feature sel. 0,995 0,996 0,994 0,994 10,00 100,00marsh global avg 0,461 0,443 0,465 0,475 6,00 43,50 TOUZI0,8% 4-zone avg 0,432 0,424 0,439 0,433 6,83 41,58 TOUZI108 histogram 0,569 0,563 0,579 0,567 7,75 54,67 TOUZI
feature sel. 0,633 0,713 0,590 0,594 8,25 55,50urban global avg 0,336 0,317 0,357 0,333 4,42 12,50 H-A-α0,3% 4-zone avg 0,389 0,382 0,401 0,385 4,58 12,75 H-A-α19 histogram 0,291 0,301 0,324 0,241 3,83 10,83 H-A-α
feature sel. 0,428 0,402 0,468 0,412 4,92 15,33water global avg 0,877 0,946 0,844 0,841 10,00 64,25 BACKSCATTER2% 4-zone avg 0,881 0,902 0,865 0,875 10,00 67,08 BACKSCATTER77 histogram 0,527 0,746 0,471 0,363 7,25 42,92 BACKSCATTER
feature sel. 0,754 0,938 0,656 0,669 9,00 57,92overall global avg 0,684 0,693 0,681 0,677 7,93 61,23
4-zone avg 0,683 0,685 0,685 0,680 7,88 60,82histogram 0,649 0,696 0,643 0,606 7,73 60,73feature sel. 0,735 0,785 0,712 0,706 8,40 65,32
mainly corresponding to ice melting between March andMay. Those features are ratio of backscattering coef-ficients combinations, which change when ice melts -copolarisation and depolarisation ratios have been usedin [22, 23] for sea ice classification.
Fig. 3 shows the reference change image obtained withAutoChange, that was used to visually assess the rele-vance of imagelet selection. We are aware that using thesame data for building the reference change image andcarrying out change detection experiments is not ideal,but we did not have any other reference data that couldhave been used for that purpose in dates reasonably closeto the acquisition dates of the PALSAR images. It is alsoto be noticed that changes in water areas do not appear inthe AutoChange reference change image.
Fig. 4 shows the resulting selection of 300 most relevantimages for change detection using all 25x20 histogramfeatures. The changes in fields on top-left corner and bot-tom of the image were well retrieved, as well as changesin main water bodies (melting ice, not appearing in thereference change image).
The results of these experiments verified that our changedetection technique is also applicable to SAR data eventhough the higher noise level of SAR data has some ne-gative effect on its accuracy. Imagelet-based structure
detection does not provide direct delineation of objectsof interest (contrary to pixel-based methods), but it canhighlight in a full scene locations with potentially inte-resting structures or contents.
SOMs that have been trained using previous images canbe used in the analysis of new imagery. This approachmay be applied in supervised monitoring of strategicsites, i.e. novelty or change detection with two or moreimages. Such a system could point out locations in thefull image where there may be potentially interestingstructures, present, appearing or disappearing, and thatmatch features defined visually by the user. One of themany advantages of PicSOM for polarimetric SAR dataanalysis is its ability to integrate various features, and per-form a selection of relevant ones based on user queries.The same framework allows for classification, structuredetection, and change detection - in both supervised orunsupervised ways.
5. CONCLUSIONS
We have presented how a content-based image retrievalsystem, PicSOM, can be used with polarimetric SARimages for tasks like target class retrieval, as well aschange detection. The approach relies on the decompo-
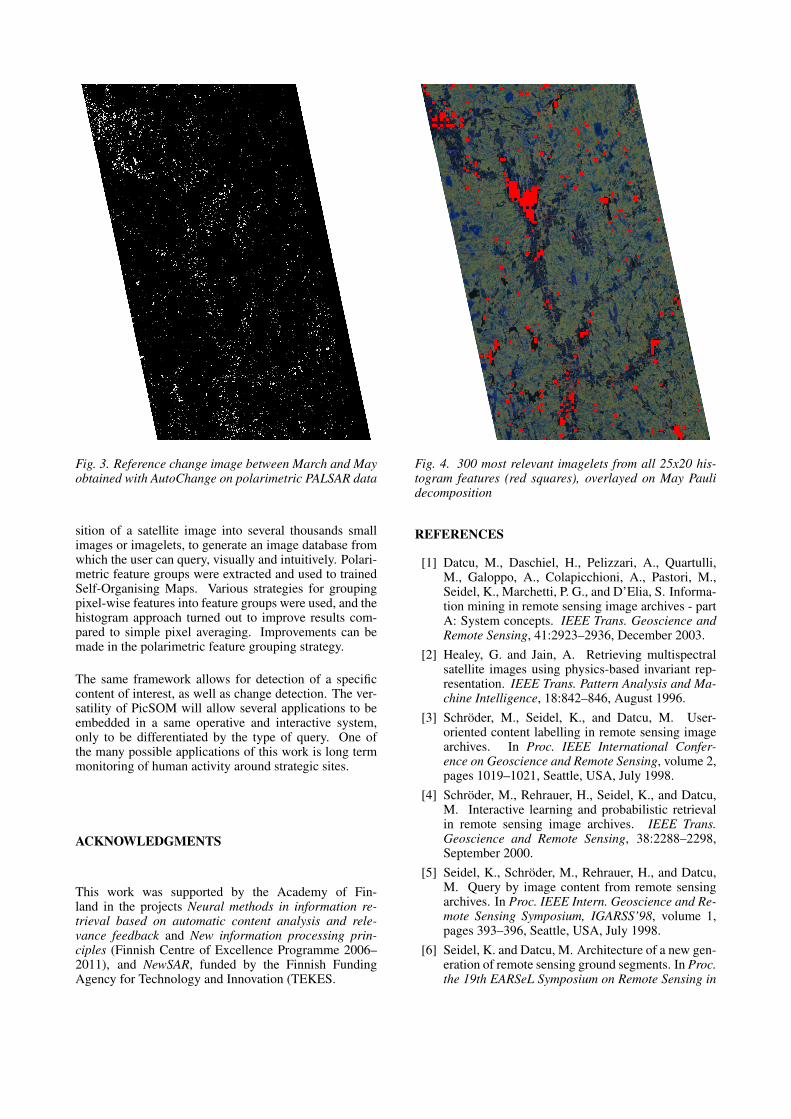
Fig. 3. Reference change image between March and Mayobtained with AutoChange on polarimetric PALSAR data
sition of a satellite image into several thousands smallimages or imagelets, to generate an image database fromwhich the user can query, visually and intuitively. Polari-metric feature groups were extracted and used to trainedSelf-Organising Maps. Various strategies for groupingpixel-wise features into feature groups were used, and thehistogram approach turned out to improve results com-pared to simple pixel averaging. Improvements can bemade in the polarimetric feature grouping strategy.
The same framework allows for detection of a specificcontent of interest, as well as change detection. The ver-satility of PicSOM will allow several applications to beembedded in a same operative and interactive system,only to be differentiated by the type of query. One ofthe many possible applications of this work is long termmonitoring of human activity around strategic sites.
ACKNOWLEDGMENTS
This work was supported by the Academy of Fin-land in the projects Neural methods in information re-trieval based on automatic content analysis and rele-vance feedback and New information processing prin-ciples (Finnish Centre of Excellence Programme 2006–2011), and NewSAR, funded by the Finnish FundingAgency for Technology and Innovation (TEKES.
Fig. 4. 300 most relevant imagelets from all 25x20 his-togram features (red squares), overlayed on May Paulidecomposition
REFERENCES
[1] Datcu, M., Daschiel, H., Pelizzari, A., Quartulli,M., Galoppo, A., Colapicchioni, A., Pastori, M.,Seidel, K., Marchetti, P. G., and D’Elia, S. Informa-tion mining in remote sensing image archives - partA: System concepts. IEEE Trans. Geoscience andRemote Sensing, 41:2923–2936, December 2003.
[2] Healey, G. and Jain, A. Retrieving multispectralsatellite images using physics-based invariant rep-resentation. IEEE Trans. Pattern Analysis and Ma-chine Intelligence, 18:842–846, August 1996.
[3] Schroder, M., Seidel, K., and Datcu, M. User-oriented content labelling in remote sensing imagearchives. In Proc. IEEE International Confer-ence on Geoscience and Remote Sensing, volume 2,pages 1019–1021, Seattle, USA, July 1998.
[4] Schroder, M., Rehrauer, H., Seidel, K., and Datcu,M. Interactive learning and probabilistic retrievalin remote sensing image archives. IEEE Trans.Geoscience and Remote Sensing, 38:2288–2298,September 2000.
[5] Seidel, K., Schroder, M., Rehrauer, H., and Datcu,M. Query by image content from remote sensingarchives. In Proc. IEEE Intern. Geoscience and Re-mote Sensing Symposium, IGARSS’98, volume 1,pages 393–396, Seattle, USA, July 1998.
[6] Seidel, K. and Datcu, M. Architecture of a new gen-eration of remote sensing ground segments. In Proc.the 19th EARSeL Symposium on Remote Sensing in

the 21st Century, pages 223–228, Valladolid, Spain,June 1999.
[7] Schroder, M. and Dimai, A. Texture information inremote sensing images: A case study. In Workshopon Texture Analysis, WTA’98, Freiburg, Germany,1998.
[8] Schroder, M. Interactive learning in remote sensingimage databases. In Proc. IEEE Intern. Geoscienceand Remote Sensing Symposium IGARSS’99, 1999.
[9] Ferecatu, M., Boujemaa, N., and Crucianu, M. Ac-tive relevance feedback for interactive satellite ima-ges retrieval. In Proc. ESA-EUSC Workshop onImage Information Mining - Theory and Applica-tion to Earth Observation, Frascati, Italy, October2005. ESA WPP-257 (Nov. 2005).
[10] Molinier, M., Laaksonen, J., and Hame, T. De-tecting man-made structures and changes in satelliteimagery with a content-based information retrievalsystem built on self-organizing maps. IEEE Trans.Geoscience and Remote Sensing, 45:861–874, April2007.
[11] PicSOM Development Group. PicSOM onlinedemonstration. http://www.cis.hut.fi/picsom, 1998–2008.
[12] Kohonen, T. Self-Organizing Maps, volume 30 ofSpringer Series in Information Sciences. Springer-Verlag, third edition, 2001.
[13] Laaksonen, J., Koskela, M., Laakso, S., and Oja,E. Self-organizing maps as a relevance feed-back technique in content-based image retrieval.Pattern Analysis & Applications, 4(2+3):140–152,June 2001.
[14] Laaksonen, J., Koskela, M., and Oja, E. PicSOM—Self-organizing image retrieval with MPEG-7 con-tent descriptions. IEEE Transactions on Neural Net-works, Special Issue on Intelligent Multimedia Pro-cessing, 13(4):841–853, July 2002.
[15] Molinier, M., Laaksonen, J., Ahola, J., and Hame,T. Self-organizing map application for retrieval ofman-made structures in remote sensing data. InProc. ESA-EUSC Workshop on Image InformationMining - Theory and Application to Earth Observa-tion, Frascati, Italy, October 2005. ESA WPP-257(Nov. 2005).
[16] Lee, J.-S., Grunes, M. R., and De Grandi, G. Po-larimetric sar speckle filtering and its implicationfor classification. IEEE Transactions on Geoscienceand Remote Sensing, 37(5):2363–2373, September1999.
[17] Lonnqvist, A., Rauste, Y., Ahola, H., Molinier, M.,and Hame, T. Evaluation of classification meth-ods with polarimetric alos/palsar data. In Forestsand Remote Sensing: Methods and OperationalTools (Forestsat 2007), Montpellier, France, 5-7Nov. 2007.
[18] Molinier, M., Laaksonen, J., Rauste, Y., and Hame,T. Detecting changes in polarimetric sar data with
content-based image retrieval. In IEEE Interna-tional Geoscience and Remote Sensing SymposiumIGARSS’07, Barcelona, Spain, pages 2390–2393,23-28 July 2007.
[19] Pottier, E., Ferro-Famil, L., Allain, S., Cloude,S., Hajnsek, I., Papathanassiou, K., Moreira, A.,Williams, M., Pearson, T., and Desnos, Y.-L. Anoverview of the PolSARpro v2.0 software. the edu-cational toolbox for polarimetric and interferomet-ric polarimetric SAR data processing. In POLin-SAR07 ESA Workshop, January 2007.
[20] Hame, T., Heiler, I., and San Miguel-Ayanz, J. Anunsupervised change detection and recognition sys-tem for forestry. International Journal of RemoteSensing, 19(6):1079–1099, April 1998.
[21] Laaksonen, J., Koskela, M., and Oja, E. Class distri-butions on SOM surfaces for feature extraction andobject retrieval. Neural Networks, 17(8-9):1121–1133, October-November 2004.
[22] Dierking, W., Skriver, H., and Gudmandsen, P. SARpolarimetry for sea ice classification. In Workshopon POLinSAR - Applications of SAR Polarimetryand Polarimetric Interferometry (ESA SP-529), Jan-uary 2003.
[23] Skriver, H., Dierking, W., Gudmandsen, P., Toan,T. L., Moreira, A., Papathanassiou, K., and Que-gan, S. Applications of synthetic aperture radar po-larimetry. In Workshop on POLinSAR - Applica-tions of SAR Polarimetry and Polarimetric Interfer-ometry (ESA SP-529), January 2003.
[24] Quegan, S., Le Toan, T., Skriver, H., Gomez-Dans,J., Gonzalez-Sampedro, M. C., and Hoekman, D. H.Crop classification with multitemporal polarimetricSAR data. In Workshop on POLinSAR - Applica-tions of SAR Polarimetry and Polarimetric Interfer-ometry (ESA SP-529), January 2003.
[25] Buckley, J. R. Environmental change detection inprairie landscapes with simulated RADARSAT 2imagery. In IEEE International Geoscience and Re-mote Sensing Symposium IGARSS’02, pages 3255–3257, 2002.
[26] Cloude, S. and Pottier, E. An entropy based classifi-cation scheme for land applications of polarimetricSAR. IEEE Transactions on Geoscience and Re-mote Sensing, 35(1):68–78, January 1997.
[27] Touzi, R., Goze, S., Toan, T. L., Lopes, A., andMougin, E. Polarimetric discriminators for SARimages. IEEE Transactions on Geoscience and Re-mote Sensing, 30(5):973–980, September 1992.