improving an immunoassay response to related polychlorinated biphenyl analytes by mixing antibodies
TRANSCRIPT

Improving an Immunoassay Response toRelated Polychlorinated Biphenyl Analytesby Mixing Antibodies
Thomas R. Glass,*,† Naoya Ohmura,*,‡ Keiichi Morita,§ Kazuhiro Sasaki,‡ Hiroshi Saiki,§,|
Yoko Takagi,⊥ Chiwa Kataoka,⊥ and Akikazu Ando#
Sapidyne Instruments Inc., 967 East ParkCenter Boulevard #445, Boise, Idaho 83706, Department of Bioscience,Central Research Institute of Electric Power Industry, 1646 Abiko, Abiko City, Chiba, Japan 270-1194, School of Bionics,Tokyo University of Technology, 1404-1 Katakura, Hachiouji, Tokyo, Japan, 192-0982, Research Center of Bionics,National Institute of Advanced Industrial, Science and Technology, 1404-1 Katakura, Hachiouji, Tokyo, Japan, 192-0982,Biotechnology Research Laboratory, Research & Development Division, Kyoto Electronics Manufacturing Co., Ltd.,68 Ninodan-cho, Shinden, Kisshouin Minami-ku, Kyoto, Japan 601-8317, and Graduate School of Science and Technology,Laboratory of Molecular Cell Biology, Chiba University, Matsudo 648 Matsudo, Chiba Japan 271-8510
Immunoassays for detection of a class of closely relatedantigens, e.g., PCBs, have often been too specific (re-sponding strongly to some members of the class andmissing others) and no general method for adjusting theresponse has been described. In this paper, the differencein the response of a model immunoassay to differentKanechlors (Japanese commercial mixtures of PCBs,analogous to Aroclors in the United States) is reducedfrom 20- or 50-fold (depending on which antibody isused) to 3-fold when the antibodies are mixed at theproper ratio. A mathematical model based on competitivebinding of two antibodies for up to four antigens has beendeveloped and used to describe the assay performanceand to predict optimum mix ratios for the antibodies used.The model (based on separate measurement of eachantibody’s effective Kd for each Kanechlor) provides anexcellent fit to the measured mixed antibody assay re-sponse. The model is also successful in identifying caseswhere mixing monoclonal antibodies will not improve theresponse. It is thought the method described will haveapplicability in a variety of cases where the analytical goalis semiquantitative screening based on the total quantityof an unknown mixture of related compounds.
One of the great beauties of an immunoassay is its exquisitespecificity. The ability of an antibody to recognize a specificmolecule present in a complex mixture was noted by Yalow andBerson in their pioneering immunoassay1 and has been wellknown and widely celebrated by immunoassay practitioners eversince. At the same time, it is also recognized that antibodies are
not absolutely specific and do exhibit cross reactivity to othermolecules. Cross reactivity profiles, i.e., the extent to which animmunoassay developed for one analyte will respond to someother molecule, are commonly measured and published as partof the description of the assay.2-4 In most cases, cross reactivityis regarded as undesirable and minimizing it is a common goal.However, in the case of environmental immunoassay there areseveral cases where the specificity of immunoassay is a hurdle toits adoption. In the case of polychlorinated biphenyls (PCBs)environmental regulations specify total weight of PCBs, resultingin a situation where the ideal assay response is total PCBirrespective of the mix of individual congeners that are presentin a particular sample. Similar situations exist for other analytessuch as dioxins, estrogen-like compounds, and â-lactam antibiotics.In each case, a test is required that can detect any of a class ofcompounds. In some cases, alternative tests based on cellularreceptors specific to a class of compounds such as â-lactamantibiotics5,6 or estrogen-like compounds7 have been developedto work around the overly specific response of antibodies. In bothof these cases, the assay response is not the same for the entirefamily of compounds, but use of a receptor is intended to providea response similar to biologic efficacy. No appropriate receptorhas been identified for PCBs, and even if one were identified, itseems unlikely it would respond equally to all PCBs, as neededto meet legal targets.
Another approach to the problem has been the developmentof “generic” antibodies with relatively broad cross reactivity totargeted compounds.8-10 This approach can involve screening of
* To whom correspondence should be addressed. Tel: +81-471-82-8211.Fax: +81-471-83-3347. E-mail; [email protected].
† Sapidyne Instruments Inc.‡ Central Research Institute of Electric Power Industry.§ Tokyo University of Technology.| National Institute of Advanced Industrial, Science and Technology.⊥ Kyoto Electronics Manufacturing Co., Ltd.# Chiba University.
(1) Yalow, R. S.; Berson, S. A. J. Clin. Invest. 1960, 39, 1157-1175.
(2) Chin, T. E.; Wong, R. B.; Pont, J. L.; Karu, A. J. Agric. Food Chem. 2002,50, 3380-3398.
(3) Darwish, I. A.; Blake, D. A. Anal. Chem. 2001, 73, 1889-1895.(4) Chiu, Y. W.; Carlson, R. E.; Marcus, K. L.; Karu, A. E. Anal. Chem. 1995,
67, 3829-3839.(5) Gustavsson, E.; Sternesjo, A. J. AOAC Int. 2004, 87, 614-620.(6) Anderson, K. L.; Lyman, R. L.; Moats, W. A.; Hansen, A. P.; Rushing, J. E.
J. AOAC Int. 2002, 85, 546-550.(7) Korner, W.; Hanf, V.; Schuller, W.; Kempter, C.; Metzger, J.; Hagenmaier,
H. Sci. Total Environ. 1999, 225, 33-48.(8) Kolar, V.; Deng, A.; Franek, M. Food Agric. Immunol. 2002, 14, 91-105.
Anal. Chem. 2006, 78, 7240-7247
7240 Analytical Chemistry, Vol. 78, No. 20, October 15, 2006 10.1021/ac0605187 CCC: $33.50 © 2006 American Chemical SocietyPublished on Web 09/14/2006

antibodies produced against one member of the family of targetcompounds10 or production of specially designed analogues (oftenbased on a fragment of one of the target compounds) intended topresent key features present in multiple members of the class.8,9
In this paper, we describe an immunoassay for PCBs in whichwe broaden the assay reactivity by including two antibodies withcomplementary cross reactivities. We also describe in detail themodels we developed and employed to predict assay responsecurves for mixed antibodies and to predict optimum antibody mixratios. We are aware of other work describing use of mixedantibodies to increase the working range of an immunoassay11,12
but believe this is the first description of controlled mixing ofantibodies to create a generic immunoassay able to respond to aclass of analytes.
MATERIALS AND METHODSSafety Considerations. At least some PCB congeners (notably
the “dioxin-like” coplanar congeners) present a significant healththreat, and prudence dictates treating all PCBs as dangerous. Allpersonnel handling PCB-containing samples were provided withnitrile gloves and all PCB-contaminated glassware and solutions(including wash buffers) were collected and turned over to a(Japanese) government approved contractor for disposal. Con-centrated stocks of PCBs were kept in a locked box to limit accessto trained personnel.
Antibodies and Chemicals. Monoclonal anti-PCB (CatalogNo. RDI-PCBabm-35) was purchased from Research DiagnosticsInc. (Flanders, NJ). Monoclonal anti-PCB clone PCB-K2A-1 wasgraciously supplied by Kyoto Electric Manufacturing (KyotoJapan), and clone Sk3A11 was graciously supplied by KazuhiroSasaki of CRIEPI (Abiko, Japan). A detailed description of cloneSk3A11 can be found in Japanese Patent Application 2005-357433.A patent application for clone PCB-K2A-1 is currently beingprepared. Commercial mixtures of PCBs (Kanechlor or KC 300,400, 500, and 600 with numbers 1021-19103, 1021-19104, 1021-19105, and 1021-19106, respectively) came from GL Sciences(Tokyo, Japan). Dimethyl sulfoxide (DMSO; Catalog No. 346-03615) came from Dojindo (Kumamoto Japan). Bovine serumalbumin (BSA; Catalog No. A-9647) came from Sigma Aldrich (St.Louis, MO) Cy-5 labeled F(ab′)2 fragment goat anti-mouse IgG(H&L) was purchased from Jackson ImmunoResearch (WestGrove PA). Phosphate-buffered saline (PBS; consisting of 137 mMNaCl, 3 mM KCl, 20 mM Na2HPO4, 1.5 mM KH2PO4, pH 7.4)was produced in-house. PBSB consisted of PBS supplementedwith 1 g/L BSA. PBSBD consisted of PBSB supplemented with2% (v/v) DMSO.
Antigen Immobilization. One to five milliliters of NHS-activated Sepharose for fast flow (Amersham Biosciences, 17-0906-01) was placed in a column, and the 2-propanol it was supplied inwas allowed to drain. The particles were then suspended in 10-30 mL of cold 0.1 mM HCl and allowed to drain. This processwas repeated a minimum of three times with 0.1 mM HCl andthen repeated a minimum of three times with cold PBS. After the
final PBS wash, the particles were distributed into microcentrifugetubes (∼0.5 mL of Sepharose gel/tube) and 200 µg of the coat-ing protein (designated S-3, a chlorophenol derivative describedpreviously13) was added. The particles were rotated to maintainthem in suspension (Labquake Shaker, Lab Industries Inc.,Berkeley, CA) for 2 h at room temperature, after which 30 µL ofconcentrated ethanolamine was added to each tube to cap anyremaining NHS esters and reduce nonspecific binding. Particleswere rotated for a minimum of 1 h before use and were keptrefrigerated for up to several weeks.
Immunoassay System. Immunoassays were performed on aKinExA 3000 instrument supplied by Sapidyne Instruments Inc.(Boise, ID). The theory and operation of this instrument have beendescribed previously by us11,14,15 and others.16-18 Briefly, antigen-coupled solid phase (described above) is captured in a small flowcell held at the focus of a fluorometer. Samples, PCB mixtures inthe present case, are mixed with a PCB-specific antibody andflowed through the solid phase. Anti-PCB antibody that binds PCBin the sample solution cannot bind to the antigen on the solidphase and passes through the flow cell. A small fraction of theantibody that is not bound in solution is captured on the solidphase. The captured detection antibody is fluorescently labeledusing a fluorescently labeled antispecies antibody, and bindingsignals are measured as fluorescent accumulation on the solidphase. A zero PCB sample gives the highest response, and veryhigh concentrations of PCB cause total inhibition of the specificbinding signal.
Affinity Measurement. The binding affinity (or its inverse,the Kd) was measured on the KinExA 3000 following the proce-dures described elsewhere.16,18,19 Briefly, equilibrated antibody/antigen solutions of known antigen concentration are measuredas described above. The unoccupied fraction of antibody atequilibrium is fit with a theory15 having fit parameters of the Kd,the active antibody concentration, the uninhibited signal level, andthe NSB.
Sample Timing. Except where noted otherwise below, allKinExA experiments were initiated with a flow of 30 s of PBSBfollowed by a flow of primary antibody (one or more clones) mixedwith specified PCBs in PBSBD for 180 s. This was followed by anadditional 30 s of PBSB and then a labeling step consisting of 2nM Cy-5 F(ab′)2 fragment goat anti-mouse IgG flowed for 180 s.The flow rate was 0.25 mL/min for all sample and label flows.Finally, a two-step wash was used consisting of an additional 30 sof PBSB at 0.25 mL/min followed by 90 s of PBSB at 1.5 mL/min. Signal levels were recorded as the difference between theend point (at the end of the final wash) and the baseline (at thebeginning of the initial PBSB).
(9) Franek, M.; Diblikova, I.; Cernoch, I.; Vass, M.; Hruska, K. Anal. Chem.2006, 78, 1559-1567.
(10) Wei, R. D.; Chu, F. S. Anal. Biochem. 1987, 160, 399-408.(11) Ohmura, N.; Tsukidate, Y.; Shinozaki, H.; Lackie, S. J.; Saiki, H. Anal. Chem.
2003, 75, 104-110.(12) Kramer, P. M.; Kremmer, E.; Forster, S.; Goodrow, M. H. J. Agric. Food
Chem. 2004, 52, 6394-6401.
(13) Ohmura, N.; Glass, T. R.; Sasaki, K.; Joh, T.; Taemi, Y.; Yokobori, N. BunsekiKagaku 2006, 55, 1-7.
(14) Glass, T. R.; Saiki, H.; Blake, D. A.; Blake, R. C., II.; Lackie, S. J.; Ohmura,N. Anal. Chem. 2004, 76, 767-772.
(15) Ohmura, N.; Lackie, S. J.; Saiki, H. Anal. Chem. 2001, 73, 3392-3399.(16) Darling, R. J.; Brault, P. A. Assay Drug Dev. Technol. 2004, 2, 647-657.(17) Blake, R. C., 2nd; Pavlov, A. R.; Blake, D. A. Anal. Biochem. 1999, 272,
123-134.(18) Blake, D. A.; Chakrabarti, P.; Khosraviani, M.; Hatcher, F. M.; Westhoff, C.
M.; Goebel, P.; Wylie, D. E.; Blake, R. C., 2nd. J. Biol. Chem. 1996, 271,27677-27685.
(19) Glass, T. R.; Ohmura, N.; Saiki, H.; Sawadaishi, K.; Kataoka, C.; Takagi, Y.;Ohiwa, T. Anal. Chim. Acta 2004, 517, 161-168.
Analytical Chemistry, Vol. 78, No. 20, October 15, 2006 7241

RESULTS AND DISCUSSIONModeling. Simple Competition, Analytic Solution. Overall,
our intent was to work with mixtures of antibodies and withmixtures of antigens. This leads to fairly complicated systems ofequations requiring numerical solutions; however, one of thesimpler cases (a mixture of two antibodies reacting with a singleantigen) can be represented analytically. Consider a system ofgeneralized reactants where A is the solution concentration of onebinding partner, B is the solution concentration of the otherpartner, Ap is the solution concentration of competing partner toA, AB is the concentration of the AB complex, ApB is theconcentration of the ApB complex, TA is total A, both in complexand in free form, TAp is total Ap, both in complex and in freeform, TB is total B, both in complex and in free form, K is theequilibrium affinity of the AB interaction ()1/Kd), and Kp is theequilibrium affinity of the ApB interaction.
From the definition of affinity, the fundamental equations tobe satisfied are
From conservation of mass
Solving eq 3 for A, eq 4 for Ap, and eq 5 for B and substitutingback into eqs 1 and 2 gives
Solving eq 7 for AB and substituting into eq 6 gives (after algebraicmanipulation and collection of terms)
where
Solutions to cubic equations of the form of eq 8 can be looked upin standard tables,20 yielding three roots. Examination of the rootsfor realistic values of the reactants shows that two roots are not
physical (e.g., negative concentrations) and that the followingequation is applicable cases where K is greater than Kp
Although eq 12 may appear formidably complicated, it can bedefined as a function of the primary physical variables (K, Kp,etc.) and readily handled computationally. In the case where Kpis greater than K, one of the other roots yields the physicalsolution; however, it may be procedurally simpler to define an ifstatement to swap the affected variables (K, Kp, TA, TAp) andthen use eq 12. Expressions for the other equilibrium concentra-tions (A, B, Ap, AB) can be readily found by substituting eq 12into algebraic rearrangements of eqs 1-5. The result is analyticsolutions for the case of two binding species competing for a singlebinding partner. A, Ap, and B are arbitrary so the solution canreadily be applied to the case of two antibodies competing for asingle antigen species or for two distinct antigens competing fora single antibody.
Equivalent Kd. In accordance with our overall goal of devel-oping an immunoassay for detecting PCBs in transformer oil inJapan, Kanechlor mixtures rather than individual congeners wereused in this work. As described previously,21 the PCBs added totransformer oil in Japan were Kanechlor mixtures. The goal ofour effort is to mix complementary antibodies together to reducethe difference in response that a single antibody shows for thedifferent Kanechlor mixtures. We also wished to develop a theo-retical model to help us understand our results and guide ourexperiments. The obvious model to use is one based on the anti-body Kd; however, a Kd can only be defined for a single well-defined binding interaction. In the case of Kanechlor mixtures,the net response is that of 70 or more individual congeners22
competing for a single antibody.In principle, a model based on Kd’s for each individual congener
could be constructed, but the measurement of 144 Kd’s (the totalnumber of distinct congeners in all four Kanechlor mixtures) foreach antibody is daunting. We decided to explore an alternatemodel based on an equivalent Kd. We knew we would be usingthe antibodies at the lowest possible concentration, as this leadsto the best sensitivity,15 so as a starting point we made the sim-plifying assumption that the antibody concentration would bebelow the Kd for all PCBs present in the sample. In this case, the
(20) Spiegel, M. R. Mathematical Handbook of Formulas and Tables; McGraw-Hill Book Co.: New York, 1968.
(21) Glass, T. R.; Ohmura, N.; Taemi, Y.; Joh, T. Environ. Sci. Technol. 2005,39, 5005-5009.
(22) Masuzaki, Y.; Matusmura, T.; Morita, M.; Ito, H. Japan Society forEnvironmental Chemistry, 12th Symposium on Environmental Chemistry2003; pp 686-687.
K[A][B] ) [AB] (1)
Kp[Ap][B] ) [ApB] (2)
[TA] ) [A] + [AB] (3)
[TAp] ) [Ap] + [ApB] (4)
[TB] ) [B] + [AB] + [ApB] (5)
K([TA] - [AB])([TB] - [AB] - [ApB]) ) [AB] (6)
Kp([TAp] - [ApB])([TB] - [AB] - [ApB]) ) [ApB] (7)
([ApB])3 + C1([ApB])2 + C2[ApB] + C3 ) 0 (8)
C1 ) {-(KKp[TB] - Kp - 2Kp2[TAp] - Kp2[TB] +KKp[TAp] + K - K[TA]Kp)}/{[Kp(K - Kp)]} (9)
C2 ) [TAp](-Kp[TAp] - 2Kp[TB] - 1 + K[TB] - K[TA])
(K - Kp)(10)
C3 ) Kp([TAp])2 [TB](K - Kp)
(11)
7242 Analytical Chemistry, Vol. 78, No. 20, October 15, 2006

complex formed is negligible in comparison to the total PCBconcentration and eqs 3 and 4 above reduce to
This assumption results in the following simple expression forthe fraction of B (the antibody) free at equilibrium
Note that in the simpler case of a single antigen (TAp equals zero)
The goal is to reach an equivalent Kd that can be used with thesum of the antigens to give results equivalent to eq 15. If TAeqis equal to the sum of the individual antigens then the variablesx1 and x2 can be defined as
Equation 15 can be rewritten as
Comparing eq 19 to eq 16, it is clear that they will have the sameform if
This result can be generalized to an arbitrary number of antigensgiving
where i is the number of individual congeners, xi is the relativeabundance (as a fraction of the total) of the ith congener, and Kdi
is the Kd of the ith congener. Mathematical modeling also showsthat if the antibody concentration is significantly above the Kd ofeven a minor (1%) constituent, the resulting response curve istoo steep to be adequately fit by a Kd controlled curve of the form
given by eq 15 (results not shown). Since it is always necessaryto work with antibody concentrations near or below the Kd toachieve maximum sensitivity15 and since we could be reasonablyconfident from the shape of the curves that we were below theKd of all congeners present in significant quantity, we felt optimisticthat a model built around the equivalent Kd described above wouldbe adequate for the present purposes.
Complex Competition, Numeric Solution. Equation 12 isadequate for modeling the case of a mix of two antibodies reactingwith a single Kanechlor mixture (in the case that both antibodiesare used at concentrations below the Kd of the individualcongeners), but is not suitable for the more interesting case ofthe two antibodies reacting with a mixture of the variousKanechlors. To model this more general case. a numerical solutionwas implemented. The basic equations that must be satisfied inthe general case are
which all arise from the definition of affinity for each of the eightpossible binding pairs. In addition, the following six equationsexpress conservation of mass
Rearranging eqs 30-35 and substituting into eqs 22-29 leads tothe following eight equations, which must all be satisfied simul-taneously at equilibrium.
[TA] ) [A] (13)
[TAp] ) [Ap] (14)
Bfrac )[B]
[TB]) 1
([TAp]Kpd
+[TA]Kd
+ 1)(15)
Bfrac ) 1
([TA]Kd
+ 1)(16)
x1 )[TAp]
[TAeq](17)
x2 )[TA]
[TAeq](18)
Bfrac ) 1
[[TAeq] ( x1
Kpd+
x2
Kd) + 1]
(19)
Kdeq ) 1
( x1
Kpd+
x2
Kd)
(20)
Kdeq )1
∑i
xi
Kdi
(21)
K1[A1][B] ) [A1B] (22)
K2[A2][B] ) [A2B] (23)
K3[A3][B] ) [A3B] (24)
K4[A4][B] ) [A4B] (25)
K5[A1][B2] ) [A1B2] (26)
K6[A2][B2] ) [A2B2] (27)
K7[A3][B2] ) [A3B2] (28)
K8[A4][B2] ) [A4B2] (29)
[TA1] ) [A1] + [A1B] + [A1B2] (30)
[TA2] ) [A2] + [A2B] + [A2B2] (31)
[TA3] ) [A3] + [A3B] + [A3B2] (32)
[TA4] ) [A4] + [A4B] + [A4B2] (33)
[TB] ) [B] + [A1B] + [A2B] + [A3B] + [A4B] (34)
[TB2] ) [B2] + [A1B2] + [A2B2] + [A3B2] + [A4B2] (35)
K1([TA1] - [A1B] - [A1B2]) ×([TB] - [A4B] - [A1B] - [A2B] - [A3B]) ) [A1B] (36)
K2([TA2] - [A2B] - [A2B2]) ×([TB] - [A4B] - [A1B] - [A2B] - [A3B]) ) [A2B] (37)
K3([TA3] - [A3B] - [A3B2]) ×([TB] - [A4B] - [A1B] - [A2B] - [A3B]) ) [A3B] (38)
K4([TA4] - [A4B] - [A4B2]) ×([TB] - [A4B] - [A1B] - [A2B] - [A3B]) ) [A4B] (39)
Analytical Chemistry, Vol. 78, No. 20, October 15, 2006 7243

This system of eight equations was solved numerically, subjectto the additional constraint that all concentrations be greater thanor equal to zero.
Signal Level from Antibody Mixtures. The signal level onthe KinExA system is proportional to the concentration of freeantibody (not bound to antigen) present in solution; however,the constant of proportionality varies from antibody to antibody.There are at least two reasons for this; the first is that becausethe contact time is short, the antibody captured on the solid phaseis proportional to the on rate of the antibody-solid-phase reaction.Thus, antibodies with a faster on rate (for the solid-phase material)will give a larger signal. The second reason is variation in labelingefficiency. In the present case, labeling is accomplished with aCy-5-labeled anti-mouse antibody that is flowed through the flowcell after the primary antibody(s) has (have) been captured, andthe binding of the anti-mouse is expected to differ for each primarymouse antibody.
To calculate signal levels from mixtures of antibodies, it isnecessary to correctly account for the difference in signal levelfrom a given concentration of free antibody. As described below,the difference in response between the antibodies was measuredand used to calculate factors of difference. These factors wereused to scale the relative response from each antibody in equationsof the form
where F is measured ratio of signal response of Ab2 over Ab1.
EXPERIMENTAL SECTIONAntibody Response to Kanechlor Mixtures. We began by
measuring the response curves of each of three antibodies foreach of four Kanechlor mixtures. In every case, the primaryantibody concentration was 250 pM and Kanechlor concentrationswere varied across a range from fully saturating (signal levelnear zero) to zero Kanechlor. Figure 1 shows the results, whichare also summarized in Table 1. As shown in Table 1, clonePCB-K2A-1 (Figure 1A) shows the best overall response to thefour Kanechlor mixtures with the equivalent Kd varying from 0.5(KC 300) to 1.4 ppb (KC 600). The other two clones show muchlarger variations in response; however, they also exhibit comple-
mentary variations in that PCB35M is tightest for KC 600 (0.5ppb Kd) while Sk3A11 is tightest for KC 300 (0.6 ppb Kd). Thiscomplementarity lead to the idea that mixing these antibodiestogether could reduce the overall Kanechlor-dependent responsevariation.
The spread in Kd values defines a response window in thesense that if one of these clones were used to measure an un-known Kanechlor or mixture of Kanechlors, the response wouldalways fall somewhere within the region defined by the outermostof the four individual response curves.
Antibody Signal Response. To properly model the systemresponse to mixtures of two antibodies, it was necessary to firstmeasure the KinExA signal levels for each antibody. For theseexperiments, various concentrations of each antibody (see Figure2) were flowed over the solid phase in the absence of any PCBs.The results, Figure 2, show that, for equal concentrations ofprimary antibody, the signal is ∼2.3 times higher for the PCB35Mclone than for the Sk3A11 clone. A similar experiment with thePCB35M and PCB-K2A-1 clones showed a ratio of 2.0.
Antibody Mixtures. Clones PCB35M and Sk3A11. Work-ing first with the PCB35M and Sk3A11 clones, a mixture wasprepared with a concentration ratio of 1 part PCB35M to 2 partsSk3A11. The final total concentration was 500 pM. In molar terms,the tightest binding antibody used in this study is PCB35M, whoseKd of 0.49 ppb for KC600 (see Table 1) is equivalent to 1.3 nM(the weighted average MW of KC 600 is 381). The combinedantibody concentration was kept below this Kd to ensure theequivalent Kd calculation above is valid. Under this condition, wecan reasonably hope the models developed above (which are only
K5([TA1] - [A1B] - [A1B2]) ×([TB2] - [A4B2] - [A1B2] - [A2B2] - [A3B2]) )
[A1B2] (40)
K6([TA2] - [A2B] - [A2B2]) ×([TB2] - [A4B2] - [A1B2] - [A2B2] - [A3B2]) )
[A2B2] (41)
K7([TA3] - [A3B] - [A3B2]) ×([TB2] - [A4B2] - [A1B2] - [A2B2] - [A3B2]) )
[A3B2] (42)
K8([TA4] - [A4B] - [A4B2]) ×([TB2] - [A4B2] - [A1B2] - [A2B2] - [A3B2]) )
[A4B2] (43)
MixSig% )[freeAb1] + F[freeAb2][totalAb1] + F[totalAb2]
(44)
Figure 1. Response curves for each of three antibodies reactingwith each of the four Kanechlor mixtures. Panel A is clone PCB-K2A-1, panel B is clone PCB35M, and panel C is clone SK3A11. In allpanels, symbols 2, b, 1, and [ represent Kanechlor 300, 400, 500,and 600, respectively. Solid lines are calculated from the best fit Kd
for each data set. Kd values for the curves shown, approximately equalto the midpoint for the curves shown, are summarized in Table 1.
7244 Analytical Chemistry, Vol. 78, No. 20, October 15, 2006

strictly valid for two antibodies reacting with either a single well-defined antigen (exact model) or up to four well-defined antigens(numeric model)) will apply. Panels A-D in Figure 3 show theresponse of the mixed antibody to Kanechlor 300, 400, 500, and600, respectively. The theoretical lines shown in each panel arenot fit to the data points but instead are based on the exactcompetition model and use the Kd values derived from separatemeasurement of each Kanechlor with each antibody; see Figure1 and Table 1. Panel E of Figure 3 shows the mixed antibodies’response to a mixture of equal parts (by weight) of all fourKanechlors, along with a theory line derived from the numericmodel described above and using the same Kd values. Panel Freplots the data of panels A-E on a single graph. Notice in panelF that the responses to the four individual Kanechlors are con-siderably closer together than is the case for either the PCB35M(see Figure 1B) or SK3A11 (Figure 1C). The 50% inhibitionresponse range has been reduced from approximately 20- (PCB35Malone) or 50-fold (SK3A11 alone) to ∼2-fold in Figure 3-F.
When either antibody alone is exposed to a mixture ofKanechlors, the response to the mixture will fall somewhere withinthe envelope defined by the reaction to the individual Kanechlors.Our initial naı̈ve expectation was that the same thing would holdfor the mixture; however, this is not the case, as is shown by boththe measured data points and the theoretical line for the mixedKanechlors in Figure 3F. To understand this phenomenon,consider how the mixed antibodies respond to Kanechlor 300present at 10 ppb. At this concentration, the PCB35M clone isseeing approximately a Kd equivalent concentration and shouldbe ∼50% bound up while the SK3A11 clone is seeing a concentra-tion nearly 20 times above its Kd and so should be nearly all bound.The net response then should be in the range of 25% free. On theother hand, if we consider 10 ppb Kanechlor 600, then the
PCB35M clone should be nearly completely bound, while theSK3A11 clone is seeing a concentration somewhat below its Kd
and should be less than half bound, leading to a net responsesomewhat above 25%. However, if we mix 5ppb KC 300 and 5ppb KC 600, then both antibodies see concentrations well abovetheir individual Kds, and the net response is thus well below 25%.This effect, clearly visible in the mixed antibody response curveof Figure 3E and F, broadens the response range beyond the2-fold estimate of the previous paragraph. To explore the effectof this, the net response was simulated with various mixtures ofKanechlors, including mixtures at various ratios of two, three, orall four Kanechlors. Ratios considered included equal parts byweight as well as mixtures dominated by one Kanechlor but withminority contributions from one or more others. In all, 65combinations were simulated and the net window of response isshown in Figure 4A. For completely unknown mixtures of
Table 1. Estimated Equivalent Kd Values for Each of Three Antibodies to Four Kanechlor Mixturesa
antibody clone
PCB-K2A-1 PCB35M SK3A11kanechlormixture Kd Kd high Kd low Kd Kd high Kd low Kd Kd high Kd low
KC 300 0.51 0.71 0.36 10.22 12.62 7.97 0.60 0.72 0.41KC 400 0.57 0.70 0.45 3.55 4.31 2.71 1.56 1.83 1.04KC 500 0.56 0.72 0.42 1.44 1.75 0.88 9.60 12.80 4.78KC 600 1.44 1.92 0.96 0.49 1.16 0.00 29.91 37.58 17.63
a Kd high and Kd low are 95% confidence interval bounds. All values are in units of ppb total Kanechlor.
Figure 2. In the absence of PCB, signal response proportionalityto antibody concentration, with each antibody having a uniqueconstant of proportionality. The signal response of clone PCB35M(b) is 2.3 times higher than the signal response of SK3A11 (2).
Figure 3. Kanechlor response curves of a 2:1 mix of clones SK3A11and PCB35M (0.5 nM combined antibody concentration). Panels A-Dshow the response of the mixed antibodies to individual Kanechlors300-600, respectively. Panel E shows the response of a mix of equalparts of all four Kanechlors, and panel F replots all data on the asingle axis to show the response spread. See text for discussion.
Analytical Chemistry, Vol. 78, No. 20, October 15, 2006 7245

Kanechlors, we expect the mixed antibody response to fall withinthe window defined by the bold dashed lines in Figure 4A. Thedotted lines show the individual response curves that correspondto the limits. The upper limit of the response envelope is definedby the mixed antibody response to pure KC 500 (below ∼5 ppb)or by pure KC 600 (above 5 ppb). The lower limit of the responseenvelope is defined by a mixture of equal parts of KC 300 andKC 600. It makes intuitive sense that the upper limit will alwaysbe defined by the response to a pure Kanechlor since once theweakest Kanechlor at a given concentration is identified, substitu-tion of any other Kanechlor is necessarily stronger. In the presentcase, the lower limit is defined by a mix of equal parts of twoKanechlors, but this is specific to the antibodies used and changesfor other antibody combinations, as seen below.
The width of the response envelope shown in Figure 4A varieswith the mix ratio of the antibodies, starting from the width ofresponse of one antibody alone, passing through a minimum, andthen increasing to the width of the second antibody alone. Figure4B shows the calculated envelope width, expressed as the ratioof the maximum PCB needed for 50% inhibition over the minimumPCB giving 50% inhibition, as a function of the mix ratio of theantibodies. In Figure 4B, the x axis is the percentage of antibodySk3A11 present in the antibody mixture with the balance of themix being antibody PCB35M. When there is zero Sk3A11, e.g.,pure PCB35M, the response window for unknown mixtures ofKanechlors is defined by PCB35M’s response to Kanechlor 300(10.2 ppb gives 50% inhibition) and Kanechlor 600 (0.49 ppb gives50% inhibition). The goal of using mixed antibodies is to bringthese numbers closer together so a convenient figure of merit isthe ratio of the larger of these numbers divided by the smaller.
In the present case, the width of the response window, character-ized by this dimensionless ratio varies from ∼21 (10.2/0.49) with0 Sk3A11 to ∼50 (29.9/0.6) with 100% Sk3A11 and is predicted topass through a minimum of 2.95 at a mix ratio of 62% SK3A11and 38% PCB35M. The theoretical width at the 2:1 mix ratio usedexperimentally (66% SK3A11 and 33% PCB35) is 3.1. Either ofthese numbers is in general agreement with the measuredresponses shown in Figure 3 and show that even with thebroadening effect of mixed antigens there is still a substantialimprovement over using either antibody alone. In this case, theoptimum mix ratio (1.8) is close to the relative response ratio (2.3;see Figure 2), which is a reflection of the fact that Kanechlorresponses of these antibodies are nearly perfect inverses of eachother in terms of Kanechlor response.
Clones PCB35M and PCB-K2A-1. In terms of an envelopewidth as discussed above, clone PCB-K2A-1 already possesses anexcellent reactivity profile for the Kanechlors with an envelopewidth at 50% of 2.8. Even so, PCB-K2A-1’s profile (binding tightestto KC 300 and loosest to KC 600) is in the opposite direction fromclone PCB35M’s profile, suggesting that some improvement mightbe possible by mixing these antibodies together. Based on thesignal level experiments described above, initial experiments wereperformed using two times more PCB-K2A-1 than PCB35M. Theresults for individual pure Kanechlors are shown in Figure 5A.The theoretical lines shown are again based on equivalent Kd’smeasured separately for each antibody reacting with a pureKanechlor (see Figure 1). Again, the fit of the theory to the mixedantibody measurements is very reasonable. Figure 5B shows thepredicted width of the response envelope as a function ofpercentage of PCB-K2A-1 in the mixture. The 2:1 mix used in panelA corresponds to 66.66% PCB-K2A-1 in panel B. The predicted
Figure 4. Panel A, the estimated response envelope for a 2:1 mixof clones SK3A11 and PCB35M. The upper limit of the envelope,shown as a heavy dashed line, is defined by the response to individualKanechlors (KC 500 below ∼5 ppb and KC 600 above) while thelower limit, also a heavy dashed line, is defined by a mixture of equalparts of KC 300 and KC 600. Panel B shows the predicted responseenvelope width, expressed as the ratio of the worst case (maximum)concentration for 50% inhibition over the best case (minimum)concentration for 50% inhibition, as a function of the mix ratio of theantibodies; see text for further discussion.
Figure 5. Panel A, response curves of a 2:1 mix of clones PCB-K2A-1 and PCB35M (0.5 nM combined antibody concentration) withsymbols 2, b, 1, and [ representing Kanechlor 300, 400, 500, and600, respectively. Panel B shows the predicted response envelopewidth as a function of the antibody mix ratio. The optimum mix is82% PCB-K2A-1 and 18% PCB35M.
7246 Analytical Chemistry, Vol. 78, No. 20, October 15, 2006
response envelope width at 50% inhibition is 2.8, coincidentallythe same as the response envelope width for clone PCB-K2A-1alone, although the response profile shown in Figure 5A isreversed compared to PCB-K2A-1 alone (Figure 1A). Figure 5Bshows a predicted minimum response envelope width of 1.4 for amixture containing 82% PCB-K2A-1 and 18% PCB35M.
After completing the analysis, another experiment was per-formed with clones PCB35M and PCB-K2A-1 in hopes of dem-onstrating the narrower response window predicted by Figure 5B.The initial batch of clone PCB-K2A-1 had run out and a newbatch was obtained from hybridoma that gave smaller signals(relative to PCB35M) that the first batch. The new signal factormeasured (data not shown) was 4.0. With the new signal factor,the predicted optimum mix ratio shifted to 90% PCB-K2A-1 and10% PCB35M so the new experiments were conducted with 0.45nM PCB-K2A-1 mixed with 0.05 nM PCB35M. As shown in Figure6, the resultant data is fit reasonably well by the theoretical lines,though several points for Kanechlor 300 show less inhibitionthanexpected. The modest improvement in response envelopewidth we were hoping for is clear in the theoretical lines in Figures5 and 6, but somewhat ambiguous with regard to the measureddata points.
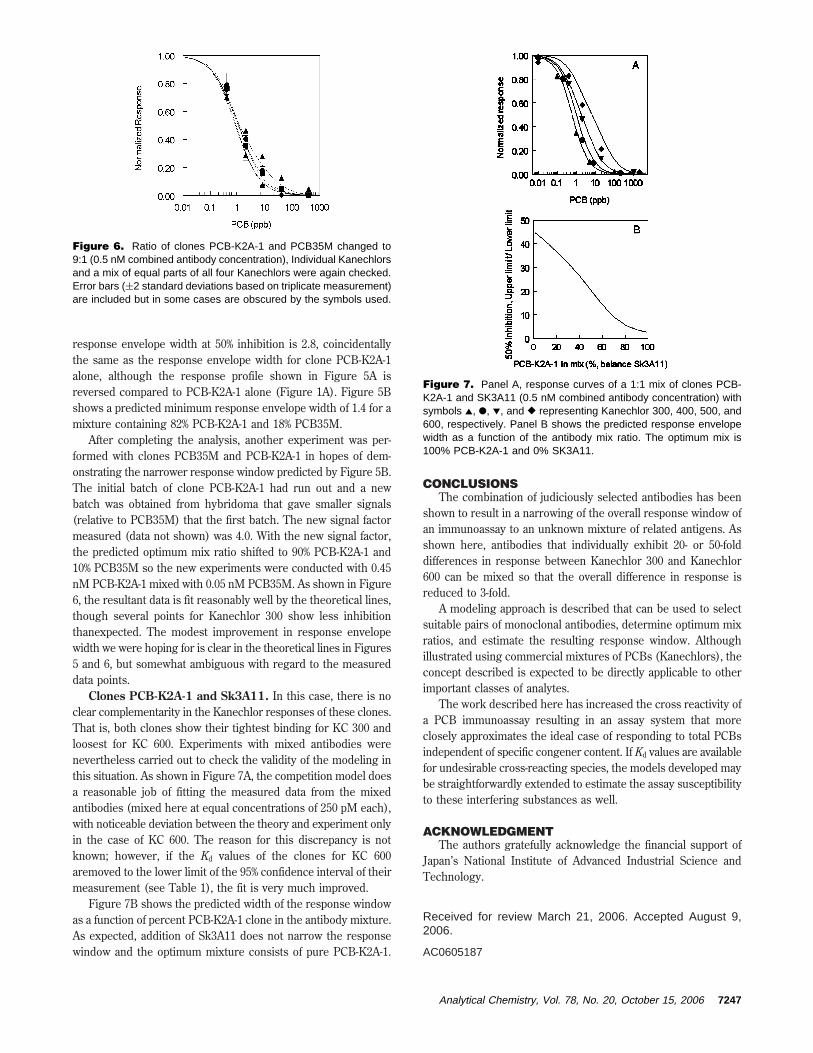
Clones PCB-K2A-1 and Sk3A11. In this case, there is noclear complementarity in the Kanechlor responses of these clones.That is, both clones show their tightest binding for KC 300 andloosest for KC 600. Experiments with mixed antibodies werenevertheless carried out to check the validity of the modeling inthis situation. As shown in Figure 7A, the competition model doesa reasonable job of fitting the measured data from the mixedantibodies (mixed here at equal concentrations of 250 pM each),with noticeable deviation between the theory and experiment onlyin the case of KC 600. The reason for this discrepancy is notknown; however, if the Kd values of the clones for KC 600aremoved to the lower limit of the 95% confidence interval of theirmeasurement (see Table 1), the fit is very much improved.
Figure 7B shows the predicted width of the response windowas a function of percent PCB-K2A-1 clone in the antibody mixture.As expected, addition of Sk3A11 does not narrow the responsewindow and the optimum mixture consists of pure PCB-K2A-1.
CONCLUSIONSThe combination of judiciously selected antibodies has been
shown to result in a narrowing of the overall response window ofan immunoassay to an unknown mixture of related antigens. Asshown here, antibodies that individually exhibit 20- or 50-folddifferences in response between Kanechlor 300 and Kanechlor600 can be mixed so that the overall difference in response isreduced to 3-fold.
A modeling approach is described that can be used to selectsuitable pairs of monoclonal antibodies, determine optimum mixratios, and estimate the resulting response window. Althoughillustrated using commercial mixtures of PCBs (Kanechlors), theconcept described is expected to be directly applicable to otherimportant classes of analytes.
The work described here has increased the cross reactivity ofa PCB immunoassay resulting in an assay system that moreclosely approximates the ideal case of responding to total PCBsindependent of specific congener content. If Kd values are availablefor undesirable cross-reacting species, the models developed maybe straightforwardly extended to estimate the assay susceptibilityto these interfering substances as well.
ACKNOWLEDGMENTThe authors gratefully acknowledge the financial support of
Japan’s National Institute of Advanced Industrial Science andTechnology.
Received for review March 21, 2006. Accepted August 9,2006.
AC0605187
Figure 6. Ratio of clones PCB-K2A-1 and PCB35M changed to9:1 (0.5 nM combined antibody concentration), Individual Kanechlorsand a mix of equal parts of all four Kanechlors were again checked.Error bars ((2 standard deviations based on triplicate measurement)are included but in some cases are obscured by the symbols used.
Figure 7. Panel A, response curves of a 1:1 mix of clones PCB-K2A-1 and SK3A11 (0.5 nM combined antibody concentration) withsymbols 2, b, 1, and [ representing Kanechlor 300, 400, 500, and600, respectively. Panel B shows the predicted response envelopewidth as a function of the antibody mix ratio. The optimum mix is100% PCB-K2A-1 and 0% SK3A11.
Analytical Chemistry, Vol. 78, No. 20, October 15, 2006 7247