improvements in sls part...
TRANSCRIPT

IMPROVEMENTS IN SLS PART ACCURACY
Christian NelsonKevin McAleaDamien Gray
DTM CorporationAustin, Texas 78754
ABSTRACT
SLS® part accuracy is influenced by a number of machine and material characteristics. Some ofthe most significant sources of error are associated with laser beam positioning (static anddynamic) on the part bed surface and uncertainty in the calibration factors used to compensatefor material shrinkage and growth as well as the finite width of the laser beam. Another source oferror is the minimum resolution of the process, which is a dependent on the particle size andshape of the material. In this presentation, technical background on these issues will be provided.In addition, part data obtained with a number of SLS materials demonstrating improved accuracyobtained through machine modifications and improved calibration methods will be described.
1. INTRODUCTION
Rapid prototyping part accuracy has been reported in a number of studies. In the case ofstere0 lithography, a large amount of accuracy data has been generated for a model geometry tocharacterize process and material technology improvements over time (1, 2). More recently, anumber of studies which compare the accuracy of different rapid prototyping technologies havebeen documented (3-6). In nearly all of these studies, accuracy has been reported as the deviationof measured dimensions from the desired dimensions. Other components of accuracy are alsoimportant to users of these technologies. In particular, trueness of features as characterized bythe sharpness of corners and edges and detail resolution is quite important. as is the ease of partfit and assembly. In this study, improvements in the accuracy of SLS parts as characterized byboth dimensional tolerances and trueness of features will be discussed. In addition, a discussionofcritical material and process issues which affect accuracy will be provided.
2. BACKGROUND
The SLS Process A schematic of the SLS process as commercialized by DTM is shown inFigure 1. The key components are a CO2 laser, laser optics and scanning mirrors, part buildcylinder, feed cartridges, heaters, and a roller mechanism. To fabricate a part, powder from oneof the feed cartridges is first spread in a thin, uniform layer over the part bed surface. A typicallayer thickness is 0.12 mm. The laser beam is rastered over the part bed surface with thescanning mirrors and the laser energy modulated so that only the area which corresponds to thecross section of the object is fused. The 2D cross sections are defined by software which "slices"the 3D CAD information into layers. A new layer of powder is then spread from the other feed
159

processed withconsolidation n ..... "·'...."H....
about 1%), but

considerable growth. Crystalline or semicrystalline materials exhibit high shrinkage (typically 34%) associated with both the material phase change and the high degree ofconsolidation obtainedduring processing, but the amount of growth is usually limited by the relatively low laser powerswhich are required to completely melt the material. While software is used to compensate for thedimensional changes associated with .material shrink and growth, the best accuracy is usuallyobtained when these compensations are small. For a given material, it is possible to moderateshrink and growth by adding a reinforcement or filler to the system (8, 9). It is also possible toachieve near zero shrinkage with multiphase coated particle morphologies (10, 8).
The primary effect of particle size and shape on part accuracy is on the trueness of features.Smaller particles with a high degree of sphericity produce parts with sharper edges and cornersand improved detail resolution. In addition, the layer thickness of parts can be reduced forsmaller particle sizes which reduces the "stair step" effect which is common to all layeredmanufacturing processes.
2.3 Accuracy - Process Effects The key process elements which affect part accuracy are thebeam delivery and thermal control systems. As previously described, the beam delivery systemuses scanning mirrors to position the laser beam on the part bed surface. There are errorsassociated with the inherent positional accuracy of the scanning system as well as dynamic errorsassociated with coordinating the laser "on" and "off' with the acceleration and deceleration of themirrors. This type of dynamic error causes scan vectors to be drawn with a non-uniform energydensity. In addition, the finite size of the laser beam causes material outside the part boundariesto be scanned. Part dimensions are adjusted for the finite diameter of the beam through asoftware compensation, just as they are for growth. From a practical standpoint, the effects ofgrowth and finite beam diameter on part accuracy are indistinguishable since they both cause aconstant increase in part dimensions.
Adequate thermal control is necessary to prevent accuracy problems associated with partwarpage or "curl". Warpage can occur at the part bed surface or "in-build", or as the part iscooled from the build temperature to room temperature or "post-build". In-build curl is causedby thermal stresses and layerwise shrinkage stresses. These stresses can be minimized bymaintaining the part bed at a temperature near the melting/softening temperature of the material.At this temperature, thermal gradients between the part and surrounding powder are minimizedwhile for viscoelastic materials such as polymers, stress relaxation is activated. Post-build curl iscaused by stresses which develop as the result of non-uniform part cooling. This mechanism isparticularly important for high temperature materials. The control of post-build curl throughcooling rate control has been previously described (7, 11). An additional thermal accuracy issuecan result from point-to-point temperature differences in a consolidated part. Temperaturevariability is caused by non-uniform power densities experienced by different cross-sections asthe laser is scanned across a part geometry. This thermal variability can cause non-uniformshrinkage and growth. Temperature feedback control techniques for eliminating these effectshave been discussed (12).
The current work is focused on three of the accuracy elements described above: scanningdynamics, scale/offset calibration and compensation software, and particle size and shapecontrol. Improvements in these areas are described.
161
3. IMPROVEMENTS
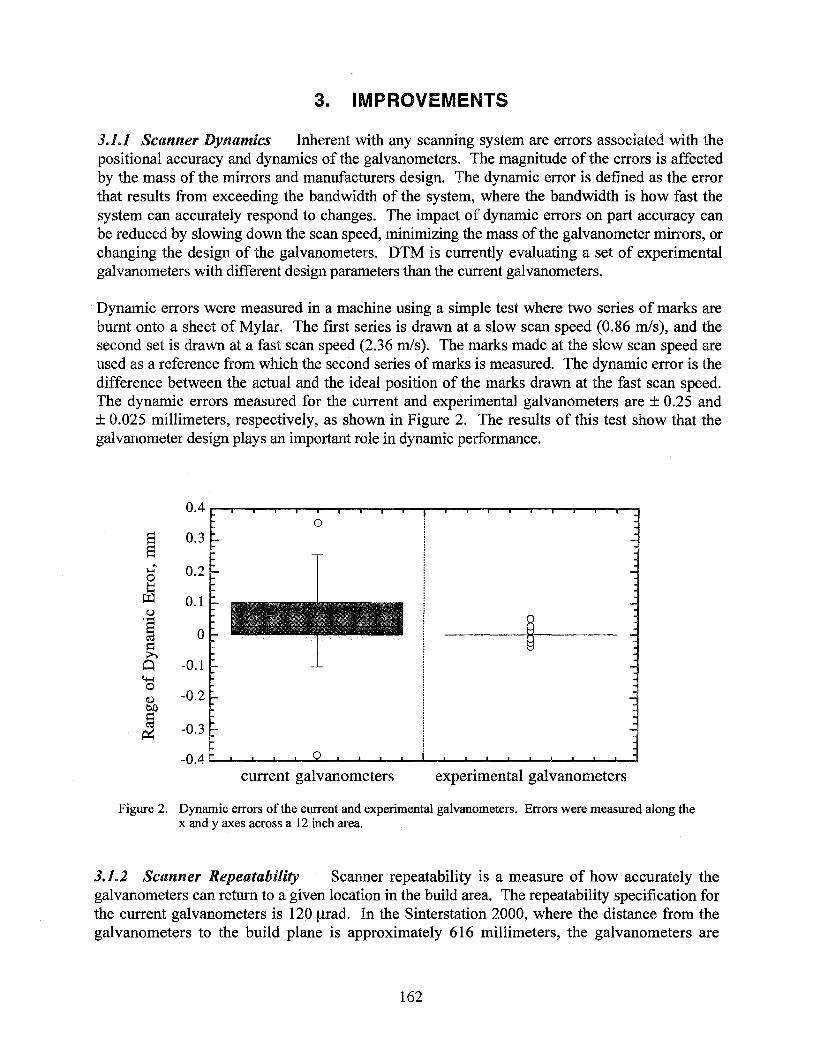
3.1.1 Scanner Dynamics Inherent with any scanning system are errors associated with thepositional accuracy and dynamics of the galvanometers. The magnitude of the errors is affectedby the mass of the mirrors and manufacturers design. The dynamic error is defined as the errorthat results from exceeding the bandwidth of the system, where the bandwidth is how fast thesystem can accurately respond to changes. The impact of dynamic errors on part accuracy canbe reduced by slowing down the scan speed, minimizing the mass of the galvanometer mirrors, orchanging the design of the galvanometers. DTM is currently evaluating a set of experimentalgalvanometers with different design parameters than the current galvanometers.
. Dynamic errors were measured in a machine using a simple test where two series of marks areburnt onto a sheet of Mylar. The first series is drawn at a slow scan speed (0.86 mls), and thesecond set is drawn at a fast scan speed (2.36 mls). The marks made at the slow scan speed areused as a reference from which the second series of marks is measured. The dynamic error is thedifference between the actual and the ideal position of the marks drawn at the fast scan speed.The dynamic errors measured for the current and experimental galvanometers are ± 0.25 and± 0.025 millimeters, respectively, as shown in Figure 2. The results of this test show that thegalvanometer design plays an important role in dynamic performance.
0.40
S 0.3SI-l' 0.20l::
l:J;.l 0.1(,)
~.§
0C':lt=l:>-.0 -0.14-f0~ -0.2bI.l
~ -0.3
-0.4current galvanometers experimental galvanometers
Figure 2. Dynamic errors of the current and experimental galvanometers. Errors were measured along thex and y axes across a 12 inch area.
3.1.2 Scanner Repeatability Scanner repeatability is a measure of how accurately thegalvanometers can return to a given location in the build area. The repeatability specification forthe current galvanometers is 120 J.lrad. In the Sinterstation 2000, where the distance from thegalvanometers to the build plane is approximately 616 millimeters, the galvanometers are
162

repeatable to within 0.076 millimeters (0.003 inches). The experimental galvanometers have arepeatability specification of 10 J,trad, or 0.006 millimeters (0.00024 inches) at the build plane.
Scanner repeatability dictates how well the ends of the scan vectors drawn on the build plane arealigned; the alignment of the vectors affects the smoothness of vertical surfaces. The combinedeffects of the scanner dynamics. and scanner repeatability influence overall SLS part accuracy.There is a significant improvement in part accuracy when the new galvanometers are used tobuild and accuracy benchmark part in a polymer coated metal material as shown in Figure 3. Thismaterial has essentially zero shrinka.ge in the SLS process.
0.4
S 0.3
S,....; 0.2c:ll=l..... 0.1S0Z 0S0~ -0.1d0 -0.2.....~.....:>Q.) -0.30
-0.4
- - - - - - - - - - - - - - --
current galvanometers experimental galvanometers
Figure 3. Error distribution for an accuracy part made using polymer coated metal material. The solidbox contains 90% of the data, and the dashed box contains 50% of the data. There are 46distinct x and y measurements in each data set.
The initial evaluation of the experimental galvanometers on different SLS machines at differentsites began in May 1995. The evaluation included two builds with the current galvanometers, aretrofit of the scanner system, and the same two builds with the experimental galvanometers.The first build contained 8 parts representing a range of part geometries. These parts were builtonly once with each set of galvanometers to show the first time build accuracy. Also, the scaleand beam offset values, calculated especially for the SLS machine and material, were applied to allof the STL files in the build packet.
Preliminary results of the evaluation program are presented in Table 1. Parts built with theexperimental galvanometers show less random error than parts built with the currentgalvanometers. The range of error is reduced by approximately 25 to 35% to a value of± 0.25mm for nylon and polycarbonate, while the range of error is reduced by approximately 40 to 50%to a value of ± 0.10 mm for metals. The different range of error values for the polymers and
163
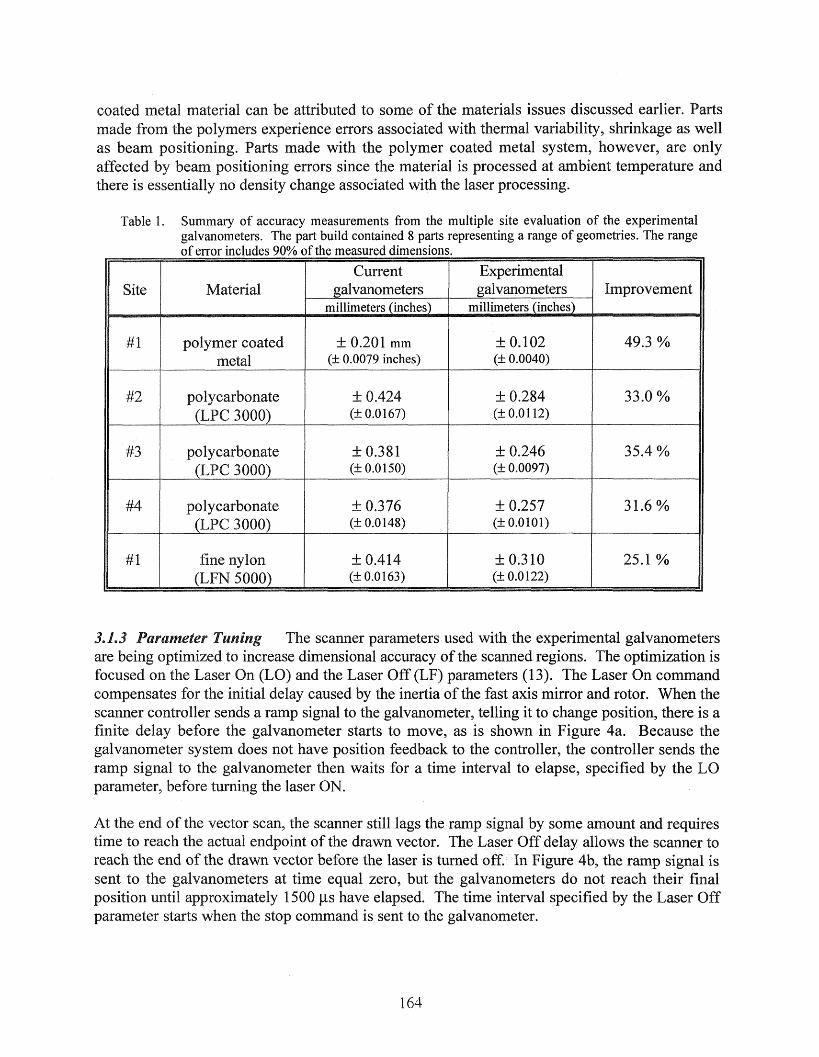
coated can attributed to some of the materials issues discussed earlier. Partsmade from the polymers experience errors associated with thermal variability, shrinkage as wellas beam positioning. Parts made with the polymer coated metal system, however, are onlyaffected by beam positioning errors since the material is processed at ambient temperature andthere is essentially no density change associated with the laser processing.
Table 1. Summary of accuracy measurements from the multiple site evaluation of the experimentalgalvanometers. The part build contained 8 parts representing a range of geometries. The rangeof error includes 90% of the measured dimensions.
Current ExperimentalSite Material galvanometers galvanometers Improvement
millimeters (inches) millimeters (inches)
#1 polymer coated ± 0.201 mm ± 0.102 49.3 %metal (: 0.0079 inches) (: 0.0040)
#2 polycarbonate ± 0.424 ± 0.284 33.0%(LPC 3000) (± 0.0167) (± 0.0112)
#3 polycarbonate ± 0.381 ± 0.246 35.4 %(LPC 3000) (± 0.0150) (± 0.0097)
#4 polycarbonate ± 0.376 ± 0.257 31.6 %(LPC 3000) (± 0.0148) (± 0.0101)
#1 nylon ± 0.414 ± 0.310 25.1 %(LFN 5000) (± 0.0163) (± 0.0122)
3.1.3 scanner parameters used with the experimental galvanometersare being optimized to increase dimensional accuracy of the scanned regions. The optimization isfocused on the On (La) and the Laser Off (LF) parameters (13). The Laser On commandcompensates for the initial delay caused by the inertia of the fast axis mirror and rotor. When thescanner controller sends a ramp signal to the galvanometer, telling it to change position, there is afinite delay before the galvanometer starts to move, as is shown in Figure 4a. Because thegalvanometer system does not have position feedback to the controller, the controller sends theramp signal to the galvanometer then waits for a time interval to elapse, specified by theparameter, before turning the laser ON.
At the end the vector scan, the scanner still lags the ramp signal by some amount and requirestime to the actual endpoint of the drawn vector. Off delay allows scanner toreach the end of the drawn vector before the laser is In Figure 4b, the ramp signal issent to the time equal zero, but the galvanometers do not their finalposition until approximately 1500 Ils have elapsed. The time interval specified by the Offparameter starts when the stop command is sent to the galvanometer.
164
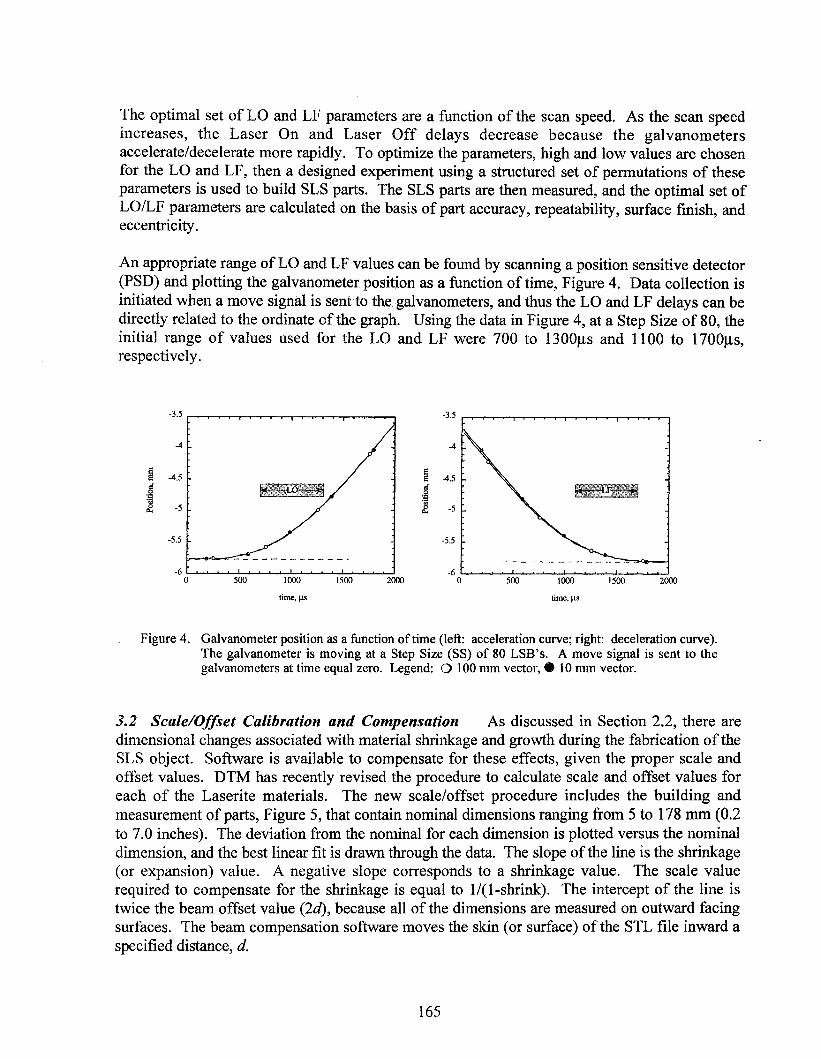
The optimal set of LO and LF parameters are a function of the scan speed. As the scan speedincreases, the Laser On and Laser Off delays decrease because the galvanometersaccelerate/decelerate more rapidly. To optimize the parameters, high and low values are chosenfor the LO and LF, then a designed experiment using a structured set of permutations of theseparameters is used to build SLS parts. The SLS parts are then measured, and the optimal set ofLOILF parameters are calculated on the basis of part accuracy, repeatability, surface finish, andeccentricity.
An appropriate range ofLO and LF values can be found by scanning a position sensitive detector(PSD) and plotting the galvanometer position as a function of time, Figure 4. Data collection isinitiated when a move signal is senUo the galvanometers, and thus the LO and LF delays can bedirectly related to the ordinate ofthe graph. Using the data in Figure 4, at a Step Size of 80, theinitial range of values used for the LO and LF were 700 to 1300Jls and 1100 to 1700Jls,respectively.
200015001000500
- ---------~-~-~-~~
-3.5
-4
~ -4.5
.~.;;;rf. -5
-5.5
-62000 015001000500
~~~_7 .
-3.5
-4
~ -4.5c:f0."~ -5
-5.5
-60
time, I!S time, Its
Figure 4. Galvanometer position as a function of time (left: acceleration curve; right: deceleration curve).The galvanometer is moving at a 8tep Size (88) of 80 LSB's. A move signal is sent to thegalvanometers at time equal zero. Legend: 0100 mm vector,. 10 mm vector.
3.2 Scale/Offset Calibration and Compensation As discussed in Section 2.2, there aredimensional changes associated with material shrinkage and growth during the fabrication of theSLS object. Software is available to compensate for these effects, given the proper scale andoffset values. DTM has recently revised the procedure to calculate scale and offset values foreach of the Laserite materials. The new scale/offset procedure includes the building andmeasurement of parts, Figure 5, that contain nominal dimensions ranging from 5 to 178 mm (0.2to 7.0 inches). The deviation from the nominal for each dimension is plotted versus the nominaldimension, and the best linear fit is drawn through the data. The slope ofthe line is the shrinkage(or expansion) value. A negative slope corresponds to a shrinkage value. The scale valuerequired to compensate for the shrinkage is equal to I/(l-shrink). The intercept of the line istwice the beam offset value (2e!), because all of the dimensions are measured on outward facingsurfaces. The beam compensation software moves the skin (or surface) of the STL file inward aspecified distance, d.
165

Figure 5. Parts built and measured to calculate scale and offset values for the polymer materials used inthe Sinterstation 2000 System.
The current methods of beam compensation include normal offset and constant offset. Of thesetwo methods, the normal offset method provides the most uniform results. In the normal offsetmethod, a vector normal is calculated at each vertex based on the normals of the adjacent facets.The vertex is moved along the vertex normal to the new offset position. This method works bestfor STL files that have circular and flat surfaces because the angle between the facets is large. Asthe angle between the facets decreases, the distance that the vertex is moved by the normal offsetmethod is not sufficient to move the surface of the STL file by the desired amount. The constantoffset method works best for square features. In this method, the vertex is offset by moving firstin the x direction, then in the y direction, by the beam offset value, Figure 6c.
A new method of beam compensation, dihedral offset, is being added to the geometry toolssoftware provided by DTM Corporation. The new method, dihedral offset, uses the dihedralangle between connecting facets to calculate the new offset position of the vertex. This methodadjusts for the geometry of the part, making the dihedral offset method more accurate than thenormal offset and constant offset methods. As an example, Figure 6 shows how two facets andtheir common vertex are offset a specific distance, d, using each of the three methods.
dihedral offset normal offset
III
constant offset
Figure 6. A visual comparison of the three offset methods available to compensate of the laser beamwidth. The solid line is the initial position, the dashed line is the final position, the shadedboxes represent the desired amount of offset for each facet.
166
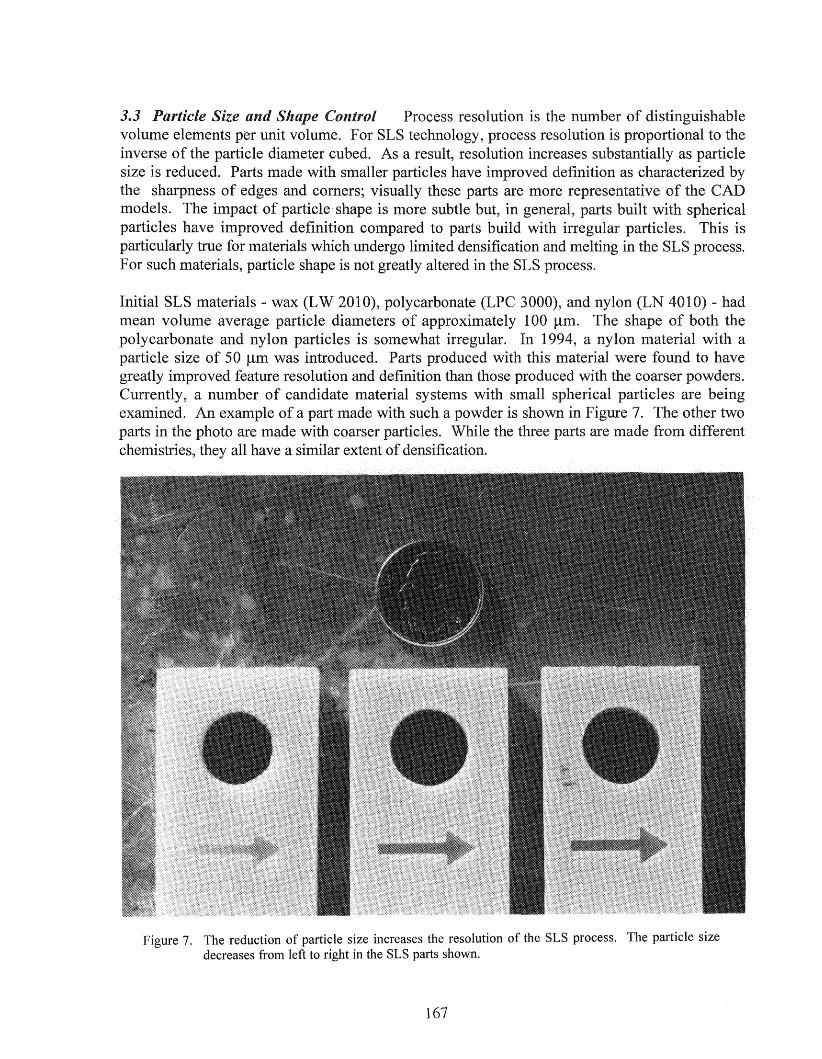
3.3 Particle Size and Shape Control Process resolution is number distinguishablevolume elements per unit volume. For SLS technology, process resolution is proportional to theinverse of the particle diameter cubed. As a result, resolution increases substantially as particlesize is reduced. Parts made with smaller particles have improved definition as characterized bythe sharpness of edges and corners; visually these parts are more themodels. The impact of particle· shape is more subtle but, in general, parts built with sphericalparticles have improved definition compared to parts build with particles. This isparticularly true for materials which undergo limited densification and melting in process.For such materials, particle shape is not greatly altered in the SLS process.
Initial SLS materials - wax (LW 2010), polycarbonate (LPC 3000), and nylon (LN 4010) - hadmean volume average particle diameters of approximately 100 J.!m. shape both thepolycarbonate and nylon particles is somewhat irregular. In 1994, a nylon material with aparticle size of 50 J.!m was introduced. Parts produced with this material were found to havegreatly improved feature resolution and definition than those produced with coarser powders.Currently, a number of candidate material systems with small spherical particles areexamined. An example of a part made with such a powder is shown in 7. other twoparts in the photo are made with coarser particles. While the three parts are made differentchemistries, they all have a similar extent of densification.
Figure 7. The reduction of particle size increases the resolution of the SLS process. The particle sizedecreases from left to right in the SLS parts shown.
167

4. CONCLUSIONS
SLS part accuracy is being improved through a series of projects. In particular, improvements tothe beam delivery system, scale/offset calibration and software, and materials have been made orare in development. These improvements are summarized below:
• Dynamic scanning errors and scanner repeatability errors can be reduced by an order ofmagnitude with improved galvanometers.
• With the new galvanometers, the range of dimensional error is reduced by approximately 25 30% to ± 0.25 mm for nylon and polycarbonate, while the range of error is reduced by 40 50% to a value of± 0.10 mm for polymer coated metals.
• Optimization of the scanner parameters is ongoing to improve accuracy, surface finish, andrepeatability.
• The revised scale/offset calibration procedure and dihedral beam offset method provides moreaccurate measurement and compensation for shrinkage and laser beam width.
• Materials with controlled particle size and shape can produce parts with resolution anddefinition approaching that of those made with liquid-based processes.
5. REFERENCES
1. E.P. Gargiulo and D. Belfiore, "Stereolithography Process Accuracy: User Experience",Proceedings of the Second International Conference on Rapid Prototyping, University ofDayton, Dayton, Ohio, p. 311, June 1994.
2. T.H. Pang, "Stereolithography Epoxy Resins SL 5170 and SL 5180: Accuracy,Dimensional Stability, and Mechanical Properties", Proceeding of the Solid FreeformFabrication Symposium, The University of Texas at Austin, Austin, Texas, p. 204, 1994.
3. N.P. Juster and T.H.C. Childs, "A Comparison of Rapid Prototyping Processes",Proceedings of the 3rd European Conference on Rapid Prototyping and Manufacturing,University ofNottingham, Nottingham, United Kingdom, 1994.
4. M.D. Baldwin, C. Atwood, and M.C. Maguire, "Integration of Rapid Prototyping intoInvestment Casting", Proceedings of the Rapid Prototyping & Manufacturing '95Conference, Dearborn, Michigan, May 1995.
5. D. Jayaram, Benchmarking of Rapid Prototyping Systems - Beginning to Set Standards,Master's thesis, Clemson University, 1994.
168

6. Schmidt, "Process Performance Study of Commercially Produced Rapid PrototypingSystems", Proceedings of the Rapid Prototyping & Manufacturing '95 Conference,Dearborn, Michigan, May 1995.
7. Forderhase, K. McAlea, M. Michalewicz, M. Ganninger, and Firestone, "SLSPrototypes from Nylon", Proceeding of the Solid Freeform Fabrication Symposium, TheUniversity of Texas at Austin, Austin, Texas, p. 102, 1994.
8. McAlea, R. Booth, P. Forderhase, and U. Lakshminarayan, "Materials for SelectiveLaser Sintering Processing", Proceedings of the 1995 SAMPE Conference, 1995.
9. K. McAlea, P. Forderhase, and R. Booth, "The Development of a SLS CompositeMaterial", Proceeding of the Solid Freeform Fabrication Symposium, The University ofTexas at Austin, Austin, Texas, 1995.
10. U. Lakshminarayan, K. McAlea, D. Girouard, and R. Booth, "Manufacture of Iron-CopperComposite Parts using Selective Laser Sintering", 1995 International Conference of PowderMetallurgy and Particulate Materials, Seattle, Washington, 1995.
11. Forderhase, M. Ganninger, and K. McAlea, "Nylon and Nylon Composite SLSPrototypes", Proceedings of the 4th European Conference on Rapid Prototyping andManufacturing, The University ofNottingham, Nottingham, United Kingdom, 1995.
12. l.A. Benda, Temperature-Controlled Selective Laser Sintering, Proceeding of the SolidFreeform Fabrication Symposium, The University of Texas at Austin, Austin, Texas, p.277, 1994.
13. DG Series: Scan Head Controllers. User Manual, General Scanning, Inc., Waterton,Massachusetts, GSI PN 12P-DG, Rev #5, March, 1988.
169