improved voice activity detection algorithm using wavelet and support vector machine
TRANSCRIPT

Available online at www.sciencedirect.comCOMPUTER
Computer Speech and Language 24 (2010) 531–543
www.elsevier.com/locate/csl
SPEECH AND
LANGUAGE
Improved voice activity detection algorithm using waveletand support vector machine
Shi-Huang Chen a,*, Rodrigo Capobianco Guido b, Trieu-Kien Truong c,Yaotsu Chang d
a Department of Computer Science and Information Engineering, Shu-Te University, Kaohsiung County, 824, Taiwan, ROCb University of Sao Paulo (USP), Institute of Physics at Sao Carlos (IFSC), Department of Physics and Informatics (FFI),
Avenida Trabalhador SaoCarlense 400, 13566-590 Sao Carlos, SP, Brazilc Department of Information Engineering, I-Shou University, Kaohsiung County, 840, Taiwan, ROC
d Department of Applied Mathematics, I-Shou University, Kaohsiung County, 840, Taiwan, ROC
Received 28 September 2008; received in revised form 9 June 2009; accepted 21 June 2009Available online 27 June 2009
Abstract
This paper proposes an improved voice activity detection (VAD) algorithm using wavelet and support vector machine(SVM) for European Telecommunication Standards Institution (ETSI) adaptive multi-rate (AMR) narrow-band (NB) andwide-band (WB) speech codecs. First, based on the wavelet transform, the original IIR filter bank and pitch/tone detectorare implemented, respectively, via the wavelet filter bank and the wavelet-based pitch/tone detection algorithm. The wave-let filter bank can divide input speech signal into several frequency bands so that the signal power level at each sub-bandcan be calculated. In addition, the background noise level can be estimated in each sub-band by using the wavelet de-nois-ing method. The wavelet filter bank is also derived to detect correlated complex signals like music. Then the proposed algo-rithm can apply SVM to train an optimized non-linear VAD decision rule involving the sub-band power, noise level, pitchperiod, tone flag, and complex signals warning flag of input speech signals. By the use of the trained SVM, the proposedVAD algorithm can produce more accurate detection results. Various experimental results carried out from the Auroraspeech database with different noise conditions show that the proposed algorithm gives considerable VAD performancessuperior to the AMR-NB VAD Options 1 and 2, and AMR-WB VAD.� 2009 Elsevier Ltd. All rights reserved.
Keywords: Voice activity detection (VAD); AMR-NB; AMR-WB; Wavelet transform; Support vector machine (SVM)
1. Introduction
Voice activity detection (VAD) is a process that can automatically detect the voiced and non-voiced seg-ments from a sound signal. It follows from the literature (Beritelli et al., 2001) that a typical conversational
0885-2308/$ - see front matter � 2009 Elsevier Ltd. All rights reserved.doi:10.1016/j.csl.2009.06.002
* Corresponding author. Tel.: +886 7 6158000.E-mail addresses: [email protected] (S.-H. Chen), [email protected] (R.C. Guido), [email protected] (T.-K. Truong),
[email protected] (Y. Chang).

532 S.-H. Chen et al. / Computer Speech and Language 24 (2010) 531–543
speech is characterized by a speech to non-speech ratio of forty to sixty. Therefore the use of VAD modulecould improve the channel capacity as well as the power consumption of voice communication systems(Srinivasant and Gersho, 1993). In addition, VAD can also benefit many speech related applications suchas speech coding (Srinivasant and Gersho, 1993), automatic speech recognition (Karray and Martin,2003), and speech enhancement systems (Woo et al., 2000). Various types of VAD algorithms have beenproposed based on time-, frequency- or combination-domain (Tucker, 1992; ETSI, 1999; Benyassineet al., 1997). The basic procedure of most VADs in use today consists of a features extraction part followedby a decision part. The feature extraction part will extract acoustic parameters from the input sound signalfor discrimination of voiced and non-voiced segment. The traditional acoustic parameters are the short timeenergy levels, zero-crossing rates, pitch period, and spectral difference (3GPP, 2004; ETSI, 1999; ITU-T,1996). Then the decision part will make use of these acoustic parameters with some decision rules to deter-mine the VAD result. The decision rules could be simple threshold values or complex statistical models. TheVAD algorithms, which apply threshold values as the decision rule, will make the voice-active determinationby evaluating whether acoustic parameters exceed the threshold values or not (3GPP, 2004; ETSI, 1999;ITU-T, 1996). On the other hand, statistical models will define a voiced and non-voiced state transitionmodel, and then calculate the likelihood ratio of voiced state to non-voiced state by using probability esti-mation (Gorriz et al., 2008).
The main drawback of these proposed VADs is that only a limited flexibility is allowed by these algorithmsin the choice of the time–frequency resolution. Because speech signals are non-stationary and contain lots oftransient components, it is not appropriate to use a fixed time–frequency resolution method to extract param-eters for VAD, especially in noisy environments. Although VAD algorithms of ETSI AMR standards (3GPP,2004; ETSI, 1999) have applied filter bank to improve the performance of noise level estimation, it still remainsanother problem, that is, the use of preset fixed threshold values (Chen et al., 2007, 2008). It is difficult toderive fixed threshold values for accurate VAD under variable pronunciation conditions. Furthermore, thethreshold values used in some of traditional VAD algorithms are calculated in the silence intervals and areimproper for noisy environments. Even though the VADs with statistical models provide more robust perfor-mance than the use of threshold values, their performances are restricted to specific environments. In otherwords, these statistical models require the assumptions of stationary noise types and a prior knowledge ofnoises (Gorriz et al., 2008). It is almost impossible to cope with all kinds of noises observed in the realenvironments.
To overcome the problems described above, this paper proposes an improved VAD algorithm for ETSIAMR-NB (narrow-band) and AMR-WB (Wide-Band) speech codecs using wavelet transform and supportvector machine (SVM). The wavelet transform is acknowledged as a powerful tool for the non-linear fil-tering of noisy speech signals. In addition, the SVM proposed by (Vapnik, 1998) have been regarded as anew learning algorithm for various applications such as audio classification (Lin et al., 2005). Since VADcan be regarded as a classification problem of voiced and non-voiced signals, SVM could be one of thesolutions of VAD problem (Enqing et al., 2002; Chen et al., 2007, 2008). In addition, this paper modifiesthe wavelet-based de-noising method (Donoho and Johnstone, 1995) with Stein’s unbiased risk estimate(SURE) (Stein, 1981) to estimate the background noise in the input speech. The wavelet filter band is alsoderived to detect correlated complex signals like music. Then one can apply SVM to train an optimizedSVM-based VAD decision rule involving the sub-band power, noise level, pitch period, tone flag, and com-plex signals warning flag of input speech signals. By the use of the trained SVM model, the proposed VADalgorithm can achieve accurate voice detection results under noisy environments. Using speech signalscorrupted by various real noises, the experimental results show that the proposed VAD algorithmperforms better than that of AMR-NB VAD Options 1 and 2 (ETSI, 1999), and AMR-WB VAD(3GPP, 2004).
The remainder of this paper is organized as follows. The VAD algorithms for AMR-NB and AMR-WBspeech codecs are briefly reviewed in Section 2. Section 3 gives the description of the wavelet-based VAD fea-ture extraction schemes. Then the SVM training process for AMR-NB and AMR-WB VAD is described inSection 4. Section 5 illustrates experimental results and compares to other methods. Finally, conclusionsare given in the last section.

S.-H. Chen et al. / Computer Speech and Language 24 (2010) 531–543 533
2. VAD algorithms of AMR-NB and AMR-WB speech codecs
2.1. AMR-NB VAD algorithm
In the ETSI AMR-NB speech codec, the VAD module is applied to indicate whether each 20 ms speechframe contains signals that should be transmitted, i.e. speech, music or information tones. The output ofthe AMR-NB VAD module is a Boolean flag (VAD_flag) indicating presence of such signals. There aretwo types of AMR-NB VAD algorithm, namely Option 1 and Option 2, proposed in the AMR-NB VAD stan-dard (ETSI, 1999). The VAD Option 1 is mainly an energy detector based on the sub-band level estimationwhereas the VAD Option 2 is based on the channel energy. The block diagram of the AMR-NB VAD Options1 is shown in Fig. 1. For simplification, this paper focuses on the AMR-NB VAD Option 1. For more infor-mation, see (ETSI, 1999).
In the AMR-NB VAD Option 1, samples of the input frame (s(i)) are first divided into sub-bands byusing a filter bank. The VAD uses 160 samples long frames like the AMR-NB speech codec. The filter bankis based on a critically decimated IIR filter bank as shown in Fig. 2 where filter blocks of the 5th and the 3rdorder are utilized. Each filter block divides the input sound into high-pass and low-pass parts and decimatesthe sampling frequency by two. It follows from Fig. 2 that the filter bank will divide the input sound into ninesub-bands, where the lower bands are narrower.
After the samples of a frame have been divided into sub-bands, the signal level (level[n]) at each sub-band is calculated by summing absolute values at each band where n is the index for the frequency bank. Then,the pitch and tone detections are to detect stationary signals including vowel sound and signaling tones. Inputsfor the pitch detection function are open-loop lags (T_op[n]), which are calculated by open-loop pitch anal-ysis of the speech encoder. The pitch detection is implemented by comparing lag values of consecutive sub-frames. If the difference of the consecutive lag values is less than a threshold, pitch is detected and pitch_flag(pitch) is set. Tone detection function calculates a flag (tone), which indicates presence of an informationtone. Tone detection is done by comparing the open-loop pitch gain of the pitch analysis to a threshold. Thepitch gain is estimated using autocorrelation values (t0 and t1) received from the pitch analysis. If the gain ismore than a threshold, the tone_flag is set.
In order to increase the discrimination between background noise and music signals, a complex signaldetection function is used in AMR-NB VAD. Complex signal detection calculates a flag (com-
Filter bankandcomputationof sub-bandlevels
VADdecision
Pitchdetection
Tonedetection
T_op[n]
t0,t1
VAD_flag
level[n]
pitch
tone
s(i)
Complexsignalanalysis
OL-LTPcorrelationvector
complex_warningTonedetectiont0,t1
complex_timer
Fig. 1. Block diagram of the VAD algorithm: Option 1 (ETSI, 1999).

5th orderfilter block
5th orderfilter block
5th orderfilter block
3rd orderfilter block
3rd orderfilter block
3rd orderfilter block
3rd orderfilter block
3rd orderfilter block
0 - 250 Hz
250 - 500 Hz
500 - 750 Hz
750 - 1000 Hz
3k - 4 kHz
2.5 - 3 kHz
2 - 2.5 kHz
1.5 - 2 kHz
1 - 1.5 kHz
Fig. 2. The filter bank used in the VAD algorithm: Option 1 (ETSI, 1999).
534 S.-H. Chen et al. / Computer Speech and Language 24 (2010) 531–543
plex_warning), which indicates presence of a correlated complex signal such as music. Correlate complexsignals are detected based on analysis of the correlation vector available in the open-loop pitch analysis. Thecomplex_warning flag will adjust the stationary assumption in the background noise estimation processeswhere the pitch and tone flags would fail to do so. A complex_timer flag is also used to initiate a long-term hangover when the filtered complex-correlation values have been consistently large for a considerabletime.
Intermediate VAD decision is calculated based on the comparison of the background noise estimate andlevels of the input frame as shown in Eq. (1).
snr sum ¼X9
n¼1
MAX 1:0;level½n�
bckr est½n�
� �2
ð1Þ
In Eq (1), the background noise estimate (bckr_est[n]) is updated using amplitude levels of the previousframe. The noise estimate is updated as:
bckr estmþ1½n� ¼ ð1:0� alphaÞ � bckr estm½n� þ alpha � levelm�1½n� ð2Þ
where m is index of the frame. The VAD decision is made by comparing the variable snr_sum to a threshold.The threshold is tuned to get desired sensitivity at each background noise level. The higher the noise level willresult in the lower threshold. Finally, the VAD flag is calculated by adding hangover to the intermediate VADdecision. The hangover process could improve the VAD of low power endings of speech bursts, which are sub-jectively important but difficult to detect.2.2. AMR-WB VAD algorithm
Similar to AMR-NB, the VAD module of AMR-WB is also applied to indicate whether each 20 ms speechframe contains signals that should be transmitted, i.e. speech, music or information tones. The output of theAMR-WB VAD module is a Boolean flag (VAD_flag) indicating presence of such signals. The simplifiedblock diagram of the AMR-WB VAD algorithm is shown in Fig. 3. The speech frames, s(i), are dividedinto frequency bands using a 12-band filter bank and level of the signal (level[n]) in each band is calcu-lated. Fig. 4 is the structure of the 12-band filter bank used in AMR-WB VAD. The filter bank used inAMR-WB VAD consists of 5th and 3rd order IIR filter blocks. Each filter block divides the input sound intohigh-pass and low-pass parts and decimates the sampling frequency by 2.

Filter bankandcomputationof sub-bandlevels
VADdecision
Tonedetection
ol_gain VAD_flag
level[n]
tone_flag
s(i)
Fig. 3. The simplified block diagram of the AMR-WB VAD algorithm (3GPP, 2004).
5th orderfilter block
5th orderfilter block
5th orderfilter block
3rd orderfilter block
5th orderfilter block
5th orderfilter block
3rd orderfilter block
4.8 - 6.4 kHz4.0 - 4.8 kHz3.2 - 4.0 kHz
2.4 - 3.2 kHz
2.0 - 2.4 kHz1.6 - 2.0 kHz
3rd orderfilter block
3rd orderfilter block
1.2 - 1.6 kHz
0.8 - 1.2 kHz
3rd orderfilter block
3rd orderfilter block
0.6 - 0.8 kHz
0.4 - 0.6 kHz
0.2 - 0.4 kHz
0.0 - 0.2 kHz
Fig. 4. The filter bank used in the AMR-WB VAD algorithm (3GPP, 2004).
S.-H. Chen et al. / Computer Speech and Language 24 (2010) 531–543 535
Inputs for the tone detection function are the normalized open-loop pitch gains (ol_gain), which are cal-culated by open-loop pitch analysis of the speech encoder. The tone detection function computes a flag(tone_flag), which is used for indicating the presence of a signaling tone, voiced speech, or other stronglyperiodic signal. The simplified block diagram of the VAD decision algorithm is shown in Fig. 5. In Fig. 5, thebackground noise level (bckr_est[n]) is estimated in each frequency band based on the intermediate VADdecision, sub-band signal level, and the tone flag. Intermediate VAD decision is calculated by comparing inputSNR (signal-to-noise ratio), i.e., level[n]/bckr_est[n], to an adaptive threshold. The differencebetween the signal levels of the input frame and the background noise estimate is calculated by using Eq. (3):
snr sum ¼X12
n¼1
MAX 1:0;level½n�
bckr est½n�
� �2
ð3Þ
VAD decision is then made by comparing the variable snr_sum to a threshold (vad_thr). The vad_thris adapted to get desired sensitivity depending on estimated speech and background noise levels. The variablevadreg indicates intermediate VAD decision and is calculated as follows:
if (snr_sum > vad_thr)
vadreg = 1
else
vadreg = 0

level[n]
bckr_est[n]
speech_levelnoise_level
SpeechEstimation
BackgroundNoiseEstimation
HangoverAddition
Comparison
SNRComputation
ThresholdAdaptation
snr_sum
vadreg
VAD_flag
vad_thr
tone_flag
Fig. 5. The simplified block diagram of the AMR-WB VAD decision (3GPP, 2004).
536 S.-H. Chen et al. / Computer Speech and Language 24 (2010) 531–543
Finally, the VAD flag is determined by adding hangover to the intermediate VAD decision. The hangoveraddition process can improve detection of low power endings of speech bursts, which are subjectively impor-tant but difficult to detect. For more details of the AMR-WB VAD algorithm, see (3GPP, 2004).
3. Wavelet-based speech features extraction for VAD
In this paper, the acoustic features used for VAD are basically the same as those of AMR-NB and AMR-WB VAD modules. However, most of acoustic features, including the sub-band power level, pitch flag, toneflag, complex warning flag, and etc., are calculated via wavelet transform instead of IIR filter bank.
3.1. Wavelet filter bank and sub-band power level
The wavelet transform mentioned here is implemented via filter bank structure, i.e., the fast discrete algo-rithm proposed by Mallat, 1989. Fig. 6 is the basic structure of wavelet analysis filter bank where h(n) and g(n)are the analysis low-pass and high-pass filters, respectively. Also, the symbol ;2 denotes the downsampling by2. Let aj+1(m) be the input to the analysis filter bank. Then the outputs of the analysis filter bank are given byEqs. (4) and (5).
ajðkÞ ¼X
m
hðm� 2kÞajþ1ðmÞ ð4Þ
djðkÞ ¼X
m
gðm� 2kÞajþ1ðmÞ ð5Þ
where aj(k) and dj(k) are called the approximation and detail coefficients of the wavelet decomposition ofaj+1(m), respectively.
aj+1
g(n) 2
h(n) 2
dj
aj
Fig. 6. The basic wavelet analysis filter bank.

S.-H. Chen et al. / Computer Speech and Language 24 (2010) 531–543 537
The splitting, filtering, and decimation shown in Fig. 6 can be repeated on the approximation and detailcoefficients to give the AMR-NB and AMR-WB VAD IIR filter banks shown in Figs. 2 and 4, respectively.It follows from (Lin et al., 2005) that the Daubechies length-8 wavelet filter (Daubechies, 1992) is select for theproposed VAD algorithm. Therefore, the sub-band power level (level[n]) at each sub-band can also be cal-culated via Eq. (6).
level½n� ¼X
k
jwnðkÞj ð6Þ
where wn(k) is the corresponding approximation or detail coefficients.
3.2. Detect pitch and tone flags by using wavelet
The pitch information is extracted by using a wavelet-based pitch detection method (Chen and Wang, 2002)instead of an open-loop algorithm. The first stage of the pitch detection method (Chen and Wang, 2002) is toapply the wavelet transform to decompose the input sound into M = k + 1 decomposition levels. Because thefirst formant frequencies of human are generally below 1000 Hz (Rabiner and Schafer, 1978), the index k canbe determined by using Eq. (7).
k ¼ blog2ðFs=1000 HzÞc ð7Þ
where bxc denotes the greatest integer less than or equal to x and Fs is the bandwidth of the input speech sig-nal. Then this method makes use of a modified spatial correlation function, which was determined from theapproximation signals obtained in the previous stage to extract the pitch frequency. The modified spatial cor-relation function Corrlðk;mÞ is defined in Eq. (8). That is,Corrlðk;mÞ ¼Yl�1
i¼0
aðkþiÞðmÞ;m ¼ 1; 2; � � � ;N ð8Þ
where aðkÞðmÞ denotes the wavelet approximation signals, k is the index of wavelet decomposition level, m isthe translation index, N is the length of input signal, l 6 M � k þ 1, and M is the total number of decompo-sition levels. Usually, l = 2.
Rescale the power of fCorr2ðk;mÞg to that of faðkÞðmÞg and get fresCorr2ðk;mÞg. Above procedure can beexpressed in Eq. (9).
resCorr2ðk;mÞ ¼ Corr2ðk;mÞffiffiffiffiffiffiffiffiffiffiffiffiffiffiffiffiffiffiffiffiffiffiffiffiffiffiffiffiffiffiffiffiPaðkÞ=PCorrðkÞ
pð9Þ
where PaðkÞ ¼P
mfaðkÞðmÞg2 and PCorrðkÞ ¼
PmfCorr2ðk;mÞg2.
Then, in Eq. (10), fNewCorr2ðk;mÞg is obtained by smoothing fresCorr2ðk;mÞg.
NewCorr2ðk;mÞ ¼ resCorr2ðk;mÞ � wðmÞ ð10Þwhere w(m) is a FIR lowpass filter with length of ½30ms� Fs�, and � denotes the convolution operation. IfjNewCorr2ðk;mÞjP jaðkÞðmÞj, the position m will be accepted as a pitch instant. Finally, the pitch frequencycan be derived from the reciprocal of the average distance of pitch instants. It was shown (Chen and Wang,2002) that this algorithm is capable of outperforming other time-, frequency- and wavelet-domain pitch detec-tion algorithms.
The tone detection is done by comparing the pitch frequency and the energy of spatial correlation functionof the wavelet-based pitch detection method to a calculated threshold. If pitch frequency is higher than 100 Hzand the sum of spatial correlation function is larger than the total sum of level[n], i.e.,
PmfCorr2ðk;mÞg >P
nflevel½n�g, the tone_flag is set.
3.3. Complex signal detection using wavelet
Correlated complex signal detection is only utilized in the AMR-NB VAD algorithm. It can detect corre-lated signals in the high-pass filtered weighted speech domain since the pitch and tone detection functions can-not always detect these signals (ETSI, 1999). A flag of complex_warning will be set when the statistics of

538 S.-H. Chen et al. / Computer Speech and Language 24 (2010) 531–543
the correlation value of a high-pass filtered input signal indicates the presence of a correlated complex signal.In this paper, the correlate complex signal is detected based on the analysis of the spatial correlation functionin the wavelet-based pitch detection algorithm (Chen and Wang, 2002). If the value of spatial correlation func-tion is greater than that of the sub-band signal in the level-M wavelet decomposition, that is fCorr2ðk;mÞg >faðMÞðmÞg, the flag complex_warning is set.
3.4. Wavelet-based background noise estimation
The estimation of background noise is by the use of wavelet-based de-noising method. One of the mostpopular schemes for wavelet-based de-noising is proposed by Donoho and Johnstone (1995). This schemeis based on thresholding the wavelet coefficients of the noise-corrupted signal and can be easily applied tospeech de-noising. It has been shown (Hu and Loizou, 2004) that the wavelet de-noising scheme has a betterperformance than other traditional methods. The wavelet-based speech de-noising algorithm can be summa-rized in the following three steps:
(a) Decompose the noisy speech signal s(n) into wavelet coefficients.(b) Employ a threshold method to the wavelet coefficients obtained in (a).(c) Synthesize these thresholded wavelet coefficients obtained in (b) to achieve the enhanced or de-noised
speech signal y(n).
Finally, the background noise can be estimated via calculating the energy of {s(n) � y(n)}, namely the dif-ferent between the original and the de-noised speech signals. In this paper, the threshold selection procedure isbased on Stein’s unbiased risk estimate (SURE) (Stein, 1981) and the soft shrinkage is used. The soft shrinkageis defined in Eq. (11).
dkðwjÞ ¼
0; jwjj 6 k
wj � k; wj > k
wj þ k; wj < �k
8>>><>>>:
ð11Þ
where k 2 ½0;1Þ is the threshold and wj is the wavelet coefficient of s(n) at level j. Let x(n) be the clear speechsignal of s(n) and the estimators of x(n) be x ¼ fxð1Þ; xð2Þ; � � � ; xðNÞg. The mean squared risk R of x is given inEq. (12). That is,
R ¼XN
n¼1
Eðx� xðnÞÞ2: ð12Þ
Assume that the estimators x have the form as shown in Eq. (13),
x ¼ sðnÞ þ H kðsðnÞÞ; ð13Þ
where k is a threshold level and Hk(�) is a differentiable real valued function for any fixed k. Since the truevalues of x(n) are unknown, it is impossible to calculate R explicitly. Stein showed that Hk(�) is weakly differ-entiable, then one can determine R through Eq. (14).R ¼ Rðr; sðnÞ; kÞ ¼XN
n¼1
r2 þ 2r2 dds
H kðsÞjs¼sðnÞ þ H 2kðsðnÞ
� �ð14Þ
where r is the noise standard deviation and can be estimated from s(n) using a robust median estimator pro-posed in (Donoho and Johnstone, 1995). The Stein’s principle is to minimize Eq. (14) with respect to k andtake the minimum as a data driven estimator of the optimal k*. This minimization condition can be expressedin Eq. (15).
k� ¼ minkP0
Rðr; sðnÞ; kÞ: ð15Þ

S.-H. Chen et al. / Computer Speech and Language 24 (2010) 531–543 539
4. SVM for AMR-NB and AMR-WB VADs
Based on the descriptions given in Section 2, one can obviously find that the both of AMR-NB and AMR-WB VAD modules involve several threshold values during VAD decision. It is difficult to derive preset thresh-old values for accurate VAD under variable pronunciation and noisy environments. Therefore, this papermakes use of SVM as a VAD decision device and to avoid the use of preset threshold values. It is well knownthat SVM uses a known kernel function / to define a hyper-plane which can separate given points into twopredefined classes as shown in Fig. 7. A modified SVM called soft-margin SVM can tolerate minor misclas-sifications (Lin et al., 2005) and is used in this paper. For more information about the theorem of SVM, pleaserefer to (Vapnik, 1998; Lin et al., 2005).
In this paper, 320 speech utterances selected from the Aurora database (Aurora 2 Database, 2000) areapplied to SVM-based VAD training and testing. Each speech sentence is about 2–3 s long and consists of3–10 digital numbers. In which 160 sentences are used for training and the remaining 160 sentences are appliedfor testing. All of the voiced segments in these speech files are manually labeled. To simulate various noisyenvironments, four different types of noise (train station, street, car, and white) selected from the Aurora data-base were added in the range 0 dB to 20 dB to these speech files.
4.1. SVM training for AMR-NB VAD
Because the AMR-NB standard just supports 8 kHz sampling rates, the speech files were re-sampled to8 kHz signal with 16-bit resolution before training. The first step is to divide speech files into 20 ms (160 sam-pling points) frame without overlap. Then, according to the manual label of voiced and non-voiced segments,the voiced frames are trained to a SVM target value of +1 whereas the non-voiced frames are trained to aSVM target value of �1. That is, if a speech frame consists of more than 75% non-voiced sampling points,it will be assigned to non-voiced class (�1). Otherwise, the speech frames will be assigned to voiced class(+1). These pre-classed training speech frames will be further corrupted by 0–20 dB train station, street,car, and white noises. Finally one can apply these noisy as well as clean speech frames to AMR-NB VADtraining.
For AMR-NB VAD training, the 12 speech features, including nine sub-band power level, pitch period,tone flag, and complex warning flag, are obtained from each speech frame. Assume that nT is the numberof the obtained feature vectors. The training set T is then defined to be a nT � 12 array with row vectors beingthese feature vectors. Let T ði; jÞ denote the (i, j)-position of T. One can use this array T to construct anothernT � 12 array T’ whose (i, j)-position T ’ði; jÞ is defined to be T 0ði; jÞ ¼ T ði; jÞ � lj, where lj ¼
PiT ði; jÞ=nT is
the mean of column j. Next, normalize T’ by computing T N ði; jÞ ¼ T 0ði; jÞ=mj, where mj is the maximum of theabsolute value of elements in column j. Thus, each feature will have similar weights after the normalizationprocess.
1+
1+
1+
1+
1+1+
1−
1−1−
1−
1−(−1)φ
(−1)φ
(−1)φ
(−1)φ
(−1)φ
(+1)φ (+1)φ
(+1)φ(+1)φ
(+1)φ
(+1)φ
φ
X F
Fig. 7. A feature map simplifies the classification task.

540 S.-H. Chen et al. / Computer Speech and Language 24 (2010) 531–543
4.2. SVM training for AMR-WB VAD
On the other hand, because AMR-WB standard can process speech bandwidth up to 7000 Hz, the speechfiles have to with 16 kHz sampling rate and 16-bit resolution before AMR-WB VAD training. Similar to theAMR-NB VAD training procedure, the first step is to divide speech files into 20 ms (320 sampling points)frame without overlap. Then, one can assign voice (+1) or non-voiced (�1) class to each frame based onthe previous manual label information and add 0–20 dB train station, street, car, or white noises to theseframes. Finally, these clean and noisy speech frames are sent to AMR-WB VAD training.
For each speech frame in the set for training, 13 feature vectors, i.e., 12 sub-band power levels and onebackground noise level, can be obtained. Assume that nT is the number of the obtained feature vectors.The training set T is then defined to be the nT � 13 array with row vectors being these feature vectors. LetT ði; jÞ denote the (i, j)-position of T. One can use this array T to construct another nT � 13 array T’ whose(i, j)-position T 0ði; jÞ is defined to be T 0ði; jÞ ¼ T ði; jÞ � lj, where lj ¼
PiT ði; jÞ=nT is the mean of column j.
Next, normalize T’ by computing T N ði; jÞ ¼ T 0ði; jÞ=mj, where mj is the maximum of the absolute value of ele-ments in column j. After above normalization process, each feature set will have similar weights.
4.3. The selection of SVM Kernel function
Two common kernel functions are usually used to the non-linear feature mapping. They are: (1) exponen-tial radial basis function (ERBF) Kðx;�xÞ ¼ expð�jx� �xj=2r2Þ, and (2) Gaussian function Kðx;�xÞ ¼expð�jx� �xj2=2r2Þ, where parameter r2 is the variance of the Gaussian function. Many classification problemsare always separable in feature space and able to obtain better accuracy by using ERBF kernel function thanGaussian kernel function with r2 ¼ 60 (Lin et al., 2005). Therefore, the ERBF kernel function is chosen in thispaper.
5. Experimental results
The experiments were performed on 160 speech utterances selected from the Aurora database (Aurora 2Database, 2000). All of these speech files are manually labeled. To enable comparison with the VAD methodsof AMR-NB and AMR-WB standards, these speech files were re-sampled to 8 kHz and 16 kHz, respectively.Both of these two types of sampling rate are recorded with 16-bit resolution. Four different types of noise(train station, street, car, and white) selected from the Aurora database were added in the range 0 dB to20 dB to these speech files. The software simulations were performed using Matlab� 7.1 on a Centrino�
Duo 1.83 GHz, Windows� XP PC.All of these speech files are first partitioned into 20 ms frames and then the corresponding acoustic features
will be extract from each frame depended on AMR-NB or AMR-WB VAD module. Namely, in the applica-tions of AMR-NB and AMR-WB VADs, respectively, 12 and 13 acoustic features will be extracted. Thetrained AMR-NB or AMR-WB VADs mentioned in Section 4 will process these acoustic features, and finallyoutput the VAD results. This paper utilizes the probabilities of voice detection P d and non-voice detection N d
to evaluate the VAD performances. P d is calculated as the percentage of test cases when the hand-markedvoiced regions are correctly detected by the VAD algorithm. Similarly, Nd is the percentage of test cases whenhand-marked non-voiced regions are correctly identified as noises. It is obvious that an ideal VAD algorithmshould have 100% P d and 100% N d simultaneously. In this paper, the performance of the proposed VAD algo-rithm is evaluated by comparing with the standard VAD methods, including AMR-NB VAD Options 1 and 2(ETSI, 1999), and AMR-WB VAD (3GPP, 2004). The results are summarized in Tables 1 and 2 where Pd andNd are the average values of 160 testing speech sentences with various noisy environments. As expected, theperformance of the proposed VAD algorithm improves with an increase in SNR.
From these experimental results given in Tables 1 and 2, one observes that although the probabilities ofvoice detection P d of AMR-NB VAD Options 1 and 2, and AMR-WB VAD are fine, their probabilities ofnon-voice detection Nd are somewhat unsatisfied. This means that most noisy sounds or non-voiced signalswill be classified as speech frames using AMR-NB and AMR-WB VAD methods. The proposed VAD schemepresents a good alternative to these standardized algorithms.
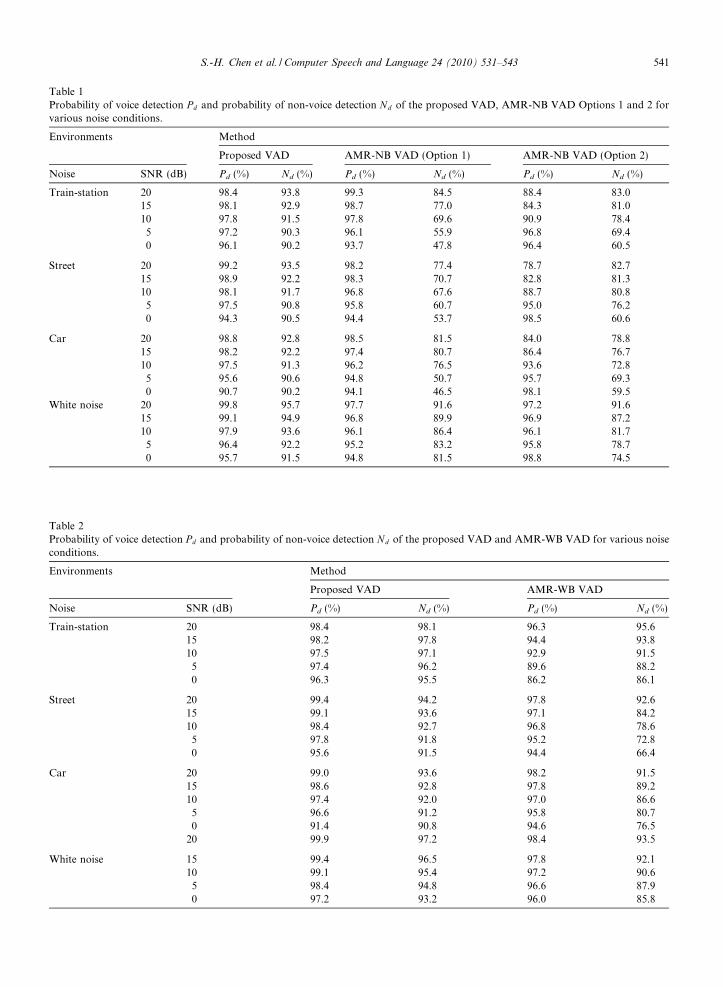
Table 1Probability of voice detection P d and probability of non-voice detection Nd of the proposed VAD, AMR-NB VAD Options 1 and 2 forvarious noise conditions.
Environments Method
Proposed VAD AMR-NB VAD (Option 1) AMR-NB VAD (Option 2)
Noise SNR (dB) Pd (%) Nd (%) Pd (%) Nd (%) Pd (%) Nd (%)
Train-station 20 98.4 93.8 99.3 84.5 88.4 83.015 98.1 92.9 98.7 77.0 84.3 81.010 97.8 91.5 97.8 69.6 90.9 78.45 97.2 90.3 96.1 55.9 96.8 69.40 96.1 90.2 93.7 47.8 96.4 60.5
Street 20 99.2 93.5 98.2 77.4 78.7 82.715 98.9 92.2 98.3 70.7 82.8 81.310 98.1 91.7 96.8 67.6 88.7 80.85 97.5 90.8 95.8 60.7 95.0 76.20 94.3 90.5 94.4 53.7 98.5 60.6
Car 20 98.8 92.8 98.5 81.5 84.0 78.815 98.2 92.2 97.4 80.7 86.4 76.710 97.5 91.3 96.2 76.5 93.6 72.85 95.6 90.6 94.8 50.7 95.7 69.30 90.7 90.2 94.1 46.5 98.1 59.5
White noise 20 99.8 95.7 97.7 91.6 97.2 91.615 99.1 94.9 96.8 89.9 96.9 87.210 97.9 93.6 96.1 86.4 96.1 81.75 96.4 92.2 95.2 83.2 95.8 78.70 95.7 91.5 94.8 81.5 98.8 74.5
Table 2Probability of voice detection P d and probability of non-voice detection Nd of the proposed VAD and AMR-WB VAD for various noiseconditions.
Environments Method
Proposed VAD AMR-WB VAD
Noise SNR (dB) Pd (%) Nd (%) Pd (%) Nd (%)
Train-station 20 98.4 98.1 96.3 95.615 98.2 97.8 94.4 93.810 97.5 97.1 92.9 91.55 97.4 96.2 89.6 88.20 96.3 95.5 86.2 86.1
Street 20 99.4 94.2 97.8 92.615 99.1 93.6 97.1 84.210 98.4 92.7 96.8 78.65 97.8 91.8 95.2 72.80 95.6 91.5 94.4 66.4
Car 20 99.0 93.6 98.2 91.515 98.6 92.8 97.8 89.210 97.4 92.0 97.0 86.65 96.6 91.2 95.8 80.70 91.4 90.8 94.6 76.5
20 99.9 97.2 98.4 93.5
White noise 15 99.4 96.5 97.8 92.110 99.1 95.4 97.2 90.65 98.4 94.8 96.6 87.90 97.2 93.2 96.0 85.8
S.-H. Chen et al. / Computer Speech and Language 24 (2010) 531–543 541

542 S.-H. Chen et al. / Computer Speech and Language 24 (2010) 531–543
Furthermore, from the viewpoint of VAD hardware implementation, the proposed wavelet-based SVMscheme can perform narrow-band and wide-band VADs using a similar architecture. This is an importantissue because most of modern 3G cellular phones are designed to jointly support AMR-NB and AMR-WBspeech codec. However, the original AMR-NB and AMR-WB standards use two different types of moduleto achieve narrow-band and wide-band VAD tasks. The use of two VAD modules will result in increased chiparea and cost. The proposed VAD scheme could improve this drawback and maybe benefit the implementa-tion of 3G cellular phones.
6. Conclusions
In this paper, an improved VAD algorithm based on the wavelet transform and SVM is proposed forAMR-NB and AMR-WB speech codecs. By the use of wavelet transform, the speech features for VAD includ-ing sub-band power, pitch period, tone flag, and complex signals warning flag will be calculated. To improvethe VAD performance under noisy environments, the background noise level was estimated in each sub-bandvia the wavelet de-noising method with SURE thresholding. Then one can apply SVM with ERBF kernelfunction to train an optimized non-linear AMR-NB or AMR-WB SVM-based VAD decision rule involvingthe sub-band power level, noise level, pitch period, tone flag, or complex signals warning flag of input speechsignals. It is shown in this paper that the trained AMR-NB and AMR-WB VADs offer accurate and robustVAD performances. Various experimental results reveal that the proposed VAD algorithm performs betterthan those of AMR-NB VAD Options 1 and 2, and AMR-WB VAD under different noisy environments.
Acknowledgement
This work is supported by the National Science Council, Taiwan, ROC, under Grant NSC 97-2221-E-366-010-MY3.
References
3GPP TS 26.194, 2004. Adaptive multi-rate – wideband (AMR-WB) speech codec: Voice activity detector (VAD).Aurora 2 Database, 2000. (Online) <http://www.elda.org/article52.html> (accessed 12.07.06).Benyassine, A., Shlomot, E., Su, H.-Y., 1997. ITU Recommendation G.729 annex B: a silence compression scheme for use with G.729
optimized for V.70 digital simultaneous voice and data applications. IEEE Comm. Mag., 64–73.Beritelli, F., Casale, S., Ruggeri, G., 2001. Performance evaluation and comparison of ITU-T/ETSI voice activity detectors. In: Proc.
ICASSP 2001, pp. 1425–1428.Chen, Shi-Huang, Wang, Jhing-Fa, 2002. Noise-robust pitch detection method using wavelet transform with aliasing compensation. IEE
Proc. Vision Image Signal Process. 149 (6), 327–334.Chen, Shi-Huang, Chang, Yaotsu, Truong, T.K., 2007. An improved voice activity detection algorithm for GSM adaptive multi-rate
speech codec based on wavelet and support vector machine. IEA/AIE 2007, pp. 915–924.Chen, Shi-Huang, Guido, Rodrigo Capobianco, 2008. An improved voice activity detection algorithm for AMR-WB speech codec using
wavelet and support vector machine. SCIS & ISIS 2008.Daubechies, I., 1992. Ten Lectures on Wavelets. CBMS, SIAM publ.Donoho, D.L., Johnstone, I.M., 1995. Adapting to unknown smoothness via wavelet shrinkage. Journal of the American Statistical
Association 90, 1200–1224.Enqing, D., Guizhong, L., Yatong, Z., Xiaodi, Z., 2002. Applying support vector machines to voice activity detection. In: Proc. Int. Conf.
Signal Process., vol. 2, pp. 1124–1127.European Telecommunication Standards Institution (ETSI) EN 301 708 V7.1.1, 1999. Voice Activity Detector (VAD) for Adaptive Multi-
Rate.Gorriz, J.-M., Ramırez, J., Lang, E.W., Puntonet, C.G., 2008. Jointly Gaussian PDF-based likelihood ratio test for voice activity
detection. IEEE Trans. Audio Speech Language Process. 16, 1565–1578.ITU-T Rec. G.729 Annex B, 1996. A silence compression scheme for G.729 optimized for terminals conforming to ITU-T V.70.Karray, L., Martin, A., 2003. Towards improving speech detection robustness for speech recognition in adverse environment. Speech
Commun., 261–276.Lin, Chien-Chang, Chen, Shi-Huang, Truong, T.K., Chang, Yukon, 2005. Audio classification and categorization based on wavelets and
support vector machine. IEEE Trans. on Speech Audio Process. 13 (5), 644–651.Mallat, S., 1989. Multifrequency channel decomposition of images and wavelet model. IEEE Trans. Acoustic, Speech Signal Process. 37,
2091–2110.

S.-H. Chen et al. / Computer Speech and Language 24 (2010) 531–543 543
Rabiner, L.R., Schafer, R.W., 1978. Digital Processing of Speech Signals. Prentice-Hall, Englewood Cliffs, NJ.Srinivasant, K., Gersho, A., 1993. Voice activity detection for cellular networks. In: Proc. IEEE Speech Coding Workshop ‘93, pp. 85–86.Stein, C., 1981. Estimation of the mean of a multivariate normal distribution. Annals Stat. 9 (6), 1135–1151.Tucker, R., 1992. Voice activity detection using a periodicity measure. In: IEE Proc., pp. 377–380.Vapnik, V.N., 1998. Statistical Learning Theory. Wiley.Woo, K.H., Yang, T.Y., Park, K.J., Lee, C., 2000. Robust voice activity detection algorithm for estimating noise spectrum. IEE Electron.
Lett., 180–181.Yi, Hu, Loizou, P.C., 2004. Speech enhancement based on wavelet thresholding the multitaper spectrum. IEEE Trans. Speech Audio
Process. 12 (1), 59–67.