improved network performance and reliability drive ... network performance and reliability drive...
TRANSCRIPT

Improved Network Performance and Reliability Drive Satisfaction With Residential TV and ISP Providers, as More Households Connect Digitally WESTLAKE VILLAGE, Calif: 24 September 2015 — Scores for network performance and reliability have improved, the number of U.S. households connected to digital service has grown and satisfaction has increased across wireline offerings, according to three U.S. wireline studies released today: the J.D. Power 2015 U.S. Residential Television Service Provider Satisfaction StudySM; the J.D. Power 2015 U.S. Residential Internet Service Provider Satisfaction StudySM; and the J.D. Power 2015 U.S. Residential Telephone Service Provider Satisfaction Study.SM For information about the three studies, visit: http://www.jdpower.com/resource/us-residential-television-customer-satisfaction-study http://www.jdpower.com/resource/us-residential-internet-service-provider-customer-satisfaction-study http://www.jdpower.com/resource/jd-power-2014-residential-telephone-customer-satisfaction-study The annual wireline studies evaluate residential customers’ experiences with TV, Internet and phone services in four regions: East, South, North Central and West. The ISP and telephone studies measure customer satisfaction across five factors: network performance and reliability; cost of service; billing; communication; and customer service. The TV study measures satisfaction in those same five factors plus another one, programming. Satisfaction is calculated on a 1,000-point scale. In 2015, 25 percent of U.S. households with Internet service report having a fiber optic connection, which may also provide TV and Internet service, a 5 percentage point increase from 2013 (20%). At the same time, overall satisfaction with these wireline services has increased as well. For example, customer satisfaction with television service has increased by a significant 24 points to 723 in 2015 from 699 in 2013. The main reason for the overall increase has been a 39-point rise in satisfaction in the network performance and reliability factor during the period. “The ability to provide a high-quality experience with all wireline services is paramount, as performance and reliability is the most critical driver of overall satisfaction,” said Kirk Parsons, senior director and technology, media & telecom practice leader at J.D. Power. “The fact that households continue to choose to upgrade their wireline connection to digital service is a testament to its improved performance and benefits, such as higher quality video and faster Internet speeds.” According to Parsons, as expectations regarding usage, performance quality and reliability continue to evolve, companies that understand these dynamics will be better positioned to provide a more satisfying customer experience, which can lead to higher levels of overall satisfaction and higher rates of retention, advocacy and return on investment.
(Page 1 of 3)
KEY FINDINGS
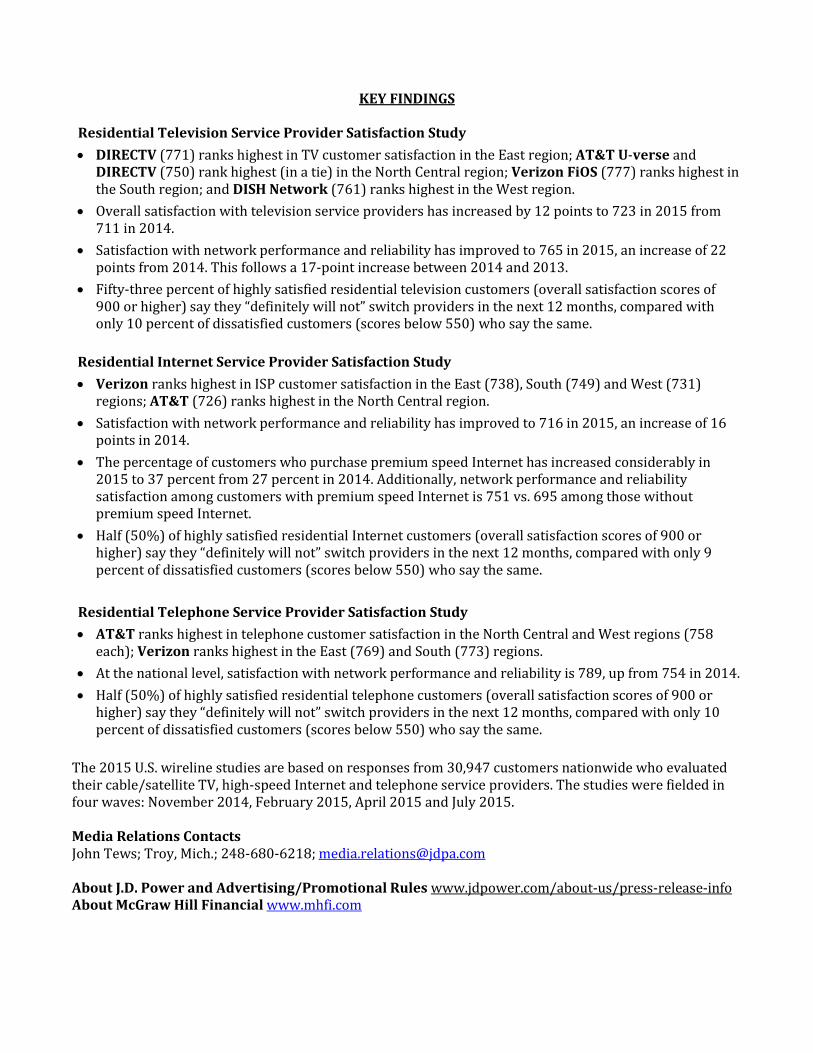
Residential Television Service Provider Satisfaction Study
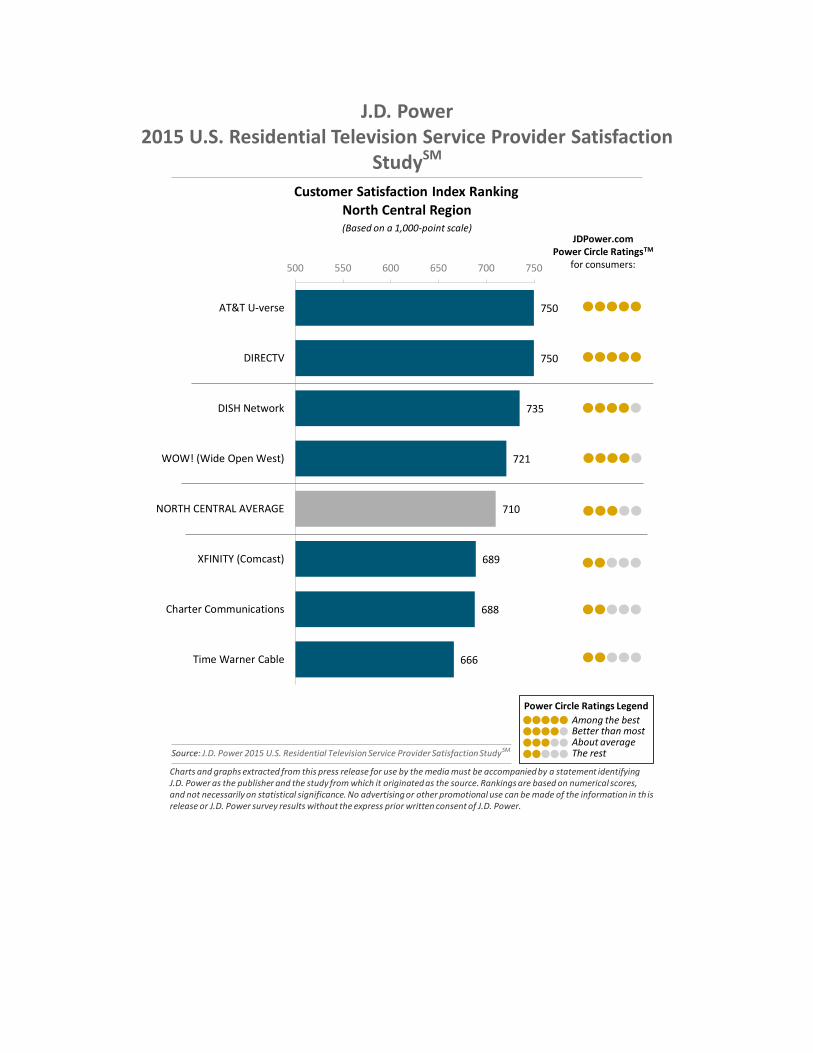
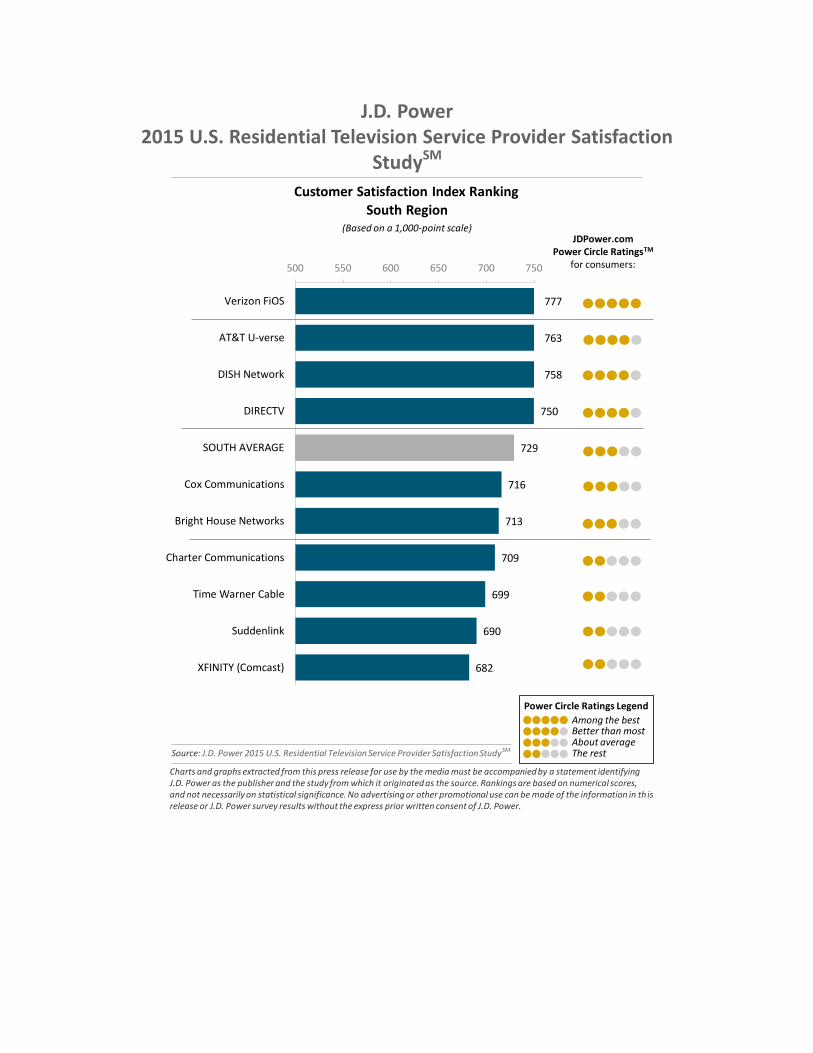
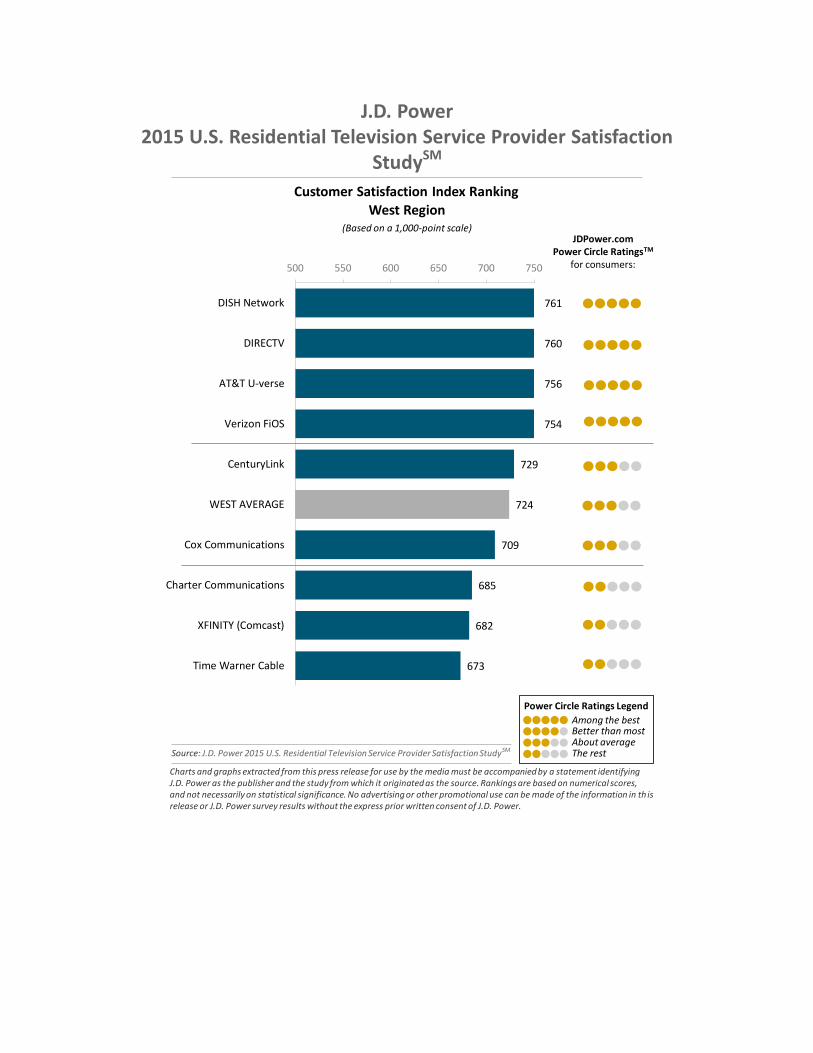
DIRECTV (771) ranks highest in TV customer satisfaction in the East region; AT&T U-verse and DIRECTV (750) rank highest (in a tie) in the North Central region; Verizon FiOS (777) ranks highest in the South region; and DISH Network (761) ranks highest in the West region.
Overall satisfaction with television service providers has increased by 12 points to 723 in 2015 from 711 in 2014.
Satisfaction with network performance and reliability has improved to 765 in 2015, an increase of 22 points from 2014. This follows a 17-point increase between 2014 and 2013.
Fifty-three percent of highly satisfied residential television customers (overall satisfaction scores of 900 or higher) say they “definitely will not” switch providers in the next 12 months, compared with only 10 percent of dissatisfied customers (scores below 550) who say the same.
Residential Internet Service Provider Satisfaction Study
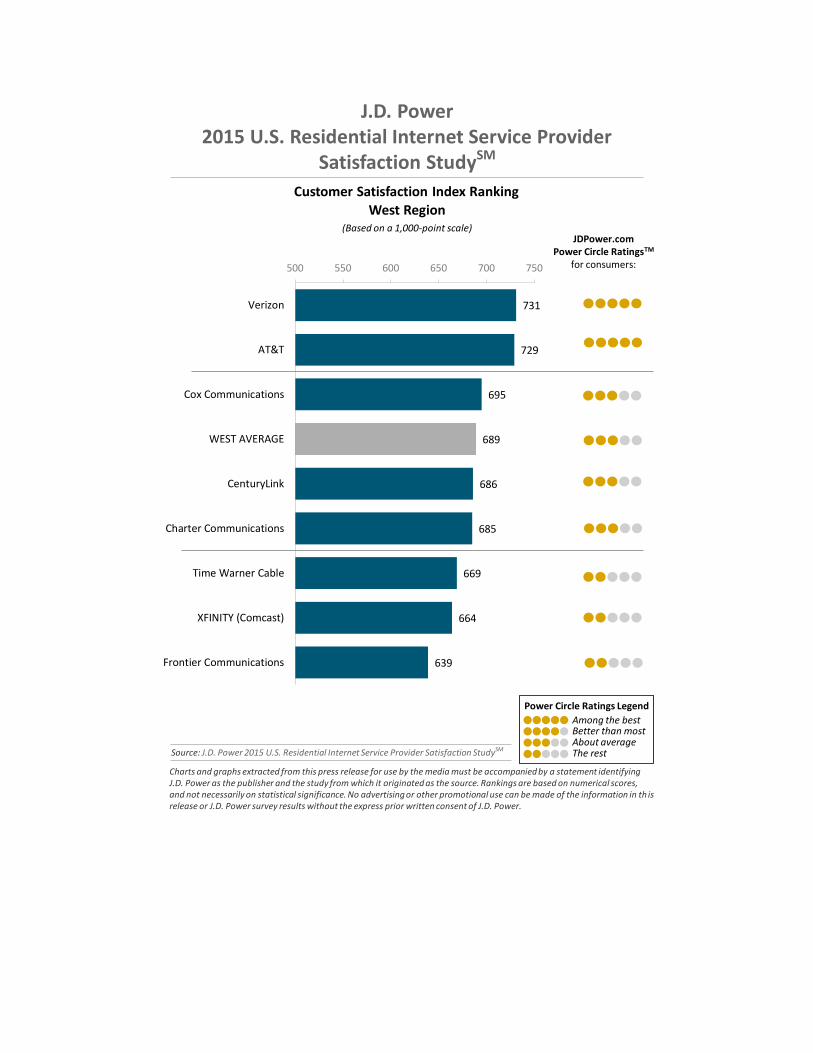
Verizon ranks highest in ISP customer satisfaction in the East (738), South (749) and West (731) regions; AT&T (726) ranks highest in the North Central region.
Satisfaction with network performance and reliability has improved to 716 in 2015, an increase of 16 points in 2014.
The percentage of customers who purchase premium speed Internet has increased considerably in 2015 to 37 percent from 27 percent in 2014. Additionally, network performance and reliability satisfaction among customers with premium speed Internet is 751 vs. 695 among those without premium speed Internet.
Half (50%) of highly satisfied residential Internet customers (overall satisfaction scores of 900 or higher) say they “definitely will not” switch providers in the next 12 months, compared with only 9 percent of dissatisfied customers (scores below 550) who say the same.
Residential Telephone Service Provider Satisfaction Study
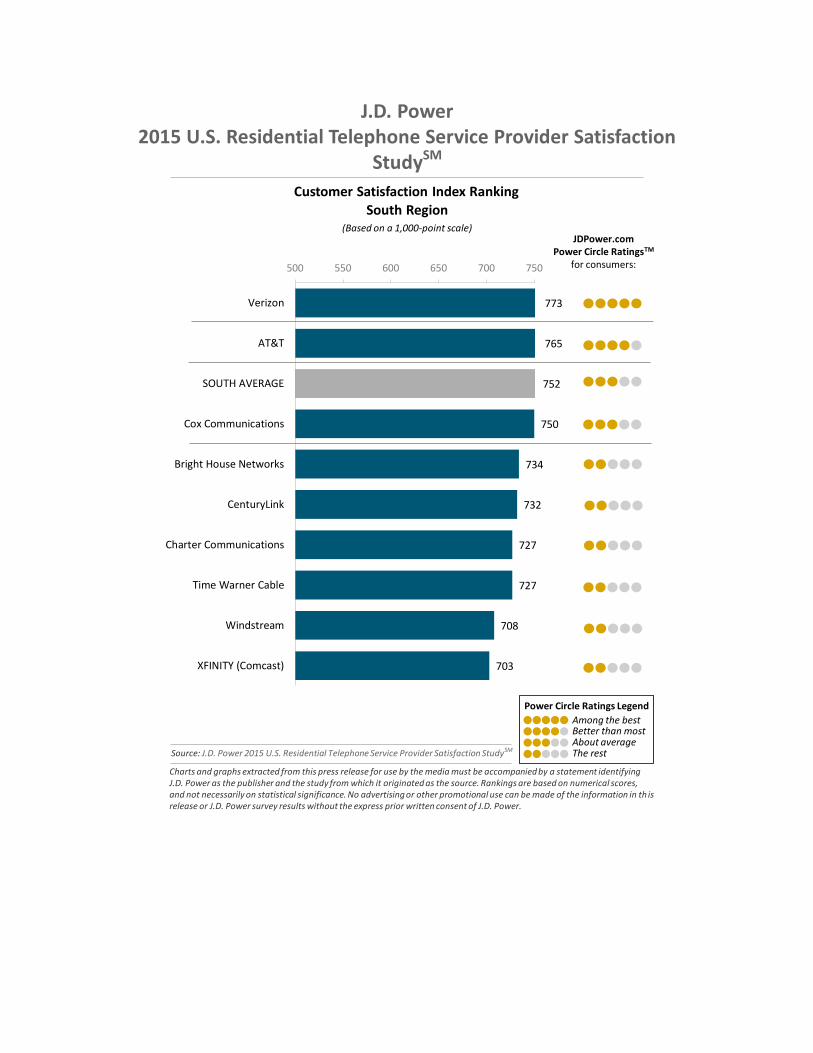
AT&T ranks highest in telephone customer satisfaction in the North Central and West regions (758 each); Verizon ranks highest in the East (769) and South (773) regions.
At the national level, satisfaction with network performance and reliability is 789, up from 754 in 2014.
Half (50%) of highly satisfied residential telephone customers (overall satisfaction scores of 900 or higher) say they “definitely will not” switch providers in the next 12 months, compared with only 10 percent of dissatisfied customers (scores below 550) who say the same.
The 2015 U.S. wireline studies are based on responses from 30,947 customers nationwide who evaluated their cable/satellite TV, high-speed Internet and telephone service providers. The studies were fielded in four waves: November 2014, February 2015, April 2015 and July 2015. Media Relations Contacts John Tews; Troy, Mich.; 248-680-6218; [email protected] About J.D. Power and Advertising/Promotional Rules www.jdpower.com/about-us/press-release-info About McGraw Hill Financial www.mhfi.com

# # # (Page 3 of 3)
Note: Thirteen charts follow.

Source: J.D. Power 2015 U.S. Residential Television Service Provider Satisfaction StudySM
East Region(Based on a 1,000-point scale)
771
757
756
721
707
705
689
686
500 550 600 650 700 750
DIRECTV
DISH Network
Verizon FiOS
EAST AVERAGE
Optimum (Cablevision)
Cox Communications
XFINITY (Comcast)
Time Warner Cable
Charts and graphs extracted from this press release for use by the media must be accompanied by a statement identifying J.D. Power as the publisher and the study from which it originated as the source. Rankings are based on numerical scores, and not necessarily on statistical significance. No advertising or other promotional use can be made of the information in th is release or J.D. Power survey results without the express prior written consent of J.D. Power.
JDPower.comPower Circle RatingsTM
for consumers:
Among the bestBetter than mostAbout averageThe rest
Power Circle Ratings Legend
J.D. Power2015 U.S. Residential Television Service Provider Satisfaction
StudySM
Customer Satisfaction Index Ranking
Source: J.D. Power 2015 U.S. Residential Television Service Provider Satisfaction StudySM
North Central Region(Based on a 1,000-point scale)
750
750
735
721
710
689
688
666
500 550 600 650 700 750
AT&T U-verse
DIRECTV
DISH Network
WOW! (Wide Open West)
NORTH CENTRAL AVERAGE
XFINITY (Comcast)
Charter Communications
Time Warner Cable
Charts and graphs extracted from this press release for use by the media must be accompanied by a statement identifying J.D. Power as the publisher and the study from which it originated as the source. Rankings are based on numerical scores, and not necessarily on statistical significance. No advertising or other promotional use can be made of the information in th is release or J.D. Power survey results without the express prior written consent of J.D. Power.
JDPower.comPower Circle RatingsTM
for consumers:
Among the bestBetter than mostAbout averageThe rest
Power Circle Ratings Legend
J.D. Power2015 U.S. Residential Television Service Provider Satisfaction
StudySM
Customer Satisfaction Index Ranking
Source: J.D. Power 2015 U.S. Residential Television Service Provider Satisfaction StudySM
South Region(Based on a 1,000-point scale)
777
763
758
750
729
716
713
709
699
690
682
500 550 600 650 700 750
Verizon FiOS
AT&T U-verse
DISH Network
DIRECTV
SOUTH AVERAGE
Cox Communications
Bright House Networks
Charter Communications
Time Warner Cable
Suddenlink
XFINITY (Comcast)
Charts and graphs extracted from this press release for use by the media must be accompanied by a statement identifying J.D. Power as the publisher and the study from which it originated as the source. Rankings are based on numerical scores, and not necessarily on statistical significance. No advertising or other promotional use can be made of the information in th is release or J.D. Power survey results without the express prior written consent of J.D. Power.
JDPower.comPower Circle RatingsTM
for consumers:
Among the bestBetter than mostAbout averageThe rest
Power Circle Ratings Legend
J.D. Power2015 U.S. Residential Television Service Provider Satisfaction
StudySM
Customer Satisfaction Index Ranking
Source: J.D. Power 2015 U.S. Residential Television Service Provider Satisfaction StudySM
West Region(Based on a 1,000-point scale)
761
760
756
754
729
724
709
685
682
673
500 550 600 650 700 750
DISH Network
DIRECTV
AT&T U-verse
Verizon FiOS
CenturyLink
WEST AVERAGE
Cox Communications
Charter Communications
XFINITY (Comcast)
Time Warner Cable
Charts and graphs extracted from this press release for use by the media must be accompanied by a statement identifying J.D. Power as the publisher and the study from which it originated as the source. Rankings are based on numerical scores, and not necessarily on statistical significance. No advertising or other promotional use can be made of the information in th is release or J.D. Power survey results without the express prior written consent of J.D. Power.
JDPower.comPower Circle RatingsTM
for consumers:
Among the bestBetter than mostAbout averageThe rest
Power Circle Ratings Legend
J.D. Power2015 U.S. Residential Television Service Provider Satisfaction
StudySM
Customer Satisfaction Index Ranking

East Region(Based on a 1,000-point scale)
738
703
700
695
679
665
500 550 600 650 700 750
Verizon
Cox Communications
EAST AVERAGE
Optimum (Cablevision)
XFINITY (Comcast)
Time Warner Cable
Charts and graphs extracted from this press release for use by the media must be accompanied by a statement identifying J.D. Power as the publisher and the study from which it originated as the source. Rankings are based on numerical scores, and not necessarily on statistical significance. No advertising or other promotional use can be made of the information in th is release or J.D. Power survey results without the express prior written consent of J.D. Power.
J.D. Power2015 U.S. Residential Internet Service Provider
Satisfaction StudySM
JDPower.comPower Circle RatingsTM
for consumers:
Among the bestBetter than mostAbout averageThe rest
Power Circle Ratings Legend
Source: J.D. Power 2015 U.S. Residential Internet Service Provider Satisfaction StudySM
Customer Satisfaction Index Ranking
Note: AT&T and Frontier Communications (formerly AT&T) are included in the study and regional averages but not ranked due to recent acquisition of AT&T wireline services in the East region
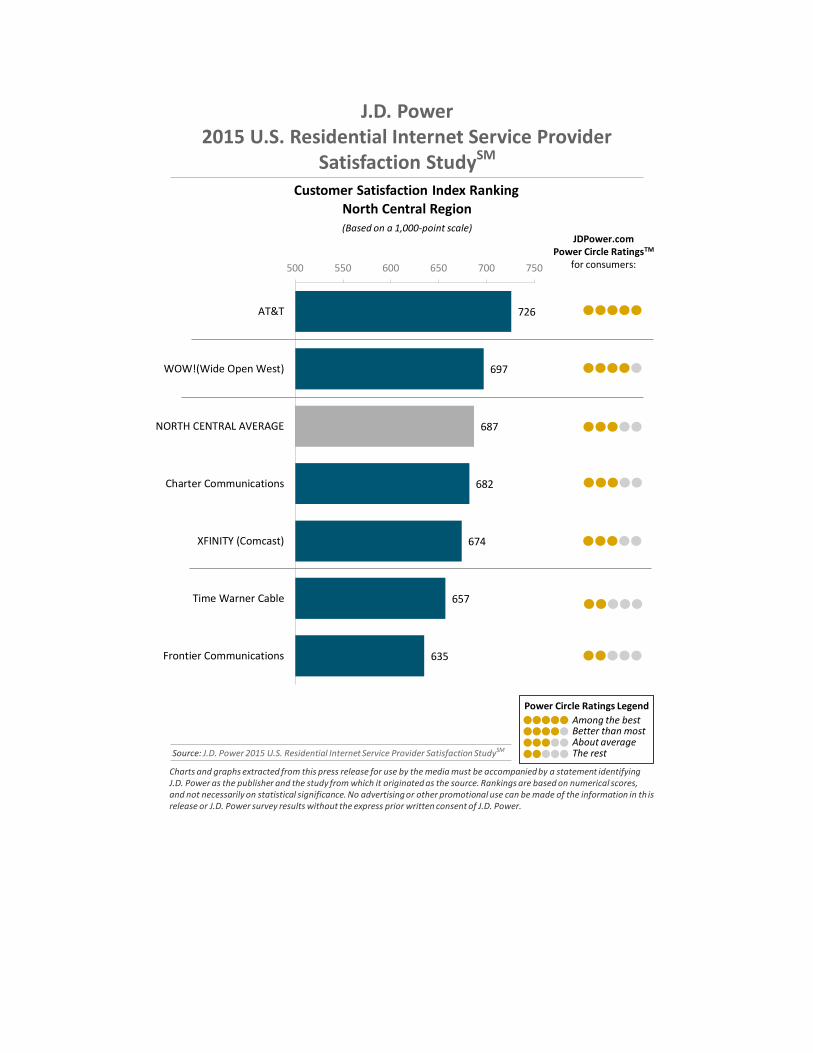
North Central Region(Based on a 1,000-point scale)
726
697
687
682
674
657
635
500 550 600 650 700 750
AT&T
WOW!(Wide Open West)
NORTH CENTRAL AVERAGE
Charter Communications
XFINITY (Comcast)
Time Warner Cable
Frontier Communications
Charts and graphs extracted from this press release for use by the media must be accompanied by a statement identifying J.D. Power as the publisher and the study from which it originated as the source. Rankings are based on numerical scores, and not necessarily on statistical significance. No advertising or other promotional use can be made of the information in th is release or J.D. Power survey results without the express prior written consent of J.D. Power.
J.D. Power2015 U.S. Residential Internet Service Provider
Satisfaction StudySM
JDPower.comPower Circle RatingsTM
for consumers:
Among the bestBetter than mostAbout averageThe rest
Power Circle Ratings Legend
Source: J.D. Power 2015 U.S. Residential Internet Service Provider Satisfaction StudySM
Customer Satisfaction Index Ranking
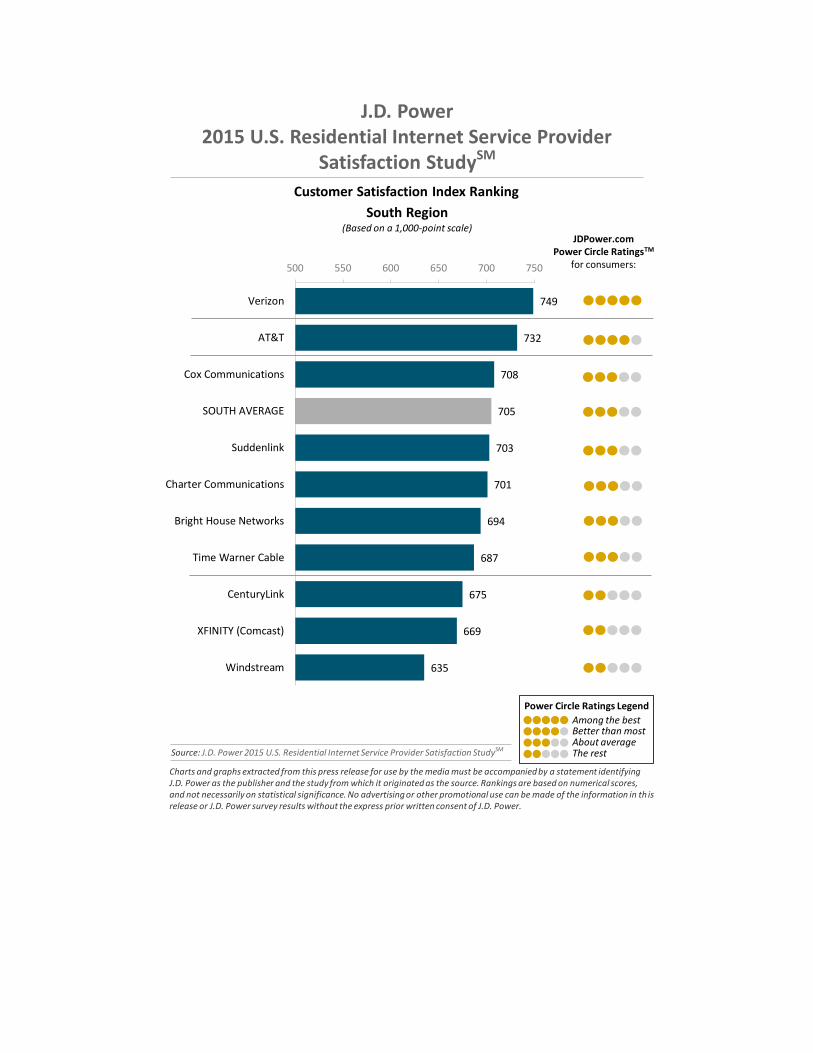
South Region(Based on a 1,000-point scale)
749
732
708
705
703
701
694
687
675
669
635
500 550 600 650 700 750
Verizon
AT&T
Cox Communications
SOUTH AVERAGE
Suddenlink
Charter Communications
Bright House Networks
Time Warner Cable
CenturyLink
XFINITY (Comcast)
Windstream
Charts and graphs extracted from this press release for use by the media must be accompanied by a statement identifying J.D. Power as the publisher and the study from which it originated as the source. Rankings are based on numerical scores, and not necessarily on statistical significance. No advertising or other promotional use can be made of the information in th is release or J.D. Power survey results without the express prior written consent of J.D. Power.
J.D. Power2015 U.S. Residential Internet Service Provider
Satisfaction StudySM
JDPower.comPower Circle RatingsTM
for consumers:
Among the bestBetter than mostAbout averageThe rest
Power Circle Ratings Legend
Customer Satisfaction Index Ranking
Source: J.D. Power 2015 U.S. Residential Internet Service Provider Satisfaction StudySM
Source: J.D. Power 2015 U.S. Residential Internet Service Provider Satisfaction StudySM
West Region(Based on a 1,000-point scale)
731
729
695
689
686
685
669
664
639
500 550 600 650 700 750
Verizon
AT&T
Cox Communications
WEST AVERAGE
CenturyLink
Charter Communications
Time Warner Cable
XFINITY (Comcast)
Frontier Communications
Charts and graphs extracted from this press release for use by the media must be accompanied by a statement identifying J.D. Power as the publisher and the study from which it originated as the source. Rankings are based on numerical scores, and not necessarily on statistical significance. No advertising or other promotional use can be made of the information in th is release or J.D. Power survey results without the express prior written consent of J.D. Power.
JDPower.comPower Circle RatingsTM
for consumers:
Among the bestBetter than mostAbout averageThe rest
Power Circle Ratings Legend
J.D. Power2015 U.S. Residential Internet Service Provider
Satisfaction StudySM
Customer Satisfaction Index Ranking

Source: J.D. Power 2015 U.S. Residential Telephone Service Provider Satisfaction StudySM
East Region(Based on a 1,000-point scale)
769
746
742
732
711
705
684
500 550 600 650 700 750
Verizon
EAST AVERAGE
Cox Communications
Optimum (Cablevision)
XFINITY (Comcast)
Time Warner Cable
Frontier Communications
Charts and graphs extracted from this press release for use by the media must be accompanied by a statement identifying J.D. Power as the publisher and the study from which it originated as the source. Rankings are based on numerical scores, and not necessarily on statistical significance. No advertising or other promotional use can be made of the information in th is release or J.D. Power survey results without the express prior written consent of J.D. Power.
JDPower.comPower Circle RatingsTM
for consumers:
Among the bestBetter than mostAbout averageThe rest
Power Circle Ratings Legend
J.D. Power2015 U.S. Residential Telephone Service Provider Satisfaction
StudySM
Customer Satisfaction Index Ranking
Note: AT&T and Frontier Communications (formerly AT&T) are included in the study and regional averages but not ranked due to recent acquisition of AT&T wireline services in the East region

Source: J.D. Power 2015 U.S. Residential Telephone Service Provider Satisfaction StudySM
North Central Region(Based on a 1,000-point scale)
758
747
740
739
720
706
699
698
500 550 600 650 700 750
AT&T
WOW! (Wide Open West)
CenturyLink
NORTH CENTRAL AVERAGE
Charter Communications
XFINITY (Comcast)
Frontier Communications
Time Warner Cable
Charts and graphs extracted from this press release for use by the media must be accompanied by a statement identifying J.D. Power as the publisher and the study from which it originated as the source. Rankings are based on numerical scores, and not necessarily on statistical significance. No advertising or other promotional use can be made of the information in th is release or J.D. Power survey results without the express prior written consent of J.D. Power.
JDPower.comPower Circle RatingsTM
for consumers:
Among the bestBetter than mostAbout averageThe rest
Power Circle Ratings Legend
J.D. Power2015 U.S. Residential Telephone Service Provider Satisfaction
StudySM
Customer Satisfaction Index Ranking
Note: Verizon is included in the study and regional averages but not ranked in the North Central region due to insufficient sample
Source: J.D. Power 2015 U.S. Residential Telephone Service Provider Satisfaction StudySM
South Region(Based on a 1,000-point scale)
773
765
752
750
734
732
727
727
708
703
500 550 600 650 700 750
Verizon
AT&T
SOUTH AVERAGE
Cox Communications
Bright House Networks
CenturyLink
Charter Communications
Time Warner Cable
Windstream
XFINITY (Comcast)
Charts and graphs extracted from this press release for use by the media must be accompanied by a statement identifying J.D. Power as the publisher and the study from which it originated as the source. Rankings are based on numerical scores, and not necessarily on statistical significance. No advertising or other promotional use can be made of the information in th is release or J.D. Power survey results without the express prior written consent of J.D. Power.
JDPower.comPower Circle RatingsTM
for consumers:
Among the bestBetter than mostAbout averageThe rest
Power Circle Ratings Legend
J.D. Power2015 U.S. Residential Telephone Service Provider Satisfaction
StudySM
Customer Satisfaction Index Ranking

Source: J.D. Power 2015 U.S. Residential Telephone Service Provider Satisfaction StudySM
West Region(Based on a 1,000-point scale)
758
757
743
740
729
723
710
707
500 550 600 650 700 750
AT&T
Verizon
Cox Communications
WEST AVERAGE
CenturyLink
Charter Communications
Time Warner Cable
XFINITY (Comcast)
Charts and graphs extracted from this press release for use by the media must be accompanied by a statement identifying J.D. Power as the publisher and the study from which it originated as the source. Rankings are based on numerical scores, and not necessarily on statistical significance. No advertising or other promotional use can be made of the information in th is release or J.D. Power survey results without the express prior written consent of J.D. Power.
JDPower.comPower Circle RatingsTM
for consumers:
Among the bestBetter than mostAbout averageThe rest
Power Circle Ratings Legend
J.D. Power2015 U.S. Residential Telephone Service Provider Satisfaction
StudySM
Customer Satisfaction Index Ranking

Source: J.D. Power 2015 U.S. Residential Television Service Provider Satisfaction StudySM; J.D. Power 2015 U.S. Residential Internet Service Provider Satisfaction StudySM; J.D. Power 2015 U.S. Residential Telephone Service Provider Satisfaction StudySM
Charts and graphs extracted from this press release for use by the media must be accompanied by a statement identifying J.D. Power as the publisher and the study from which it originated as the source. Rankings are based on numerical scores, and not necessarily on statistical significance. No advertising or other promotional use can be made of the information in th is release or J.D. Power survey results without the express prior written consent of J.D. Power.
J.D. Power 2015 U.S. Residential Television Service Provider Satisfaction StudySM;
J.D. Power 2015 U.S. Residential Internet Service Provider Satisfaction StudySM;
J.D. Power 2015 U.S. Residential Telephone Service Provider Satisfaction StudySM
Award-Eligible Telecom Providers Included in the Studies
Company Name CEO Name Company Address
AT&T, Inc. Randall Stephenson Dallas, Texas
Bright House Networks, LLC Steve Miron East Syracuse, N.Y.
Cablevision Systems Corporation James Dolan Bethpage, N.Y.
CenturyLink, Inc. Glen Post Monroe, La.
Charter Communications, Inc. Thomas Rutledge Stamford, Conn.
Comcast Corporation Brian Roberts Philadelphia, Pa.
Cox Communications, Inc. Patrick Esser Atlanta, Ga.
Dish Network Corp. Charles Ergen Englewood, Colo.
Frontier Communications Corporation Daniel McCarthy Norwalk, Conn.
Suddenlink Communications Jerald Kent St. Louis, Mo.
Time Warner Cable Inc. Robert Marcus New York, N.Y.
Verizon Communications Inc. Lowell McAdam New York, N.Y.
WideOpenWest Networks, LLC Steven Cochran Englewood, Colo.
Windstream Communications, LLC Anthony Thomas Little Rock, Ark.