improved bridge method for the measurement of core losses
TRANSCRIPT

Journal of Research of the National Bureau of Standards Vol. 60, No. 5, May 1958 Research Paper 2865
Improved Bridge Method for the Measurement of Core Losses in Ferromagnetic Materials at High Flux Densities
William P. Harris and Irvin 1. Cooter
Accurate core-loss measurements at high flux densities can be made by bridge methods if t he power di sipated in t he pr imary circui t at harmonic frequ encies is measured and ubtracted from the apparent power dissipated in the ferromagnetic material at fundamental freq uency. The determination of this harmonic power term is inconvenient, and must be done with greater accuracy than that required in t he final r esul t. An amplifier having negative output resistance was devised and is used in a manner that a utomatically allow accurate compensation for the harmon ic power dissipation.
1. Introduction
In two previous papers by the present authors [1 , 2] \ it was shown that accurate results can be obtained by llsmg tlle a-c bridge to measure core losses in felTomagnetic materials at high Dux densities only by determining and applying a " harmonic power" correction. The method described involved the measurement of several harmonic-frequ ency components, 1", of t he exciting current and the computation of the correction term as the summation of all the I~Rp terms of sufficient magnitude to affect the r esul t , where Rp is th e total resis tance of the circuit carrying the exciting current. Since terms as high as the 13th harmonic were not uncommon , the method was complicated and rather low, and required very accurate m easurements with a sharply t.uned voltmeter.
The present paper describes a m ethod of measurem ent employing a power source havin,g current feedback used in such a way as to make the circuit elfcompensating with respect to " harmonic power" . The result is that accurate m easurements can now be mad e much more conveni ently than by the previous method.
2 . Theory and Principles
The Maxwell-Wien bridge, useclwith an Epstein test frame, is one of several circuits used for the measurement of core losses in specimens of ferromagnetic material. This circuit is depictcd in figure 1, and tb e equivalen t-circuit diagram is shown in figure 2. The inductance, L 'I , and th e resistance, Ra, arc both caused by the presence of the ferromagnetic material in the test frame, and are nonlinear because of the nature of the hys teresis cycle of the material. This nonlinearity gives rise to hal'1110ni c-frequency components in current 1, even with source E s upplying a distortionless sine wave voltage. It is the power dissipated at these harmonic freq uencies in the resistive clements of the circuit ('2I~Rp) that causes the difficulties encountered when this circuit is used to measure core losses at high flux densities.
Pl'eviollsly, core losses were computed from the product PRa, where 1 is the l'ms value of the current,
I F igures in brackets ind ieat e the literature references at the end <>f this paper
509
E PS TEIN TEST FRAME
~----+-~~---{~r-~------------------~
I L- _______ _ J
FW URE 1. Al axwell-Wien bl·idge circuit for meas1lring core losses, llsing Epstein test frame.
I---------~
I ~----r___'VV'~--_{ "'-}__+---------------------'
Es --- ______ '
F I GURE 2. Equivalent-circuit diagram of the circuit shown in figu re 1.

and Rd is the resistance associated with the ferromagnetic material in the test frame. Rd was usually determined at fundamen tal frequency from t he bridge balance equations and the values of Ra , R b , and Re at balancc, indicated by the tuned detector, D. The authors have shown [1 ,2] that the term PRa includes not only the power dissipated in the iron but also all the power dissipated at harmonic fr equencies in all the linear resistive elements of the circuit. The true core loss is then given by
Pe= IiRa- J:, I hR p,
where 11 is the fundamental frequency component of the exciting curren t. The correction term J:,I~Rp is negligible at low flux densities, but increases very rapidly at flux densities above 12 or 13 kilogausses in ordinary silicon-iron core materials, becoming several times as large as the true core losses as saturation is approached. A great burden of accuracy is thus put on th e determination of the correction term. For example, if the J:,I~Rp is four times P c, then to attain accuracy of 2 percen t in the measurement of Pc, i t is n ecessary to measure J:,I~Rp to better than 0.5 p ercent. The method used in the original investigation and described in the reports thereon [1 ,2] was sufficiently accurate, but rath r complicated and inconvenient. It involved the measurement of each significant harmonic current, which included harmonics as high as the 13th at the highest flux densities measured, along with the determination of R p , taking into account the changes of resistance with changing temperature. The measurement of R p is further complicated by the fact that it includes the source resistance, Rs.
It was desired to devise a more convenient method of making core-loss meaS UTements with an accuracy of 1 or 2 percent. This end would be achieved if the correction term J:,I~Rl} could be reduced to zero. This could be done if the harmonic currents I II, could be eliminated, or if th e ohmic resistance Rp could be reduced to zero. Although it is possible to suppress harmonics in the exciting current, this procedure is undesirable because it produces harmonics in the secondary voltage of sufficient ampli- . tude to seriously distort the waveform. The usual practice is to strive for the conditions that will yield least distortion in the secondary voltage, and in fact measurements are ordinarily corrected to indica te what the core losses w·ould be with a perfectly sinusoidal voltage wave .
The second alternative, the reduction of R 1} to zero, was the one used in this investigation. It is t he practice to reduce the resistance of the primary circuit to a minimum in order to reduce distortion in the secondary voltage ,vaveform. But there is a limit to how far this can be carried by the usual means, such as using heavier wire, short leads, lowervalued bridge arms, etc. In order for the bridge to fle useful at all, Re must have a value high enough to measure convenien tl.'~ . In the present work, 1 ohm was found to be the lowest practical value for R e. The test-frame winding has appreciable r esist-
ance, ranging from 0.2 ohm to several ohms for practical sizes. Leads, power SO UTce, switches, etc, unavoidably add their contributions, bringing the least practicable values of primary r esistance to more than 2 ohms in most cases. The elimination of th e resis tance that remains after the measures menboned ha ve been rmpJ oyed is the heart of the problem.
In order to reduce tbe total resistance , R p , to zero, we have mercly to add this same absolute value of negative resistance. Fortunately, this is no longer a fanciful wish. For about 25 years , electronic circuits having negative resistance properties, chiefly feedback amplifiers, have been known [3 , 4, 5, 6, 7,8, 9] . More recently the use of feedback to control the internal impedance of amplifier and other circuits has grown so widespread and so much has been published on t he subj ect, tbat it is impossible to refer to all applicable publications. Those few cited should serve as a suitable point of departure for those wisl1ing to pursue this subj ect.
For the present work, a high quality, 200-w amplifier was used. This amplifier had the usual feedback loops for achieving stable, distortion-free operation over a wide range of frequency. In addition, a special loop of curren t feedback was employed to alter the output impedance, making it possible to achieve reasonable values of negative impedance with controllable, stable operation. The essential elements of this feedback: method, and the means employed to adjust it to give exactly the correct magnitude of negative resistance to counteract the positive resistance of the circuit , are described in the next seetion of this paper.
An alternative method of approach to the harmonic-dissipation problem is to consider the circuit as containing a series of harmonic generators, each receiving energy from the main source via the fundamental-frequency current, and delivering it to the circuit at harmonic frequency via harmonic-frequency currents. If this view is taken, the presen t arrangement is then a means of removing the harmonic generators from the bridge arm containing the ferromagnetic-corcd test frame, putting them instead in the main power source. This view is supported by measuremen ts of voltages at the harmonic frequ encies appearing across the various elem ents of the circuit, with and without compensation, as described in the next section.
3. Experimenta l Procedure
3.1. Simultaneous Mea surements
The inclusion of a wattmeter in the circuit , as described in the previous investigation [1 , 2], provides a reference measurement made under identical conditions . This feature was found valuable, and was used in the present work. Figure 3 shows the wattmeter, lV, with its potential coil connected to the secondary of the test frame, and its current coil in series with the bridge. It was found desirable to connect the current coil outside the bridge rather than in the arm containing the test frame, as was
510
I - - - -- - - - -! I
Rs I I Es I I _________ ~
:FI GU RE 3. Nlethod of connecting wattmeter, lV, for' making simultaneous measurements.
done in the preceding inves tiga tion. Small cha nges in the resistance of the current coil caused less difficulty wh en no t included within the bridge arms. Th e bridge arm, Ra, was disconnected while reading the wattmeter in order to eliminate th e small current in the parallel path 2 through Ra , R o, and Gb. All measurements were made in simultaneous pairs, and t he agreement of the two methods was used as the criterion of the new m ethod.
3.2. Equipment
Essential to the success of the m ethod is Lh e special power source used . This source must have the property of presen ting itn apparent illLel'l1 al impedance that is negative, and of precisely controllable magnitude. For precise measuremenLs the ou Lpu L voltage of th e source must be very stable in mag nitude, because Lhe impedance of the Lest frame wiLh ferromagneLic core is a function of t he current Ul
the primary wind ing. Thus, at bigh flux densities, a small vari ation in so urce volLage causes a relatively large change in the bridge balance parameters.
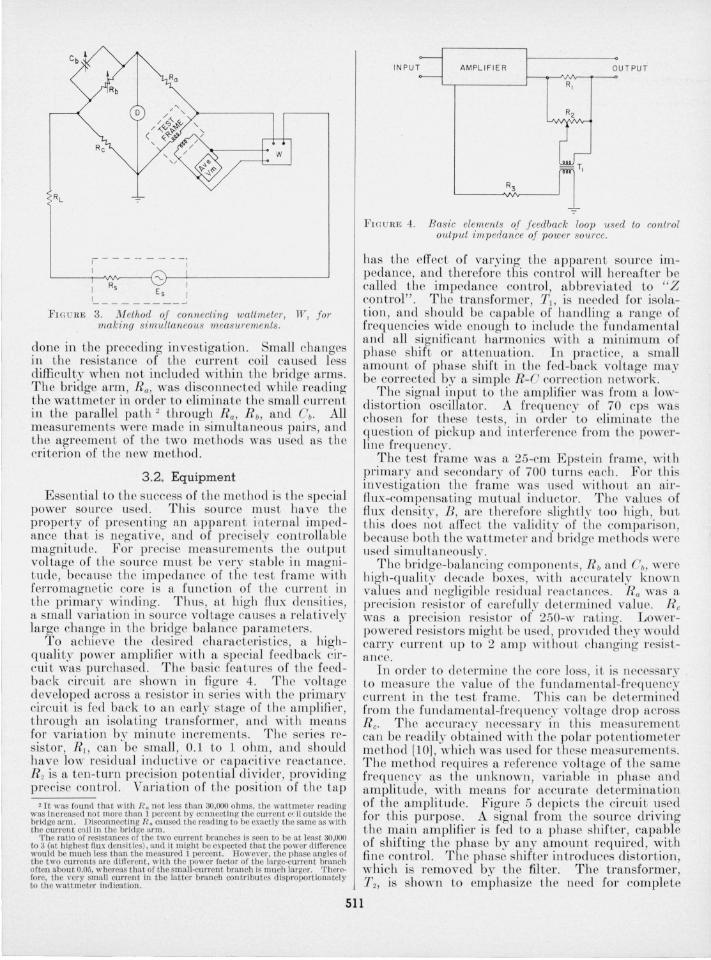
To achieve the desired characterist ics, a highqu ali tv power ampli:fier with a special feedback circuit ,vas purchased. The bas ie fe aLures of the feedback circuit are shown in figure 4. The voltage developed across a resistor in series with Lbe primary circuit is fed back to an earl,\T stage of the amplifier, LhrouO'h an isolating Lransformer , a nd wi th means for v:riation bv minute increments. The series resistor, E l , can ' be small, 0.1 to 1. ohm, and should have low residual inducLive 01' capacit ive reactance. R 2 is a ten-turn precision potential divid er , providillg precise control. Variation of the position of the tap 'It was [o wld that with R" not less than 30,000 ohms, the wattmeter reading
was increased not more than 1 pcrcent by ccnnceti ng tbe eUITcn t cr j\ outs jde the bridge arm . DiscOWlecting R" caused the read ing to be exactly the same as with the current eoil in tbe bridge arm.
'rhe rat io o[ resistances of the two current branches is seen to be at least 30,000 to 3 (at highest flux densities), and it might be expected that the power diffcrence would be mu ch less than the measuredl percen t. However, the phase angles of tho two currents arc diJTercnt, with the power factor of the largc-curre nt branch orten about 0.05 whereas that of the small·current branch is much larger. '1'here· [ore, the very S~1a1l curren t in the latter branch contributes disproportionately to the wattmeter indication.
AMPLIFIER OUTPUT
R,
FrG URE 4. Basic elements of fe edback loop 1tsed to conl1'ol output impedance of power source.
has the effect of varying the apparent source impedance, and therefore this control will hereafter be called t he impedance control, abbreviated to liZ control" . The transformer, TI , is needed for isolation, and should be capable of handling a range of frequen cies wid e enough to include the fundamenLal and all significant harmonics with a minimum of phase shift 01' attenuation. In practice, a mall amount of phase shift in t he fed-back volLage ma:" be corrected by a simple R-C correction net·work.
The signal inpu t Lo th e amplifier was from a lowdistortion osc illator. A frequency of 70 cps was chosen for these tests, in order to eliminate the qu estion of pickup and interference from the pO'werline frequency.
The test frame was a 25-cm Epstein frame, w'ith primary a nd seco ndary of 700 turns each . For Lhis in vestigation Lhe frame wa . used without an alI'flux-compensating mutual indu ctor. The values of flux density, B , are th erefore sligh tl.v too higb '. but this does no t affect the validi t~, of t he compal'Json , because both the wattmeter and bridge methods were used simulLaneously.
Tb e bridge-balancing compon el1ts, Ro and Ob, \ver e high-quality decade boxes, with accmately known valu es a nd negligi ble res id ual reactances, Ra was a precision r es istor of carefully determined value. Re was a precision resistor of 250-w rating, Lowerpowered resistors might be used, prOVIded they would carry current up to 2 amp wilhouL changing resistance.
In order to determine lhe core loss, iL is necessary to measure Lhe value of th e fundamental-frequency current in the test frame. This ca n be detennined fmm t he fundamental-frequ ency volLage drop ac ross R e. The accuracy necessary in this measurement can be read ily obtained wilh the polar poLentiometer method [10], which was used for th ese measurements. The m ethod r equires a refer ence voltage of the sam e frequ ency as the unknown, variable in phase a:nd ampli t ude, with means for accurate determInatIOll of the amplitude. Figure 5 depicLs the circuit used for this purpose. A signal from the source driving the main ampl ifier is fed to a phase shifter , capable of shifting the phase by any amount required, with fine control. The phase shifter in troduces distortion, wbich is removed by the tilter . The transformer, T" is shown to emphasize the need for complete
SIl

MAIN POWER
AMPLIFIER
FIGUR E 5 . Polar potentiometer used to measure the voltage drop across R c.
isolation. A feedback connection to th e output side of the output transformer is often found on power amplifiers, and this could render the apparatus unusable unless isolation is employed. I solation is especially important for m easuremen t of the vol tage drop across a resistor, if both ends of the resistor are operating at nonground potentials.
The accuracy of the m ethod is de termined largely by the next two elements, the reference voltmeter , 17, and precision ratio transformer, PRT. The variable-phase reference voltage is applied t o the IJrimaryof the PET, and measured by the reference voltmeter , V. The PBT used has five decade switches, by which the output voltage may be varied in steps as small as 1 X 10- 5 times the input voltage. The voltmeter, V, was adjusted to have a zero scale correction at the reference input voltage, and care was taken to maintain the input at this level throughout th e measurements. All measured voltages were then determined in terms of a ratio , read from the PRT, times the reference voltage . The accuracy of the measurement of the fundamental-frequency current is estima.ted to be within ± 0.2 percent .
In use, the phase shifter and the PRT p.re adjusted so that the detector, D , tuned to the fundamental frequency, reads a null . Under these conditions , the output from the PRT matches the fundamental component of the unknown in phase and amplitude.
It is obvious that the apparen t loss measured by the bridge is profoundly affected by the setting of the Z con trol. One of the major problems of this investigation was to devise a means of setting the Z control at the proper point.
It is relatively easy to find the proper setting to compensate for those elements of the circuit whose terminals are accessible. This is evident from a consideration of figure 6, which shows the basic elements of such a circuit as tha t with which we are concerned. If a tuned detector, such as a wave analyzer, is connected to points 1 and 2, and tuned to the third harmonic of the fundamental frequency,
4 Rwm
3
r;T--------- - , I Rs Rs I
~--._~~~~--~vvv_----_i~ ~--~--~ 2
IN ' I egal lve
'------------F IGURE G. The primary circu it , showing how comp ensation
f or part of the circuit )'esistance m ay be achieved by varying the n egative sotU'ce resistance, R ,'.
a setting of the Z control can be found that will yield a minimum deflection of the detector. This is done with the amplifier supplying a current large enough to produce considerable harmonic components. At this setting, the source resistance , B., has been compensated by making Bs' equal in mag ni.tude and opposite in sign to E s. If now the detector is moved to poin ts 2 a nd 3, and again the Z control is adjusted to produce a mini.mum deflection, the resistor, B e, is also compensated , and R s'=(Rs+ B e). By co nnecting to points 3 and 4, we ca,n compensate for B s, Re, and Rwm. But h8l'e this method ends, for the resistance of the primar y winding of the test frame , Rw , which remains to b e compensated, is not separately available to us; it is associated with La and Rd between the terminals of the test frame.
This problem was solved by making a resistor , Rw", exactly equal in resistance 3 to Rw, and insel't-
3 R . is the ohmic or d·e resistance of the tes t frame primary windin g. ,[' herefore, R wll is a "puren resistance, L e., with negligible induciive or capacitive 1'e· actanco. 'l"he d-c a.nd a-c resistan ce of R ~ and R TJJfI are equal.
3
R" w
6
r - - - - - - - - - - - -I
4 Rw m
I R~ Rs I '- l--'----~
INeg oliY' E : I s ____________ J
FIGUR E 7. Circu it with Rw" added, by m eans of which complete compensation may be achieved .
512

ing it in the circuit as shown in figure 7. If the detec tor were connected to points 3 and 5, and the Z control adjusted for minimum deflection, compensation would be effected for H" He, Hwm, and Hw" . If we could connect the detector to point 3 and the phantom point 7, we could achieve complete compensation for all the ohmic resistance of the circuit.
The transformer, Ta, provides the means for a virtual connection to the phantom poin t 7. The ratio of this transformer is precisely unity, and its phase shift negligible. The secondary can be connected in such away that the voltage induced in it opposes the IR drop in H w ' Since the voltage on the primary of Ta is Lhe IR drop in Rw" , which was made to equal Hw , the induced voltage just equals the IR drop in Hw, and by co nnecting to 3 and 6, we get the same effect a if we were a,ble to connect to 3 and 7. All that remains is to adjust the Z control for a minimum deflection.
The method of settingLhe Z control, using the third harmonic produced by the i ron, leaves something to be de ired. The main power amplifier inevi ta bly produces some harmonic distortion in its own circuit, and this is indistinguishable from Lhat produced by the iron , so that the fin al setting of the Z control is affected by an unwanted factor . The method yields usable results if the amplifLer distortion is k:ept low enough, but this is a difficult task at the power levels required for testing.
An alternative method of setting the 7- control was deviscd , which avoids the difficulty pointed out above . All tllat is required is a voltage , to be int roduced into the circuit a,t some poin t externa.l to the main amplifier without changing the ohmic rcsistance of the circuit . This ca n be achi.eved in practice by applyi ng a voltage to the secondary winding of the test frame , with the specimen in the frame acting as the core of a transformer , and inducing a voltage in the primary windi ng of the frame. The detector , connected as before, is tlilled to the frequency of the inj ected voltage , and the 7- control set by this means.
It was found that the setting of the Z control was slightly dependen t upon the amplitude of the inj ected voltage. Best results were obtained by adjusting this amplitude to yield about the same rms current in the primary circuit with only the inj ected voltage, operating through the feedbaek circuit (i. e., no input to the main amplifier input terminals) as the rms current existing und er testing conditions. That is, for a test point requiring exciting current of 1 amp rms, the Z control was set wiLh the inj ected voltage adj usted to give 1 amp rms in the primary circuit. The differen ce in Z control settings made with various inj ected vol tages was small , however, and could be neglected if errors approaching 3 to 5 percent were allowed.
An obvious advantage of this latter method is that the frequency of the inj ected voltage may be chosen at will. By choosing several frequencies covering the range of the predominant harmonics of the frequency used for the tests, it was determined that
the setting of the Z control was practically the ame for all frequencies in this range (50 to 700 cps). If this were not so, it would indicaLe thfit Lhe equipment was not uitable for usc in this manne!', for the predominant h armonics mu t all be compensated simultfineou ly in order to get accuraLe result . In practice, a frequency of 200 to 350 cp wa used.
It is nece ary to consider the effect on the pl'imal'Y circuit resistance of the transien ed impedance of the auxiliary circuit supplying the injected voltage. If this transferred impedance altered the net resistance of the primary circui t, then the Z control would be set wrongly. But no enol'S arise here, because as the Z control approaches the correct setting, the net resistance of the primary circuit approaches zero, and the resistive component of the transferred impedance paralleling this zero resistance docs not al ter the total. This was verified experimen tally. Variou taps of the transformer in the aux:iliary injection circui t were tried, and various loads co nnected across the frame between poinLs 8 and 9 of figure 7. In fill cases, Lhe seLting of the Z control was unaffected. Th at this set ting also yielded con ect core-los measurements is fur ther proof that no significant error arose from this source.
When the distortion inlroduced by the main power amplifier was less th an about 0.1 percent, the inj ected-voltage method of setting the Z control agreed wi th the method using the iron-produced h armonics as described previously. Both methods were used to 0 bLain the data reported herein .
To obtain the power 10 in the iron, the value of Rd , which is the apparent increase in the resistance of the frame , is required. Unavoidably, howevc r, the ohmic rcsistfin ce of the primary winding of Lhe test frame, Hw , i included in the mea ured arm of the bridge. Two methods arc available to separate these t wo components of rcsistance. Hw can be determined independently find ubtracted from the vfilue obtained from the bridge measurement. Alternatively, the ohmic resistance can be compensated by an am;:iliary compon enL in parallel wi th the balancing arm of the bridge, as devised by Diete rly and Ward [ll]. 1'he two method give identical results, and both \v ere used successfully during the course of this investigation.
The complete circuit is shown in figure 8. Selec tor switch es are shown in pl'oper position for balancing the bridge.
3.3. Specimens
Each specimen weighed approximaLely 500 g and consisted of strips 3 em wide and 28 em or 30.5 cm long. Five grades of nonoriented silico n sheets and one grade of oriented-grain material were used for these tests.
3.4. Measurements
With harmonic power losses fully compensated by means of the feedback circuit, the power loss in the iron is simply
Thus, there are but two quantities to measure, I I and Rd.
513

I
----- 1 I
L--~;=t=======~O SCi 11 0 to r
I (Ne ga live) E I
L _~oin_~m...e li!Je..! ___ s __ ~
FIGURE 8. Complete circuit jor making core-loss measurements with self-compensating bridge method.
Before these measurements can be made, however, the Z control mus t be set accurately. Therefore, the procedure described in the next paragraph \\"as follo wed.
The resistor, R',:" (see fig . 8) was adj us ted 4 to match R w. R~, if used, was set to compensate 5 for R w. The specimen was then inserted in the frame, and a signal applied to the secondary winding of the frame (Sw 2 in position a, Elw 3 in position b), with no input to the main amplifier. The detector, tuned to the inj ected-signal frequency, was connected to points 3 and 6 of figure 8 (Sw 1 in position c) . The Z con trol was adjusted to yield a minimum deflection of the detector. The detector was then switched to the main bridge (Sw 1 in position b ), and the secondary of the test frame connected to the wattmeter and voltmeters (Sw 2 in position b). A vol tage was applied through the main amplifier , and the main bridge balanced by means of R b and Ob. The polar potentiometer was then used (Sw 3 in position a, S\\" 1 in position a) to measure the vol tage at fundamental frequency appearing across Re. The rms voltmeter connected to the secondary of the test frame was read, in order to be able to determine the form factor of the vol tage waveform. A reading from the average-indicating voltmeter, used to determine the form factor and flux density, and a reading from the reference wattmetel' (with Ra disconnected) completed the measuremen ts .
' It was fo und that th e highest current used in this investigation , 2 amp, caused the w ind ings to rise 100 0, causing a chan ~e in resistance too large to neglect. 'l'hcreforc, a chart was prepared to indicate the setting of a fin e COlltrol On R'~ , corresponding to the temperature of R w , read from a tb('tJnometcr held in close contact to R w. A hetter method m igh t be to incorporate another windi ng On the test frame to be used as a resistance thermometer in a very-Iowcurrent cI-c bridge circuit.
A similar chart was prepared to determine the setting of R I" as a function of temperature.
, Dirterly and Ward [tl] showed that if R~ (fi g. 8) is made equal to R . R ,/R w,
then Rd= R aR c/ R b. rrh is procedure obviates the necessit y of subtracting R w {Tom each resistance measuremcnt made, fOl" if R :C is not nf.\ed, thrll R d= (R . R dR , )-R w•
4 . Results
The results of a series of measurements are given in table 1. E ach de termination of COl'e loss by th e compensated-bridge method is accompanied by the reference value from the wattmeter method. The last column gives the difference between the two methods. I t will be noted that the greatest difference is 2.5 percent, and that only 6 of t be 46 pairs differ by as much as 1.0 percent.
These same results are given in graphic form in figure 9, where it is evident that excell ent agreement is obtained.
o § o a. cr w a.
'" .... ~ ",'
'" '3 cr w
" o a.
9 8 7 6
5 ....--$~
~ V /~
4 • .,~ ~iP"'
3 ,,' ,/~; ~$--------'r--]:::J;::::=;"'"
2
$....---1~~?8=+/ V'I~I l/~t I ~~
I A: . ~ -~~~~\,,---:;c$ 7 (.,,~<.\l 6 o\'.\
5 o WATTMETER METHOD + COMPENSATED 8RIDGE METHOD
4
3
~
I----
10 12 13 14 15 16 17 18 19 20 FLUX DENSITY, KILOGAUSSES
I
FIGL"R E 9. Com pal'ison of power-loss rneasw'ements made with compensated bridge and wattmeter, at 70 cps.
No correction s werc made for instrument loss or form factor errors, which are ident ical for the two methods.
514
l~

Figure 10 shows the magnitude of the contribution of the compensation method. F or comparison, a series of measurements wa made with the circui t unchanged , excep t that no feedback for compensation was used . The un corrected, or apparent, core loss, I iRd, is shown as the upper curve, diverging more and more (as fiux densi ty is increased ) from the true core loss, shown as the lower curve. As pointed out in a previous p aper [2], the uncorrected bridge gives results that may be as much as several hundrcd percent too high .
The power-loss data are no t corrccted for losses in the measuring instruments (the wat tmeter potential coil and the fllL,{ vol tmeter ), or for the errors caused by the departure of the fiux waveform from a true sinusoid. These correc tions are identical for the t wo methods, and thus do no t affect th e v alidity of the comparison .
T AllLE 1. COm1Jarison of power loss m eas1Ll'ed by compensated bridge and wattmeter, at 70 clls
INo corrections were Illade for instrument loss or form factor orrors. rl'hcsc arc identical for the iwo methods, and do not a ITcci the validity of the compar· ison]
Power loss Gage EITeetivc
Specimen weigh t B ~ n ridge Watt·
meter ---------------
K ilo· lb qausses " 'l ib w llb %
9.98 0.449 0. 452 - 0. i 10.98 .540 .538 +. 4 12.00 . 642 . 641 +. 2 12.99 .749 . 749 .0
Orien ted 14.0 1 .875 .874 +. 1 grarn _______ 29 0.849 15.00 1. 018 1.020 - . 2
15.98 1. 203 l. l m +.5 17.02 1. 425 1. 435 -. 7 17.96 1.643 1. 685 - 2.5 18.99 1 888 I. 920 - 1.9 20. 12 2. 128 2.140 - 0.6
i'\onoricn tcd: 10.01 0.714 0.7J5 - 0. 1 11. 00 .86 1 .868 -.8
M - 15 .•.•. 29 0. 903 12.02 I. 042 1.049 -. 7 12. 95 I. 258 1. 271 - 1. 0 13 99 1. 543 1. 539 + 0.3 15.38 1.988 1. 973 +.8
j
10. 00 0. 866 0. 869 - 0.3 11. 00 1.060 I. 060 .0 12.02 1293 I. 294 - .1
M - 19 • ..•• 29 0.744 13.00 1. 553 1. 560 - .4 14. 01 1.835 1. 848 - .7 15. 02 2.094 2.096 -. 1 15.83 2.299 2.257 + 1. 9
1
10.00 1. 127 1.124 + 0.3 11.00 1. 337 1. 340 -.2 12.00 1. 578 1. 581 -.2
M - 22 • •. •• 26 0.836 J3. 00 J 856 1. 84.9 +.4 14. 03 2.024 2.067 - 2.1 14. 95 2.332 2.330 + 0.1 16.21 2. G50 2.622 + 1. 2
1
10.00 1. 544 1. 544 0.0 11. Ol 1. 854 1. 847 +.4 12.0 l ~. 147 2. 1'18 .0
M - 36 .. ••• 26 0.877 13.02 2.572 2.558 +.5 14. 03 3.05 l 3.055 - .J 15. 10 3.731 3.75 - . 5 16. 19 4. 720 4.70 +.4
9.98 2. 179 2. 171 + 0.4 11. 02 2.674 2. 658 +.6 11. 99 3. J83 3. 181 +. 1
M-43 . • •.• 24 0.895 13. 03 3. 774 3. 775 . 0 14.04 4.442 4.455 -. 3 15. 03 5. 194 5. 194 . 0 16.04 6. 049 6. 065 -. 3 16.88 6. 747 6.69 +.9
a: w CL
<f)
<f)
o ...J
7.
6
4
a: I.
~9 ~ .8
.7
6
5
;t;
1/ A- ACT UAL CORE LOSS / 8 - APPARENT CO RE L OS S , INDI CATED J/ BY UNCO MPENS AT ED BRID GE
J7 V ~
V
~ V V
V /
/"
II 12 13 14 15
FLU X DEN SI T Y, KILOGAUSSES
[<'IGU HE 10. A pparent power loss as m easw'ed by uncompensated bridge com pal'ed lo acl1wl core loss, al 70 cps.
5 . Summary a nd Conclusions
16
In order to ob tain accurate measuremen ts of core loss by the bridge method, Lh e h armonic power dissipated in Lhe res istive elemen ts of the enLire circui t must be Laken into accoun t. If each h armonic component must be measured and computed separately, the procedure becomes inconvenient and time consuming. A compensation method, using an elcctronic power amplifier wi th "current" feedback , h as bee n devised and found to be sufficiently accurate.
The principal difficulty encountered was the finding of a method of adj usLing Lhe feedback Lo just the correct amount to effect complete compellsa tion , but not undeI'- or overcom.pensaLion. 'fhis problem was solved, and the m ethod was successfully developed to yield resul ts that diff er from those obtained from the wat tmeter by no t more th an 2.5 percent in th e worst cases, with mo t measuremenL agreeing to 1 percen t or bet tor.
It is e timated th at the deLermination of the fundamental-frequency CUl'l'en t is accurate to ± 0.2 percent. The variation of the output voltage of the power source was the limiting fac tor in the precision of balance of the bridge. The nonlineari ty of the test frame wi th ferromagnetic core cau es the balance parameters to be s trongly dependent on the impressed voltage . A t highes t flux densities, the precision of balance is estimated to be about 0.5 percent for the equipment used.
The accuracy limitations are seen to be associated with the equipment employed and not inherent in the method. Therefore, further refinement of the power source, including the current feedback circuit for the Z control, and of the method of measuring
515

the fundamental-frequency current would result m more precise and more accurate measurements.
It is concluded that the use of feedback as described in this paper makes the bridge method capable of producing accurate results with a reasonable degree of convenience , even at high flux densities, where distortion in the exciting current would cause very large errors if not taken into account.
The method was developed by using materials, specimen sizes, and frequencies that were easy to check with the wattmeter method, but its greatest usefulness will probably be in those ranges where the wattmeter is unsuitable.
W ASHINGTOI T, November 29,1957 .
6. References
[1] 1. L. Cooter and W. P . Harri s, The use of an a-c bridge to measure core loss at high inductions, Trans. Am. Ins t. E lec. Engrs. 75, Part 1, 252 (1956).
[2] 1. L. Cooter and W. P . Harris, Investigation of an a lte rnating-current bridge for the meas urement of corc losses in ferromagnetic materials at high flux densities, J . Research NBS 57 , 103 (1956) RP2699.
[3] H . F . Mayer, Control of the effective internal impedance of amplifiers by means of feedback , Proc . (Inst. Radio Engrs.) 27,213 (1939).
[4] H . Bartels, Graphische Berechnung Ii nearer und ni ch tlinearer Riickkopplungen, Elek. 1 ach . T ech . 11, 319 (1934).
[5] T . Sturm, Verfahren zur Klirrverminderung (LinearisieJ'ung), Funktechnische Monatshefte, p. 77 (1937).
[6] E. L . Ginzton, Balanced feed-back a mplifie rs, Proc . (Inst . Radio Engrs .) 26, 1367 (1938).
[7] E. L. Ginzton , Stabilized negative impedances. Electronics 18. In three parts : Part 1, p . 140 (1945); Part 2, p . 138 (1945); Part 3, p . 140 (1945).
[8] H . W. Bode, Network analysis and feedback amplifier design (D . Van Nostrand, Kew York, N . Y. , 1945).
[9] J . G. Thomason, Linear feedback analysis (McGrawHill Publishing Co., Inc ., New York, N. Y., 1955) .
[10] F . K . Harris, E lect ri cal measurem en ts (Wiley, New York, N . Y. , 1952) .
[11] D . C. Dieterly and C. E . Ward, A wide-range a-c bridge test for magnetic materials, Am. Soc. Testing -:\faterials B ul. 182 (1952).
516