improve traffic management in the vehicular ad hoc ... · improve traffic management in the...
TRANSCRIPT
(IJACSA) International Journal of Advanced Computer Science and Applications,
Vol. 7, No. 4, 2016
44 | P a g e
www.ijacsa.thesai.org
Improve Traffic Management in the Vehicular Ad
Hoc Networks by Combining Ant Colony Algorithm
and Fuzzy System
Fazlollah Khodadadi
Department of Engineering Software
Bushehr Branch, Islamic Azad
University, Bushehr, Iran
Seyed Javad Mirabedini Department of Engineering Software,
Central Tehran Branch, Islamic Azad
University, Tehran, Iran
Ali Harounabadi
Department of Engineering Software
Central Tehran Branch, Islamic Azad
University, Tehran, Iran
Abstract—Over the last years, total number of transporter
has increased. High traffic leads to serious problems and finding
a sensible solution to solve the traffic problem is a significant
challenge. Also, the use of the full capacity of existing streets can
help to solve this problem and reduce costs. Instead of using
static algorithms, we present a new method, ACO algorithm,
combine with fuzzy logic which is a fair solution to improve
traffic management in the vehicular ad hoc networks. We have
called this the Improved Traffic Management in the Vehicular ad
hoc networks (ITMV). Proffer method combines the map
segmentation and assign to one server, calculate the
instantaneous state of the traffic in roads with use fuzzy logic and
distribute traffic for reduce traffic as much as possible by less
time priority rather than shorter route. This method collects the
vehicles and streets information to calculate the instantaneous
state of the vehicle density. The proposed method through
simulations were compared with some existing methods and in
terms of speed, travel time and reduce air pollution improved by
an average of 36.5%, 38%, 29% ,Respectively.
Keywords—Traffic Management; Vehicular Ad-hoc Networks;
Ant Colony Algorithms; Fuzzy System
I. INTRODUCTION
Vehicular ad hoc network(VANET) consist of some Road Side Unit (RSU) and vehicles propagating messages. These networks aim to enable traffic and road condition information propagation to find independent mobile vehicles, increase driving safety, help drivers to find routes, accelerate routing, and finally, optimally predict and manage traffic.
A fuzzy system allows us to implement natural principles of life similar to what humans think. Predicting fuzzy logic rate is a technique that allows continues traffic monitoring. This logic can effectively identify vehicular congestion using the information collected from the environment and provide necessary information regarding traffic congestion features for road traffic management [10].
This article presenting a method based in ACO algorithm and fuzzy system for Improved Traffic Management in the VANETs (ITMV). In ITMV, traffic intensity is calculate using the fuzzy system. In addition to being effective in instantaneous optimal route selection, it is also effective in calculating the probability of selecting an optimal route through the corresponding procedure of the ant colony algorithm. Finally, it causes to use optimal routes more
frequently and guide vehicles with high speed and short travel time to their destination. Traffic intensity is calculate using the fuzzy system.
In the following, an overview of the ACO algorithm, fuzzy system's and discusses the traffic management systems are presented in Section 2. ITMV and its operation are presented in Section 3. Section 4 includes the simulation and the results of the simulation. Finally, Section 5 concludes the paper.
II. BACKGROUND AND PREVIOUS WORKS
A. Vehicular Ad hoc Network (VANET)
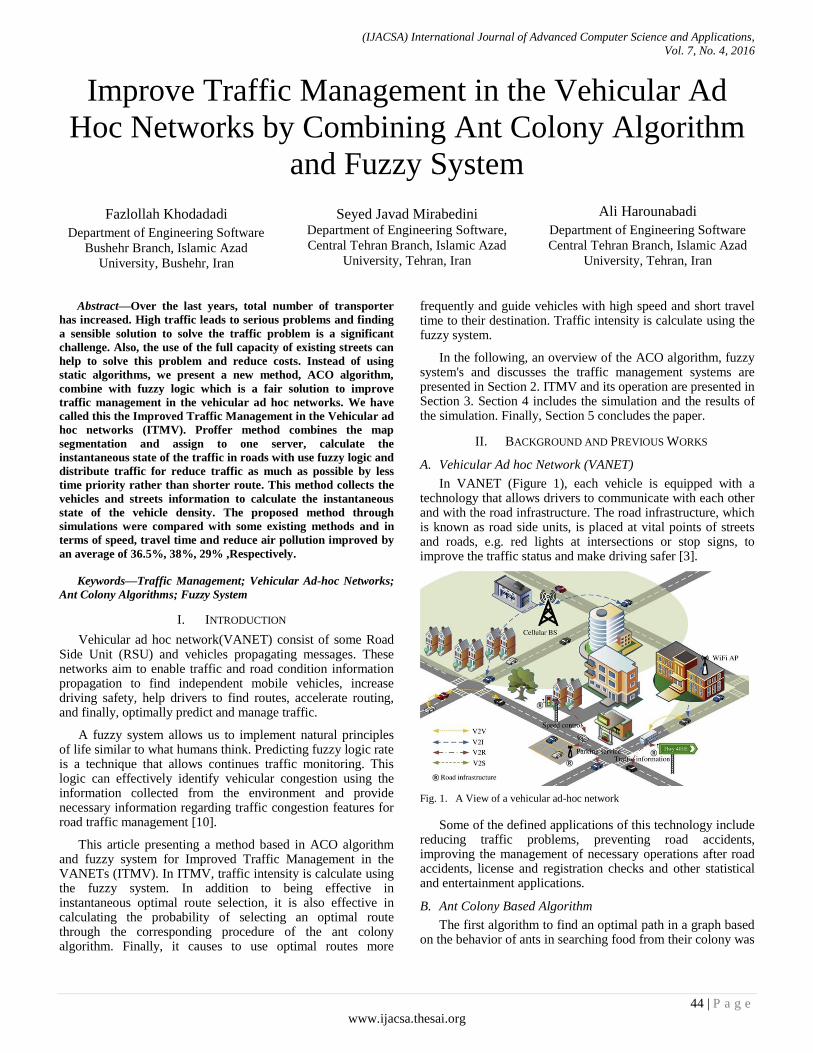
In VANET (Figure 1), each vehicle is equipped with a technology that allows drivers to communicate with each other and with the road infrastructure. The road infrastructure, which is known as road side units, is placed at vital points of streets and roads, e.g. red lights at intersections or stop signs, to improve the traffic status and make driving safer [3].
Fig. 1. A View of a vehicular ad-hoc network
Some of the defined applications of this technology include reducing traffic problems, preventing road accidents, improving the management of necessary operations after road accidents, license and registration checks and other statistical and entertainment applications.
B. Ant Colony Based Algorithm
The first algorithm to find an optimal path in a graph based on the behavior of ants in searching food from their colony was
(IJACSA) International Journal of Advanced Computer Science and Applications,
Vol. 7, No. 4, 2016
45 | P a g e
www.ijacsa.thesai.org
introduced and developed by Dr. Marco Dorigo in 1992. Most features of actual ants are imitated by artificial ones to simulate the social behaviors of ants to solve optimization and distributed control problems.
This algorithm has changed in recent years and has been used in various fields. Some applications and fields where ant colony algorithm used include routing, image processing, scheduling and etc.
C. Fuzzy Systems
Fuzzy logic was first introduced after the development of the fuzzy set theory by pprofessor lotfizadeh in 1965. The tools and applications created by the fuzzy set theory can support all stages of a pattern analysis or knowledge discovery process. Most commercial and economic applications of fuzzy logic is related to process control [4].
The starting point of a fuzzy system is obtaining a set of if-then fuzzy rules from the experts` knowledge or the knowledge of the considered field. The next stage is to combine these rules in an integrated system [10].
D. Previous Works
Reference [11] propose an Alleviating Traffic Congestion (ATC) method in which each vehicle uses a VANET to collect traffic information of a limited region depending on its traffic conditions. Consequently, this provides higher speed and shorter travel time for vehicles` information and communication system for temporary and transient traffic in urban transportation.
Reference [2] propose an Urban Traffic Control Aware Routing Protocol (UTCARP), which includes two modules, i.e. node selection by sending a package to the destination and greedy exchange strategy for sending a package between two adjacent nodes. They asserted that their proposed method has better performance in delivering packages, end-to-end delay, and routing overhead.
Reference [6] present a method in which each vehicle independently collects local information of the congested region and distributes traffic from crowded to non-crowded areas. In locations, where traffic has temporary and distant changes, this method provides higher speed and shorter travel time in comparison to that of current systems.
Reference [9] have also proposed an optimal routing approach using a machine learning algorithm to reduce vehicles` travel time by combining the ant colony algorithm and path length based learning methods.
Reference [12] introduce a novel fleet system in which a unique strategy provides a rapid query response at each intersegment by inter-vehicular communication through forming a local label to predict a non-crowded route. This system enables vehicles to find a route, which can be navigated with a relatively high speed.
Reference [13] includes two models for Route Guidance Systems (RGS), one based on propagating traffic flow in the network and another based on tow flow capacity at different times on related road links. They claim that both models reduce
prediction error to 52% and travel time average to 70% in comparison to other methods.
Jabbarpour et al. [8] have also published a paper in which congestion avoidance is improved by traffic prediction. Their method combines predicting the average speed of traffic movement in roads with segmented maps and finding the shortest path with minimum congestion using the ant colony algorithm. Consequently, average travel time is reduced by 11.5% and average travel speed is increased by 13%.
III. THE PROPOSED METHOD
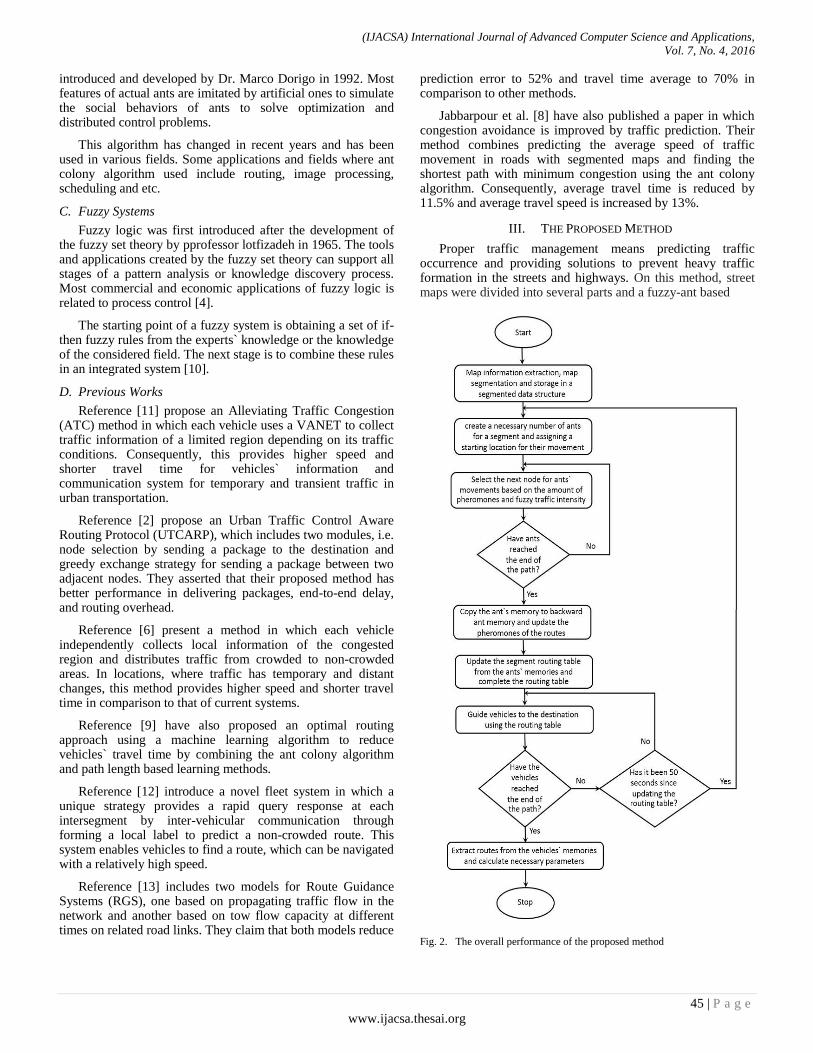
Proper traffic management means predicting traffic occurrence and providing solutions to prevent heavy traffic formation in the streets and highways. On this method, street maps were divided into several parts and a fuzzy-ant based
Fig. 2. The overall performance of the proposed method
(IJACSA) International Journal of Advanced Computer Science and Applications,
Vol. 7, No. 4, 2016
46 | P a g e
www.ijacsa.thesai.org
algorithm was used to find best route and complete the routing table for every part of map. In addition, a method based on fuzzy logic is used to predict traffic patterns, which increases the probability of selecting optimal and non-crowded routes by ants through computing fuzzy traffic intensity. The overall performance of the proposed method is presented in figure 2.
A. Problem environment depiction:
In order to traffic management, problem environment depiction includes four steps, which are explained in the following:
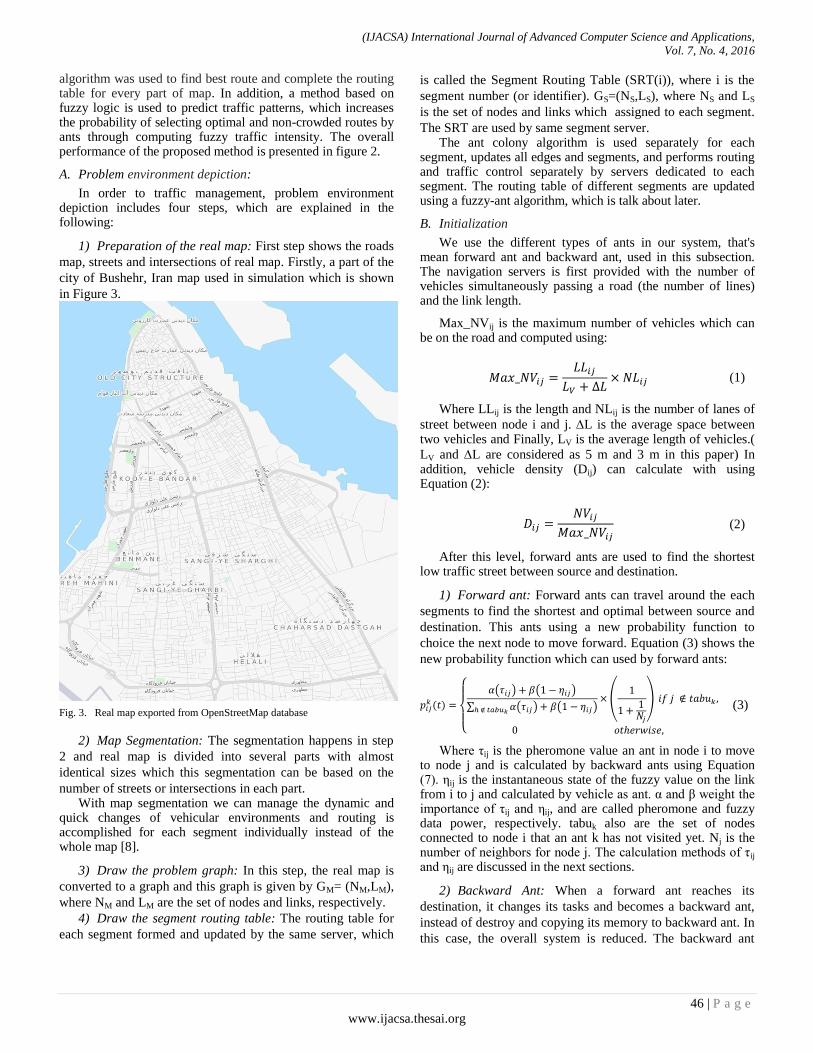
1) Preparation of the real map: First step shows the roads
map, streets and intersections of real map. Firstly, a part of the
city of Bushehr, Iran map used in simulation which is shown
in Figure 3.
Fig. 3. Real map exported from OpenStreetMap database
2) Map Segmentation: The segmentation happens in step
2 and real map is divided into several parts with almost
identical sizes which this segmentation can be based on the
number of streets or intersections in each part. With map segmentation we can manage the dynamic and
quick changes of vehicular environments and routing is accomplished for each segment individually instead of the whole map [8].
3) Draw the problem graph: In this step, the real map is
converted to a graph and this graph is given by GM= (NM,LM),
where NM and LM are the set of nodes and links, respectively.
4) Draw the segment routing table: The routing table for
each segment formed and updated by the same server, which
is called the Segment Routing Table (SRT(i)), where i is the
segment number (or identifier). GS=(NS,LS), where NS and LS
is the set of nodes and links which assigned to each segment.
The SRT are used by same segment server. The ant colony algorithm is used separately for each
segment, updates all edges and segments, and performs routing and traffic control separately by servers dedicated to each segment. The routing table of different segments are updated using a fuzzy-ant algorithm, which is talk about later.
B. Initialization
We use the different types of ants in our system, that's mean forward ant and backward ant, used in this subsection. The navigation servers is first provided with the number of vehicles simultaneously passing a road (the number of lines) and the link length.
Max_NVij is the maximum number of vehicles which can be on the road and computed using:
(1)
Where LLij is the length and NLij is the number of lanes of
street between node i and j. L is the average space between two vehicles and Finally, LV is the average length of vehicles.(
LV and L are considered as 5 m and 3 m in this paper) In addition, vehicle density (Dij) can calculate with using Equation (2):
(2)
After this level, forward ants are used to find the shortest low traffic street between source and destination.
1) Forward ant: Forward ants can travel around the each
segments to find the shortest and optimal between source and
destination. This ants using a new probability function to
choice the next node to move forward. Equation (3) shows the
new probability function which can used by forward ants:
{
( ) ( )
∑ ( ) ( )
(
)
(3)
Where τij is the pheromone value an ant in node i to move to node j and is calculated by backward ants using Equation (7). ηij is the instantaneous state of the fuzzy value on the link from i to j and calculated by vehicle as ant. α and β weight the importance of τij and ηij, and are called pheromone and fuzzy data power, respectively. tabuk also are the set of nodes connected to node i that an ant k has not visited yet. Nj is the number of neighbors for node j. The calculation methods of τij and ηij are discussed in the next sections.
2) Backward Ant: When a forward ant reaches its
destination, it changes its tasks and becomes a backward ant,
instead of destroy and copying its memory to backward ant. In
this case, the overall system is reduced. The backward ant
(IJACSA) International Journal of Advanced Computer Science and Applications,
Vol. 7, No. 4, 2016
47 | P a g e
www.ijacsa.thesai.org
returns to the source by using forward ant memory and
updates the links pheromone intensity using the pheromone
update equation, which is examined in the following sections.
C. Calculate fuzzy traffic intensity
Fuzzy instantaneous congestion state is a technique that constantly monitors traffic conditions. This effectively detects the traffic density of the road using vehicles` communications with the infrastructure and provides valuable information to manage urban traffic under the detected congestion conditions [10]. The fuzzy detection mechanism is based on two input parameters, which reflect the congestion level: the number of lines (NLij) and current traffic on the same link. Moreover, its output parameter provides the current instantaneous congestion state on the corresponding link (Dij).
The fuzzy system is represented by linguistic variables, Lines and Traffic, for inputs and Intensity for output. Fuzzy input variables are mostly divided into different fuzzy sets. Fuzzy linguistic values or fuzzy sets are as follows:
Lines = {L, M, H, VH}
Traffic = {VL, L, M, H, VH}
Intensity = {VL, ML, HL, LM, HM, LH, MH, VH}
Where, L=Low, VL=Very Low, ML=Middle Low, HL=High Low, LM=Low Medium, M=Medium, HM=High Medium, H=High, LH=Low High, MH=Middle High and VH=Very High. Figures 4 to 6 present fuzzy sets corresponding to fuzzy input and output variables.
Since each fuzzy set consist of elements with a degree of membership, the value of a fuzzy input may simultaneously belong to different fuzzy sets.
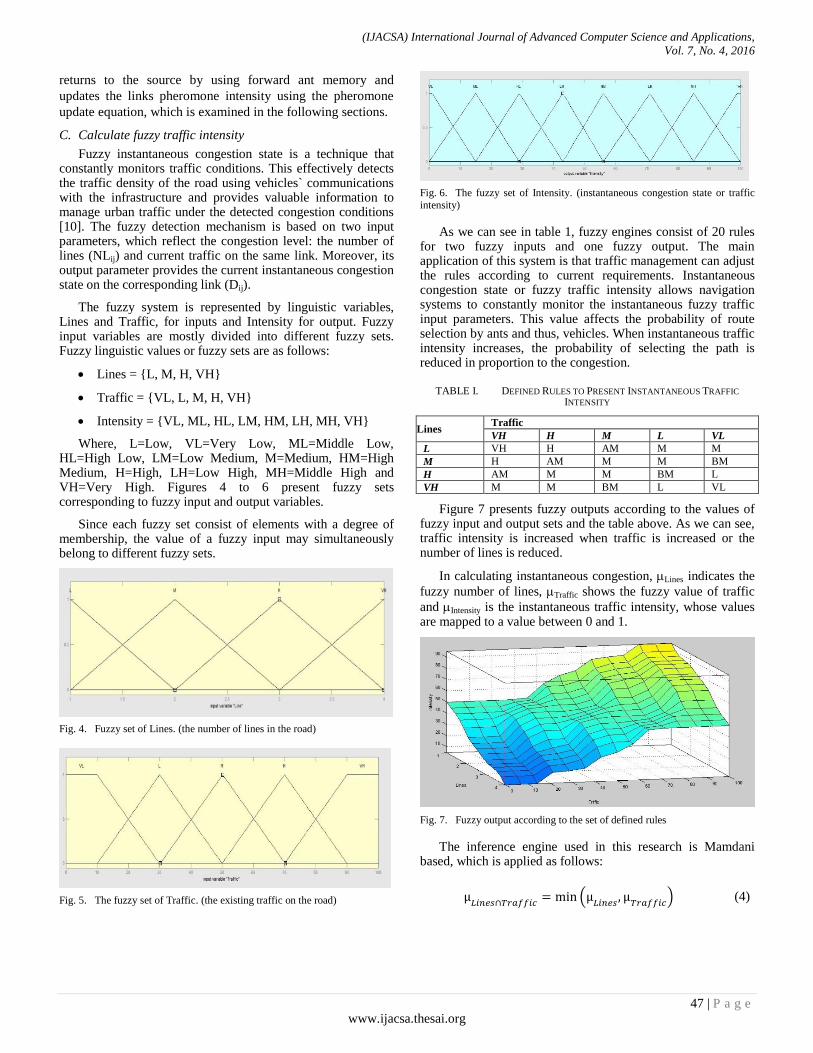
Fig. 4. Fuzzy set of Lines. (the number of lines in the road)
Fig. 5. The fuzzy set of Traffic. (the existing traffic on the road)
Fig. 6. The fuzzy set of Intensity. (instantaneous congestion state or traffic
intensity)
As we can see in table 1, fuzzy engines consist of 20 rules for two fuzzy inputs and one fuzzy output. The main application of this system is that traffic management can adjust the rules according to current requirements. Instantaneous congestion state or fuzzy traffic intensity allows navigation systems to constantly monitor the instantaneous fuzzy traffic input parameters. This value affects the probability of route selection by ants and thus, vehicles. When instantaneous traffic intensity increases, the probability of selecting the path is reduced in proportion to the congestion.
TABLE I. DEFINED RULES TO PRESENT INSTANTANEOUS TRAFFIC
INTENSITY
Lines Traffic
VH H M L VL
L VH H AM M M
M H AM M M BM
H AM M M BM L
VH M M BM L VL
Figure 7 presents fuzzy outputs according to the values of fuzzy input and output sets and the table above. As we can see, traffic intensity is increased when traffic is increased or the number of lines is reduced.
In calculating instantaneous congestion, Lines indicates the
fuzzy number of lines, Traffic shows the fuzzy value of traffic
and Intensity is the instantaneous traffic intensity, whose values are mapped to a value between 0 and 1.
Fig. 7. Fuzzy output according to the set of defined rules
The inference engine used in this research is Mamdani based, which is applied as follows:
μ
(μ
μ
) (4)
(IJACSA) International Journal of Advanced Computer Science and Applications,
Vol. 7, No. 4, 2016
48 | P a g e
www.ijacsa.thesai.org
The representative of each fuzzy output value Intensity is defined as follows according to its chart:
{ } (5)
Now, the center average defuzzifier is used to calculated traffic intensity. The required equation to calculate fuzzy traffic intensity using center average defuzzifier is as follows:
∑ μ
∑
(6)
D. Pheromone update
When the backward ants arrived, the pheromone value of links is updated. The amount of pheromone value is increased or decreased with Equation (7), as follows:
∑
(7)
Where ρA (0, 1] is a pheromone evaporation value, and n is the number of nodes in the same segment. The value of pheromone placed on links i and j by ant k is calculated using:
{
(8)
Where
and
are the travel time, vehicle
density and length of each link which traverse by ant k, respectively.
E. Stopping Procedure
Ant colony algorithm should be terminated in a suitable situation. The number of repetitions, run time, a certain number of visited nodes and etc. are some examples of the algorithm termination condition. However, the terminated condition of ITMV is scrolling all the links to each segment by ants.
F. Update Routing Table
In this method, at specified intervals, γ, a certain number of forward ants to be re-created, Na, in order to update routing table and randomly placed on different nodes per segments as start points. Then, they start to explore links using Equation (3) and trying to exploit all possible routes in segments. After that, backward ants return to source points and update the pheromone value of links by using Equation (7). Segment Routing Table or SRT is updated using routes have been found by ants. SRT(i) includes m smaller tables where m is the number of nodes in segment i. In each of these smaller tables
there are mn rows as a possible route, where n is the number of segments. Moreover, there are 3 columns in each table: destination node, next node and price route.
After forming the segment routing table, using border nodes of each segment and connecting them to its neighbors in the adjacent segment, the information of the routing table is extended and the vehicles' destinations as an ant are expanded beyond a segment.
G. Guiding Vehicles to Their Destination
The server's that is assigned to each segment, using the cable for communicate with each other and using segment routing table, through RSU navigate vehicles to your destinations.
Vehicles perform routing until the recommended path is the most optimal route to the destination; otherwise, another is recommended. The Cross Multiplication in equation 9 is used to determine the optimality of the recommended path:
{
(9)
Where, Pn is the probability of selecting a possible path from i to j by a vehicle, which should be guided through an
optimal path (less distance and less traffic). Moreover, is the maximum instantaneous congestion, which can exist on a single link and has a value in range 0 and 1.
The closer this value is to the actual value, in addition to preventing congestion, vehicles navigate to shorter distance in less time with higher speed from their origin to destination and maximum capacity of paths is also optimal use.
IV. SIMULATION AND EVALUATION
This segment discusses simulation results and compares the proposed method with other existing systems. NS2 and SUMO simulators are two software applications, which are used for the simulation and performance presentation of the proposed method. First, the ant colony algorithm in combination with fuzzy logic which named Fuzzy and Ant Colony Optimization (FACO) is implemented in NS2 and their output, which is the scenario of vehicles` movements, as well as road maps, are inserted into SUMO after applying necessary changes. Finally, the simulation output, which consist of different information and statistics regarding vehicles, trips, simulation times, etc. are received through separate files and employed to compare and evaluate the proposed method.
We must note that simulation results also provide the maximum tolerable fuzzy instantaneous congestion on a single link.
A. Simulation Setup
NS2 is a simulator based on object-oriented and discrete event simulation, which supports different cable and wireless computer network simulations. This simulator is based on C++ language and OTCL interpreter to run user instructions. Using this tool, users can define different network topologies and protocols [7].
SUMO is an open-source, portable, and microscopic software application with a traffic simulation package to deal with very large networks. This software package includes several useful tools to help simulating urban networks. These tools include a graphical user interface for simulation, network converter and constructor, network graphic editor, routing scenario builder with different approaches, and several other useful tools [1].
In order to manage the traffic of vehicular networks, we exploit these two software packages to simulate the considered
(IJACSA) International Journal of Advanced Computer Science and Applications,
Vol. 7, No. 4, 2016
49 | P a g e
www.ijacsa.thesai.org
vehicular ad hoc network in which routing is performed based on the proposed method that is a combination of the ant colony algorithm and fuzzy systems.
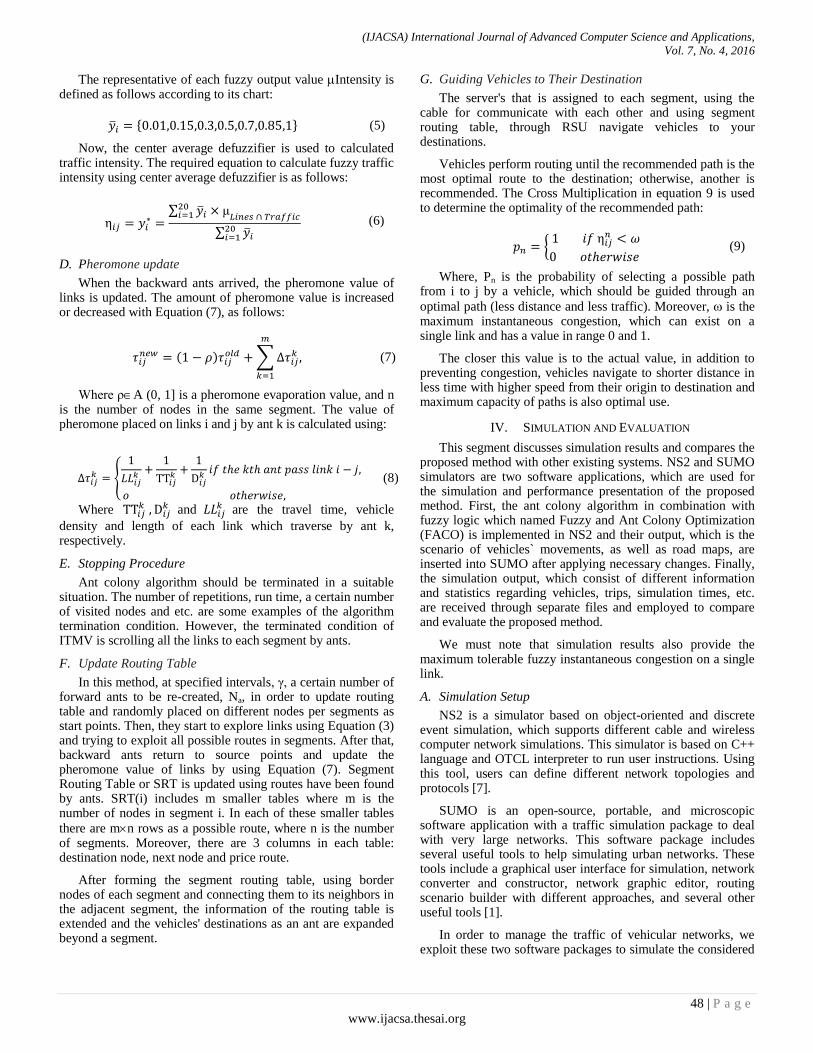
1) Map Preparation: Netconvert tool embedded in SUMO software package are
used to convert the primary map into a usable format in NS-2.35 and SUMO 0.12.3. The output of netconvert is an xml file, which is used as a road map in NS2. The FACO algorithm is implemented in NS2, using this map and its output, i.e. the scenario of vehicle routing, are transferred to SUMO simulator. Figure 8 presents the overall simulation process.
Fig. 8. The simulation process of the proposed method
The map file extracted from netconvert tools contains complete information of the used map, including street location and length, number of lines, maximum speed of each line or street, location and state of traffic signs (e.g. red lights), etc.
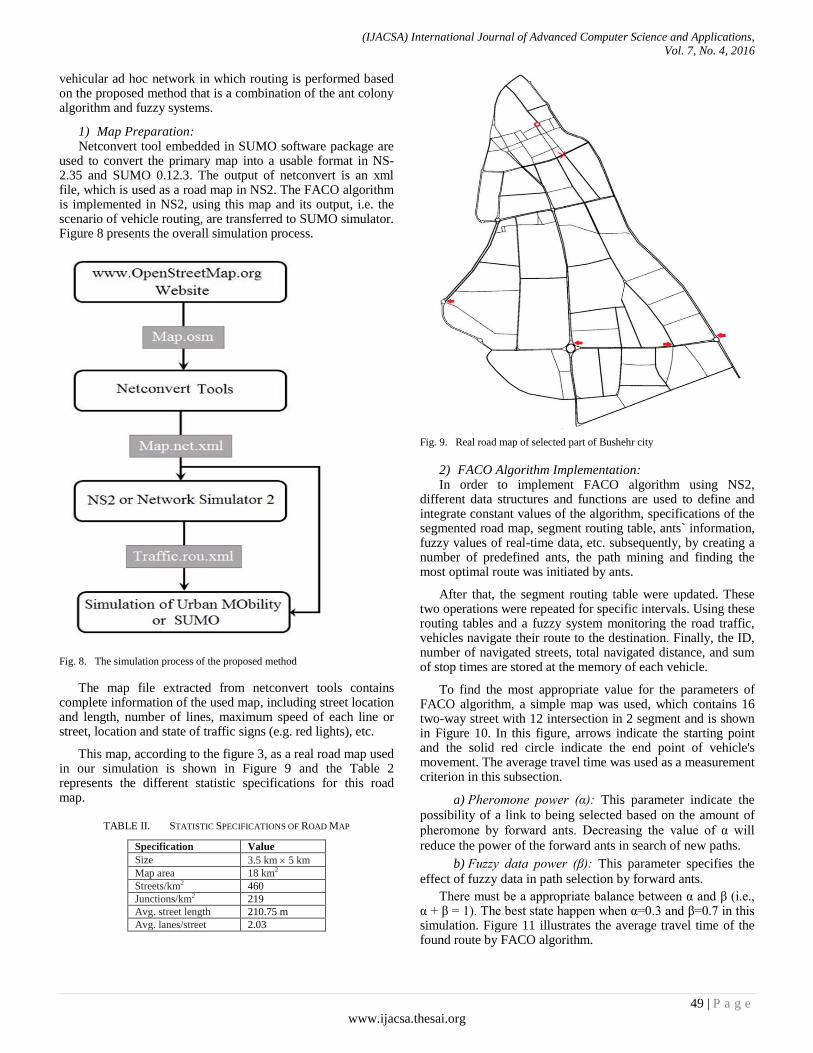
This map, according to the figure 3, as a real road map used in our simulation is shown in Figure 9 and the Table 2 represents the different statistic specifications for this road map.
TABLE II. STATISTIC SPECIFICATIONS OF ROAD MAP
Specification Value
Size 3.5 km 5 km
Map area 18 km2
Streets/km2 460
Junctions/km2 219
Avg. street length 210.75 m
Avg. lanes/street 2.03
Fig. 9. Real road map of selected part of Bushehr city
2) FACO Algorithm Implementation: In order to implement FACO algorithm using NS2,
different data structures and functions are used to define and integrate constant values of the algorithm, specifications of the segmented road map, segment routing table, ants` information, fuzzy values of real-time data, etc. subsequently, by creating a number of predefined ants, the path mining and finding the most optimal route was initiated by ants.
After that, the segment routing table were updated. These two operations were repeated for specific intervals. Using these routing tables and a fuzzy system monitoring the road traffic, vehicles navigate their route to the destination. Finally, the ID, number of navigated streets, total navigated distance, and sum of stop times are stored at the memory of each vehicle.
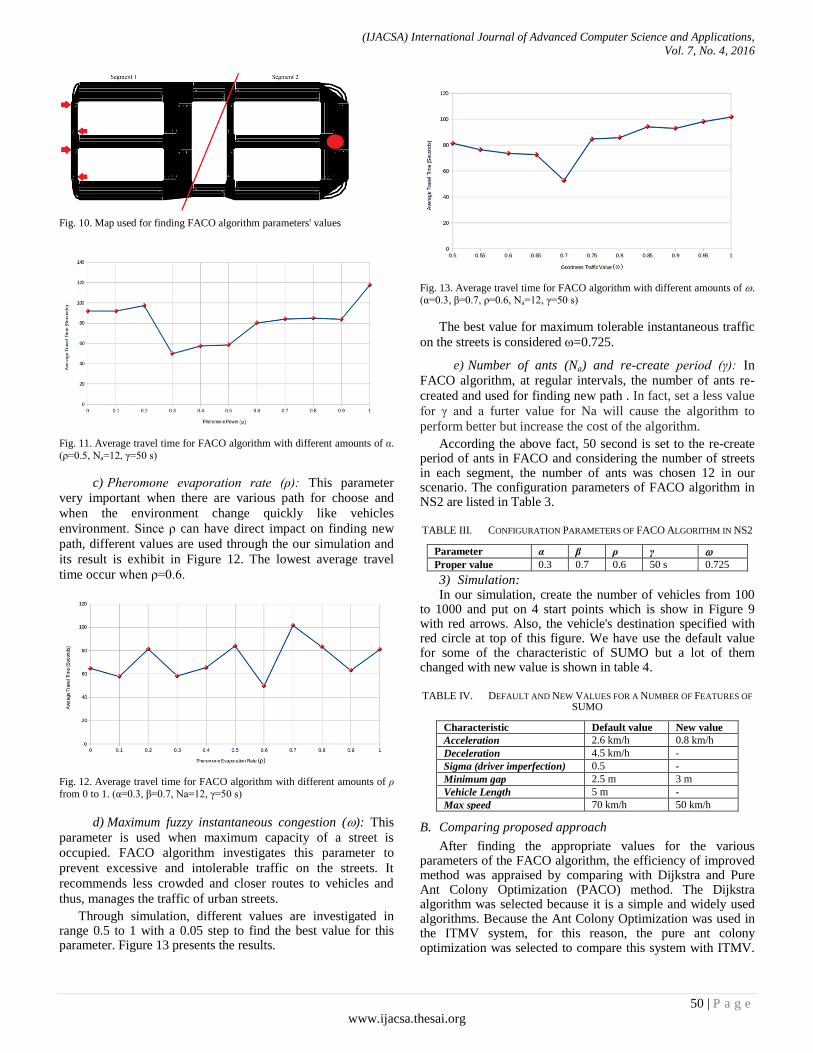
To find the most appropriate value for the parameters of FACO algorithm, a simple map was used, which contains 16 two-way street with 12 intersection in 2 segment and is shown in Figure 10. In this figure, arrows indicate the starting point and the solid red circle indicate the end point of vehicle's movement. The average travel time was used as a measurement criterion in this subsection.
a) Pheromone power (α): This parameter indicate the
possibility of a link to being selected based on the amount of
pheromone by forward ants. Decreasing the value of α will
reduce the power of the forward ants in search of new paths.
b) Fuzzy data power (β): This parameter specifies the
effect of fuzzy data in path selection by forward ants.
There must be a appropriate balance between α and β (i.e., α + β = 1). The best state happen when α=0.3 and β=0.7 in this simulation. Figure 11 illustrates the average travel time of the found route by FACO algorithm.
(IJACSA) International Journal of Advanced Computer Science and Applications,
Vol. 7, No. 4, 2016
50 | P a g e
www.ijacsa.thesai.org
Fig. 10. Map used for finding FACO algorithm parameters' values
Fig. 11. Average travel time for FACO algorithm with different amounts of α.
(ρ=0.5, Na=12, γ=50 s)
c) Pheromone evaporation rate (ρ): This parameter
very important when there are various path for choose and
when the environment change quickly like vehicles
environment. Since ρ can have direct impact on finding new
path, different values are used through the our simulation and
its result is exhibit in Figure 12. The lowest average travel
time occur when ρ=0.6.
Fig. 12. Average travel time for FACO algorithm with different amounts of ρ
from 0 to 1. (α=0.3, β=0.7, Na=12, γ=50 s)
d) Maximum fuzzy instantaneous congestion (): This
parameter is used when maximum capacity of a street is
occupied. FACO algorithm investigates this parameter to
prevent excessive and intolerable traffic on the streets. It
recommends less crowded and closer routes to vehicles and
thus, manages the traffic of urban streets.
Through simulation, different values are investigated in range 0.5 to 1 with a 0.05 step to find the best value for this parameter. Figure 13 presents the results.
Fig. 13. Average travel time for FACO algorithm with different amounts of . (α=0.3, β=0.7, ρ=0.6, Na=12, γ=50 s)
The best value for maximum tolerable instantaneous traffic
on the streets is considered =0.725.
e) Number of ants (Na) and re-create period (γ): In
FACO algorithm, at regular intervals, the number of ants re-
created and used for finding new path . In fact, set a less value
for γ and a furter value for Na will cause the algorithm to
perform better but increase the cost of the algorithm.
According the above fact, 50 second is set to the re-create period of ants in FACO and considering the number of streets in each segment, the number of ants was chosen 12 in our scenario. The configuration parameters of FACO algorithm in NS2 are listed in Table 3.
TABLE III. CONFIGURATION PARAMETERS OF FACO ALGORITHM IN NS2
Parameter α β ρ γ
Proper value 0.3 0.7 0.6 50 s 0.725
3) Simulation: In our simulation, create the number of vehicles from 100
to 1000 and put on 4 start points which is show in Figure 9 with red arrows. Also, the vehicle's destination specified with red circle at top of this figure. We have use the default value for some of the characteristic of SUMO but a lot of them changed with new value is shown in table 4.
TABLE IV. DEFAULT AND NEW VALUES FOR A NUMBER OF FEATURES OF
SUMO
Characteristic Default value New value
Acceleration 2.6 km/h 0.8 km/h
Deceleration 4.5 km/h -
Sigma (driver imperfection) 0.5 -
Minimum gap 2.5 m 3 m
Vehicle Length 5 m -
Max speed 70 km/h 50 km/h
B. Comparing proposed approach
After finding the appropriate values for the various parameters of the FACO algorithm, the efficiency of improved method was appraised by comparing with Dijkstra and Pure Ant Colony Optimization (PACO) method. The Dijkstra algorithm was selected because it is a simple and widely used algorithms. Because the Ant Colony Optimization was used in the ITMV system, for this reason, the pure ant colony optimization was selected to compare this system with ITMV.
(IJACSA) International Journal of Advanced Computer Science and Applications,
Vol. 7, No. 4, 2016
51 | P a g e
www.ijacsa.thesai.org
These three system were compared, based on the average travel time, waiting time, speed, distance, and reaction for accident, air pollution and fuel consumption by applying 100 to 1,000 vehicles.
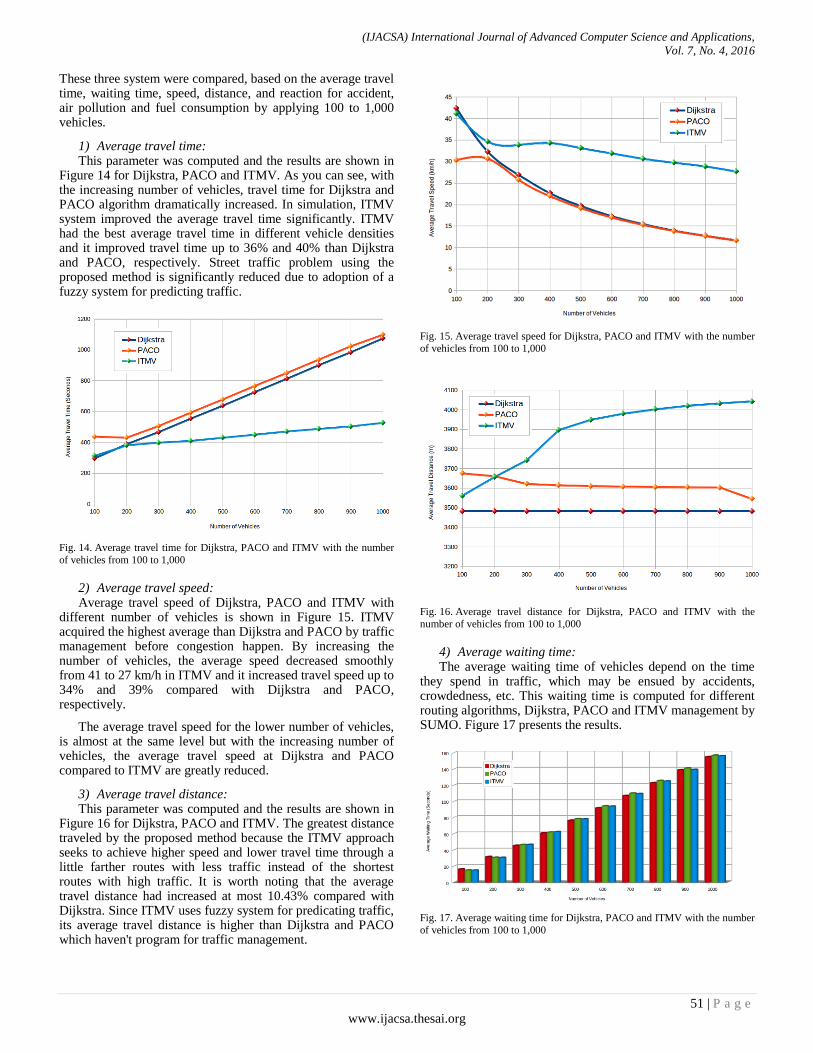
1) Average travel time: This parameter was computed and the results are shown in
Figure 14 for Dijkstra, PACO and ITMV. As you can see, with the increasing number of vehicles, travel time for Dijkstra and PACO algorithm dramatically increased. In simulation, ITMV system improved the average travel time significantly. ITMV had the best average travel time in different vehicle densities and it improved travel time up to 36% and 40% than Dijkstra and PACO, respectively. Street traffic problem using the proposed method is significantly reduced due to adoption of a fuzzy system for predicting traffic.
Fig. 14. Average travel time for Dijkstra, PACO and ITMV with the number
of vehicles from 100 to 1,000
2) Average travel speed: Average travel speed of Dijkstra, PACO and ITMV with
different number of vehicles is shown in Figure 15. ITMV acquired the highest average than Dijkstra and PACO by traffic management before congestion happen. By increasing the number of vehicles, the average speed decreased smoothly from 41 to 27 km/h in ITMV and it increased travel speed up to 34% and 39% compared with Dijkstra and PACO, respectively.
The average travel speed for the lower number of vehicles, is almost at the same level but with the increasing number of vehicles, the average travel speed at Dijkstra and PACO compared to ITMV are greatly reduced.
3) Average travel distance: This parameter was computed and the results are shown in
Figure 16 for Dijkstra, PACO and ITMV. The greatest distance traveled by the proposed method because the ITMV approach seeks to achieve higher speed and lower travel time through a little farther routes with less traffic instead of the shortest routes with high traffic. It is worth noting that the average travel distance had increased at most 10.43% compared with Dijkstra. Since ITMV uses fuzzy system for predicating traffic, its average travel distance is higher than Dijkstra and PACO which haven't program for traffic management.
Fig. 15. Average travel speed for Dijkstra, PACO and ITMV with the number
of vehicles from 100 to 1,000
Fig. 16. Average travel distance for Dijkstra, PACO and ITMV with the
number of vehicles from 100 to 1,000
4) Average waiting time: The average waiting time of vehicles depend on the time
they spend in traffic, which may be ensued by accidents, crowdedness, etc. This waiting time is computed for different routing algorithms, Dijkstra, PACO and ITMV management by SUMO. Figure 17 presents the results.
Fig. 17. Average waiting time for Dijkstra, PACO and ITMV with the number
of vehicles from 100 to 1,000
(IJACSA) International Journal of Advanced Computer Science and Applications,
Vol. 7, No. 4, 2016
52 | P a g e
www.ijacsa.thesai.org
As we can see, the waiting time of vehicles is almost the same for all three algorithms. Increasing the number of vehicles also increases their average waiting time. The proposed method only enhances travel time and vehicles` speed in navigating the distance.
5) Reaction to the incident To evaluate the response of the proposed method in the
incident as compared to other two methods, an additional simulation was performed for 1000 s. The incident was happened at one of the street, which is depicted via a cross sign in Figure 9, after 300 s and has lasted to the 700th second of simulation. In this case, vehicles are forced to stop until the end of time resolved the incident by using the stop element in SUMO. Average travel times were calculated for all three method in every 100 seconds of simulation and the results are displayed in Figure 18.
Fig. 18. Average travel time for Dijkstra, PACO and ITMV as a routing
system as a function of simulation time
As you can see, before the incident happened, the average travel time for all methods is almost the same. From 300 to 700 seconds in the simulation, travel time is increased for all method due to traffic. However, in the proposed method, travel time takes its natural course due to traffic management.
At the 700th second when the incident was cleared from the street, the average travel time decreased for all of the methods and all the graphs smooth out to reach their initial values. ITMV had the best reaction for incident since it uses travel time and vehicle density and travel speed prediction for vehicle routing and uses fuzzy system from the beginning before incident happens. The improved traffic management approach shows 19.4% and 19.49% improvement on average in comparison to Dijkstra and PACO algorithm.
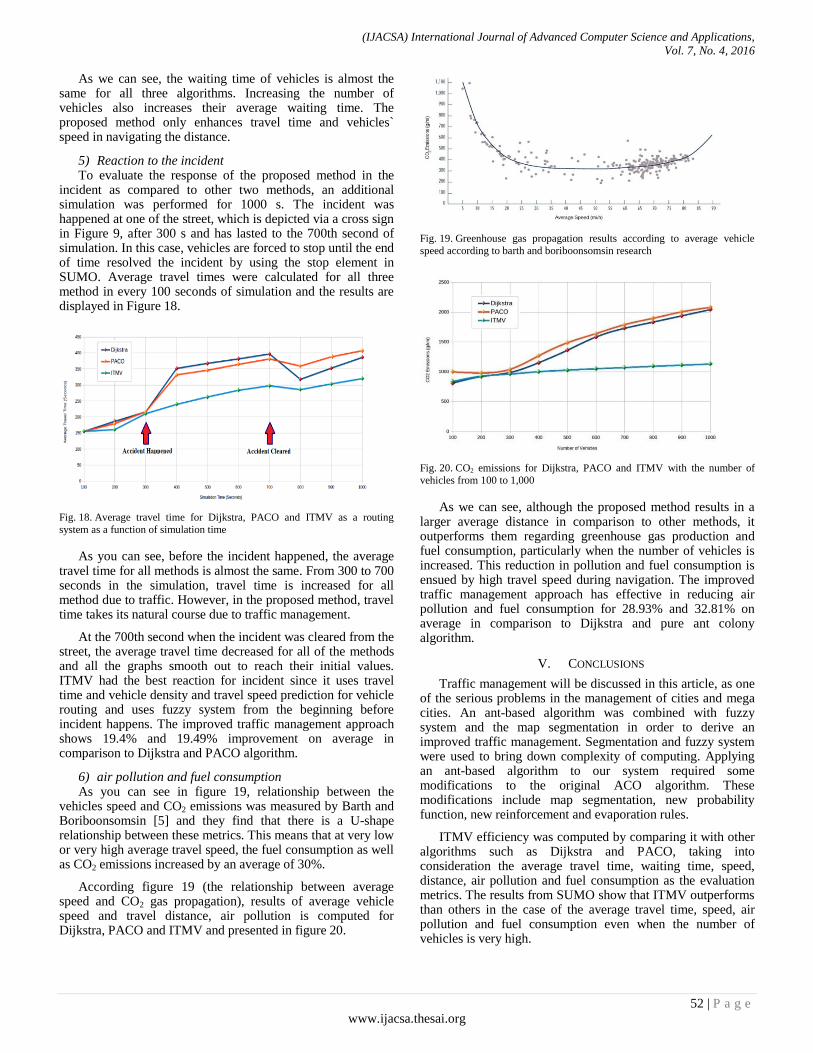
6) air pollution and fuel consumption As you can see in figure 19, relationship between the
vehicles speed and CO2 emissions was measured by Barth and Boriboonsomsin [5] and they find that there is a U-shape relationship between these metrics. This means that at very low or very high average travel speed, the fuel consumption as well as CO2 emissions increased by an average of 30%.
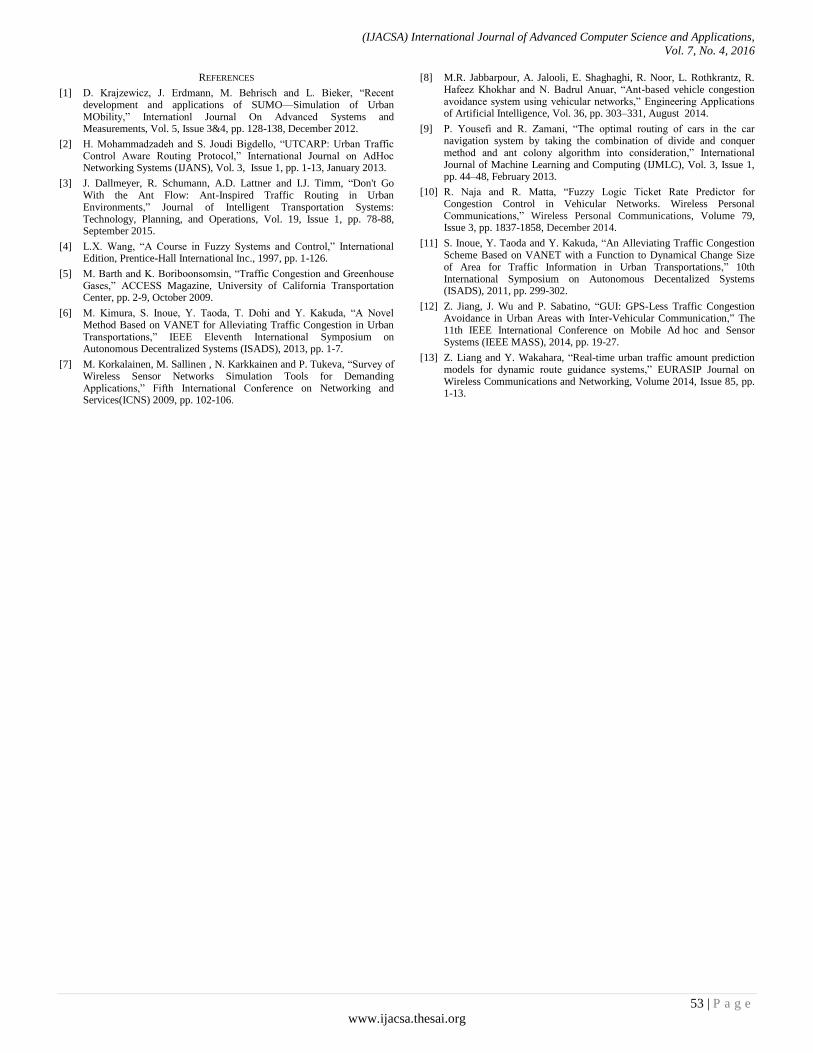
According figure 19 (the relationship between average speed and CO2 gas propagation), results of average vehicle speed and travel distance, air pollution is computed for Dijkstra, PACO and ITMV and presented in figure 20.
Fig. 19. Greenhouse gas propagation results according to average vehicle
speed according to barth and boriboonsomsin research
Fig. 20. CO2 emissions for Dijkstra, PACO and ITMV with the number of
vehicles from 100 to 1,000
As we can see, although the proposed method results in a larger average distance in comparison to other methods, it outperforms them regarding greenhouse gas production and fuel consumption, particularly when the number of vehicles is increased. This reduction in pollution and fuel consumption is ensued by high travel speed during navigation. The improved traffic management approach has effective in reducing air pollution and fuel consumption for 28.93% and 32.81% on average in comparison to Dijkstra and pure ant colony algorithm.
V. CONCLUSIONS
Traffic management will be discussed in this article, as one of the serious problems in the management of cities and mega cities. An ant-based algorithm was combined with fuzzy system and the map segmentation in order to derive an improved traffic management. Segmentation and fuzzy system were used to bring down complexity of computing. Applying an ant-based algorithm to our system required some modifications to the original ACO algorithm. These modifications include map segmentation, new probability function, new reinforcement and evaporation rules.
ITMV efficiency was computed by comparing it with other algorithms such as Dijkstra and PACO, taking into consideration the average travel time, waiting time, speed, distance, air pollution and fuel consumption as the evaluation metrics. The results from SUMO show that ITMV outperforms than others in the case of the average travel time, speed, air pollution and fuel consumption even when the number of vehicles is very high.
(IJACSA) International Journal of Advanced Computer Science and Applications,
Vol. 7, No. 4, 2016
53 | P a g e
www.ijacsa.thesai.org
REFERENCES
[1] D. Krajzewicz, J. Erdmann, M. Behrisch and L. Bieker, “Recent development and applications of SUMO—Simulation of Urban MObility,” Internationl Journal On Advanced Systems and Measurements, Vol. 5, Issue 3&4, pp. 128-138, December 2012.
[2] H. Mohammadzadeh and S. Joudi Bigdello, “UTCARP: Urban Traffic Control Aware Routing Protocol,” International Journal on AdHoc Networking Systems (IJANS), Vol. 3, Issue 1, pp. 1-13, January 2013.
[3] J. Dallmeyer, R. Schumann, A.D. Lattner and I.J. Timm, “Don't Go With the Ant Flow: Ant-Inspired Traffic Routing in Urban Environments,” Journal of Intelligent Transportation Systems: Technology, Planning, and Operations, Vol. 19, Issue 1, pp. 78-88, September 2015.
[4] L.X. Wang, “A Course in Fuzzy Systems and Control,” International Edition, Prentice-Hall International Inc., 1997, pp. 1-126.
[5] M. Barth and K. Boriboonsomsin, “Traffic Congestion and Greenhouse Gases,” ACCESS Magazine, University of California Transportation Center, pp. 2-9, October 2009.
[6] M. Kimura, S. Inoue, Y. Taoda, T. Dohi and Y. Kakuda, “A Novel Method Based on VANET for Alleviating Traffic Congestion in Urban Transportations,” IEEE Eleventh International Symposium on Autonomous Decentralized Systems (ISADS), 2013, pp. 1-7.
[7] M. Korkalainen, M. Sallinen , N. Karkkainen and P. Tukeva, “Survey of Wireless Sensor Networks Simulation Tools for Demanding Applications,” Fifth International Conference on Networking and Services(ICNS) 2009, pp. 102-106.
[8] M.R. Jabbarpour, A. Jalooli, E. Shaghaghi, R. Noor, L. Rothkrantz, R. Hafeez Khokhar and N. Badrul Anuar, “Ant-based vehicle congestion avoidance system using vehicular networks,” Engineering Applications of Artificial Intelligence, Vol. 36, pp. 303–331, August 2014.
[9] P. Yousefi and R. Zamani, “The optimal routing of cars in the car navigation system by taking the combination of divide and conquer method and ant colony algorithm into consideration,” International Journal of Machine Learning and Computing (IJMLC), Vol. 3, Issue 1, pp. 44–48, February 2013.
[10] R. Naja and R. Matta, “Fuzzy Logic Ticket Rate Predictor for Congestion Control in Vehicular Networks. Wireless Personal Communications,” Wireless Personal Communications, Volume 79, Issue 3, pp. 1837-1858, December 2014.
[11] S. Inoue, Y. Taoda and Y. Kakuda, “An Alleviating Traffic Congestion Scheme Based on VANET with a Function to Dynamical Change Size of Area for Traffic Information in Urban Transportations,” 10th International Symposium on Autonomous Decentalized Systems (ISADS), 2011, pp. 299-302.
[12] Z. Jiang, J. Wu and P. Sabatino, “GUI: GPS-Less Traffic Congestion Avoidance in Urban Areas with Inter-Vehicular Communication,” The 11th IEEE International Conference on Mobile Ad hoc and Sensor Systems (IEEE MASS), 2014, pp. 19-27.
[13] Z. Liang and Y. Wakahara, “Real-time urban traffic amount prediction models for dynamic route guidance systems,” EURASIP Journal on Wireless Communications and Networking, Volume 2014, Issue 85, pp. 1-13.