improve margins by reducing rework a benchmark … margins by reducing rework ... electronic...
TRANSCRIPT

Improve margins by reducing rework – a benchmark comparison By: Sjef van Gastel, Manager of Advanced Development, Assembléon Netherlands B.V. Electronic equipment manufacturers know that rework and scrap cost them money, but rarely know just how much. Calculating it is relatively straightforward knowing the production line’s First Pass Yield (FPY), though. The cost of low yield is simply the difference in rework and scrap between the manufacturer’s production line and that of a benchmark line. The two major causes of defects are poor solder printing which is estimated to cause over 50-70% of assembled equipment defects, and pick & place errors which cause most of the rest. The benchmark figure for stencil printing is around 10 dpm (defects per million), and that for a pick & place machine is now 5 dpm Allowing for defects from pc board manufacture and reflow soldering, that gives a whole-line benchmark of below 30 dpm. Compared with a typical whole-line defect level in the industry as a whole of between 50 and 100 dpm (just for standard components – the dpm for miniature components such as ‘01005’ types can be 200 or more), that might seem wildly optimistic. Around 25 dpm is the level steadily attained by (for example) the Czech manufacturing plant of Assembléon customer Alps Electric, though, for an average of 1-2 billion components a year. Alps makes equipment for the automotive market, where the costs of field returns are out of all proportion to component costs, so for automotive customers Right First Time manufacturing is an absolute requirement. The company takes that quality over into its equipment for the consumer market, too. The costs of quality can easily outweigh labor costs and so, even in countries like India and China with low wage costs, the savings can be huge. For a typical board with say 1000 components, a whole line quality of 25 dpm gives a benchmark FPY of 97.5%. With a production line turning out say 100 boards/hour (100,000 components/hour) that will need one rework station. Assuming a typical three-shift operation, three operators will be needed for rework. In practice in-line repair will find only 90% of all defects. The remaining 10% will be detected at a later stage, increasing repair costs by a factor of 101 at each stage (the ‘Rule of 10’: Figure 1).

Figure 1: Costs of defects. At each stage the costs of correcting a defect increase by a factor 10. With labor costs in SE Asia being around 2-3 k€, in Mexico and East Europe around 5 k€, and in R.O.W. around 30-45 k€, that gives total repair costs per line of €25,000-€290,000 per year. By contrast, a typical 100 dpm production line would have a yield of 90% and would need two rework stations with repair costs of up to €445,000. And, because defects often come in batches, the lower the yield, the more random the effects and the less predictable the output. Rework lines can be underworked one day and stacked to overflowing the next. Reducing variation keeps yields high Assembléon has from the 1980s concentrated on producing machines with ultra reliable operation, since early machines were largely sold to automotive manufacturers. The aim since then has been to continually reduce component placement variation (key improvements have included placement accuracy, placement force, on-edge detection, component presence check and component geometry inspection), on the principle that quality pays for itself. The principle of six-sigma quality is to keep processes not just within specification limits – what a customer asks for – but within control limits that are repeatedly well inside specification limits (high process capability). That means that processes can drift but still be producing good output while the faults are being corrected. This is basic quality improvement theory, and is also critical to successful (and profitable) electronics manufacture.

Reaching benchmark performance means optimizing each of the three major surface-mount processes: stencil printing, pick & place, and reflow soldering. Solder paste printing needs to select the correct stencils, apertures and printing parameters for the components being used, with regular monitoring of stencil cleaning and paste replenishment. Each process step of the pick & place machine needs to be monitored and working well within specifications. Reflow soldering needs the correct reflow temperature profile with accurate process control. There are several key signs of manufacturing processes going out of control, and they tend to fall into distinct classes and with distinct causes. Identifying those signs helps trace faults quickly to bring the process back into control. In practice, the major influence on production line quality is the pick & place machine. And the major quality figure for a Pick & Place machine is the defects per million level, since that tells its customers the yield they can expect. Calculating yields Three related IPC documents (IPC-A-610D, IPC-9261A and IPC-7912A) describe how to calculate yields for a particular board on a particular production line. The standards distinguish the types of SMT defect (Figure 2), and count the number of possible opportunities for defects on each board, which depends primarily on the board’s complexity. Each component can itself be defective, can be incorrectly placed, can have either of its terminations incorrectly soldered, or (sometimes) have an incorrect process step like a missing conformal coating. Each of those is counted as a single defect opportunity. So a chip component can be cracked, or incorrectly placed, or have one of its two terminations incorrectly soldered, which gives a defect opportunity of 4. Similarly a QFP52 has a defect opportunity of 54. Adding all the individual component defect opportunities gives a figure for the whole board, and this is normally dominated by the termination count.

Figure 2: Defect classification overview: Component defects (yellow), Placement defects (pink), Termination defects (purple), Assembly defects (blue). Source: IPC09261A. The next step is to predict the actual number of defects that a given production line will produce for a board of a particular complexity. That needs a historic value for the actual DPMO (Defects per Million Opportunities) for the line, which any manufacturer serious about improving production quality will track. The DPMO for a board is simply 106 times the total number of actual defects over the total number of defect opportunities. More than anything else, the FPY determines the overall Cost of Placement. High FPY means low scrap and rework costs, and high return on investment. The yield is then given by:
NDPMO
Y
61011 with:
processedPCBsofNumber
OOOON
atpc
___
where Oc, Op, Ot and Oa (Ocomponent, Oplacement, Oterminations, Oassembly) are the defect opportunities. On a board with 1000 defect opportunities, a single defective placement on 1000 boards would mean a DPMO of 1 and a yield of (0.999999)1000 so 0.999 or 99.9%. A typical board will actually have many more defect opportunities: Table 1 shows a typical board with around 1000 components having nearly 6,500 defect opportunities. Yield can usefully be calculated over the year. Given 6,000 productive hours in a year and a line cycle time of 40 seconds, that means nearly 3.5 billion defect opportunities a year (540,000*6,337 = 3,421,980,000). With 15,000 defects a year, the DPMO is just over 4 (106*15,000/3,421,980,000= 4.38). That gives a yield of Y = 97.26 % over the year.
Base material damage
Bent lead
Birdcaged wire
Blisters, mealing, peeling
Board warped or bowed
Cable made wrong
Circuitry damaged
Connector damaged
Gold not removed
Improper stress relief
Incorrect terminal flange
Insulation or wire damage
Lead bend problem
Lead coplanarity out of spec
Lead forming wrong
Lead / cable length wrong
Leads bent under
Leads not tinned
Marking incorrect
Part damaged
1
1
1
1
1
1
1
1
1
1
1
1
1
1
1
1
1
1
1
1
Part lead stressed
Plating or other finish problem
Sleeving problem
Solderability problem
Spliced where not permitted
Unprepped part
Wire damage
Wire not tinned where required
Cable connected wrong
Parts / loose / missing / wrong
Crimping wrong
Improper mounting
Lead / cable routing wrong
Min. electrical clearance violated
Part height wrong
Part misaligned
Part extra
Part mounted wrong
Tilted part
Tombstone
1
1
1
1
1
1
1
1
2
2
2
2
2
2
2
2
2
2
2
2
Wire connected wrong
Wire routing wrong
Blow holes
Cold solder joint
Disturbed solder joint
Fractured solder joint
Icicles
Insufficient solder
Lead protrusion wrong
Part coating meniscus in joint
Solder bridge
Solder wetting unacceptable
Unsoldered connection
Assembly not clean
Conformal coating absent
Conformal coating peeling
Conform. coat. present unwanted
Solder balls / splash
2
2
3
3
3
3
3
3
3
3
3
3
3
4
4
4
4
4
Components Placements Terminations Assembly
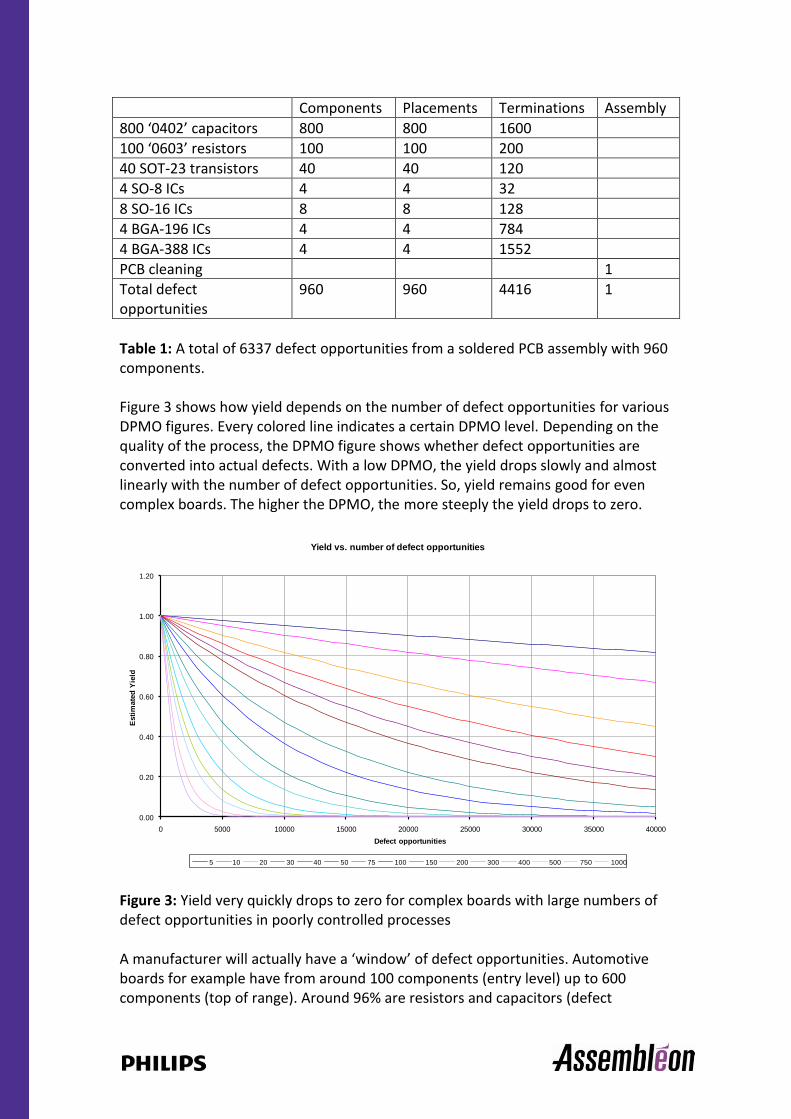
800 ‘0402’ capacitors 800 800 1600
100 ‘0603’ resistors 100 100 200
40 SOT-23 transistors 40 40 120
4 SO-8 ICs 4 4 32
8 SO-16 ICs 8 8 128
4 BGA-196 ICs 4 4 784
4 BGA-388 ICs 4 4 1552
PCB cleaning 1
Total defect opportunities
960 960 4416 1
Table 1: A total of 6337 defect opportunities from a soldered PCB assembly with 960 components. Figure 3 shows how yield depends on the number of defect opportunities for various DPMO figures. Every colored line indicates a certain DPMO level. Depending on the quality of the process, the DPMO figure shows whether defect opportunities are converted into actual defects. With a low DPMO, the yield drops slowly and almost linearly with the number of defect opportunities. So, yield remains good for even complex boards. The higher the DPMO, the more steeply the yield drops to zero.
Figure 3: Yield very quickly drops to zero for complex boards with large numbers of defect opportunities in poorly controlled processes A manufacturer will actually have a ‘window’ of defect opportunities. Automotive boards for example have from around 100 components (entry level) up to 600 components (top of range). Around 96% are resistors and capacitors (defect
0.00
0.20
0.40
0.60
0.80
1.00
1.20
0 5000 10000 15000 20000 25000 30000 35000 40000
Esti
mate
d Y
ield
Defect opportunities
Yield vs. number of defect opportunities
5 10 20 30 40 50 75 100 150 200 300 400 500 750 1000

opportunity of 4 each), and up to 4% are ICs. ICs mainly include QFP and SO types together with a few BGAs having up to 300 I/Os, giving a total average defect opportunity of say 5. That gives a total of between 2,000 and 12,000 defect opportunities per board (4-fold board). Different applications have different defect opportunity windows. Automotive boards tend to have low component count (but the cost of a defect in an automotive board can be very expensive). For mobile phones and (particularly) communications and server boards, the window shifts to right. The window for mobile/smart phones is typically between 6,000 and 20,000 and that for complex communications and server boards from 25,000 up to 60,000. For all products, the yield drops most for the larger, more expensive top-of-line products. The cost of rework correspondingly increases. Calculating rework The first pass yield gives the percentage of boards with good quality, so (1-FPY) gives the percentage of boards needing repair (rework). The average repair time per SMT defect (Table 2) gives the related time for rework.
Table 2: Average manual rework time per part. With boards having an average of 90% resistors and capacitors, the weighted average per defect is 540s, or 9 minutes. The major determining factor for yield, and therefore rework costs, is the placement technique. Sequential placement dominates the industry, with machines usually having one or two heads working at very high speeds. Parallel placement machines instead have multiple placement heads (up to 20), so the individual heads have much more time to settle before placing the component. So, for the same overall placement rate, parallel placement machines have a much steadier and more controlled placement action. Even in India and China, the difference in rework for a parallel over a sequential placement machine per line can be as high as €220,000 (Table 3).

Table 3: Average annual rework costs (line capacity approx. 100 kcph) compared for a parallel placement line (typical DPMO= 10) versus a sequential placement line (typical DPMO according iNEMI investigations = 63). The actual savings depend on the capacity of the line, and so are almost double for a line placing 200 kcomponents/hour over a 100 kcomponents/hour line (Figure 4). The difference between parallel (even at 10 dpm) and sequential placement (at 60 dpm) producing 10 million phones per year in China with say 250 SMDs per phone would be around €920,000 per year. And factories can have up to 50 or 100 lines.
Item Parallel placement line Sequential placement line
# Productive hours per year 6100 6100
Real output per line [cph] 102850 102850
# Components per board 1200 1200
# Defect opportunities per board 8504 8504
DPMO 10 63
DPU 0 1
First pass yield [%] 1 1
Average BOM cost per part [€] 0 0
Line cycle time [s] 42 42
# Repairs per hour (board level) 7 36
Average rework per hour [s] 3773 19197
# Rework operators (3 shifts) 3 16
Annual labor cost per operator [k€] 2 2
Total annual labor cost [k€] 6 29
# Rework stations needed 2 6
Annual station costs (excl. labor) [k€] 40 120
Annual BOM rework costs [k€] 3 15
Total repairs per line per year [-] 42623 216851
Total repair costs per line (per year) [k€] 49 164
Average defect coverage [%] 90 90
# Boards needing second order rework (per year) 4262 21685
Average second order rework per hour [s] 3773 19197
# Rework operators (3 shifts) 3 16
Total annual labor cost [k€] 6 29
# Rework stations needed 2 6
Annual station costs (excl. labor) [k€] 40 120
Annual BOM rework costs [k€] 0 1
Second order repair costs (per year) [k€] 46 150
Total repair costs per line(incl. defect recov. per year) [k€] 95 314

Figure 4: Rework costs DPMO and annual rework as function of line capacity. Rework costs are thus a factor 3.5 lower for benchmark pick & place machine lines, and that is just in the low-wage countries. Savings are even higher for the USA and Western European countries, where wage costs are some 10 or 20 times higher. In Germany they can rise to € 870,000 per line per year for automotive engine controllers (typically 340 components per circuit, 6 circuits per board, around 10,000 defect opportunities per board and a line capacity of 130 kcph). That allows manufacturers to keep their production lines in Europe, saving on distribution and logistics costs while retaining all the advantages of short supply lines.
Inspection methods need to be combined Even in the best controlled processes, defects tend to come in groups. In well controlled processes, though, the reasons for the defects can be quickly found and corrected (Figure 5). Actually finding the defects is however becoming more difficult.
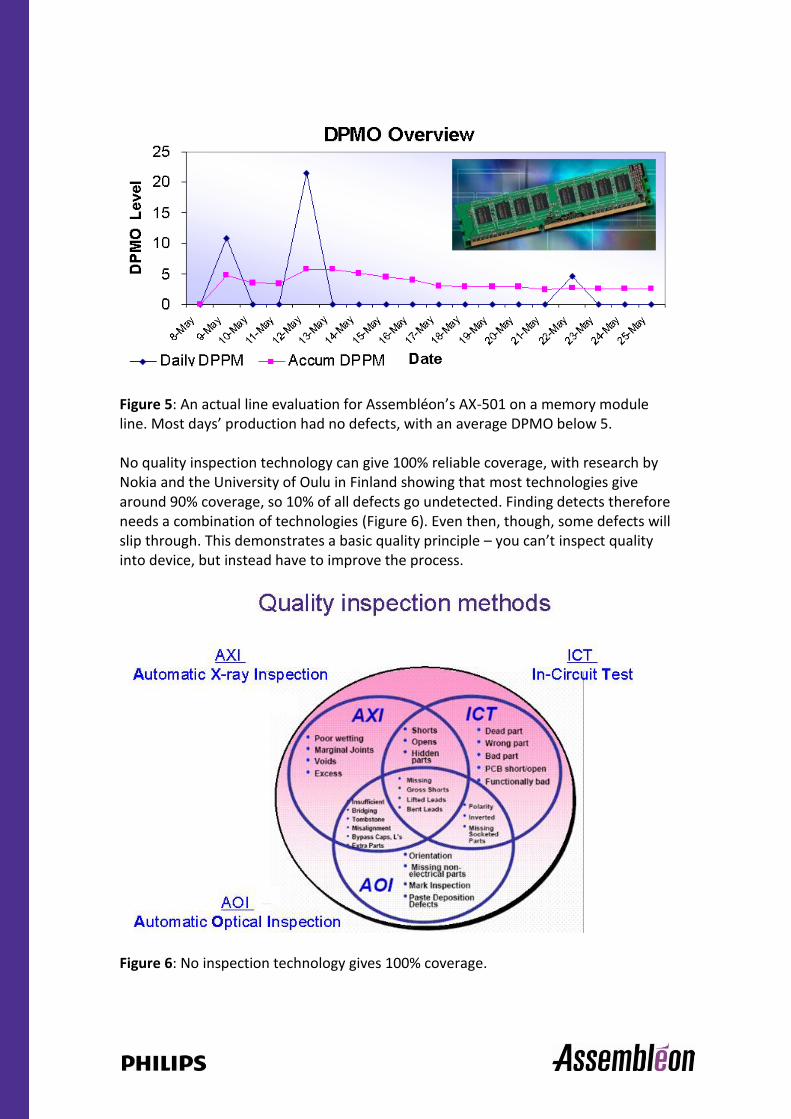
Figure 5: An actual line evaluation for Assembléon’s AX-501 on a memory module line. Most days’ production had no defects, with an average DPMO below 5. No quality inspection technology can give 100% reliable coverage, with research by Nokia and the University of Oulu in Finland showing that most technologies give around 90% coverage, so 10% of all defects go undetected. Finding detects therefore needs a combination of technologies (Figure 6). Even then, though, some defects will slip through. This demonstrates a basic quality principle – you can’t inspect quality into device, but instead have to improve the process.
Figure 6: No inspection technology gives 100% coverage.

Whole line rework costs State-of-the-art screen printers like Assembléon’s MCP offer process quality below 10 defects per million components. High yield here too demands tight process control, and the MCP varies the squeegee contact angle to dispense the exact amount of solder needed by each component. The squeegee is servo-driven and has a variable attack angle to improve filling levels for a flat final paste layer with even thickness across the deposit. Otherwise, large components can suffer from too little solder while small components (particularly ‘01005’ chip components) have too much. Realistically, the industry-wide DPMO for stencil printers is above 25 dpm . For pick & place machines it is around 25 dpm, with the worst giving 50 or more. When buying a line, it is therefore essential to check the dpm figures for the pick & place machines – if the manufacturer gives them (it is the most important figure of merit for a pick & place machine, so a missing figure suggests something to hide). Compared with a whole-line benchmark figure of 25 dpm, typical and poor figures would be 50 and 100 respectively. From Table 4, a complex smart phone produced on a whole-line DPMO of 25 would give a 59% yield. For a DPMO of 50 the yield drops below 40%, and for 100 it is an impossibly low 12%.
Table 4: Cost of rework for different defect DPMOs in different industries and manufacturing countries (assuming 6100 productive hours per year, 100,000 components/hour output). These are only the visible costs. As the ‘rule of 10’ suggests, detecting a defect at final test costs ten times more than detecting it immediately after placement, ten times more than that at the retailer, and ten times more than that in the shop.
Engine controller
(Germany)
Components
per board
Defect
opportunities
per board FPY
Annual rework cost
(per line) [k€]
Rework cost
above benchmark
(per line) [k€]
DPMO = 25 78% 506 0
DPMO = 50 61% 886 380
DPMO = 100 37% 1418 912
Smart phone (Canada)
DPMO = 25 59% 365 0
DPMO = 50 35% 570 205
DPMO = 100 12% 764 399
Notepad PC (China)
DPMO = 25 80% 153 0
DPMO = 50 64% 220 67
DPMO = 100 41% 379 226
2040
(6-fold board)10038
3740
(4-fold board)20960
1400
(2-fold board)8870

And recent quality problems in well-known car brands illustrate another basic rule of quality improvement: faults that get through to the customer are the most expensive of all – they damage your reputation. References
1. Dr. David M. Anderson: ‘Design for manufacturability & concurrent engineering’, CIM Press 2008, ISBN 1-878072-23-4.