impressum - microfinance · the study was funded by the german government through the german ......
TRANSCRIPT


As an international cooperation enterprise for sustainable development with worldwide operations, the federally
owned Deutsche Gesellschaft für Technische Zusammenarbeit (GTZ) GmbH supports the German Government
in achieving its development policy objectives. It provides viable, forward looking solutions for political, economic,
ecological and social development in a globalised world. Working under difficult conditions, GTZ promotes
complex reforms and change processes. Its corporate objective is to improve people’s living conditions on a
sustainable basis.
GTZ is a federal enterprise based in Eschborn near Frankfurt am Main. It was founded in 1975 as a company
under private law. The German Federal Ministry for Economic Cooperation and Development (BMZ) is its major
client. The company also operates on behalf of other German ministries, the governments of other countries and
international clients, such as the European Commission, the United Nations and the World Bank, as well as on
behalf of private enterprises. GTZ works on a public-benefit basis. All surpluses generated are channeled back into
its own international cooperation projects for sustainable development.
GTZ employs a 10,000 member staff in more than 120 countries of Africa, Asia, Latin America, the Eastern
European countries in transition and the New Independent States (NIS). Around 9,000 of these staff are national
personnel. GTZ maintains its own offices in 67 countries. Some 970 people are employed at its Head Office in
Eschborn near Frankfurt am Main. In addition, 365 staff members work for supra-regional projects based at
various locations within Germany.
Impressum
Authors: Cristina Modoran, Lutz Grashof
Co-ordination and Editing: Roshini Fernando, Anjali Tennekoon
Design: Markolf Maczek
Printed by: Karunaratne & Sons Ltd
Colombo, 2009
About GTZ

MICROFINANCE INSTITUTIONSIN SRI LANKA 20
09i
Acknowledgements iii
Acronyms & Abbreviations iv
Executive Summary v
Methodology xii
Part I Profile of Microfinance Providers
1. Sanasa 5
2. Cooperative Rural Banks 21
3. Samurdhi Bank Societies 35
4. NGOs 47
5. Regional Development Banks 61
6. Banks & Other Financial Institutions 73
Part II The Consolidated Sector
1. Microfinance – an overview of the concept among
Sri Lankan microfinance providers 95
2. Governance issues in the microfinance sector 98
3. Clients 102
4. Microfinance outlet network 106
5. Operations 108
6. Products and Markets 114
7. Human Resources 120
8. Financial Performance 124
Conclusions 126
Contents

ii

MICROFINANCE INSTITUTIONSIN SRI LANKA 20
09iii
Acknowledgments
Microfinance in Sri Lanka has a long history and providers of microfinance services are numerous and diverse. It
is perhaps this very diversity that has resulted in there being no single source of information on the entire sector.
With different types of microfinance providers being under the purview of different authorities no comprehensive
picture of the sector has so far been available.
It is in response to this information vacuum that the GTZ ProMiS (Promotion of the Microfinance Sector)
programme in collaboration with the Ministry of Finance & Planning commissioned an islandwide survey of
microfinance providers. The study was funded by the German government through the German Federal Ministry
for Economic Cooperation and Development (BMZ).
We acknowledge the efforts of TNS Lanka whose Social Research Unit undertook the challenging task of carrying
out this survey. We particularly acknowledge the contributions of Ms. Erandi Kodikara, Ms. Ayoma Sanderatne
and Ms. Dilini Jayasuriya who were principally involved in coordinating and conducting the survey. Thanks are
also due to Mr. Anura Atapattu who provided important inputs to the TNS research team in guiding them through
the survey.
We wish to express our thanks and appreciation to the authors of the report, Ms. Cristina Modoran and Mr. Lutz
Grashof for the considerable effort and patience with which they handled this assignment which was fraught with
many difficulties and complications resulting from the large number of respondents involved, differences in the
quality of information obtained and the very large volume of data which had to be analyzed.
The contribution of Mr. Markolf Maczek in providing the original design for the report and the initial editing work
undertaken by Ms. Anjali Tennekoon are also acknowledged and much appreciated.
Thanks also go to Ms. Roshini Fernando, Senior Microfinance Specialist of ProMiS for coordinating the entire
assignment, providing specialist input and editing support, and the staff of the Department of Development
Finance of the Ministry of Finance & Planning for their assistance and cooperation.
Finally, but by no means the least, we wish to thank the German government which provided the funding for this
study. Although the production of this report has been a long and difficult process, we are nevertheless confident
that it will prove to be a valuable store of information and hope that it may serve as a basis for further research on
the microfinance sector.
Dr. Dagmar Lumm Dr. Damitha De Zoysa
Senior Advisor Director General
GTZ-ProMiS Department of Development Finance
Ministry of Finance & Planning
September 2009

iv
Acronyms & Abbreviations
AGM Annual General Meeting
BOC Bank of Ceylon
BoD Board of Directors
CBO Community Based Organization
CBSL Central Bank of Sri Lanka
CRB Cooperative Rural Bank
CRIB Credit Information Bureau
FC Finance Company
GTZ Deutsche Gesellschaft für Technische
Zusammenarbeit (German Agency for
Technical Cooperation)
HNB Hatton National Bank
IBSL Institute of Bankers of Sri Lanka
IC Insurance company
ILO International Labour Organization
IT Information technology
KYC Know Your Client
LKR Sri Lanka Rupees
LOLC Lanka Orix Leasing Company
MFI Microfinance Institution
MIS Management Information Systems
MPCS Multi-Purpose Cooperative Society
NGO Non Governmental Organization
NPL Non Performing Loan
OFI Other financial institution
PaR Portfolio at Risk
PBPL Persons Below the Poverty Line
ProMiS Promotion of the Microfinance Sector
RDB Regional Development Bank
ROA Return on Assets
ROE Return on Equity
RRDB Regional Rural Development Bank
SBS Samurdhi Bank Society
SDO Samurdhi Development Officer
SEEDS Sarvodaya Economic Enterprise Development Services
SU Secondary Union
TCCS Thrift and Credit Cooperative Society
WDC Women’s Development Cooperative

MICROFINANCE INSTITUTIONSIN SRI LANKA 20
09v
This study endeavours to present a comprehensive
picture of the microfinance sector in Sri Lanka,
a complex sector, yet characterised by significant
fragmentation. The outreach of microfinance services,
especially savings and deposit products is considerable,
and financial services are often accompanied by non-
financial facilities. Access to loans remains below its
potential, with barriers still existing for the lower income
Executive Summary
AuditAlthough CRBs and SANASA TCCSs are supposed
to be audited by the Department of Co-operative
Development, a significant number of them are in fact
reported to be audited only internally. SBSs, which are
supposed to be audited by the accountants of Divisional
Secretariat offices, also lack a meaningful external audit.
Even when audit is performed in the case of these
institutions, resource constraints have a bearing on its
quality and on its timely release. Furthermore, most
auditors lack microfinance specific knowledge, which
has an impact on the quality of the analysis.
groups. However, despite a fairly high degree of outreach,
the microfinance market seems to be characterised by a
proliferation of traditional products (savings, loans) with
few products and services beyond these (e.g. insurance and
money transfer services). The growth of the microfinance
sector is hampered by the lack of a coherent regulatory
and supervisory framework, governance issues, the lack of
technology and staff related issues.
GovernanceRegulation and supervisionThe rapid development of microfinance in the last
decades, characterised by increasing value of assets
and extensive outreach raises significant regulation,
ownership and governance issues. The sustainable
development of the microfinance sector and its
inclusion in the financial system depend on the efforts
to adopt best practices and to implement a regulatory
environment conducive to growth.
The absence of a coherent regulatory and supervisory
framework for the microfinance sector represents a
barrier to its development. Different authorities are
responsible for the supervision of the different types of
microfinance institutions: the Samurdhi Bank Societies
(SBSs) are regulated by the Samurdhi Authority of Sri
Lanka; the Co-operative Rural Banks (CRBs) and
SANASA Thrift and Credit Cooperative Societies
(TCCSs) are regulated by the Department of Co-
operative Development; the Regional Development
Banks (RDBs), as well as commercial banks and
finance companies fall under the responsibility of the
Central Bank of Sri Lanka; insurance companies come
under the scrutiny of the Insurance Board of Sri Lanka.
Thus the regulatory and supervisory framework lacks
uniformity, as different authorities employ different
methods and standards of supervision. Furthermore, a
considerable group of microfinance providers (NGOs)
escapes financial regulation and supervision. Since
most of the NGOs mobilise savings either directly
as deposits or disguised as member shares, there is a
pressing need for them to be monitored by an external
independent authority in order to protect the interests
of depositors.
A high percentage of NGOs are audited both externally
and internally, while a further significant number is
subjected to external audit only. This has to be positively
acknowledged since most of the NGOs are not legally
required to do so. According to our survey, only 24%
of NGOs are registered under the Companies Act,
being thus required by law to be audited annually. The
fact that such a large number of NGOs are audited
externally can be attributed to the influence of donors,
who often link their support to the availability of
meaningful audited information and offer funding to
support the costs thus incurred.

vi
Decision making processThe organisational structure of a microfinance
institution impacts its efficiency and its potential
to reach its objectives. The majority of institutions
seem to operate with a highly centralized decision
making structure, even up to the level of the Board of
Directors. The highest degree of centralisation is found
in the case of SBSs, where all operating policy decisions
are reported to be taken at the level of the Board of
Directors of the Samurdhi Authority.
ClientsOutreachMicrofinance providers have an extensive outreach
reaching out to over 7 million clients, excluding the
number of clients of the CRBs for which an estimate
was impossible to obtain. Despite the fact that most
microfinance providers do not gather client information
and the consequent impossibility of accurately
Political interference in appointments of personnel
and in the day to day management of MFIs can
endanger their viability. In the case of a large number
of institutions, microfinance activities are intertwined
with other types of activities (CRBs with the activities
of Multi-Purpose Cooperative Societies, SBSs with
the Samurdhi welfare schemes, NGOs with social
activities), which can result in conflict of interests and
objectives.
estimating the overall outreach of microfinance services
in Sri Lanka, its breadth seems to be considerable.
Member-based MFIs appear to have the broadest
outreach, with CRBs, SBSs and TCCSs reaching a
large number of clients.
Target groupAmong the different types of microfinance providers,
NGO MFIs seem to be the group with a most focused
approach, with 93% of them setting themselves target
groups (e.g. women, low income individuals) for their
microfinance business. Considering their social mission
and their stronger focus on development, this is not
surprising. At the other end of the spectrum, insurance
companies which provide micro insurance seem to be
the group with the weakest target group orientation.
Only 29% of the respondents from this group have a
focus on specific groups.
Based on the reported information, the RDBs and
CRBs seem to have a greater focus on lower-income
households, while banks involved in microfinance focus
more on micro-entrepreneurs, and SANASA TCCSs
and NGOs have a greater focus on women clients.
Gender focusSince the modern microfinance movement is
characterised by a special focus on women, we asked
respondents to estimate the percentage of female
customers among their overall microfinance clientele.
Based on the responses received, NGOs seem to have
the largest share of female customers. At the other end
of the scale, formal financial institutions have the lowest
share of female customers – the majority of the banks,
finance and insurance companies interviewed declared
their microfinance customers to be mainly male.
Income and activity profileAlthough the majority of MFIs mentioned that they
focus on lower income groups a closer look at the
income profile of their clients reveals that a relatively
small proportion of microfinance clients fall within the
definition of lower income groups. Even in the case of
NGO MFIs, only half of the clients have a monthly

MICROFINANCE INSTITUTIONSIN SRI LANKA 20
09vii
household income less than or equal to Rs. 3,000.
Borrowers in this income group account for 25% of
the clients of CRBs, 20% of the clients of SANASA
TCCSs and 19% of the clients of RDBs. As expected,
banks and other formal financial institutions involved
in microfinance have the lowest outreach among the
poorest layer of clients: only 7% of their customers
have a monthly household income below Rs. 3,000.
The same ranking in terms of outreach to the lower
income group is maintained even if the threshold level
for this group is raised to Rs. 5,000.
Outlet networkMicrofinance providers have an extensive network
in the country with over 10,800 outlets covered by
our survey. The SANASA movement has the largest
number of active outlets, followed by NGOs (with over
2,000 CBOs affiliated to SEEDS). In terms of regional
distribution, the largest share of these outlets is found
in the Southern Province and in the rural sector.
All groups of institutions with the exception of
banks and other financial institutions display strong
correlations between the sectoral (i.e rural, urban
and estate sectors) distribution of their outlets and
poverty distribution. The tightest correlation between
With the exception of banks and other formal financial
institutions, other institutional groups have clients
with a similar profile in terms of economic activity: the
highest proportion of clients is involved in agriculture
(between 38% and 45%), followed by similar
proportions of clients (between 9% and 20%) involved
in fisheries and animal husbandry, manufacturing and
trading. The highest heterogeneity is displayed by the
proportion of clients involved in the service sector: their
share in the total client base varies from 3% in the case of
NGOs to 54% for banks and other financial institutions.
the regional distribution of outlets and poverty
distribution is displayed by CRBs, followed closely
by SBSs and TCCSs. Therefore it seems the outlet
network of the co-operative sector, as well as that of the
Samurdhi programme is well positioned to reach the
country’s poor. A surprisingly low degree of correlation
is displayed by NGO MFIs, a situation which can be
explained by 1) the over-proportionate concentration
of this group in the Southern and North-Central
provinces relative to the corresponding proportion of
Persons Below the Poverty Line (PBPL), and 2) the low
presence in provinces with high poverty incidence such
as Uva and Sabaragamuwa.
OperationsClient relationsPresence in the field is utilised by most institutions
to identify and screen potential clients. This is an
advantage that many grass-root level NGO MFIs have
over formal financial institutions. Closeness to clients
is especially important in microfinance to prevent
moral hazard issues which could arise in the absence
of collateral.
The survey reveals that microfinance providers rely
strongly on guarantees (group or personal) to secure the
loans granted to their clients. A worrying finding of the
survey is that, with the exception of NGOs and SBSs, a
large number of microfinance providers require various
forms of collateral. This suggests that a considerable
number of people from the lowest layer of the income
distribution may still face significant barriers to accessing
credit. It may well be that collateral requirements are
reduced as compared to traditional finance, but the
requirements in place among microfinance providers
may still exclude some of the most vulnerable clients.
The provision of microfinance services in Sri Lanka
seems to be mainly oriented towards individual clients
and to rely less on group lending mechanisms. The
latter seem to be used on a wider scale in the provision
of insurance services to microfinance clients. Wholesale
lending to other institutions is a marginal activity, with
the exception of secondary TCCS unions belonging to
the SANASA movement and some NGOs.

viii
Processing time and approval procedureIt is interesting to notice that for loans, both the
shortest and the longest average processing times are
found among formal providers of financial services.
Finance companies with an average of two days and
commercial banks with an average of eight days seem to
be the quickest in processing loans, while RDBs require
26 days for the same. The lack of computerisation of
operations of most microfinance providers (with the
exception of those belonging to the formal financial
In over two thirds of the institutions surveyed, operations
and processes are performed manually, especially in
member-based microfinance institutions such as SBSs,
SANASA TCCSs and CRBs. Over half of NGOs
and banks and other financial institutions, as well as
all RDBs, employ a mix of manual and computerised
operations. Fully computerised operations are present
only in the group of banks and other formal financial
institutions.
sector) has a negative impact on the processing time of
loan applications.
The loan approval procedures involve several steps in
most cases (with the exception of banks and finance
companies), with applications having to be referred
to credit committees and/or regional level bodies
for approval. This can also explain the long average
processing time for loans.
Access to technologyMember-based societies such as SANASA TCCSs
and CRBs almost entirely lack access to modern
communication technologies (email, internet facilities).
Combined with the lack of language skills among staff
this represents a significant barrier to the dissemination
of international best practices within the sector.
Defaulting clientsWith the exception of NGO MFIs, engaging in legal
action was cited by over 80% of the respondents as a
means of dealing with defaulting clients. This is a rather
surprising finding, as microfinance loans are mostly so
small in value that it seems hardly probable that the
cost of legal action is justified. From this perspective,
arbitration seems to be under-utilised. It could be
that engaging in legal action is considered by MFIs as
a deterrent to other clients who would otherwise be
tempted to default, thus offering a justification for such
a costly and lengthy course of action.
NGO MFIs adopt a different approach to other
microfinance providers, with more emphasis placed on
group or social pressure, arbitration and recovery from
guarantors. This approach seems more appropriate
in the case of microfinance loans, as it functions also
in the case of low-income clients from whom little
compensation can be obtained through legal action,
seizing of property and other forms of physical
collateral.
Portfolio managementThe survey reveals a widespread lack of understanding
of principles and best practices with respect to portfolio
management. In view of the fact that the interviews
were conducted at high management levels, this is a
worrying fact. A large number of respondents could not
distinguish between portfolio management measures
and activities employed in dealing with defaulting
clients.
The majority of respondents claim to measure
Portfolio-at-Risk as a means of monitoring portfolio
quality. However, it is clear that the understanding of
this concept varies considerably. Only a minority of
respondents could provide a correct definition of this
concept. Adequate monitoring of the loan portfolio is
also made difficult due to the lack of technology which

MICROFINANCE INSTITUTIONSIN SRI LANKA 20
09ix
forces many MFIs to rely extensively on a manual
system of record keeping.
The concept of non-performing loans seems to be better
understood. The majority of respondents associated
this concept with an age classification of overdue loans,
but there were large differences in the classification.
Most of the classifications adopted are similar to those
of banks and not tailored to take into account the
specific nature of microfinance operations. With regard
Operational challengesWith the exception of the group of banks and other
financial institutions, where the operational challenges
identified were quite diverse and less marked, which is not
surprising considering that these are strong institutions
with experience in the provision of financial services,
for the other groups there seems to be a large degree
of consensus as to the challenges faced. Difficulties in
to provisioning for doubtful and non-performing
loans, with the exception of RDBs, banks and finance
companies which are regulated by the CBSL, the
number of institutions which have provisioning policies
in place is quite modest. The survey also reveals that
provisioning is more often associated with the total
loan portfolio or revenue, than with non-performing
loans or portfolio-at-risk.
ensuring repayment of loans, strong competition, and
difficulties in obtaining funding for their microfinance
operations, as well as inadequate technology and
equipment are the operational challenges mentioned
most often by the respondents across the different
groups of institutions.
Products and marketsThe Sri Lankan microfinance market seems to be to
a certain extent conservative, focusing more on the
proliferation of variations of the same traditional
products, and lacking innovative approaches which
could overcome the inherent barriers in access to
microfinance. Increasing competition in the sector
might provide the necessary incentive for MFIs to
innovate more in terms of products offered, as well as
in their marketing strategies.
ProductsThe most common products offered by microfinance
providers in Sri Lanka are savings and deposits, loans
and pawning. All SBSs, TCCSs, CRBs, RDBs and
banks, as well as 89% and 60% respectively of the
NGO MFIs and finance companies surveyed, offer
savings and deposit products. All SBSs, TCCSs, RDBs
and banks, as well as 99% of CRBs, NGOs and 80% of
finance companies offer a wide range of loan products.
Pawning is offered by all RDBs, 82% of CRBs and 71%
of banks and 40% of finance companies. Leasing and
insurance represent niche products which are largely
offered by specialised leasing and insurance companies.
The microfinance market seems to be characterised by
a high degree of competition, especially on the savings
and deposits segment.
Product developmentProduct development is mostly carried out at a central
level utilising inputs provided by the branches. In the
case of all groups of institutions, considerably more
products have been introduced than withdrawn from
the market within the last two years. SBSs and RDBs
seem to have been most active in introducing new
products to the market, while at the same time keeping
all existing products as well. This shows a tendency

x
towards product proliferation, without perhaps little
attention given to the profitability of individual
products.
Around 80% of the respondents from each type of
microfinance provider state that they plan to introduce
Product delivery and marketing strategiesMicrofinance products are mainly delivered through
the outlet network of the MFIs although a considerable
share also relies on their field officer network for
product delivery. The latter system has the advantage
of reducing barriers to access for low-income groups,
which might be less mobile and unable to bear the
transport costs of visiting the MFI. However, the cost
to the institution is higher with this system. Links with
other institutions play an important role in product
delivery for NGOs and RDBs.
new microfinance products. However, when asked
to elaborate, the majority cite traditional products,
with only a minority quoting money transfer services,
pension products or leasing. This suggests a low level of
innovation among most microfinance providers.
The marketing instruments most widely employed by
microfinance providers are promotional material in
the form of leaflets and banners, posters or hoardings.
The most preferred marketing strategy depends on the
type of institution. NGO MFIs and SANASA TCCSs
rely mostly on promotion through clients or members
while CRBs utilise the non-microfinance activities of
MPCSs.
Human resourcesThe microfinance institutions covered in the survey
report that they employ a total of 67,909 staff. Banks
and other financial institutions are by far the group with
the most numerous staff. However, when considering
the number of staff involved in microfinance activities
(a total of 45,752), CRBs have the lead, followed by
NGOs. As CRBs have the largest reported number
of microfinance accounts (both savings and loans)
the large number of staff may be justifiable. The large
number of staff in NGO MFIs may be explained in part
by the focus given by this group of institutions to non-
financial, ‘credit plus’ services which are generally staff
intensive. It is also noteworthy that only a minority of
the respondents (between 12 and 28%) who provided
this information report that their microfinance staff is
exclusively involved in microfinance activities.
There are significant differences in the type of
employment offered to microfinance staff across the
different groups of institutions. While in the more
traditional finance institutions, such as banks, finance
companies and RDBs, the majority of microfinance
staff is employed on a permanent basis, member-
owned institutions rely more on temporary staff and on
volunteers. The percentage of volunteer staff is highest
in the SANASA TCCSs – representing 94% of their
microfinance staff, according to the survey.
With the exception of SANASA TCCSs, between a fifth
and a third of the microfinance staff holds managerial
positions. The case of SANASA is a special one, with
69% of the microfinance staff being reported to occupy
managerial positions. This could be explained by the
small size of the majority of TCCSs, which suggests
that managerial staff is involved in a broader range of
operational activities, which are traditionally performed
by non-managerial staff in larger organisations. Another
explanation could be linked to the large number of
volunteer staff to whom these positions are awarded
more liberally, having also the function of a non-
pecuniary reward.
The share of credit and field officers varies significantly
across institutions (from 7% to 47%), depending on
the particular mechanisms of product delivery and on
the procedures in place for appraisal and approval of
loan applications.

MICROFINANCE INSTITUTIONSIN SRI LANKA 20
09xi
ChallengesThe respondents identify similar recruitment challenges
for all three types of positions – managerial, clerical and
credit / field officer. The absence of retirement benefits,
the difficulty of finding people with the necessary skills
and with microfinance experience, as well as operating
in unattractive locations have been identified by most of
the respondents as major challenges in the recruitment
of staff for their microfinance operations.
Inadequate remuneration and incentives, together
with the lack of technology were the main challenges
mentioned by TCCSs, CRBs and NGOs when it
comes to retaining qualified staff in the organisation.
The difficulty nature of field operations was mentioned
by half of the RDBs and by a quarter of banks and
other financial institutions.
Almost all respondents cite training opportunities to be
one of the most important incentives offered to their
microfinance staff. In addition to this, the majority
of respondents mention performance appraisals and
performance linked rewards schemes as incentives
offered to their microfinance staff. Considering the
retention challenges mentioned by the respondents,
the incentive structure does not seem to meet the needs
of the staff.
Staff developmentManagerial staff seems to receive a broad range of
courses, which hints to a lack of focus on relevant issues
corresponding to their activities and responsibilities.
Courses such as customer care, record keeping and
marketing are more relevant for other staff categories
than for managers. The lack of focus on training
relevant to the nature of duties is also manifested in the
training offered to other staff categories (clerical, field /
credit officers). Microfinance providers should strive to
achieve better correlation between the training offered
and the actual training needs of the staff in order to
improve the capacity of their staff to address current
issues and challenges.
Managers also benefit from the largest average number
of training sessions a year across all microfinance
institutional groups. Banks and other financial
institutions have by far the highest number of training
sessions per organization, while CRBs seem to offer the
least training opportunities to their microfinance staff.
Financial performanceDespite efforts to gather information regarding the
financial performance of microfinance providers in
Sri Lanka, a clear picture in this respect could not be
obtained. A series of issues, among which we mention
the lack of transparency, the lack of microfinance
specific financial data, poor data quality and the lack of
comparability, have made it impossible to analyse the
financial performance of the microfinance sector. There
is certainly room for improvement in the processes of
financial data collection, monitoring and disclosure in
the microfinance sector in Sri Lanka. All stakeholders
should commit to this objective in order to ensure the
long-term viability of the sector.

xii
BackgroundThere are a number of different institutional providers
of microfinance in Sri Lanka. Detailed information
on the operations of these institutions is difficult
to obtain and not usually available from one source.
Sector information is generally fragmented and the
depth of information available varies according to the
type of institution. In this context, the Promotion
of the Microfinance Sector (ProMiS)1 programme
commissioned a survey of institutional providers of
microfinance across Sri Lanka in order to obtain a
comprehensive picture of microfinance institutions
and their operations. This helps to identify potential
economies of scale, provide scope for learning from
the different organisations and their operating models
and avoid duplication of services. TNS Lanka was
commissioned to carry out the survey.
It was decided that the survey would cover all districts
of the country except a few in the Northern Province
which could not be accessed due to the then prevailing
conflict. The survey focused on all institutions which
provide financial services to low income individuals
and micro enterprises including commercial and
development banks, finance companies, leasing
companies, insurance companies and NGOs engaged
in microfinance activities. All institutions having a
microfinance client base of at least 500 were considered
eligible to participate in the survey.2
The following section explains the methodology
which was adopted for the listing of microfinance
institutions.
Identification and listing of microfinance institutions (MFIs) in Sri LankaFive field supervisors were allocated to the various
districts to collect the relevant information on all
financial institutions providing microfinance services.
Three forms were prepared for the purpose of listing
1 ProMiS is implemented by the Ministry of Finance & Planning in collaboration with German Technical Cooperation (GTZ) on behalf of the German government.
2 The threshold client base was reduced to 100 for microfinance institutions in the Northern and Eastern provinces.
the MFIs. It was decided that the screening process
would be carried out in three stages.
In the first stage, interviewers instructed by the
supervisors created a list (Form 1) of all possible
sources from which information could be obtained
on institutions providing microfinance services. (eg.
District/Divisional Secretariats, Provincial Councils,
Business Registration Department, Registrar of
Companies, etc.).
The second step was to visit all the potential sources
of information identified above and complete the
contact sheet (Form 2) with contact information of
the institutions that were assumed to be providing
microfinance services. Since the universe of microfinance
providers was unknown, the process of identification of
microfinance providers followed the snowball sampling
method whereby the initial sources approached
for information might provide further sources of
information and so on. Information on microfinance
institutions was also gathered through sources such
as the directory of NGOs published by The Ministry
of Social Development. Additional information was
obtained from relevant web sites.
The completed contact sheet was more or less a list
of the majority of MFIs in the country. At this stage
it was helpful to identify and separate the MFIs
eligible to participate in the survey from those who
were considered non-eligible due to insignificant
microfinance operations based on the client threshold.
In the final step of the listing exercise, Form 3
(recruitment questionnaire) was used to capture
information from eligible microfinance institutions
selected from the contact list. As much basic information
as possible including the names, contact details of the
organization, number of microfinance clients etc, was
recorded in the recruitment questionnaire.
Information gathered in all 3 forms was then entered into
an Excel worksheet. The end result of this process was a
comprehensive list of institutions providing microfinance
Methodology

MICROFINANCE INSTITUTIONSIN SRI LANKA 20
09xiii
in the country based on the eligibility criteria developed
by ProMiS which was: “having a total microfinance client
base of at least 500 (100 in the North and East)”.
Main SurveyThe enumerators, selected from the respective districts
where the survey was to be conducted, were briefed by
the researchers on all aspects of the main questionnaire
before being sent to the field. Best efforts were made
to conduct face-to face interviews in all areas, failing
which telephone interviews had to be conducted. This
situation occured particularly in the North and East.
The estimated time per interview was 45 minutes,
but it was found that the actual time taken was 60 -
90 minutes as most of the respondents were not in
a position to provide all the requested information
immediately.
Prior to the survey being carried out, ProMiS advertised
details of the survey in the local newspapers with
the intention of creating awareness and securing the
cooperation of the respondents.
The majority of the institutions identified in the listing
process were interviewed successfully. However, a few
institutions had to be excluded due to ineligibility for
the survey, although initially captured as eligible in the
listing survey.
The enumerators were instructed to investigate
and contact the institutions for which incomplete
information was gathered during the listing process.
As the first part of the main questionnaire consisted of
some screening questions the interviewer was able to
decide on the eligibility of the newly added institutions
to participate in the survey. When the respondent
did not meet the eligibility criteria the interview has
terminated after the screening questions.
Supervision and Quality Control The normal quality checks were followed while
carrying out the survey. Quality of the data was
checked by accompaniment and spot checks by the
field supervisors. Back checks were also carried out over
the phone in most cases.
The completed questionnaires were scrutinized on
the field by the supervisors and missing information
re-gathered from the respective respondents; hence,
any omissions were rectified before the data coding and
entry stage.
Following the fieldwork the data was coded and entered
and statistically analyzed using SPSS.

xiv

Part I
Profile of Microfinance Providers

2

Sanasa

4

MICROFINANCE INSTITUTIONSIN SRI LANKA 20
095
1.1 Institutional Background
The network of Thrift and Credit Cooperative Societies
(TCCSs), which form the SANASA (a Sinhalese
acronym for financial cooperatives) network, was
established as early as 1906. TCCSs were introduced
by the British colonial administration and were the first
credit cooperatives to be set up in Sri Lanka. Up to the
end of the 1930s, they fulfilled a wider role, being also
involved in procurement of inputs and distribution of
products on behalf of the cooperatives. This function
was subsequently taken over by the Multi-Purpose
Cooperative Societies.
During the 1970s, the TCCSs were in decline and the
plan of the Department of Cooperatives at that time
was to wind up operations and close remaining societies.
however, under the leadership of P.A. Kiriwandeniya,
the movement was revived and significantly reorganised
under the SANASA banner in the late 1970s. During
this period of revival and reorganisation, the mission
and vision of the SANASA movement were more
precisely defined and the social dimension of the
program gained importance. The network orientated
its focus towards poverty alleviation and started to
increasingly target low-income groups at village level.
The SANASA PTCCS network has thus grown from
1,500 societies at the beginning of the 1980s to 8,440
registered PTCCSs in 2007, of which about a third are
active.
Organisational reforms were also needed to prepare the
societies for the open economy which was established
in 1977. For this purpose between 1978 and 1980 the
first 7 District Unions (DUs) were established, which
subsequently joined to form a National Federation,
giving SANASA its present three-tier structure. By
1985 all 25 districts had a DU. Due to practical
administrative reasons the number of secondary tier
unions was increased after 1987 to 48 including both
DUs, as well as regional unions. Currently, only 34 of
them are active.
1. SANASA Thrift and Credit Cooperative Societies
For the purpose of this survey 22 representatives
of secondary unions (SUs) of Thrift and Credit
Cooperative Societies and six Shakthi Officers3 were
interviewed regarding the activities of the SUs and of
the respective Primary Thrift and Credit Cooperative
Societies (PTCCS) under their umbrella. The
following districts could not be covered during the
survey: Gampaha, Killinochchi, Mullaittivu, Vavuniya,
and Mannar. In addition, SANASA functions in the
Puttalam and Anuradhapura districts have been taken
over by SANASA Development Bank4, therefore no
secondary union is in place in these two districts.
Data concerning the other two SANASA companies
offering financial services – SANASA Development
Bank and SANASA Insurance Company are covered
in the fifth chapter of this report “Banks and Other
Financial Institutions”.
The majority of SUs (64%) and PTCCS (86%) offer
both financial and non-financial services. While
PTCCSs provide these services to their members/
clients (i.e. individuals), SUs as district federations
cater primarily to their member PTCCSs. However,
18% of SUs also provide financial services directly to
customers. 14% of the PTCCSs offer financial services
only.
On average, 76% of the activities of PTCCSs and 61%
of SUs are considered by the respondents to be related
to microfinance. The most prevalent definition of
microfinance is: providing loans to low income groups
and small businesses as capital investments in order to
empower them. It seems that most respondents do not
3 Field staff hired for the purpose of supporting the consolidation of selected TCCSs in one area. The Shakthi Programme was initiated in 2000 with the purpose of improving the monitoring, reporting and MIS at primary society level. The programme is now in its third phase and has as mandate to strengthen 1,000 PTCCSs with a focus on three aspects: finance and accounting (setting up procedures and proper accounting systems), product development and organisational structure and community service development.
4 SANASA Development Bank was established in 1997 as a licensed special bank with the purpose of serving as a specialised apex body for the SANASA Movement, a function which it has since taken over from the SANASA Federation. SANASA Development Bank is covered in the present report under chapter 5: Banks and Other Financial Institutions.

6
distinguish microfinance from microcredit, despite the
fact that savings mobilisation is a key activity for all
SUs/PTCCSs.
In defining microcredit some SUs/PTCCSs slightly
expand their definition of microfinance by broadening
the purpose of lending to non-productive purposes,
such as consumption, education and emergencies.
1.2 Organisational Structure and Governance
Organisational StructureSANASA has a three-tier organisational structure,
with levels which are independent, but work together
to achieve the goals of the movement, as shown in
Figure 1.1. The grass-root level formed of Primary
Thrift and Credit Cooperative Societies (PTCCSs) is
the stronghold of the movement. They are member-
based financial cooperatives and are thus limited to a
restricted geographical area. Each PTCCS has its own
Board of Directors.
The secondary tier consists of district and regional
unions of thrift and credit cooperative societies. Their
traditional function as regional apex bodies and service
providers for the PTCCSs has continually decreased
with their roles being taken over by specialised
companies of the SANASA group. These companies
have a stronger market orientation and are better
equipped than the SUs to fulfil the needs of PTCCSs.
In two districts SUs have already disappeared (Puttalam
and Anuradhapura), several other SUs being inactive,
a tendency that is expected to continue in the years
to come. Secondary unions (SUs) are owned by the
PTCCSs of the region and their management has to be
selected from the same geographical area.
The third tier is represented by the national SANASA
federation. Its role has also changed from the initial
mission as a national apex body for the movement to
predominant representative and strategic orientation
functions. While at first only secondary unions owned
the national federation, more recently, PTCCSs were
also allowed to acquire shares.
Regulation and SupervisionThrift and Credit Cooperative Societies are registered
under the Cooperative Societies Act No. 5 of (1972)
as amended in 1983 and in 1992. In order to operate,
PTCCSs must register with the Commissioner of
Cooperative Development. PTCCSs can choose to
register as societies with limited or unlimited liability.
Statistics available at national level (including both
active and dormant societies) show that 88.5% are
registered as unlimited liability societies.
PTCCSs and SUs are regulated and supervised by
the Department of Cooperative Development. The
supervision takes place at district level, through the
District-level branch of the Department. The national
PTCCS
District
Union
PTCCS PTCCS PTCCS
District
Union
Regional
Union
SANASA Group
Companies
- SANASA
Development
Bank
- SANASA
Campus
- SANASA
Insurance
Company
- SANASA
Microinsurance
Brokers
etc.
Figure 1.1 Organisational structure of the SANASA Group
Grass-root
level
(1st tier)
Secondary
Unions
(2nd tier)
National level
(3rd tier)

MICROFINANCE INSTITUTIONSIN SRI LANKA 20
097
federation is supervised by the national Department of
Cooperative Development.
The survey has revealed a lack of knowledge on
the part of the respondents at the secondary union
level, with only 75% of them being aware that they
are regulated institutions. When asked about the
regulatory and supervisory authority, the picture was
rather diverse. Only 62% SUs and 66% of PTCCSs
which had admitted they are regulated recognised
the Department of Cooperative Development as the
regulatory authority. The rest of the respondents saw
either the Board of Directors or SANASA Federation
fulfilling this role. The percentage of those who
correctly identified the Department of Cooperative
Development as supervisory authority was larger –
86% of SUs and 93% of PTCCSs. The lack of a correct
perception regarding the regulation and supervision of
cooperatives and their unions hints at deficiencies in
its implementation on the part of the Department of
Cooperative Development and poor understanding on
the part of the respondents.
Respondents have declared that supervision entails
the following measures: regular inspection/audit of
accounts (100%); representation on the management
committee or the board of directors (50%) and submitting
operational information on a regular basis (50%).
SUs and PTCCSs are entirely member-owned
organisations. It is interesting that the perception of a
significant number of respondents at secondary union
level assigns ownership to either the Department of
Cooperative Development (29% in the case of SUs and
21% in the case of PTCCSs) or to the Federation (14%
of SUs and 11% of PTCCSs). This lack of ownership
consciousness can have a negative impact on the way
they relate to the microfinance business.
AuditThe Registrar of the Department of Cooperative
Development is required by law to audit registered
credit unions once a year. Due to insufficient resources,
this provision cannot be fully implemented in practice,
a situation supported by the findings of this survey. In
most SUs and PTCCSs (61% and 64% respectively)
accounts are audited both internally and externally.
The accounts of the remaining SUs and PTCCSs are
either audited internally only (18% of SUs and 25%
of PTCCSs) or externally only (18% of SUs and 11%
of PTCCS). With the amendments introduced to the
Co-operative Societies Act in 1992, the Registrar has
the authority to replace the board of a distressed credit
union with an interim board, or even dissolve a credit
union under certain circumstances which may come to
light during the audit process.
Decision making / Strategic planningAll SUs and PTCCSs are managed as independent
entities. 96% of them claim to establish business
development goals, an annual business plan and
strategies for their microfinance activities. In most
cases (between 74% and 85%) the design of plans and
strategies which include aspects such as interest rate
setting, product design, human resource management,
target group orientation and general policy is said to
follow a participative approach: a group consisting of
management, the board, members, staff and/or affiliated
institutions decides through discussions. In some
cases (15%-22%) the design of plans and strategies
is claimed to be done at the Federation level. In fact,
the national federation does not have the authority to
take such decisions; it can only issue recommendations
and general directions. The final decision power resides
with the boards of the institutions. But, as noted
above, some of the respondents do not have a sense of
ownership and probably take the recommendations of
the national federation to be compulsory.
1.3 Operations
Outlet distributionThe regional coverage of PTCCSs is displayed in Table
1-1. 3,794 PTCCS are grouped under the umbrella of
28 SUs (district and regional unions), displaying an
average of 134 PTCCSs per SU. Needless to say, that
there are significant disparities between the number
of active PTCCSs under each SU, ranging from 15
(TCCS Polpithigama) to 459 (DTCCS Matara).

8
Table 1-1 Regional and sectoral coverage of SANASA PTCCSs
ProvincePTCCSs Sector
No. % Urban Rural Estate
Western */**
Central
Southern *
North Western **
North Central **
Uva *
Sabaragamuwa
Northern **
Eastern
Total
Population Density per PTCCS
(Population / No. of PTCCS)***
376
324
1,079
260
43
530
491
173
518
3,794
9.9
8.5
28.4
6.9
1.1
14.0
12.9
4.6
13.7
100.0
n/a
31 (9.6%)
35
1 (0.4%)
0
n./a
12 (2.4%)
22 (12.7%)
23 (4.4%)
124
26
267 (82.4%)
789
259 (99.6%)
43 (100.0%)
160
479 (97.6%)
151 (87.3%)
495 (95.6%)
2,669
n/a
26 (8.0%)
n/a
0
0
10
0
0
0
36
8,823
7,481
2,111
5,616
8,348
2,221
3,669
3,712
2,741
4,954
n/a not available
Notes * For Western, Southern and Uva Provinces, the total number of branches does not tally with the subtotals of urban, rural and estate branches, as the breakdown for the districts of Colombo (350 PTCCSs), Galle (255 PTCCSs) and Badulla (360 PTCCSs) was not provided by the respondents.
** In the Western Province, Gampaha District could not be covered, as the DU there refused to participate in the survey. Puttalam District in the North-Western Province and Anuradhapura District in the North-Central Province could not be covered, due to the fact that the operations of the SUs were fully taken over by SANASA Development Bank. No district or regional union was operating in the area. In the Northern Province, the districts of , Mullaittivu and Vavuniya could not be covered due to the security situation.
*** The source for population per province is the Census of Population and Housing, Department of Census and Statistics – Sri Lanka, 2001. For the Northern and Eastern Provinces, 2001 estimates from the Department of Census and Statistics were used.
PTCCSs have a good nationwide coverage. According to
the SUs which were interviewed, 3,794 active PTCCSs
serve 19 of the 25 districts, across all nine provinces.
PTCCSs are known to operate in the six remaining
districts but they could not be covered during this
survey. It has to be noted though, that the number
of active PTCCSs could be slightly overestimated;
some respondents might have included either recently
closed societies or societies with plans for reactivation.
At the national federation level, it was estimated that
an overall number of around 2,000 PTCCSs are well
functioning, while another 1,500 societies operate at a
low-intensity.
93.6% of the PTCCSs for which the sectoral breakdown
was provided, are located in rural areas. This shows the
prevalent rural character of SANASA. 4.9% of the
PTCCSs are located in urban areas, while 1.4% of the
PTCCSs are located in estate areas.
The Southern Province has by far the largest number of
societies (1,079), indicating that it is in this region that
SANASA has its stronghold. The Southern Province,
together with the Eastern and Uva Provinces account
for 56% of PTCCSs, while they represent only 26%
of the Sri Lankan population. These three provinces
also have average PTCCS densities lower than 3,000
people / society, while the nationwide average lies at
4,954 people / PTCCS. Highest densities are found in
the Western (8,823 people / PTCCS), North Central
(8,348 people / PTCCS) and Central (7,481 people /
PTCCS) provinces.
A comparison between the regional distribution of
PTCCSs and of the population living under the poverty
line, as reported by the last census of 2002, is presented
in the table below.

MICROFINANCE INSTITUTIONSIN SRI LANKA 20
099
Table 1-2 Regional distribution of SANASA PTCCSs vs. poverty distribution
Province
Persons Below the PovertyLine (PBPL) PTCCSs
No. % No. %
Western *
Central
Southern
North Western *
North Central *
Uva
Sabaragamuwa
Total
376 12.1
324 10.4
1,079 34.8
260 8.4
43 1.4
530 17.1
491 15.8
3,103 100.0
323,710
547,401
558,619
305,364
57,567
356,540
528,824
2,678,025
12.1
20.4
20.9
11.4
2.1
13.3
19.7
100.0
861
1,690
518
1,174
1,339
673
1,077
863
PBPL/ PTCCS
Note: * Poverty data from Gampaha District in the Western, Puttalam District in North Western and Anuradhapura District in North Central Provinces was excluded from the table above, as these districts, although having active PTCCSs, could not be covered by the survey.
The poverty percentage was calculated as percentage of the total population living under the poverty line in a given province. The percentage of branches was recalculated excluding the North and Eastern Provinces as poverty data for these provinces was not available.
PTCCSs have an extensive coverage, characterised by
important regional variations in the density of the
persons below poverty line (PBPL) served per PTCCS.
The densities range from only 518 PBPL / PTCCS in
the Southern Province to 1,690 PBPL / PTCCS in the
Central Province. The nationwide average (excluding
the North and East) lies at 863 PBPL / PTCCS. From
the comparison of PTCCS and poverty distribution
across provinces, the Southern Province is over-served
with 34.8% of the branches compared to 20.4% of the
poor. Similarly, Uva has 17.1% of the PTCCSs, while
only 13.3% of the PBPL. Significantly underserved is
the Central Province with only 10.4% of the PTCCSs,
while being the home of 20.9% of the country’s poor.
Densities higher than the average are the districts
covered by the survey in the North Western and North
Central Provinces and in the Sabaragamuwa Province,
this being indicative of the fact that the PBPL in these
areas are underserved by PTCCSs.
ClientsThe entire microfinance customer base of the 28
secondary unions interviewed could not be determined.
The national federation records indicate a total number
of 860,611 registered members in 2006. However, due
to the high percentage of inactive PTCCSs, this figure,
together with the estimated coverage of 16.64% of
the population (mentioned in the SANASA Statistical
Report 2006-2007) is largely overestimated. According
to data provided by the Federation, the number of
loan accounts of around 4,500 PTCCSs was 214,803.
Considering the fact that most clients would not receive
multiple loans from the same institution and that a
considerable number of clients may only have savings
accounts with SANASA, this figure can be considered
a very conservative estimation of the number of clients
of the PTCCSs.
71% of the respondents focus their microfinance
activities on particular target groups. These include:
women (90% of those who focus on target groups),
farmers (80%), low income groups (70%), entrepreneurs
and youth (65% for each of the two categories).
The proportion of female clients, the most prominent
target group, was declared to be between 50% and
75% for 64% of the respondents and over 75% for
11% of respondents. One respondent reported having
less than 25% female clients. Considering the total
membership of SANASA, both active and inactive,
female members account for 54%, according to data
available at Federation level.

10
7.9%12.0%
9.2%
14.9%
39.0%
6.4%10.6%
14.7%
5.3% 4.3%20.1%
29.4%26.3%
Around 20% of customers of the interviewed SUs/
PTCCSs were reported to have a monthly household
income below Rs. 3,000, the average threshold for a low
income household defined by the respondents being Rs.
2,800. The majority of SANASA customers (55.7%)
come from households with an income between Rs.
3,000 and 10,000. In total, more than 75% of the
clients served by SANASA have a household income of
less than LKR 10,000 a month.
Figure 1-1 Monthly income of SANASA clients
Figure 1-2 Economic activity of SANASA clients
The microfinance customers of SUs/PTCCSs represent
a wide range of economic activities; the main focus is
on the primary sector owing to the strong presence
in rural areas. Considering that SUs/PTCCSs are
geographically confined, diversification of their lending
portfolio could be difficult. The structure of the
client portfolio, represented in the following chart, is
dominated by agriculture, horticulture and cultivation
(39%), followed by trading (15%), services (12%) and
animal husbandry (11%).
On the question of growth of their customer base on
a product-wise basis, the majority of SUs/PTCCSs
(between 54% for loans and 90% for pawning)
indicated that their customer base has increased over
the last year (2006); some institutions (between 10%
for pawning and 31% for compulsory savings) claim
even a substantial increase. Although aggregated data
of the Federation shows a positive tendency in terms of
SANASA membership for 2006, the increase is rather
moderate (from 858,125 at the end of 2005 to 860,611
at the end of the following year). Moreover, the increase
in terms of volumes of savings and loans in 2006 seems
to be only temporary, as it was followed by a decline in
2007. A possible explanation for this situation could
be that year 2006 was the 100th anniversary of the
SANASA Movement and many new programmes were
introduced to mark this occasion, which could have led
to the increase observed for 2006.
Lending methodology92% of all SUs are involved in wholesale lending,
61% offer individual lending, while only a quarter is
involved in joint liability lending. 32% of SUs are not
engaged in lending at the retail level individual and
offer only wholesale lending to PTCCSs. All PTCCSs
offer individual loans, 54% provide group loans, while
only 14% claim be involved in wholesale lending to
an intermediary. 43% of PTCCSs claim to be involved
exclusively in individual lending.
For SUs involved in more than one type of lending,
individual loans represent on average 59%, group loans
25%, while wholesale lending represents on average
35% of the loans. The strong involvement of some SUs
in individual lending might indicate a reorientation of
several of them towards direct provision of microfinance
services to clients in view of the reduction of their
scope of services to PTCCSs since the advent of the
SANASA Development Bank. 84% of the loans of
PTCCSs adopting a mix of lending methodologies
are individual loans. Joint liability group loans, with a
share of only 17%, do not play an important role for
PTCCSs.
Identifying potential clientsThe SUs/PTCCSs interviewed seem to adopt a
pro-active approach in utilising the information
gathered by their field staff and existing clients for the
< 3,000 LKR 10,001 - 20,000 LKR3,000 - 5,000 LKR 20,001 - 40,000 LKR5,001 - 10,000 LKR > 40,000 LKR
Agriculture/horticulture/cultivating Manufacturing Fisheries Services TradingAnimal husbandry Others

MICROFINANCE INSTITUTIONSIN SRI LANKA 20
0911
identification of potential customers. SUs/PTCCSs
identify potential microfinance clients mainly through
inspection and field visits (89%). Evaluation of client’s
past performance and recommendations from existing
reliable customers or third parties are also widely used
(68% and 54%, respectively) as a means of identifying
and appraising new clients. Only a little over a third
(36%) of the SUs/PTCCSs utilise opportunities arising
out of the non-microfinance activities of the institution
for this purpose. In view of the array of non-financial
services offered by the SANASA group, this potential
seems to be underestimated.
Loan processing time and approval procedureThe average processing time for a loan is around 23
days. Only 25% of SUs/PTCCSs interviewed indicate a
processing time of not more than 15 days. Over a third
of respondents have indicated a loan processing time of
30 days. Opening a deposit or savings account usually
takes one day. The processing time for an insurance
application is between one and seven days.
93% of SUs/PTCCSs interviewed entrust a credit
committee with the approval of loans, while 45% of
them require a credit evaluation by the loan officer and
32% provide the manager with a loan approval limit.
This rather decentralised loan approval process, which
involves branch managers and credit officers, fits well
with the particularities of member-owned thrift and
credit cooperatives.
Loan monitoring and provisioningThe majority of SUs and PTCCSs (61%) manage their
microfinance operations manually while 39% employ a
mix of manual and computerised systems. Hence, it is
not surprising that 94% of those who claim to monitor
loan portfolio quality rely mostly on log books and
manual records. Visit records filed by field officers are
used by 63% of the respondents. Only 33% of them
use computerised financial statements for monitoring
purposes.
57% of the respondents claim to measure the portfolio-
at-risk (PaR) in relation to their loan portfolios, but
from the definitions given, PaR seems to be equated
with non-performing loans. Even for the respondents
who perceived PaR to be the risk in recovering loans,
it was not clear whether only overdue instalments were
considered to be at risk or the entire loan amount.
The SUs/PTCCSs interviewed seem to follow an
age analysis of overdue loans. At least some of them
classify their loans into categories such as sub-standard,
doubtful or loss depending on the extent of late
payments. Nonetheless it remains unclear how many
of them actually systematically undertake such a
classification.
46% of respondents do not make provisions on
their non-performing loans while 54% declared they
do. Of those who provide for potential loan losses,
only a minority (26.7%) seem to apply individual
provisioning rates for the loan classification categories
identified. Others apply provisioning rates to the total
loan portfolio (including performing loans) or to the
annual revenue (26.7%) or confuse loan recovery
measures with loan loss provisioning (13.3%).
Defaulting clients89% of the institutions interviewed claim to take
legal action in case of failure to comply with requests
for repayment of an overdue loan. SUs and PTCCSs
thus seem to quickly engage in legal action against a
defaulting borrower. Since seizing borrower’s property
does not play a significant role (only 14%), this might be
either just announced as a deterrent to default, or court
action might be used to enforce personal guarantees.
Another possible explanation could be that for some
respondents the term legal action has a wider meaning,
including other procedures of recovery besides court
action. In fact, court action is generally too costly
for recovery of a small microfinance loan, therefore
the information coming out of the survey should be
interpreted with care. Further, 61% of respondents have
stated they apply penalties on defaulting borrowers,
while 54% and make use of group and social pressure
and 43% of arbitration to recover the loan.
Operational challengesThe main operational challenges related to the microfinance
business of SUs/PTCCSs are: delayed repayment of
loans (79%), inadequate information system and poor
technology (71%), strong competition (68%), shortage
of funds (64%) and lack of equipment (57%).

12
1.4 Products and Markets
All SUs and PTCCSs covered by the survey provide
loans and savings products, 36% of them offer
pawning facilities and 18% claims to offer insurance.
Table 1-3 Microfinance product portfolio of SANASA SUs and PTCCSs
Notes * Number of SUs / PTCCSs for which the volume outstanding was disclosed.
** Number of SUs /PTCCSs for which the number of accounts was disclosed.
*** The average outstanding account balance was calculated solely based on outlets for which both volume outstanding and number of accounts were disclosed. Due to significant differences in the number of outlets covered for the two indicators, the result of this column is significantly different from the mere division of the column “Volume outstanding” by the column “Number of accounts”.
Product / Service
No. of SUsNo. of
PTCCSs
covered
Volume
Outstanding
(‘000 Rs.)
No. of
Accounts
Average
outstanding
account
balance
(Rs.) ***
Annual
Interest
Rate
(%)
Offer the product/service
Providedinformation
Savings and Deposits
Loans
Pawning
28
28
10
21
22*/18**
7
280*/311**
255*/1,100**
58*/74**
981,674
824,151
45,249
134,344
112,460
4,551
8,093
25,825
2,807
3-24
4-18
15-21
It has to be noted that information regarding the
products and markets of SANASA remains, despite all
efforts, scarce. Most of the interviewed SUs did not have
aggregate data for all the PTCCSs under their umbrella.
Conducting interviews at PTCCS level was, in view of
the high level of resources required, not feasible. This
has resulted in a very low coverage of outlets. With
the exception of the number of loan accounts, where
information was available for 29% of the PTCCSs
and SUs, the overall coverage for this section is rather
symbolic (information is available for only 7% to 8%
of the total number of societies) for savings & deposits
and loans, products which are offered in all outlets.
Loan productsLoans are offered by all respondents. For the 255 societies
for which information regarding volume outstanding
of loans is available, an average loan portfolio of Rs.
3.2 million per society could be observed. In terms of
number of accounts, the average lies at 102 loans per
society for the 1,100 societies for which information was
obtained. Almost all SUs and PTCCSs (96%) require
compulsory savings as a condition for obtaining a loan.
In 61% of the institutions interviewed, the minimum
loan amount is not more than Rs. 5,000.
It is also interesting to note that this group of MFIs
is characterised by flexibility in terms of loan period.
Loan products have a rather long maturity going up
to 96 months in the case of housing loans. 43% of the
respondents have loan products going up to 60 months
and more. But short-term loans are also an important
part of the loan portfolio of SANASA societies – 36%
of the respondents have mentioned the existence of loan
products with repayment period of under 12 months.
All SUs and PTCCSs calculate interest on a declining
balance basis. 54% of the institutions charge service
fees for processing a loan. Except for penalty interest
on late payments (imposed by 43% of institutions
interviewed) and interest rate reductions on early
payments (21%), there are no other special terms and
conditions attached to loan products. Concessionary
interest rates for specific groups of customers are offered
by only 14% of the respondents.
Pension products and leasing are each offered by one
respondent. A brief overview of the key features of the
main products is presented in Table 1-3.

MICROFINANCE INSTITUTIONSIN SRI LANKA 20
0913
SUs/PTCCSs declared they set their lending rates
mainly at a given margin above their deposit rate (43%)
or by benchmarking to commercial bank rates (36%).
In 14% of the cases, interest rates are set based on a
computation of product cost.
As for the level at which decisions regarding interest rates
are taken, 50% of SUs/PTCCSs indicate the district or
regional level, while 39% assign this function to the
individual societies. This is an interesting outcome,
considering the fact that PTCCSs are member-owned
institutions, having the final decision power in all
strategic and operational issues, including the setting
of interest rates. The regional and national levels of the
SANASA movement can only issue recommendations
and could in certain situations link access to funds
to the adoption of their recommendations, but they
cannot overrule the decisions of the Board of Directors
of the PTCCSs or the SUs. Thus, the respondents do
not seem to be fully aware of the rights of the SUs and
PTCCSs.
Formal lending requirementsSUs/PTCCSs estimate that on average 4.7% of loan
applications received are rejected. However, 13 out of
28 institutions interviewed claimed to have a ‘rejection
rate’ of 0%. The reason for this could be that SUs/
PTCCSs are member-based organisations that cannot
reject applications as long as the member complies
with the minimum lending requirements. But it could
also be that the actual rejection rate is in fact higher;
SUs might not have complete information on rejected
applications at the primary society level, or the initial
screening process is quite effective. On the other hand,
one respondent in the Eastern Province has mentioned
a rejection rate of loan applications of 50% due to the
non-availability of funds.
Loans are available exclusively to members. The
most important lending requirements are as follows:
maintaining a minimum deposit balance (93%), having
guarantors (89%), providing proof of established
residency (79%) and proof of income sources (71%).
Further requirements include collateral (61%) and
receiving the approval of the district union (54%).
Considering the above listed requirements, loans seem
to be over-collateralised. Another surprising fact coming
from the survey was the fact that 54% of respondents
have mentioned that the approval of the SU is required
before a loan can be granted. Since PTCCSs are all
member-owned societies, they have full independence
as to the disbursement of funds collected by them.
In the case of funds received from the SUs, PTCCSs
are formally required to inform the SUs regarding the
utilisation of the funds. In practice, in the case of some
SUs, the requirement to provide information seems
to be transformed into an approval requirement, thus
making the loan approval process more complex and
lengthy.
Savings productsAll SUs and PTCCS covered by the survey offer savings
and deposit facilities. On average, the 280 societies for
which information on savings volumes were available
had a savings portfolio of Rs. 3.5 million per society.
The 311 societies where information on the number
of savings/deposit accounts was disclosed had on
average 432 savings and deposit accounts each. We
can notice that while the average savings portfolio is
only slightly higher than the loan portfolio, the average
number of savings accounts per society is more than
four times that of loan accounts. This is also reflected
in the considerably lower average outstanding account
balance of Rs. 8,093. All respondents who provided the
information reported the minimum amount required
to open a savings account was Rs. 500 or less. In fact,
for three quarters of these respondents, the amount
required was no more than Rs. 100.
Other productsThe availability of pawning facilities was reported by
10 SUs (36%) according to the survey. The average
pawning portfolio of Rs. 0.78 per society for the 58
societies for which information was provided seems
rather modest. In terms of the number of pawning
accounts the situation is similar – the average per society
is 62 pawning accounts. It is interesting to note that
the average outstanding balance on a pawning account
is, at Rs. 2,807, almost ten times lower than the average
outstanding loan account (see Table 1.3 above). 40%
of respondents have indicated that the minimum value
of goods that can be pawned is Rs. 500 while another
40% indicate a higher value of Rs. 1,000. This indicates
that pawning facilities cater mainly to the liquidity
needs of the low-income group.

14
Five respondents (18%) have also mentioned insurance
products in their product portfolio, but in all cases they
retail insurance products of the SANASA Insurance
Company, which is covered by Chapter 6 of this
report.
Delivery of products and marketing strategiesProducts and services are mainly delivered directly
through SANASA societies (86%) and only a small
proportion of respondents use field officers (29%) or
links with other institutions (11%) as delivery channels
for their products and services. Product marketing is
done through a number of different channels: all
respondents claim to rely on promotion by members,
71% distribute leaflets, while 64% use other SANASA
activities to promote their microfinance business.
Banners and posters and doorstep marketing are
employed by 54% and 46%, respectively. SUs and
PTCCSs seem to employ a cost-effective marketing
approach; mass media advertising does not play a
significant role, a fact which could be explained by the
limited geographical outreach of SUs and PTCCSs.
Product developmentSome SUs and PTCCSs appear to experiment with
other products apart from the traditional savings and
loans, but this is on a rather limited scale. 79% of
the respondents have indicated the existence of plans
to introduce new microfinance products in the near
future. For the majority of these respondents new loan
and savings products lead the way (95% and 73%),
followed by fixed term deposits (55%), pawning
(41%), insurance products (18%), pension products
and leasing (each 14%) and money transfer services
(9%).
Asked about the number of products introduced during
the last two years, the average lies at 2.4 products,
with significant discrepancies among the respondents.
While 21% of the respondents haven’t introduced
any new products, one respondent reports ten new
products introduced, while another one reports 15 new
products introduced. 82% of the respondents have not
withdrawn any products from the market over the last
two years, while 11% have withdrawn one product and
7% of them have withdrawn 3 products.
In 61% of cases product development is handled at
a central level drawing on inputs from all societies,
while in 46% it is done at PTCCS level by an internal
team or by the manager (25%). The SANASA
Federation, SANASA Campus and Shakthi Officers
are also consulted in the process of designing new
products. It can be concluded that the process is
strongly participative, but at the same time draws on
the expertise of the different levels and companies of
the SANASA group. This is supported by the outcome
of the survey regarding the methodological approach
to product development. New products are developed
based on staff experience (61%), on discussions at
Federation level (54%) and with customers (46%), on
formal market surveys (36%) and based on products
offered by competitors (32%). This approach allows
the SUs and PTCCS to offer more demand-oriented
products.
1.5 Human Resources
2,797 of the PTCCSs covered by the survey employ a
total of 11,737 staff, an average of 4.2 staff per society.
Respondents were asked to provide information on all
types of staff – paid as well as un-paid volunteer staff,
but despite all efforts, differences in reporting may still
exist resulting in an underestimation of volunteer staff
on the part of some respondents. 24 of the 28 SUs
interviewed employ a total of 357 staff, an average of
14.9 staff per SU. In view of the fact that both SUs
and PTCCSs are engaged in other activities besides
providing financial services, it cannot be assumed that
the staff mentioned above are exclusively involved in
microfinance operations, even though they represent
the core activity of SANASA. It remains unclear to
what extent the SANASA staff is involved in non-
microfinance operations.

MICROFINANCE INSTITUTIONSIN SRI LANKA 20
0915
Table 1-4 Microfinance staff complement of SANASA
Total Staff*(SUs andPTCCSs)
Managerial Credit/FieldOfficer
Others/SupportStaff
Clerical
Experience required
11,737
357
(69.2%)
(34.6%)
(8.1%)
(25.8%)
(19.1%)
(25.1%)
(3.6%)
(14.4%)
A/L passed (47%) / O/L
passed (29%)/ no requirement (7%) / tertiary education (4%)
A/L passed(53%) / tertiary
education (21%) / O/L passed(15%) / no
requirement(11%)
A/L passed (64%) / O/L
passed (18%) / no requirement (11%) / tertiary education (4%)
n/a
yes (61%) /no (36%)
yes (57%) / no (29%)
yes (68%) /no (32%)
n/a
Minimum Qualification Required
PTCCSs
SUsAbsolute Number (%)
n/a not available
Note * Total staff figures provided cover 24 secondary unions and 2,797 attached primary societies. Furthermore, the staff breakdown was provided only by 22 respondents regarding SUs and by 23 regarding attached primary societies, therefore the absolute numbers could not be determined.
In terms of types of positions considerable differences can
be observed between PTCCSs and SUs. The proportion
of managers out of total staff is almost 70%. This is
surprisingly high for primary societies and could indicate
either that some respondents did not consider entirely
the volunteer workforce involved in their operational
activities or that the volunteer workforce is given
incentives in the form of “managerial”positions which
are largely title only even though the tasks performed
do not justify such positions. Given the large volunteer
workforce reported (see below), the latter seems more
probable. This can be also supported by the almost
insignificant percentage of credit and field officers. The
absence of field officers could be understood through
the localised, village based operations, which may
make field officers dispensable, but the lack of credit
officers is hard to account for. Either their respective
tasks are performed by managerial staff or by volunteer
workers who are not included in the reporting. SUs
have a more balanced distribution of positions – 35%
managerial, 26% credit / field officers, 25% clerical
and the remaining 14% support staff.
The minimum qualifications required by SUs and
PTCCSs do not differ noticeably for the various types
of positions: the majority of the respondents expect
at least A/L qualifications and relevant experience.
However, for non-managerial positions more SUs and
PTCCSs are willing to accept lower qualifications (such
as O/L).
As for the type of employment, 93.9% of the 10,702
staff for which the breakdown was reported is employed
on a volunteer basis. The permanent staff of the
PTCCSs and SUs accounts for only 5% of the reported
staff figures.
Recruitment challengesFor all types of positions SUs and PTCCSs identify
similar difficulties in recruiting suitable staff for
microfinance operations. The attractive remuneration
and benefits offered by competing institutions is cited
to be the most important recruitment challenge for
managerial (57%) and clerical staff (46%), as well as for
credit and field officers (46%). Another important issue
mentioned is the lack of candidates with microfinance
experience and training (mentioned by 36% of SUs
and 50% of PTCCSs). The lack of a pension scheme
also ranks high in the challenges mentioned by the
respondents (between 36% and 50%). Other issues

16
mentioned include unattractive locations (18% to
36%), employment (14% to 25%) and working
conditions (18% to 21%), the fact that microfinance is
not considered to be an attractive career option (14%
to 25%), as well as political influence and nepotism
(14% to 18%).
Staff retention64% of the respondents have identified inadequate
remuneration and incentives as the two most important
factors in retaining good staff. The following issues in
the order of importance are technology related: 61%
have identified lack of technology and 50% manual
processes to be a challenge in retaining talented staff.
The incompatibility of new technology with current
operating models was cited by 39% of the respondents
to be a staff retention issue. Further challenges identified
include the difficult nature of operations (32%), the
work overload (21%) and lack of operational flexibility
(14%). The staff retention issues are in line with the
operational challenges (i.e. poor technology, lack of
equipment) and difficulties related in recruiting suitable
staff (e.g. remuneration).
IncentivesSUs and PTCCSs have identified training opportunities
as the main incentive they are able to offer their
staff (93% of the respondents). 57% have named
remunerative incentives, 50% performance appraisals
and rewards, while 43% mention the distribution of
revenue as an incentive. However, in view of the staff
recruitment and retention issues cited above, these
incentives seem to be inadequate. Other incentives
mentioned include subsidies such as funeral assistance
or work uniforms (43%), overtime pay (39%), moral
incentives (36%), workman compensation in case
of sickness or accident (36%) and free or subsidised
transportation (18%).
Training is reported to be the most important incentive
element for the staff of SUs and PTCCSs. Indeed,
SANASA has a specialised training institution, the
SANASA Education Campus, which provides training
for SANASA staff. According to the survey all staff
categories, but especially managerial staff, receive
extensive training in a broad range of fields. However,
the impression is that the training programmes are not
sufficiently focused: information provided in the survey
indicates that managers participate in less relevant
trainings on group mobilisation, record keeping and
accounting, credit officers and clerical staff are included
in trainings on HR development and business planning.
At the same time important courses are only offered on
a limited scale such as leadership skills for managerial
staff and language skills for managerial staff and credit/
field officers.
1.6 Financial Performance
Only 14 SUs submitted their own financial statements.
Some of them were microfinance specific while the
others were overall statements covering both the
microfinance and non-microfinance activities of the
organization. Since these are unconsolidated financial
statements, not covering any of the PTCCSs under
their umbrella, and considering the differences in
operations of the SUs from those of the PTCCSs, we
cannot offer a picture of the financial performance
of the SANASA microfinance operations. It is hoped
that the computerisation and standardisation efforts
of the Shakthi Programme will also bring about an
improvement in the availability of more comprehensive
financial data.

MICROFINANCE INSTITUTIONSIN SRI LANKA 20
0917
References
Evans, Anna Cora (2001), Strengthening Credit Unions in Sri Lanka: Dispelling the Middle Class Myth, World Council of Credit Unions, Research Monograph Series,
Number 19
Federation of Thrift and Credit Co-operative Societies
in Sri Lanka, SANASA Statistical Report, 2005
Federation of Thrift and Credit Co-operative Societies
in Sri Lanka, SANASA Statistical Report, 2006-2007
Nair, Ajai and Kloeppinger-Todd, Renate (2007)
Reaching Rural Areas with Financial Services: Lessons from Financial Cooperatives in Brazil, Burkina Faso, Kenya, and Sri Lanka, Agriculture and Rural Development
Discussion Paper 35, World Bank, Washington, DC
Uphoff, Norman and Buck, Louise (2006)
Strengthening Rural Local Institutional Capacities for Sustainable Livelihoods and Equitable Development, Cornell International Institute for Food, Agriculture
and Development (CIIFAD), prepared for the Social
Development Department of the World Bank,
Washington, DC
Zander, Rauno (2006) Upgrading and Strengthening of SANASA Thrift and Credit Co-operative Societies in Sri Lanka, Project Preparation Report for GTZ Sri Lanka,
unpublished.
www.sanasafe.lk

18

Cooperative Rural Banks


MICROFINANCE INSTITUTIONSIN SRI LANKA 20
0921
2.1 Institutional Background
Next to the Thrift and Credit Cooperative Societies
(TCCSs), Cooperative Rural Banks (CRBs) owned
by the Multi-Purpose Cooperative Societies (MPCSs)
are the second major player in the cooperative sector
dealing with rural finance. Many Co-operative Credit
Societies were formed by the government in the early
decades of the 20th century against the framework
of the Co-operative Credit Societies Ordinance No.
7 of 1911. Subsequently, during the Second World
War, consumer co-operative societies were formed to
facilitate food distribution. In the post-war period of the
1950s these co-operatives were renamed Multi-Purpose
Co-operatives Societies and their scope of activities was
widened. MPCSs offer microfinance services through
the Cooperative Rural Banks (CRB) which are owned
by them. At present there are 305 MPCSs in Sri Lanka
through which 1,628 CRBs are operated.
This chapter also covers the Women’s Development
Cooperative Societies (WDCs). The umbrella
institution for the WDCs was incorporated in 1991
as a district society and in 1998 upgraded to national
level. The mission of the institution is to support and
uplift its members based on the principles of self-help
and mutual aid.
For the purpose of this survey 198 MPCSs and the
umbrella institution of WDCs have been interviewed.
Throughout this report the term MPCSs includes
WDCs, unless otherwise specified. MPCSs were
asked to provide information only regarding their
microfinance operations which are carried out through
CRBs. Due to the fact that CRBs are not separate
entities5 and a clear division of activities does not
exist in most cases, limitations exist in the present
analysis. Furthermore, access to data was difficult, as a
large number of MPCSs were unwilling to cooperate.
Several MPCSs refused to participate in the survey
5 An attempt to de-link CRBs from MPCSs was made by the Asian Development Bank through its Rural Finance Sector Development Programme. Due to resistance from various quarters this initiative was largely unsuccessful.
2. Cooperative Rural Banks and Multi-Purpose Cooperative Societies
despite having obtained recommendation letters from
the Department of Cooperative Development both at
national and provincial levels.
Only 8% of the MPCS respondents focus on providing
financial services only, while the rest (92%) offer both
financial and non-financial services. When asked about
the percentage of microfinance activities within their
CRBs, the data provided by the respondents suggests
that on average 85% of the activities of the CRBs
are related to microfinance. 45% of the respondents
have stated that 90% or more of the activities of their
CRBs are related to microfinance, while for 20% of the
respondents, their CRB’s activities were entirely related
to microfinance.
The most prevalent definition of microfinance among
this group of respondents is: providing (small scale)
loans to low income groups and to small businesses as
capital investments. In fact, 92% of the respondents
have mentioned provision of loans in their definition,
31% of them deposits and savings, while only 17%
of the respondents have offered a broad definition of
microfinance to include other financial services besides
loans and savings. This could be explained by the fact
that other financial services (with the exception of
pawning, which is often assimilated to loans) are not
commonly offered by this group of institutions.
The MPCS’ definition of microcredit goes slightly
beyond the definition for microfinance: it includes the
purpose of lending (development), the target group
(low income and entrepreneurs) and some of the
definitions refer to the loan size as well (between Rs.
15,000 and 100,000).
The definition of the level of monthly income of a low
income household is on average Rs. 3,362. However,
the responses provided range from Rs. 750 to Rs. 8,000.
9% of the respondents could not provide a definition.

22
Only 5% of the respondents have defined the threshold
monthly income of a low income household as more
than Rs. 5,000, while 21% have defined a low income
household as having an income of less than Rs. 3,000
a month.
2.2 Organisational Structure and Governance
Organisational StructureMulti-Purpose Cooperative Societies are member-
owned organisations. Operations are coordinated by a
Board of Directors at the Divisional Secretariat level.
In addition to this general representative body, each
MPCS has its own board. This board is responsible for
the operations of the MPCS and the CRBs which are
owned by it. In addition to this, there is a bank union
at provincial level which handles investment activities
for MPCSs.
Regulation and Supervision
Multi-Purpose Cooperative Societies and the Women’s
Development Cooperative Societies are registered
under the Cooperative Societies Act No. 5 (1972) and
subsequent amendments thereto.
When asked whether they are regulated or supervised,
77% of the respondents have mentioned they are
regulated, while 96% acknowledged they are supervised.
In fact, all MPCSs are regulated and supervised by the
Department of Cooperative Development.
As for the regulating authority, 44% of respondents
consider their Board of Directors performs this
function, a clear indication that the respondents do
not have adequate knowledge regarding the regulatory
processes involved. Only 41% correctly identified
the Department of Cooperative Development as the
regulatory authority.
In the case of supervision, the respondents seem to be
better informed (it is also a process which concerns
them more directly) – 84% of the respondents who
have reported they are supervised have identified
the Department of Cooperative Development as the
supervisory body, 10% have named their Board of
Directors and 7% of them have named the state-owned
People’s Bank.6
Supervisory measures include regular inspection/audit
of accounts (mentioned by 87%) and, to a lesser extent,
submission of operational information on a regular basis
(53%), as well as representation on the management
committee or the Board of Directors (46%).
Audit62% of the respondents have reported that the activities
of the MPCSs, and implicitly those of their CRBs,
are audited both internally and externally. 29% have
reported only an internal audit is performed, while
9% rely exclusively on external audit. According to
the legislation in force concerning the MPCSs, all of
them should be audited externally by the Department
of Cooperative Development, but due to resource
constraints, this does not always take place.
Decision making / Strategic planning97% of respondents claim to set microfinance
development goals and design plans and strategies to
achieve them. 95% of them claim to follow these goals,
plans and strategies. In the majority of cases (between
89% and 95%), annual business plans and strategies
regarding interest rates, product design, human
resources and target group are set through group
decisions (management and Board members, affiliated
institutions, staff) through discussions. This hints to a
decentralised decision procedure in the case of MPCSs,
which is to be expected in member-owned societies.
The overall operating policies are defined by the Board
of Directors (95% of respondents) of each MPCS, hence
at a central level. However, considering the fact that the
organisational structure is quite flat, this implied loss
of flexibility is not considerable, having the advantage
of a more strategic orientation. For the remaining
respondents (4%), a Management Committee has the
decision making power.
6 The People's Bank was established in 1961 with one of its main aims being to provide financial support to the co-operative movement. The bank has since changed its orientation, but it might be that in view of the historical close relations between the People’s Bank and the Co-operative Rural Banks a few respondents perceive it to have supervisory authority. At present, the Department of Cooperative Development is exclusively responsible for the supervision of CRBs.

MICROFINANCE INSTITUTIONSIN SRI LANKA 20
0923
Province
CRBs Sector
No. % Urban Rural Estate
Population Density per CRB
(Population / No. of CRBs)**
235
170
256
247
112
128
170
8.7
47
1,452
Western
Central
Southern
North Western
North Central
Uva
Sabaragamuwa
Northern *
Eastern
Total
16.2
11.7
17.6
17.0
7.7
8.8
11.7
6.0
3.2
100.0
81 (34.5%)
30 (17.6%)
34 (13.3%)
6 (2.4%)
1 (0.9%)
10 (7.8%)
17 (10.0%)
19 (21.8%)
9 (19.1%)
207 (14.3%)
153 (65.1%)
138 (81.2%)
222 (86.7%)
241 (97.6%)
111 (99.1%)
113 (88.3%)
153 (90.0%)
68 (78.2%)
38 (80.9%)
1,237 (85.2%)
1 (0.4%)
2 (1.2%)
0
0
0
5 (3.9%)
0
0
0
8 (0.6%)
22,898
14,259
8,889
8,785
9,863
9,198
10,596
7,382
30,204
12,946
*
2.3 Operations
Outlet distributionThe 198 MPCSs interviewed maintain a total of 1,452
CRBs. On average, each MPCS has 7 CRBs through
which financial services are extended. The number of
Table 2-1 Regional and sectoral coverage of CRBs
Note * Vavuniya, Mullaittivu and Killinochchi Districts were not covered in the survey. The average CRB density was adjusted to exclude the three districts which were not covered and therefore refers only to the situation in the Jaffna and Mannar Districts.
** The source for population per province is the Census of Population and Housing, Department of Census and Statistics – Sri Lanka, 2001. For the Northern and Eastern Provinces, 2001 estimates from the Department of Census and Statistics were used.
CRBs are present in all provinces of Sri Lanka, but 15
MPCSs in the conflict affected districts of Vavuniya,
Mullaittivu and Killinochchi in the Northern Province,
were not covered by the survey due to the prevailing
security situation, therefore the number of CRBs in
these districts could not be ascertained. CRBs have the
weakest presence in the Eastern Province with just 47
outlets, while the strongest presence (256 outlets) is
found in the Southern Province. However, compared
to the population of each of the provinces, the highest
outlet density is found in the North Western Province
(one outlet for 8,785 inhabitants), followed by the
Southern Province (one outlet for 8,899 inhabitants).
The lowest outlet density is in the Eastern Province
(one outlet for 30,204 inhabitants), followed by the
Western Province (one outlet for 22,898 inhabitants).
Regarding the Northern Province, the two districts for
which survey data was available (Jaffna and Mannar),
seem to be particularly well served with one CRB for
7,382 inhabitants. The three provinces with the largest
percentage of CRBs (Southern, North Western and
Western), which together account for 50.8% of the total
number of CRBs, represent, in terms of population,
52.3% of the total population.
Most CRBs (85.2%) operate in rural areas, compared
to 14.3% in urban areas and 0.6% in the estate sector.
CRBs attached to an MPCS ranges from one to 55
(MPCS Jaffna).

24
Note: The poverty percentage was calculated as percentage of the total population living under the poverty line in a given province. The percentage of branches was recalculated excluding the Northern and Eastern Provinces as poverty data for these provinces was not available.
Table 2-2 Regional distribution of CRBs vs. poverty distribution
Province
Persons Below the PovertyLine (PBPL) CRBs
No. % No. %
235
170
256
247
112
128
170
1,318
17.8
12.9
19.4
18.7
8.5
9.7
12.9
100.0
323,710
547,401
558,619
305,364
57,567
356,540
528,824
2,678,025
12.1
20.4
20.9
11.4
2.1
13.3
19.7
100.0
2,307
3,220
2,182
1,912
1,785
2,785
3,111
2,432
PBPL/ CRB
Western
Central
Southern
North Western
North Central
Uva
Sabaragamuwa
Total
On average, each CRB covers 2,432 people below
the poverty line (PBPL) but considerable disparities
across regions can be observed. The provinces best
served relative to the prevailing poverty levels are the
North Central and North Western provinces with
1,785 and 1,912 PBPL served per CRB. These two
provinces together have 13.5% of the PBPL in Sri
Lanka (according to the Census of Population and
Housing, 2001) compared to 27.2% of the total
number of CRBs. At the other end of the scale, the
Central and Sabaragamuwa provinces seem to be
particularly underserved by the CRBs compared to the
share of PBPL living in these provinces (one CRB for
3,220 and 3,111 PBPL in Central and Sabaragamuwa
province respectively). When looking at the percentage
distribution of PBPL compared to that of the CRB
outlets, we observe that while these two provinces
together account for 40.1% of the PBPL covered by the
poverty census, only 25.8% of the CRBs are located in
these two provinces.
Clients
It is almost impossible to estimate the number of
microfinance clients of CRBs, since centralised data is
available only for the overall banking business of the
CRBs and covers mostly account information. The
CRBs covered by the survey, maintain over 10 million
savings and deposit accounts, close to 3 million loan
accounts and around 700, 000 pawning accounts.
Even though the respondents were specifically asked
for microfinance account information, it is likely that
a large number of them provided data concerning
their overall banking business. However, considering
the fact that 85% of their financial activities are
microfinance activities, this could reasonably be taken
to be representative of their microfinance portfolio. The
issue lies in the fact that it is very likely that clients have
multiple savings and deposit accounts within the same
institution, therefore estimating the number of clients
based on account numbers carries with it the likelihood
of some amount of overestimation. However, even
allowing for this, CRBs seem to have a good outreach.
Only 63% of the respondents have stated they focus
on target groups, suggesting there is no strong client
orientation in this institutional group. Of those who
focus on target groups, 77% focus on the lower income
groups, 75% on women, 71% on farmers, 62% on
entrepreneurs and 54% on youth.
Regarding the gender profile of their customers, a slight
majority of CRBs seem to serve predominantly women:
51% of respondents have stated they have more female
than male customers. 9% of the respondents have stated

MICROFINANCE INSTITUTIONSIN SRI LANKA 20
0925
their female customer share is lower than 25%, while for
38% of the respondents the share of female customers in
the total customer base is between 25% and 50%.
The respondents were also asked to provide an estimation
of the income profile of their customers. According
to their reporting, 24.5% of their customers have a
household income lower than Rs. 3,000 per month,
30.3% of the customers have an income between Rs.
3,000 and Rs. 5,000, 28% have an income between
Rs. 5,000 and 10,000, while the remaining 17.2% of
the clients have an average household income higher
than Rs. 10,000. With almost 55% of their clients
earning a maximum of Rs. 5,000, CRBs seem to have a
considerable outreach among the lower income group.
Figure 2-1 Monthly income of CRB clients
Figure 2-2 Economic activity of CRB clients
The highest proportion of CRB customers are involved
in agriculture, horticulture and cultivating (45%),
followed by manufacturing (15.6%) and trading
(15.3%). This is consistent with the fact that CRBs
mainly operate in rural areas.
According to the survey, the evolution of the customer
base in the previous year (2005) has been a positive
one: only between 3% and 12% of the respondents
have identified a negative development regarding their
client base for different products (loans, different types
of savings products and pawning), while between 75%
and 93% have reported an increase in the client base for
the same products. The most successful product from
this perspective seems to be pawning. Only 3% of the
respondents have reported a decrease, while 93% have
reported an increase in the customer base. The most
significant loss of customers (12%) is reported for loans.
The respondents who experienced a decline in their
customer base have attributed this to lack of funding
(52%), increased competition from other microfinance
institutions (38%) and the prevailing conflict situation
(24%). The first reason mentioned is somehow
paradoxical, since the volume outstanding of savings
and deposits in the case of CRBs largely exceeds that of
loans. The fact that more than half of the respondents
have mentioned lack of funding suggests that deposits
are used to support other activities of MPCSs. This can
also explain the resistance of MPCSs to separate CRBs
from their other operations.
Lending methodologyThe focus of CRBs is almost entirely on individual
lending (99% of the respondents), joint-liability
lending is offered by 28% of the respondents, while
only one respondent engages in wholesale lending to
intermediaries. 72% of the respondents offer individual
loans exclusively, while only one respondent provides
solely group lending. Even in the case of a mixed
lending methodology (individual and group lending),
individual loans predominate (on average 85.3% of the
loans in the respondents’ portfolio).
Identifying potential clientsPotential microfinance clients are identified by CRBs
through inspection and field visits (81% of the
respondents), evaluation of client’s past performance
(57%), recommendations of reliable current clients
(57%) and to a lesser extent, opportunities arising
out of non-microfinance activities of the organisation
(21%). It appears that CRBs do not make full use of
the opportunities arising from their relationship with
the MPCSs.
3.5%12.1%
45.0%
1.1%7.5%15.6%
15.3%
28.0%
11.9%4.0% 1.3%
24.5%
30.3%
< 3,000 LKR 10,001 - 20,000 LKR3,000 - 5,000 LKR 20,001 - 40,000 LKR5,001 - 10,000 LKR > 40,000 LKR
Agriculture/horticulture/cultivating Manufacturing Fisheries Services TradingAnimal husbandry Others

26
Loan processing time and approval procedureThe processing time for a loan varies from institution
to institution and is between one day and 45 days
with a comparatively low average of 18 days. 49% of
MPCSs have reported that their CRBs have a loan
processing time of under 15 days, while 29% of them
have a processing time of at least 30 days. All of the
respondents have stated that they require one day for
opening a savings account. Pawning facilities can also
be obtained within one day.
A minority of MPCS (41%) employ a decentralised
loan approval process: they equip their CRB managers
with loan approval limits. Most loan applications,
however, are submitted to the credit committee or the
regional level control body for approval (85%) either
directly or if the loan approval limit of the branch
manager is exceeded. It is noteworthy that only 35% of
MPCS include the evaluation of the loan officer in the
loan approval process.
Loan monitoring and provisioning74% of MPCS have reported their CRBs manage their
microfinance operations on a manual basis, 25% of them
use a mixed system of both manual and computerised
operations. Only one of the 196 respondents has a fully
computerised system in place for its CRBs. The access
to modern communication technology is also rather
limited. Only 7% of the respondents report having
access to email facilities and 6% to the Internet.
This lack of access to modern technology has implications
for the portfolio monitoring process. Therefore, 91%
of respondents rely on log books and other manual
records for portfolio monitoring purposes, 56% utilise
field visit records, while only 17% rely on computerised
financial statements.
When asked whether they carry out a portfolio quality
analysis and measure indicators such as Portfolio-at-
Risk, 65% of the respondents have stated that they
do. However, when asked to define Portfolio-at-Risk,
41% provided an age analysis and made reference to
non-performing loans (NPL). Only 24% mentioned
the relation between the risk of loss and the loan
portfolio in their definitions, 17% consider PaR to
be a fixed percentage of the total loan portfolio, while
the remaining provided different definitions which
are either not related to the concept of PaR or are
too general to be able to comment on the degree of
understanding of this concept by the respondents.
When asked to define non-performing loans, 73%
have referred to an age analysis, while 22% didn’t have
or couldn’t provide such a classification. But even in the
case of respondents which have provided classification, a
large heterogeneity could be observed, with definitions
of non-performing loans going up to five years.
58% of the respondents claim to make provisions for
microfinance NPLs. 40% of those who claim to provide
for loan losses calculate the provision based on the aging
categories. 31% of the responses showed confusion
between provisioning and loan recovery mechanisms,
while the remaining 26% of the responses were setting
fixed provision rates on total loan portfolio, income or
profit.
Defaulting clientsIn case of a defaulting client the following measures are
employed: legal action (83% of respondents), penalties
and fines (57%), group or social pressure (44%), and
freezing savings/deposit account (44%). It is interesting
to notice that arbitration does not play a significant
role in the recovery process of CRBs (only 28% of
respondents follow this route). The high percentage of
legal action is surprising since confiscating and seizing
property does not play a major role in recovering loans
(16%).
Operational challengesThe respondents identify the main operational
challenges for their microfinance business to lie in
the inadequacy of Management Information System
(MIS) and in poor utilization of technology (65% of
all respondents), delayed repayments of loans (58%),
strong competition (55%), shortage of funds (46%)
and lack of equipment (40%). It has to be noticed
that most of the challenges are interrelated: inadequate
MIS, poor technology and equipment make loan
quality monitoring difficult, which results in poor loan
repayment performance. The shortage of funds reflects
more an issue of misallocation rather than of funds
mobilisation.

MICROFINANCE INSTITUTIONSIN SRI LANKA 20
0927
2.4 Products and Markets
Loan products are offered by 99% of the respondents
(194 out of the 196 respondents). Savings and deposit
products are offered by all respondents, two of which
have stopped providing loans and offer only savings and
deposits. Pawning seems to be a popular product among
CRBs as 82% of the respondents have stated they offer
it through their CRBs. Leasing and insurance does not
play an important role for this group of institutions.
These two products are each offered by only two of the
196 respondents. An overview of the product portfolio
of CRBs is offered in Table 2-3.
Table 2-3 Microfinance product portfolio of CRBs
Product / Service
No. of MPCSs Volume
Outstanding
(‘000 Rs.)
No. of
Accounts
Average
outstanding
account
balance
(Rs.) ***
Annual
Interest
Rate
(%)
Offer the product/service
Providedinformation
Savings and Deposits
Loans
Pawning
196
194
160
192*/194**
192*/188**
158*/156**
19,500,033
10,829,698
4,272,482
10,356,388
2,783,000
715,823
1,881
3,631
5,819
3-20
2-24
14-24
Note * Number of MPCSs which have disclosed the volume outstanding corresponding to their CRBs.
** Number of MPCSs which have disclosed the number of accounts corresponding to their CRBs.
*** The average outstanding account balance was calculated solely based on outlets for which both volume outstanding and number of accounts were disclosed. Due to differences in the number of outlets covered for the two indicators, the result of this column may be different from the mere division of the column “Volume outstanding” by the column “Number of accounts”.
Loan products
Loan products are offered by the CRBs of 99% of the
respondents. Two MPCSs in the sample have stated
their CRBs offer only savings products and no loans. A
respondent has an average loan volume outstanding of
Rs. 56 million and 14,803 loan accounts. The volume
outstanding ranges between Rs. 95,000 and Rs. 1
billion. The CRBs under the umbrella of the five largest
MPCSs (3% of the respondents) account for 30% of
the total volume outstanding. As for the number of
loan accounts, these range from just four to 2.4 million
accounts. Here, the discrepancy is even more evident,
as the largest MPCS in terms of number of accounts
holds 86% of the total number of accounts. In fact, if
this respondent is excluded from the sample, the average
number of accounts per MPCS drops to only 2,054.
The average outstanding loan balance of Rs. 3,631 is
intriguingly low and may reflect the risk aversion of
CRBs in granting larger loans to clients with a low
degree of creditworthiness as well as the generally low
absorption capacity of their clients.
A number of CRBs offer strongly subsidised loans. 43%
of the respondents have reported at least one product
with an interest rate no more than 15%, which is
significantly under the rate of inflation and is therefore
a negative interest rate.
Minimum loan values available to customers (excluding
wholesale lending) range between Rs. 250 and Rs.
30,000. The minimum value in case of 71% of the
respondents does not exceed Rs. 5,000. 37% of the
respondents have maximum values not exceeding Rs.
50,000, which is also quite low.
The repayment period of the loans ranges from one
to 144 months. 78% of MPCSs have reported loan
products with a repayment period of 36 months or

28
more. This indicates that CRBs cater to the long-term
needs of the customers, such as housing.
97% of the respondents require compulsory savings in
order to approve a loan.
Interest rates are set by 57% of the respondents at
regional level, while 36% of the respondents have
mentioned the CRBs under their umbrella have the
authority to decide on the interest rates charged.
Interest rates are mainly set based on commercial rates
(67%), while 30% of respondents set them at a rate
which maintains a set margin above the deposit rate.
61% of the respondents have reported they apply
penalties on late payments and interest rate reductions
for early payments. 33% of the respondents have
reported no special conditions, while 16% have special
terms for specific target groups.
98% of the respondents have stated their CRBs calculate
interest rate based on the declining balance basis. 62%
of the respondents have mentioned that they charge a
service fee in order to process a loan application.
Formal lending requirementsOn average 3% of loan applications received are
rejected, with rejection rates ranging between 0%
and 25%. It is interesting to notice that 34% of the
respondents do not reject any application, while only
13% of the respondents reject 10% or more of the loan
applications received. The low rate of rejection may be
explained by the existence of a pre-screening process
of clients, since formal requirements are extremely
rigorous, at least according to the information provided
by the respondents.
In order to qualify for a loan, potential clients have to
be members of the MPCS (mentioned by 96% of the
respondents), present guarantors (94%), show proof
of having income sources (86%), hold a minimum
deposit with the CRB (80%), show proof of established
residency (80%), provide collateral (63%) and receive
the approval of the regional level control body (40%).
Around a third of the respondents have also mentioned
the need for a recommendation from a third party such
as a CRB leader or member.
The conclusion of the analysis of the formal lending
requirements in the case of CRBs indicates that loans
offered by this group of institutions tend to be over-
collateralised. Besides the fact that almost two thirds of
the respondents have mentioned physical collateral as
a requirement, a large majority require other forms of
security such as guarantors, proof of income sources,
minimum deposits etc. It is difficult to believe that the
typical microfinance client will be able to comply with
these all these requirements.
It is also noteworthy that despite such stringent formal
lending requirements, CRBs mention delayed loan
repayment to be one of the main operational challenges
they face. This suggests that either in practice these
lending requirements are not always enforced or
that CRBs are highly inefficient in enforcing loan
repayment, despite all the loan securitization measures
in place.
Savings productsAll CRBs offer savings products to their customers.
On average the savings volume outstanding is Rs. 102
million per CRB, but there are large heterogeneities
in the sample. The savings volumes outstanding of
individual respondents range from Rs. 49,700 to Rs. 1.2
billion. The ten largest respondents, representing 5%
of the total number of respondents, together hold 28%
of the savings portfolio. As for the number of accounts,
on average each respondent has 53,383 accounts. The
range for the number of accounts lies between 25 and
5.6 million accounts. The concentration in terms of
number of accounts is even more evident. The largest
MPCS holds more than half (54.5%) of the total
number of accounts, while the ten largest respondents
hold together 62.2% of the total number of accounts.
The average savings account balance of Rs. 1,881 is
extremely low. This speaks for a low savings capacity
of the microfinance client base of CRBs, which is in
line with their estimate that 55% of their clients have
a monthly income level of Rs. 5,000 or less. At the
same time, there was no information available on the
average number of savings accounts one each client
holds, whereby the average savings balance at client
level might be higher.

MICROFINANCE INSTITUTIONSIN SRI LANKA 20
0929
With respect to interest rates, 95% of the respondents
have mentioned their CRBs have at least one product
with an annual interest rate below 11%, the inflation
rate for 2006.57 In the case of 45% of the respondents
all their savings products carried interest rates of below
11%, clients thus receiving negative real interest rates.
The average interest rate offered by all respondents across
all savings/deposit products is 8.65% per annum. The
minimum amount required to open a savings account
ranges from Rs. 5 to Rs. 500. 75% of the respondents
do not require more than Rs. 100.
Other productsThe CRBs of 160 of the 196 (82%) MPCSs offer
pawning facilities. The volume outstanding on pawning
accounts for the CRBs covered by the survey ranges
from Rs. 101,750 to Rs. 190 million, an average of Rs.
27 million per respondent. The ten largest respondents
(6% of the respondents) account for 27% of the
volume outstanding. The number of pawning accounts
ranges from 11 to 32,828, which gives an average per
respondent of 4,588. The ten largest respondents hold
21% of the total pawning accounts.
Interest rates on pawning facilities range from 14% to
24% per annum, with 80% of respondents charging
less than 20%. The minimum value that can be
obtained through pawning goes up to as much as Rs.
10,000, but 89% of the respondents have mentioned
minimum values of no more than Rs. 5,000. 55% of
the respondents have a maximum available value of Rs.
50,000 or less.
It is interesting to notice that the average outstanding
balance of a loan is smaller than that of a pawning
account. We can infer that CRBs prefer to offer
pawning than loans to the lower income groups as they
carry fewer risks since they have recourse to an asset
to recover outstanding dues in the event of default.
However, this makes access to finance for the poor
conditional upon having something of value which
could be pawned. Therefore the goal of microfinance
to facilitate access to financial services for the lower
income group cannot be considered to be attained in
the case of CRBs.
7 The World Bank, World Development Indicators.
Insurance, leasing and a pension product are each offered
by two of the 196 MPCSs. This group of institutions
thus seems to have little diversification of their product
portfolio, concentrating only on traditional loan and
savings products.
Delivery of products and marketing strategiesProducts and services are directly delivered through
branches (95%) and to a lesser extent through field
officers (22%). 9% of the respondents have stated
they deliver their products through links with other
institutions.
CRBs marketing strategies focus on leaflets (76%),
promotion through the general activities of the
MPCSs (73%), banners, posters and hoardings (68%)
and through members of the MPCS (67%). The
respondents seem to have an appropriate approach to
marketing – they employ cost effective measures and
use their organisational potential.
Product developmentMicrofinance product development is mainly handled
at MPCS level with inputs from individual CRBs
(72%). The Board of Directors of the MPCS decide
on the products to be introduced. However, the
approval of the Assistant or Provincial Commissioner
of Co-operatives is required in order to introduce new
products on the market. From the responses obtained,
in 15% of the cases, product development is handled
at CRB level by an internal team and in 11% of the
cases by the manager. Considering the fact that this
group of institutions has a rather flat structure, it seems
reasonable to place product development at the MPCS
level.
When asked about new products to be introduced to
the market, 77% of respondents claimed they had plans
to introduce new products, while 23% do not. Of the
respondents which had plans to introduce new products,
the majority focused on a further diversification of
existing savings (85%), loans (83%) and pawning
(43%) products. Only 10% of the respondents with
plans to introduce new products considered pension
products. Other products such as insurance, leasing and
money transfer were mentioned by 3% to 6% of the
respondents with plans to introduce new products.

30
During the previous two years, 40% of the respondents
have not introduced any new microfinance products,
while 46% have introduced between one and three
new products. The remaining 14% have introduced
between four and 15 new microfinance products.
During the same period, only 5% have withdrawn
between one and three microfinance products from the
market. This indicates that products once introduced
are usually kept in the product portfolio irrespective of
their success.
2.5 Human Resources
The total staff of the MPCSs interviewed ranges from
four to 376, while Women’s Development Cooperative
Societies employ a total of 3,000 staff. On average, the
institutions covered by this chapter employ 14 staff
per outlet. The following table provides an overview
of MPCS/WDC staff. The total number of staff
involved in microfinance is not known. At the same
time, considering the fact that CRBs are not separate
entities, in 88% of the cases staff is also involved in
other non-financial activities of the MPCSs.
Table 2-4 Microfinance staff complement of Multi-Purpose Cooperative Societies
Total Staff*(MPCSs and
WDCs)Managerial Credit/Field
Officer
Others/SupportStaff
Clerical
Experience required
20,077 (30.3%) (7.4%) (38.5%) (23.6%)
A/L passed (45%) / O/L
passed (39%) / below
O/L(14%)
A/L passed(51%) / O/L
passed (22%)/ below O/L
(11%)/tertiary education(13%)
A/L passed (45%) / O/L
passed(40%) / below
O/L(12%)
n/a
yes (67%)yes (78%) yes (67%) n/a
Minimum Qualification Required
Absolute Number (%)
n/a not available
The share of clerical staff is comparatively high at
38.5%, while credit/field officers account for only 7.4%
of total staff. The minimum qualifications required
for clerical staff and credit/field officer positions do
not differ significantly. It is however surprising that
a considerable number of respondents (between 11%
and 14% for the different staff categories) accept staff
without even O/L qualifications.
Of the 19,757 staff for which the break down by
contract type was provided by the respondents, 71%
of them had permanent status, 15% were volunteer
staff, while the rest of them were time-bound workers,
short term staff or casual workers. The relatively high
percentage of volunteer staff comes from the fact that
all staff of Women’s Development Cooperative Societies
are volunteers.
Recruitment challengesThe respondents have identified the following challenges
to recruiting suitable staff for their microfinance
operations: the absence of a pension system (between
60% and 63% depending on the type of positions),
attractive remuneration and benefit packages in

MICROFINANCE INSTITUTIONSIN SRI LANKA 20
0931
competitor organizations (between 51% and 55%), as
well as the lack of skilled staff (between 49% and 52%).
In addition to these main challenges the respondents
have identified a series of other issues including
unattractive locations (between 42% and 44%) and the
lack of staff with experience in microfinance (between
29% and 57%).
Staff retentionThe most important staff retention issues mentioned
by MPCSs were: lack of technology and the wide
utilisation of manual processes (78%), inadequate
remuneration (71%), inadequate incentives (63%),
and overload of work (36%).
IncentivesThe incentives provided by MPCSs for their
microfinance staff include, according to the survey:
training opportunities (92%), remunerative incentives
(68%), staff loans at concessionary rates (67%) and
overtime pay (66%). In view of the staff recruitment
and retention issues mentioned above, these incentives
seem to be insufficient.
MPCSs provide differentiated training according
to each category of staff. Managers receive training
mainly in human resource development (mentioned
by 67% of respondents), project management (62%),
customer care (60%), marketing (54%) and business
planning (52%). It has to be noticed that the courses
offered by the majority of the respondents cover
general management skills and do not address specific
microfinance management issues, even though the
lack of staff with microfinance training was mentioned
as one of the main recruitment constraints. Clerical
staff receives training in record keeping (60%),
accounting skills (52%) and customer care (51%),
while credit and field officers receive training in client
and customer care (58%) and credit evaluation (50%).
It has to be mentioned that language and IT training
seems to receive little attention from this group of
institutions, being mentioned only by a minority of
the respondents.
In terms of number of courses offered per year per
respondent for each staff category, managerial staff
received on average 3.4 training sessions per year,
followed by credit and field officers with 2.9 training
courses per year, clerical staff with 2.7 training courses
and support staff with 1.7 training sessions per year.
2.6 Financial Performance
In 195 of the 196 institutions interviewed the set of
financial statements was available; 25 of them had
microfinance specific statements, the others had overall
statements in which the microfinance segment was
included. Of this number, 171 (88%) were willing
to provide information regarding their financial
performance.
Performance ratios could not be calculated based on
the data provided since balance sheets consolidated
all activities of the MPCSs, while income statements
provided were related only to the activities of CRBs.
Considering all these issues, an analysis of the financial
performance of the CRBs could not be carried out.
Around the half of the CRBs (52%) covered by the
survey have declared that they transfer their surplus
earnings to their respective MPCS or to the Department
of Cooperative Development at district or provincial
level, while the rest has stated they retain their profits
within the CRB. At MPCS level, 58% of respondents
have said they pass their surpluses on to the Department
of Cooperative Development at district or provincial
levels. This mixed picture hints at misunderstandings at
MPCS level regarding their rights and duties and creates
the premises of public interference in their business
affairs. This may represent an important source of
inefficiencies. According to information available from
the representatives of the Department of Cooperative
Development at district level, MPCSs are allowed to
use internally generated surpluses to build provisions.
For any other use of the surplus earned, according
to the respondents, MPCSs need the approval of the
Department of Cooperative Development (head office
in Colombo). According to the Co-operative Societies
Law, registered co-operative societies are required to
transfer at least 25% of their net profits to a reserve
fund. The remainder of the profit may be used for the
payment of dividends to members, payment of bonuses
to employees, contributions to funds etc. As member-
owned organisations, MPCSs should be allowed more
independence to decide regarding the utilisation of their

32
profits. This would be a strong incentive for them to
operate more efficiently. A consequence of the current
regulation could be an underreporting of profits, thus
distorting the true picture of the financial performance
of MPCSs and their CRBs.
References
“Study on Co-operative Movement”, unpublished
report
http://www.coop.gov.lk/home.asp
http://co-opruralbank.com/AboutUs.html

Samurdhi Bank Societies


MICROFINANCE INSTITUTIONSIN SRI LANKA 20
0935
Samurdhi Bank Societies (SBSs) were established in 1996
as part of the National Samurdhi Programme, a wide-
ranging governmental poverty alleviation programme
targeting youth, women and the disadvantaged.
The Samurdhi Programme is implemented by the
Samurdhi Authority of Sri Lanka. The Programme has
three major components: provision of a consumption
grant (food stamps); provision of savings and credit
facilities; and rehabilitation and development of rural
infrastructure. The second component is carried out
through the SBSs.8
The establishment of the SBSs was aimed at promoting
savings among low-income groups and providing
financing for entrepreneurial and business development.
The SBSs have been involved solely in microfinance
activities since their inception, targeting low-income
households (defined as households having an income
of less than Rs. 1,500 a month). Microcredit is defined
by SBSs as a loan below Rs. 100,000.
3.2 Organisational Structure and Governance
Organisational StructureAs can be seen in figure 3-1 the organisational structure
of the Samurdhi Programme is complex and highly
hierarchical, going from the Grama Niladhari Division
level up to the zonal, divisional, district and national
levels. Financial services are provided through the
Banking Finance Division of the Samurdhi Authority
and follow a similar hierarchical structure. The Banking
Finance Division is considered the Head Office of the
Banking Societies.
Although for the purpose of this study, only the
Banking Finance Division of the Samurdhi Authority
was interviewed, the responses provided concern the
general operations of the SBSs. In view of the high level
8 See World Bank (2003), “An Empirical Evaluation of Samurdhi Programme” and ILO (2000), “The Samurdhi Poverty Alleviation Scheme”.
3. Samurdhi Bank Societies
3.1 Institutional Background
of centralisation of the operations, this was considered
to be representative.
Regulation and SupervisionThe activities of SBSs are governed solely by the
Samurdhi Authority Act No. 30 of 1995. Although
the Auditor General’s Department was cited as the
responsible supervisory authority, its role is not a
supervisory one, as it is in reality limited to an annual
audit, which in turn is limited by several factors as
mentioned below. According to the information
provided by the respondent, both offsite and onsite
inspections of accounts are performed and the SBSs
have to report monthly to the Samurdhi Authority –
note that the responses refer to internal supervisory
measures and to an external audit, but that there is no
independent supervisory body.
SBSs are not supervised by the Central Bank of Sri Lanka
(CBSL). Deposits are not insured by the Government
of Sri Lanka.9 In fact, the CBSL is cited to have stressed
the risks of SBSs mobilising large volumes of savings
without proper regulation and supervision in its 1997
Annual Report10
AuditAlthough SBSs are part of the comprehensive Samurdhi
Programme, they are managed as separate entities with
their own books of accounts. The Samurdhi Authority
has an Internal Audit Department, which is responsible
for the internal audit of the SBSs. Due to capacity
limitations, the internal audit is performed from the
Maha Sangam level upward (a Maha Sangam covers
approximately 10 SBSs). The accounts of the individual
SBSs are checked by the accounting departments at
Divisional level.
9 World Bank (2003), “An Empirical Evaluation of Samurdhi Programme”
10 Conroy, John D. (2000), “Sri Lanka”, in: “The Role of Central Banks in Microfinance in Asia and the Pacific”, Vol. 2: Country Cases.

36
External audit is performed by the Auditor General’s
Department for the Samurdhi Authority only.
Individual SBSs are not audited by the Auditor
General. Instead, the accountants of the Divisional
Secretariat offices have been authorised to audit SBSs.
Considering the complexity of the National Samurdhi
Programme, as well as the obvious staff and resource
constraints of Divisional Secretariat offices, there is no
meaningful external audit of the SBSs taking place.
Decision making / Strategic planningThe Samurdhi Authority declares that the SBSs prepare,
and adhere to, microfinance business development goals
in accordance with the business plans and strategies
designed by the government or the relevant authorities.
Available information suggests that the responsible
Ministry plays a role in determining key strategic
elements such as interest rates (which, according to the
respondent, are based on the computation of product
costs), human resource management, product design,
target group definition, as well as the general policies of
the SBSs. The Treasury determines the funds available
to the SBSs through the Banking Finance Division.
The operating policies of the SBSs are defined by the
Board of Directors of the Samurdhi Authority. The
question arises whether there is sufficient microfinance
specialist knowledge at such a high hierarchical level.
Figure 3-1 Administrative Levels of the National Samurdhi Programme
Divisional SecretaryDeputy Director
Divisional Samurdhi UnitHeadquarter Managers
District SecretaryDistrict Directors
District Samurdhi OfficeAsst. Commissioner of Samurdhi
Ministry of Nation Building and Estate Infrastructure DevelopmentDepartment of Commissioner-General of Samurdhi
Samurdhi Authority of Sri Lanka
National Level
DistrictLevel
Divisional Level
ZonalLevel
Grama Niladhari Divisions Level(Samurdhi Task Force)
Beneficiaries(Small groups)
Zonal Managers Zonal Managers
Samurdhi Development Officers / Animators
Source: Annual Report of the Samurdhi Authority (2003) and http://www.priu.gov.lk/

MICROFINANCE INSTITUTIONSIN SRI LANKA 20
0937
3.3 Operations
Outlet distributionThe regional and sectoral distribution of the SBSs is
presented in the table below:
Table 3-1 Regional and sectoral coverage of SBSs
SBSs Sector
No. % Urban Rural Estate
Western
Central
Southern
North Western
North Central
Uva
Sabaragamuwa
Northern
Eastern
Total
Province
Population Density per PTCCS
(Population / No. of SBSs)*
184
165
160
167
75
70
90
37
90
1,038
17.7
15.9
15.4
16.1
7.2
6.7
8.7
3.6
8.7
100.0
21 (11.4%)
5 (3.0%)
8 (5.0%)
3 (1.8%)
1 (1.3%)
3 (4.3%)
2 (2.2%)
5 (13.5%)
6 (6.7%)
54 (5.2%)
163 (88.6%)
159 (96.4%)
151 (94.4%)
164 (98.2%)
74 (98.7%)
67 (95.7%)
88 (97.8%)
32 (86.5%)
84 (93.3%)
982 (94.6%)
0
1 (0.6%)
1 (0.6%)
0
0
0
0
0
0
2 (0.2%)
29,137
14,725
14,322
12,920
14,941
16,725
19,866
28,134
19,666
18,419
SBSs have good nationwide coverage and serve mainly
rural areas (95%). The only districts which are not
covered are Mannar, Mullaittivu and Killinochchi,
due to the conflict situation. The distribution between
the urban and rural sectors ranges between 1.3% and
13.5% in the urban sector and between 86.5% and
98.7% in the rural sector. The Northern and Western
Provinces have a higher proportion of urban branches
compared to other provinces. The population density
per SBS varies between 12,920 in the North Western
Province and 29,137 in the Western Province, with a
national average of 18,419 people per SBS.
12.2% of all SBSs are located in the Northern and
Eastern Provinces. Poverty figures are not available for
these provinces but it is noted that the coverage closely
corresponds with the percentage of the country’s population
living in these provinces (approximately 13%).
The estate sector is clearly underserved, with only 0.2%
of SBSs located in estate areas. This is particularly
significant, especially considering the fact that 8.57%
of persons below the poverty line (PBPL) in Sri Lanka
live in the estate sector.11
Table 3-2 compares the regional distribution of SBSs
with that of the population living under the poverty
line.
11 ILO (2000), “The Samurdhi Poverty Alleviation Scheme.
Note * The source for population per province is the Census of Population and Housing, Department of Census and Statistics – Sri Lanka, 2001. For the Northern and Eastern Provinces, 2001 estimates from the Department of Census and Statistics were used.

38
Table 3-2 Regional distribution of SBSs vs. poverty distribution
Note The poverty percentage represents the percentage of the total population (excluding the Northern and Eastern Provinces) living under the poverty line in a given province. The percentage of SBS branches was re-calculated as poverty data for the Northern and Eastern Provinces was not available.
Province
Persons Below the PovertyLine (PBPL) SBSs
No. % No. %
542,157 16.9 184 20.2 2,947
547,401 17.1 165 18.1 3,318
558,619 17.4 160 17.6 3,491
472,384 14.4 167 18.3 2,829
199,875 6.2 75 8.2 2,665
356,540 11.1 70 7.7 5,093
528,824 16.5 90 9.9 5,876
3,205,800 100.0 911 100.0 3,519
PBPL/ SBS
Western
Central
Southern
North Western
North Central
Uva
Sabaragamuwa
Total
The density of PBPL per SBS ranges between 2,665
in the North Central Province to 5,876 in the
Sabaragamuwa Province, which suggests rather large
regional disparities in serving the poor. Comparing the
percentage of population that lives under the poverty
line with the percentage of SBSs in each province, it is
observed that Uva and Sabaragamuwa are significantly
underserved with 11.12% and 16.49%, respectively,
of the persons below poverty line in the country, but
only 8.23% and 7.68%, respectively, of the SBSs. The
Western, Central, North Western and North Central
Provinces display a higher percentage of SBSs compared
to their poverty percentage.
ClientsSBSs serve a total of 2.3 million members and another
227,000 non-member clients who hold only savings
accounts with the SBSs and are not entitled to loans.
Both female and male clients are served; however,
females represent the majority of clients (around
65%).
Approximately 85% of all clients have a monthly
household income of less than Rs. 1,500 (and therefore
fall within the target group definition of the SBSs),
while the remaining 15% are from higher income
groups. These figures must be analysed with caution
as they may be only rough estimates made at the
top hierarchical level. The proportion of clients with
incomes greater than Rs. 1,500 could be higher due to
the fact that non-members can open savings accounts
as well. It could also be due to the SBSs lending to
individuals outside the target group, thus contravening
the Samurdhi Programme’s poverty focus. It has to be
noted that even though the Samurdhi Programme has
an income-based exit criterion for its members, a report
of the International Labour Organisation (2000) finds
its enforcement virtually nonexistent, due to the lack of
effective controls and also due to political pressure.12
Lending methodologyAlthough the respondent categorised the lending as
being solely individual, the procedures in place suggest
that group lending is the methodology used by the
SBSs. Only members (shareholders) can borrow, and to
do so, the borrower has to be in a group of five people,
with the other four members guaranteeing the loan
repayment.
12 ILO (2000), “The Samurdhi Poverty Alleviation Scheme”

MICROFINANCE INSTITUTIONSIN SRI LANKA 20
0939
Identifying potential clientsAccording to the respondent, SBSs identify microfinance
clients by carrying out field visits, evaluating past
performance and following up recommendations of
reliable current clients. In view of the answers given, it
would seem that the SBSs do not make good use of the
opportunities that arise out of the other components of
the Samurdhi Programme, but due to the restrictions
in the sample selection, the reality in the field might be
different.
Loan processing time and approval procedureThe average processing time for a loan is 14 days. This
is the average time from handing in an application up
to the disbursement of the loan. For opening a deposit
or savings account, the processing time is one day. Loan
approval is through a credit committee at the regional
level control body (Palaka Mandalaya), which denotes
a centralised approach.
Loan monitoring and provisioningMicrofinance operations are managed on a manual
basis. The consequent monitoring of loan repayment
relies on checking of log books, account entries and
manual records.
SBSs use the following classifications with regards to
overdue loans:
is used as a measure of loan
portfolio quality and is defined as the outstanding
debt in case any one instalment of the loan is
overdue for more than 70 days. 13
are used as a
measure of bad debts and refers to loans with any
instalment overdue for more than nine months.
Loan loss provisions are calculated only for NPLs.
The loan loss reserve stood at 7.4% of the gross loan
portfolio as at 2005. So far, according to the information
provided, write-offs against provisions have not been
executed.
13 The internationally accepted norm for microfinance loan portfolio quality is PaR30 for weekly or bi-weekly loan repayments (i.e. loan portfolio greater than 30 days past due) and PaR90 for monthly loan repayments.
Defaulting clientsIn case of default by a client, SBSs exert social pressure
by contacting guarantors, impose penalties and freezing
savings account(s). If these measures fail, SBSs engage
in arbitration through a mediation board. SBSs do not
seem to take legal action against defaulting clients,
probably due to the social mission of the Samurdhi
Programme and due to the fact that the cost of engaging
in legal action is high relative to the average loan size.
Operational challengesSBSs identify their main operational challenges to be
staff-related. On one hand, they face overstaffing which
leads to high operational costs; on the other hand,
the staff lack appropriate skills. The respondent also
cited the high level of staff fraud as a challenge. Other
operational challenges, as identified by the respondent,
include the lack of a clear definition of the target group
and a lack of awareness among potential beneficiaries
as to how to use the funds appropriately, which results
in an insufficient demand for loans. Another challenge
mentioned was the lack of cohesion among group
members, which could be due to the fact that groups are
often built arbitrarily by the Samurdhi Development
Officers and not based on existing social relationships
and affinities.14
3.4 Products and Markets
SBSs offer different types of savings and loan products.
An overview of the product portfolio is presented in
table 3-3.
The SBSs are able to mobilize savings quite well even
though the average outstanding balance for voluntary
savings is extremely low (slightly under LKR 2,000).
The average outstanding loan balance of less than LKR
12,000 is also relatively low, indicating a low absorption
capacity of SBS borrowers.
14 See ILO (2000), The Samurdhi Poverty Alleviation Scheme”.

40
Table 3-3 Microfinance product portfolio of SBSs
Table 3-4 Overview of terms and conditions of SBS loan products
Product / ServiceVolume
Outstanding (‘000 Rs.)
No. of Accounts
Average outstanding
account
balance (Rs.)
Annual
Interest
Rate (%)
Voluntary Savings / Short-TermDeposits (for Members and Non-Members)
Compulsory Savings
Shares
Loans
8,815,360 4,520,894 1,950 5.64%
8,799,000 1,352,330 6,507 8.5%
3,196,000 2,422,396 1,319 -
7,785,071 656,330 11,862 14-18%
Figures as at 30 June 2007
Loan productsInterest rates on loans are calculated on a declining
balance basis and there is no service charge for
processing loans. There is no minimum loan amount
and maximum loan amounts range from LKR 5,000
for distress loans to LKR 100,000 for self-employment
loans. The repayment periods vary from 3 months for
distress loans to 60 months in the case of loans for self-
employment, production, agriculture and fisheries.
More details are provided in the table below:
Annual InterestRate (%)
Maximum Repayment Period (Months)
Maximum Loan Amount
(Rs.)
100,000
15,000
Not Mentioned
30,000
5,000
10,000
60
60
Depends on Repayment Capacity
36
3
6
14-18%
18%
2% Above Deposit Rate
18%
18%
18%
Self Employment
Production, Agricultural/Fisheries
Self Empowerment
Housing
Distress
Consumption
Loan Purpose
Lending conditionsIn order to obtain a loan, eligible individuals have to
be at least 18 years of age, become a member of an
SBS and own at least one SBS share of Rs.500, present
a certificate from the Samurdhi Development Officer
(SDO), maintain a minimum deposit or bank balance,
be part of a group of five members with the other four
members having the role of guarantors and receive
the approval of the regional level control body. The
requirement for a group of guarantors and maintenance
of a minimum deposit balance are essentially collateral
substitutes.

MICROFINANCE INSTITUTIONSIN SRI LANKA 20
0941
Savings productsWhereas loans are available only to members who own
at least one share of an SBS, valued at LKR 500, which
can be built up through savings over time, savings are
accepted from both members and non-members. There
are both compulsory and voluntary savings schemes,
the compulsory loan scheme being a requirement for
borrowing. SBSs offer specific savings schemes for
particular target groups such as women, students, and
children.
Delivery of products and marketing strategiesProducts and services are directly delivered through
SBS branches as well as through SDOs.
Table 3-5 Microfinance staff complement of SBSs
Samurdhi
Development
Officers (SDOs)
Loan Officers /
Clerical StaffManagerialTotal Staff*
Absolute Number
Type of Employment
Staff per Branch (Average)
Staff Productivity**
Minimum Qualification Required
Experience Required
14,500
Permanent
14
437
1,040 (16%)
Permanent
-
-
Graduate
No
5,460 (84%)
Permanent
-
-
O/L passed
No
8,000
Permanent
-
-
Not mentioned
No
Note * A third of the SDOs are included, as apportioned by the Samurdhi Authority in their financial reporting.
** Staff productivity is calculated as the total number of savings and loan accounts divided by the total number of staff.
Recruitment challengesThe respondent did not mention any challenges with
regard to the recruitment of SDOs, probably due to
the fact there are no strict minimum qualification
requirements and employment with the state is
considered attractive. A report of the International
Labour Organisation (2000) suggests that recruitment
of the SDOs is done “to satisfy the employment
creation motive of the government and to gain political
mileage”.15
The respondent mentioned several challenges
with regards to recruiting managerial staff, which
include the difficulty of finding skilled people with
15 ILO (2000), “The Samurdhi Poverty Alleviation Scheme”.
microfinance experience, more attractive packages and/
or remuneration offered by competing organisations,
the absence of a pension system, and poor working
conditions.
Staff retentionThe main retention issue mentioned is the lack of
technology. This must be seen against the background
that SBSs’ operations are run on a manual basis,
which probably leads to some frustration among
staff. However, one would have expected monetary
issues to play a role in retaining staff since attractive
remuneration packages offered by competitors are seen
as a challenge in recruiting managers.
Product developmentNew product development is handled at the central
level with support from individual SBSs based on
the experiences of field officers. The products offered
by competitors are also monitored. The respondent
mentioned preparations in progress to introduce fixed
term deposits, pawning, micro leasing and money
transfer services.
3.5 Human Resources
The following table provides an overview of the SBSs’
staff complement.

42
IncentivesThe incentives cited by the respondent were of a monetary
nature (remunerative incentives and distribution of
revenue in the form of bonuses) and in the form of
training opportunities and medical insurance. It has to
be noted though that the respondent cited insufficient
remuneration as a constraint in recruiting managers.
Performance-based incentives seem to be insignificant
or altogether non-existent.
Staff trainingAccording to the responses received, the key focus areas
of training for both managerial staff and field officers are:
human resources development and staff productivity,
group mobilisation, and accounting skills. In addition,
the respondent mentioned that managerial staff receives
training in project management, marketing, business
planning, record keeping, IT, development of language
skills, risk management, and training in basic financial
analysis.
SBS sources of funding are mainly short-term deposits
from members and non-members (81.6% of total
liabilities). The cost of funds16 is 5.8% while the
lending rate17 is 11.4%. Hence, the financial spread
is 5.6%. The financial spread covers administrative
expenses and risk costs.
The lending activity ratio (i.e. gross loan portfolio over
total assets) is 25.4%, i.e. only every fourth Rupee
is invested in lending activities, hence in financial
intermediation. SBSs major financial activity seems
to consist of investing customers’ savings with other
financial institutions.
16 Interest and fees on funding liabilities / average total funding liabilities of that period.
17 Interest income from lending / average gross loan portfolio of that year.
Note *Concessional borrowings
Table 3-6 SBSs – Consolidated Balance Sheet (Rs. ‘000)
Items 2005
Total Current Assets 24,905,300
Total Non - Current Assets 14,297
Net Loan Portfolio 7,651, 179
Total Assets 32,570,776
Total Deposits 20,995,511
Total Borrowings* 2,085,433
Total Other Liabilities 2,657,552
Total Liabilities 25,738,496
Total Equity 6,832,280
Total Liabilities and Equity 32,570,776
3.6 Financial Performance
The following tables summarise SBS balance sheets for
2005 (Table 3-6) and income statements for 2004 and
2005 (Table 3-7).

MICROFINANCE INSTITUTIONSIN SRI LANKA 20
0943
Table 3-7 SBSs – Consolidated Income Statement (Rs. ‘000)
The reported operating expenses are substantially
underestimated, as personnel expenses are largely
borne by the Government and are not reflected in the
SBSs financial statements. The proportion of personnel
costs of the SDOs attributable to the SBSs is estimated
at one-third considering the fact that SDOs are not
assigned solely to banking activities. It has to be noted
that this estimate is rather arbitrary.
The actual operating expenses booked to the SBSs are
computed on the basis of 45% of the interest earned
on compulsory savings. Furthermore, SBSs do not pay
taxes, and as a wholly state-owned programme, might
benefit from other indirect subsidies. The decrease
in operating expenses between 2004 and 2005 is
surprising and further analysis is needed in order to
be able to explain its causes. The decrease in loan loss
provision expenses in the same period is also substantial
and noteworthy.
Items 2005 2004
Total Operating
Revenue 2,749,616 2,364,365
Total Financial
Expenses 1,335,999 1,046,055
Total Operating
Expenses 298,517 323,642
Loan Loss
Provision
Expenses 7,569 172,625
Net Income
from Operations 1,107,529 822,042
Net Income 1,107,529 822,042

44

NGOs


MICROFINANCE INSTITUTIONSIN SRI LANKA 20
0947
4.1 Institutional Background
A large number of non-governmental organizations
(NGOs) – national as well as international – and
community-based organisations (CBOs) operate in
Sri Lanka. NGOs are not-for-profit organisations
that provide humanitarian or development aid to
disadvantaged groups, and are operational across
the island, including conflict areas. In recent years, a
significant number of NGOs have become involved in
microfinance activities. This chapter focuses on NGOs
as microfinance providers – as such, the use of the
otherwise broader term NGO should be understood as
referring to NGO Microfinance Institutions (MFIs).
For the purpose of this survey, all identified NGOs with
significant microfinance outreach (i.e. with at least 500
microfinance clients – in the Northern and Eastern
Provinces, this threshold was lowered to a minimum
of 100 microfinance clients) were interviewed. As
a result, the sample includes 83 institutions with
significant microfinance operations. Among these, 69
are national NGOs, 3 are international NGOs, and
11 are institutions with a similar profile to NGOs,
although registered as companies limited by guarantee
(5 of them), limited liability companies (5 of them)
and 1 mutual society. We will, henceforth, refer to all
of the above as NGOs.
All NGOs interviewed were established between 1962
and 2005, and started their microfinance activities in
Sri Lanka between 1984 and 2006. However, only 6
NGOs started microfinance activities before 1990,
while 60 NGOs (72%) interviewed started their
microfinance operations in or after 1995. While four
NGOs provide financial services only, the remaining 79
NGOs offer both financial and non-financial services:
loans (99% of the sample),
savings (89%) and insurance (28%). Other
products such as leasing, pawning or grants are
each offered by only one NGO respectively. Of
the 23 NGOs offering insurance products, 15
4. NGOs
have insurance products of their own and 8 retail
the products of insurance companies.
training and skills
development (95% of the 79 NGOs offering
non-financial services), financial advisory services
(86%), group mobilisation (86%), business
development services (62%) and marketing
assistance (51%). In addition, NGOs provide
a large range of other services such as welfare,
medical, and educational services.
On average, in terms of resources utilized, 73% of
activities of the NGOs in the sample are related to
microfinance. 73 NGOs in the sample declared the
proportion of their microfinance activities to be at least
50%. For 30 of them, this figure is 90% and higher.
The most prevalent definition of microfinance is:
providing loans to low-income groups, to the self-
employed and (small) businesses as capital investments
in order to empower them and/or enhance their lives.
It appears that most NGOs equate microfinance with
microcredit despite the fact that a large number offer
savings facilities, too.
4.2 Ownership and Governance
Ownership 65% of the NGOs in the sample are reported to be
owned by members, 14% of them by the Director
Board and 11% by individuals. Only 5% of the NGOs
are owned by another organisation. With regard to
ownership by the Board of Directors, it is unclear
whether this response reflects the true situation, as it
is possible for some respondents to wrongly attribute
ownership to the body having deciding power.
Regulation and SupervisionVoluntary social service organisations are required to
register under the provisions of the Voluntary Social

48
Service Organisations Act No. 31 of 1980, amended by
Act No. 8 of 1998. The Circular Letter of the Secretary
to the President, dated 26/2/1999, established that
international voluntary social service organisations
and national ones operating with foreign funding,
or in more than one administrative district, have
to register with the National Secretariat for NGOs
under the Ministry of Social Services. Local NGOs
operating in one district only are to register with the
District Secretary, while such organisations operating
in one division only are required to register with the
Divisional Secretary.
On the other hand, not-for-profit organisations can
also be registered under Section 21 of the Companies
Act No. 17 of 1982. With the enactment of the new
Companies Act No. 7 of 2007, companies registered
under the old Act have to re-register with the Registrar
of Companies.
The microfinance activities of NGOs do not, otherwise,
come under specific regulation.
47% of interviewed NGOs state they are registered
with the Ministry of Social Services, 24% claim to
be registered with the Department of Social Welfare
(NGO Secretariat Office) which is a department of the
same Ministry of Social Services, another 24% with
the Registrar of Companies, and 5% with the District
Secretariat Office. Thus, only a minority appears to be
registered under the Companies Act, while most seem
to be registered under the Voluntary Social Service
Organisations Act. In fact, the institutions covered in
this section can be registered under both Acts; therefore,
the figures cited above should be taken with care. The
extent to which such double registration occurs could
not be estimated based on the data available from the
survey.
Audit77% of NGOs interviewed report that their accounts
are audited both internally and externally, while 20%
of the NGOs’ accounts are audited externally only. Of
the 2 remaining NGOs, 1 declared only an internal
audit is performed, while 1 is not audited at all.
87% of NGOs interviewed claimed to carry out
their microfinance activities through a functionally
separate unit. This surprisingly high rate of segregation
of activities should be interpreted with care, since it
is not fully supported by some of the findings of the
survey related to the features of functional separation.
Accounting separation is, for example, a prerequisite
of functional separation. However, only 47% of the
NGOs in the sample reported that microfinance-
specific statements are prepared, and even for these
respondents, it is rather unlikely that there is a well-
defined mechanism in place to attribute common costs
in order to reflect accurate financial information. The
situation is even less encouraging in terms of separation
of employees. Only 28% of the NGOs in the sample
have staff exclusively involved in microfinance
operations, Therefore, it can be assumed that only a
minority of the respondents have indeed functionally
separate microfinance units, but a large majority has
some form of separation of activities, even though
incipient.
Decision Making/Strategic PlanningAll but 1 of the NGOs interviewed declared they
establish business development goals, a business
plan and strategies for achieving the targets set for
their microfinance activities. These goals, plans and
strategies were said to address interest rates, product
design, human resource management, target group and
general policy. 3 NGOs admitted that although goals
are set and plans and strategies developed, they are not
followed in day-to-day operations.
Most NGOs (72%-84%) seem, at a first glance, to
have a rather centralised decision-making approach in
place in matters such as interest rate setting, product
development, and human resource and target group
orientation: business planning is performed at the head
office or parent organisation level and board members
are usually involved. For the remaining NGOs, the
design of business plans and strategies is at branch
level, mostly involving group decisions (management
and staff). Considering the fact that almost half of the
NGOs in the sample (48%) have no branches at all and
operate only at head office level, the puzzling finding,
which hints to centralisation, can be thus explained.
The reference to the head office as a decision-making
body should not be equated with a highly hierarchical
organisation, as a large number of NGOs in the sample

MICROFINANCE INSTITUTIONSIN SRI LANKA 20
0949
are rather small institutions operating only at a regional
level.
The operating policies of NGOs are, in 67% of the
institutions, defined by the Board of Directors and
in 29%, by a management committee. Only 2 of the
43 NGOs with branches allow the management of
individual branches to take such strategic decisions.
This hints to a centralised decision making process
with a high involvement at the level of the Board of
Directors.
4.3 Operations
Branch DistributionAn analysis of the regional and sectoral distribution
of the NGO outlets is found in Table 4-1. We note
that the information provided in this table may slightly
underestimate the total number of microfinance
outlets, since some of the 43 NGOs in the sample with
branches may offer financial services not only through
their branches, but also at the head office level. NGOs
Table 4-1 Regional and sectoral coverage of NGOs
in the sample have an average of 27 outlets, but the
group is highly heterogeneous. In fact, if the outlet
network of SEEDS is excluded, the average drops to
just 8 outlets per institution. 40 of the 83 NGOs in
the sample do not have any branches and operate only
through their head office.
The interviewed NGOs maintain 2,993 outlets and
cover all nine provinces of Sri Lanka (in the Northern
Province, the districts of Kilinochchi and Mullaittivu
are not covered by any of the NGOs in the sample).
Of the outlets for which the sectoral distribution was
available, 26.3% are located in the urban sector, 72.4%
in the rural sector and 1.3% in the estate sector.
The province with the largest NGO presence is the
Southern Province, which accounts for 19.3% of all
outlets of this group, followed by the Western and
Central Provinces with 13.9% and 13.1% respectively.
37% of all branches are located in the Northern,
Eastern and Southern Provinces – i.e. in those regions
mostly affected by the tsunami of 2004. 17.6% of the
branches are in the Northern and Eastern Provinces.
Note *The sectoral breakdown was not available for 2,315 active societies and 26 service centres attached to SEEDS, therefore the sum of the sector total figures does not match the total number of branches. The percentages in brackets regarding the sectoral distribution of outlets were calculated based on the outlets for which this breakdown was available.
**The source for population per province is the Census of Population and Housing, Department of Census and Statistics – Sri Lanka, 2001. For the Northern and Eastern Provinces, 2001 estimates from the Department of Census and Statistics were used.
Province
Branches Sector* (No. of Branches)
No. % Urban Rural Estate
Population Density per Branch
(Population/No. of Branches)**
416
392
577
270
382
203
225
159
369
2,993
Western
Central
Southern
North Western
North Central
Uva
Sabaragamuwa
Northern
Eastern
Total
13.9
13.1
19.3
9.0
12.8
6.8
7.5
5.3
12.3
100.0
21 (42.9%)
11 (35.5%)
39 (22.0%)
11 (44.0%)
4 (16.0%)
6 (26.1%)
7 (33.3%)
6 (7.9%)
64 (29.8%)
169 (26.3 %)
23 (46.9%)
18 (58.1%)
138 (78.0%)
14 (56.0%)
21 (84.0%)
16 (7.0%)
14 (66.7%)
70 (92.1%)
151 (70.2%)
465 (72.4%)
5 (10.2%)
2 (6.5%)
1 (4.3%)
8 (1.3%)
12,935
6,184
3,948
8,037
2,892
5,800
8,006
6,547
3,847
6,280
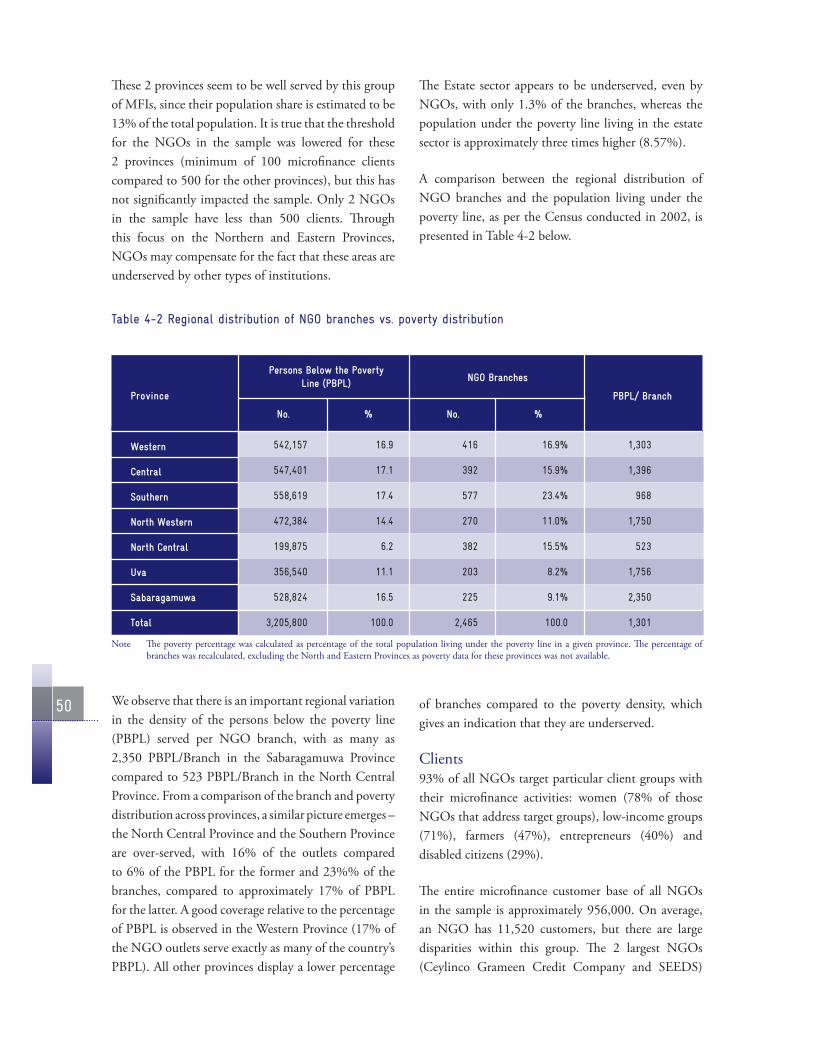
50
These 2 provinces seem to be well served by this group
of MFIs, since their population share is estimated to be
13% of the total population. It is true that the threshold
for the NGOs in the sample was lowered for these
2 provinces (minimum of 100 microfinance clients
compared to 500 for the other provinces), but this has
not significantly impacted the sample. Only 2 NGOs
in the sample have less than 500 clients. Through
this focus on the Northern and Eastern Provinces,
NGOs may compensate for the fact that these areas are
underserved by other types of institutions.
The Estate sector appears to be underserved, even by
NGOs, with only 1.3% of the branches, whereas the
population under the poverty line living in the estate
sector is approximately three times higher (8.57%).
A comparison between the regional distribution of
NGO branches and the population living under the
poverty line, as per the Census conducted in 2002, is
presented in Table 4-2 below.
Table 4-2 Regional distribution of NGO branches vs. poverty distribution
Province
Persons Below the PovertyLine (PBPL) NGO Branches
No. % No. %
416
392
577
270
382
203
225
2,465
16.9%
15.9%
23.4%
11.0%
15.5%
8.2%
9.1%
100.0
542,157
547,401
558,619
472,384
199,875
356,540
528,824
3,205,800
16.9
17.1
17.4
14.4
6.2
11.1
16.5
100.0
1,303
1,396
968
1,750
523
1,756
2,350
1,301
PBPL/ Branch
Western
Central
Southern
North Western
North Central
Uva
Sabaragamuwa
Total
Note The poverty percentage was calculated as percentage of the total population living under the poverty line in a given province. The percentage of branches was recalculated, excluding the North and Eastern Provinces as poverty data for these provinces was not available.
We observe that there is an important regional variation
in the density of the persons below the poverty line
(PBPL) served per NGO branch, with as many as
2,350 PBPL/Branch in the Sabaragamuwa Province
compared to 523 PBPL/Branch in the North Central
Province. From a comparison of the branch and poverty
distribution across provinces, a similar picture emerges –
the North Central Province and the Southern Province
are over-served, with 16% of the outlets compared
to 6% of the PBPL for the former and 23%% of the
branches, compared to approximately 17% of PBPL
for the latter. A good coverage relative to the percentage
of PBPL is observed in the Western Province (17% of
the NGO outlets serve exactly as many of the country’s
PBPL). All other provinces display a lower percentage
of branches compared to the poverty density, which
gives an indication that they are underserved.
Clients93% of all NGOs target particular client groups with
their microfinance activities: women (78% of those
NGOs that address target groups), low-income groups
(71%), farmers (47%), entrepreneurs (40%) and
disabled citizens (29%).
The entire microfinance customer base of all NGOs
in the sample is approximately 956,000. On average,
an NGO has 11,520 customers, but there are large
disparities within this group. The 2 largest NGOs
(Ceylinco Grameen Credit Company and SEEDS)

MICROFINANCE INSTITUTIONSIN SRI LANKA 20
0951
account for almost 62% of the total customer base.
Only 11 NGOs in the sample have a customer base
exceeding 10,000. In 73% of the NGOs, female
customers account for over 75% of the clients. Only
1 NGO in the sample has less than 25% female
customers, while 3 NGOs have between 26% and 50%
female customers.
Of the 64 NGOs that provided an income profile of
their customers, 82% of their clients have a monthly
household income of less than Rs. 5,000 and another
13% earn between Rs. 5,000 and Rs. 10,000 a month.
Only 5% of the clients are reported to have a monthly
income of over Rs. 10,000. All these facts speak for a
high depth of outreach, but the data has to be taken with
caution as these are estimates provided by the NGOs,
most of which do not maintain client profile records.
It also has to be noted that the largest institution in the
sample (Ceylinco Grameen Credit Company) has not
provided details on either the income breakdown or
the economic activity of its customers.
On average, 39% of NGO clients are involved in
agriculture, horticulture and cultivation. An additional
20% are involved in fisheries and animal husbandry.
This is consistent with the prevalence of NGO branches
in rural areas. A significant number of clients are
also involved in trading (20.3%) and manufacturing
(11.9%). The structure of the economic activity of
NGO clients reflects the social mission of NGOs to
provide financial services to sectors that are underserved
by traditional financial intermediaries.
Figure 4-1 Monthly income of NGOs clients
Figure 4-2 Economic activity of NGOs clients
Lending MethodologyOn average, 60% of the NGOs interviewed said
that they are engaged in individual lending, 59%
offer group loans and 20% are involved in wholesale
lending. Of the 82 NGOs in the sample that provide
loans, 20 reported that they offer only individual loans
and 19 reported that they are exclusively involved in
group lending, while 8 work only with intermediaries
(CBOs, village societies). The remaining 35 NGOs
offer a mixture of at least 2 of the 3 types of loans.
Identifying Potential ClientsNGOs asserted that they identify potential microfinance
clients through inspection and field visits (93% of all
NGOs), recommendations of reliable current clients
(60%) and opportunities arising out of their non-
financial activities (51%). 16% of the NGOs rely on
recommendation of a third party such as government
officials and institutions, other organisations and
respected people in the locality.
Loan Processing Time and ProcedureThe average processing time for a loan varies from
institution to institution and is between 1 and 90 days.
On average, it takes 19 days to process a loan. In the case
of 1/3rd of the NGOs, loan processing time does not
exceed 7 days. 6% of the NGOs that provide loans have
a processing period of more than 30 days. This should
not necessarily be interpreted as a lack of efficiency on
the part of the NGOs, as the shortage of funds (see the
section on Operational Challenges) can also determine
long waiting times until a loan can be approved. On
the other hand, a very short processing time (e.g. 1 day)
13.3%1.6%3.0% 0.3%
50.4%
31.5%
< 3,000 LKR 10,001 - 20,000 LKR3,000 - 5,000 LKR 20,001 - 40,000 LKR5,001 - 10,000 LKR > 40,000 LKR
20.3%
12.7%7.3%
39.2%
5.2%3.5%11.9%
Agriculture/horticulture/cultivating Manufacturing Fisheries Services TradingAnimal husbandry Others

52
does not necessarily imply a lack of proper evaluation,
since this mostly applies to wholesale lending to CBOs
or village societies whose performance is known and
monitored by the NGOs. As much as 64.6% of the
NGOs that offer loan products do not need more than
15 days to process an application.
The majority of the NGOs in the sample employ a
decentralised and participative loan approval process.
55% of NGOs refer loan applications to a committee at
the branch level; district, regional or national structures
are involved only in 19% of cases. 54% of the NGOs
provide branch managers with loan approval limits
and in 5% of the NGOs in the sample the Board of
Directors can be involved in the approval process.
Loan Portfolio Monitoring and ProvisioningThe majority of the NGOs in the sample (58%) manage
their microfinance operations supported by a mixture
of manual and computerised processes. More than a
3rd manages their operations exclusively on a manual
basis. Only a minority (5%) has fully computerised
operations in place – possible reasons for this could be
the limited scale of operations, i.e. number of clients
and/or the lack of funds for procurement. Only 73%
of NGOs have access to e-mail and 63% to Internet
facilities. This fact, coupled with a language barrier for
some of the NGOs operating locally, has an isolation
effect on many NGOs, leading to a lack of access to
funding and information concerning international best
practices and standards.
Only 51% of the respondents declared they monitor
the quality of their loan portfolio using indicators such
as Portfolio-at-Risk (PaR). Monitoring was reported
to be done by following log books, manual records
and entries (86% of the NGOs who monitor their
loans), based on field visit records filed by field officers
(74%) and computer-generated reports and statements
(71%).
In some NGOs, the lack of computerisation and
standardisation makes monitoring a rather difficult
task. This is evident from the fact that only 38% of
the NGOs with manual operations monitor portfolio
quality compared to 58.3% of NGOs with a mix of
computerised and manual processes. However, this is
not the only limitation. Most NGOs do not seem to
recognise the need to properly monitor their lending
activities, and are likely to lack the necessary skills to
do it. The fact that only 2 of the 4 NGOs with fully-
computerised operations have a monitoring system in
place proves that technology alone is not sufficient and
needs to be combined with awareness and professional
knowledge in order to lead to an improvement of
procedures.
Only 22% of NGOs who declared they monitor
PaR could correctly define it to be the percentage of
overdue loans, even though the range of time differed
considerably (the definitions ranged from loans overdue
by 1 day to over 6 months). Another 17% restricted
the definition either to a specific type of loan (e.g.
agricultural loan) or to a specific event that prevented a
loan from being repaid (death, illness, and disability).
Another 17% provided an age analysis of overdue loans,
while 11% defined PaR as a fixed percentage from the
total outstanding volume of loans. The remaining
33% of the NGOs claiming to monitor PaR provided
different erroneous definitions for this indicator.
With regard to non-performing loans, there are no
common classifications and procedures in place among
NGOs. Over a quarter of the NGOs in the sample
(28%) do not have a classification for NPLs. Another
4% considered a loan to be non-performing only in the
case of client disappearance or death. The remaining
NGOs classify their loan portfolios based on an age
analysis, calculating the months or the number of
instalments overdue, but this is mostly rather vague
and incomplete. The time considered in the age
analysis ranges from 1 day to 3 years. A small group
of NGOs (presumably the larger, more formal ones)
adhere to the minimal classification required by the
Central Bank of Sri Lanka for commercial and licensed
specialised banks. However, we note that this is not
appropriate for microfinance – a stricter classification
should be followed by NGOs involved in microfinance
activities.
41% of NGOs claim to provide for loan losses, while
58% admit that they do not. Of those claiming to
provide for loan losses, only a small number of NGOs
effectively provide for loan losses by calculating
provisioning rates for classified loans. The remaining

MICROFINANCE INSTITUTIONSIN SRI LANKA 20
0953
NGOs apply general provisioning rates to the
outstanding loan portfolio or to revenue.
Defaulting ClientsIn the case of a defaulting client, the interviewed
NGOs exert group or social pressure (84%), resort
to arbitration (53%), freeze savings/deposit accounts
(51%), file legal action (40%), recover the loan from
guarantors (33%) and apply penalties (29%). The
relative unimportance of seizing property (4%) could
be indicative that NGOs’ lending methodology is,
in its tendency, not collateral-based. Contrary to this
consideration, and rather surprisingly, taking legal
action against defaulting borrowers is mentioned by
40% of the respondents. This could be explained by
the fact that NGOs need a court decision in order to
enforce loan recovery through guarantors. However,
in practice, this is expected to be a rather exceptional
measure taken by NGOs, since it is a rather cost-
intensive recovery measure probably reserved for larger
loans.
Operational ChallengesNGOs define their main operational challenges to
be a shortage of funds (77%), delayed repayment of
loans (47%), strong competition (33%), poor local
infrastructure (25%), shortage of staff (25%), low
profits (23%) and a lack of equipment (22%). The
main explanation for the shortage of funds is the fact
that NGOs do not have the legal authorisation to
mobilise savings. We note that delayed repayments
aggravate this shortage of funds. Another explanation
for the shortage of funds could be the fact that donor
support, in particular support received through post-
tsunami rehabilitation projects, is phasing-out in Sri
Lanka.
4.4 Products and Markets
The most important financial products provided by
NGOs are loans (99% of respondents) and savings
and deposit facilities (89%). Other products include
insurance (28%), pawning, and leasing (1% each).
The figures presented in this section should be taken
with care as the largest player in the group (Ceylinco
Grameen Credit Company, which accounts for 42%
of the aggregate client base of the NGOs that were
surveyed) refused to share information on products
and markets.
Product / Service
Number of NGOs Volume
Outstanding
(‘000 Rs.)
No. of
Accounts
Average
outstanding
account
balance
(Rs.) *
Annual
Interest
Rate
(%)
Offer the product/service
Providedinformation
Loans
Insurance
74
82
23
69
77
17
4,106,677
9,876,316
39,630
1,276,683
375,156
53,207
4,321
32,175
1,373
0-19.5
0-36
-
Savings and Deposits
Table 4-3 Microfinance product portfolio of NGOs
Note *The average outstanding account balance is computed using data from NGOs that have provided information on both volume outstanding and number of accounts and, therefore, will differ slightly from the ratio between the total volume outstanding and the number of accounts reported in this table.

54
Loan ProductsWith the exception of Yasiru Mutual Fund Society,
which offers only insurance products, all NGOs in
the sample offer loan products. The average number
of microfinance loan accounts per institution is 4,748,
with a corresponding volume of Rs. 128 million. These
averages hide large discrepancies between institutions.
For example, if SEEDs data is excluded, the average
number of microfinance loan accounts per institution
drops to only 2,510. Another interesting observation
is that, although microfinance is often equalled to
microcredit, in terms of the number of accounts, loans
represent only 22%, while savings make up 3/4ths
of the total number of accounts. Utilization of loan
facilities by NGO clients remains rather limited.
Interest rates are set by 45% of NGOs based on rates
offered by commercial banks. In the case of 33% of
NGOs, they are based on a computation of product
cost. 7% do not charge interest at all. In the remaining
NGOs, interest rates are set either by the parent
organisation, by the Board of Directors, or by the
funding institutions which have provided funding for
specific loan schemes. 65% of NGOs calculate interest
based on the declining loan balance, while 25% apply
the interest rate to the original loan amount (flat rate).
Of the 6 NGOs offering interest-free loans, 2 are
based in Jaffna (Northern Province), 2 in Ampara, 1 in
Batticaloa (Eastern Province) and 1 in Puttalam (North
Western Province). These NGOs serve between 400
and 2,250 clients. 4 of them are involved in Islamic
finance.
When asked about special terms with regard to interest
rates, 56% of the NGOs stated that they do not offer
any special conditions, while 23% apply penalties for
delayed repayment of loans, and 22% offer interest
reduction for early payment. 10% of the NGOs have
special conditions for specific borrower groups or loan
types (low-income, staff, animal husbandry, emergency,
etc).
In the case of 90% of the NGOs, there is a compulsory
savings requirement in order to obtain a loan. 80% of
the NGOs offer minimum loan amounts of Rs. 5,000
or less, an indicator that they cater to the needs of the
poor. The median maximum loan amount is Rs. 50,000,
which could be explained by the above-mentioned
shortage of funds NGOs are confronted with and also
by the lower absorption and repayment capacity of the
microfinance clients of NGOs, the majority of whom
are in the Rs. 5,000 or below, monthly income bracket
(see Figure 4-1). The loan repayment period ranges
from 1 to 48 months.
The wide range of interest rates can be explained,
at least partly, by the social mission of NGOs. 7%
of the NGOs provide interest-free loans. Another
21% charge less than 15% per annum for all their
loans, while 16% offer a range of interest rates that
includes both subsidised and commercial rates. 52%
of the NGOs charge interest rates of 15% or more.
Regional disparities could also be observed based on
the data provided – on average, the lowest interest rates
are charged in the Sabaragamuwa (10%), Northern
(10.5%) and Eastern Provinces (11.6%). Only in three
provinces are the average interest rates higher than
15%: Southern (15.63%), Western (15.69%) and Uva
(21.58%).
Formal Lending RequirementsNGOs estimate that, on average, 4% of loan applications
received are rejected, but there are significant disparities
within the group. While 40% of the NGOs state that
no applications are rejected, 6% of the NGOs have
a higher rejection rate of between 25% and 45% of
applications received. The high percentage of rejection
might be motivated by the lack of available funds.
Differences in the screening process of applications, too,
may explain the large disparities within the group.
The most important lending requirements are: having
a group of guarantors (92%), being a shareholder/
member (82%), maintaining a minimum deposit or
bank balance (75%), showing proof of having income
sources (55%) and of established residency (40%).
Other requirements include, in order of importance:
meeting age and gender criteria, purchasing an
insurance cover and having a group leader or third party
recommendation. Only 8% of the NGOs mentioned
collateral as a requirement to obtain a loan.

MICROFINANCE INSTITUTIONSIN SRI LANKA 20
0955
Savings ProductsSavings and deposit products are offered by 74 of the 83
NGOs in the sample. This is rather surprising as NGOs
are not allowed, under the current legal framework, to
mobilise savings. Despite this fact, the total number
of savings accounts for the 69 NGOs that provided
this information was 6 times larger than that of loan
accounts. At the same time, the volume outstanding
was less than half for savings compared to loans. A
possible explanation for this is that 65% of the NGOs
in the sample are member-owned organisations and
savings and deposits are collected under the legal form
of shares. On the other hand, low savings volumes may
hint to a combination of the legal obstacles preventing
NGOs from taking deposits with clients keeping only
the minimum required balance with the NGO but
preferring more formal institutions to place the bulk
of their savings, and a lack of capacity of NGO clients
to save due to their very low household income (see
Section 4-3 above).
An NGO has an average of 17,000 savings/deposit
accounts and a respective outstanding volume of Rs.
52.8 million, but these averages are highly distorted
by the large players within the group. SEEDS, alone,
accounts for 75% of the total number of savings
accounts and 82% of the volume outstanding. If
SEEDS is excluded, the institutional average drops
to 4,252 accounts and a corresponding outstanding
volume of Rs. 9.9 million per NGO.
Interest rates offered for savings and deposits range
from 0% to 19.5% per annum. 6 NGOs do not pay
any interest on savings mobilised, while 2/3rds of the
NGOs offering this service do not offer more than
10% per annum on savings and deposits. In the current
high-inflation environment, depositors are, therefore,
receiving a negative return on their deposits. Asked
on the methodology used to set interest rates, 66% of
the NGOs offering the service base their decision on
commercial bank rates. The province with the lowest
average interest rate for savings and deposits is the
Northern Province (4.83%), followed by the North
Western (5.58%) and Eastern Provinces (5.7%). The 6
NGOs in the sample which are not paying interest on
savings and deposits are from these 3 provinces (4 from
the Eastern Province and 1 each from the remaining
2). Clients of NGOs in the Uva and Sabaragamuwa
Provinces have, on average, received the highest interest
rates for their savings and deposits (8.92% and 8.25%,
respectively).
NGOs require a low minimum amount to open a
savings account, starting with Rs. 5. Of the NGOs
offering savings products, 82% accept Rs. 100 or less
to open a savings account, while only 8% require more
than Rs. 500. All NGOs in the sample offering savings
facilities require only 1 day to open an account.
Other Products23 of the NGOs in the sample claim to provide
insurance services. 15 of them offer their own products
while 8 retail products of insurance companies. It should
be mentioned that the former is not permitted by law
although some institutions are following this practice.
On average, each of the 17 NGOs that provided
product information holds 3,130 accounts, with a
corresponding volume outstanding of approximately
Rs. 2.3 million. Pawning, leasing and other financial
products and services do not seem to play an important
role in this sector, with each of these products offered
by only 1 institution.
Delivery of Products and Marketing StrategiesProducts and services are directly delivered through
branches or the head office (61%), field officers (43%)
and through CBOs and village societies (40%).
88% of the NGOs in the sample declare that for
marketing purposes, they rely on promotion by members,
while 42% of them use the non-financial activities of
the organisation to market their microfinance business.
36% of the NGOs promote their activities through
joint programs with other institutions, 31% of them
market their products through the distribution of
brochures and leaflets and 30% of them involve their
field staff in doorstep marketing.
NGOs seem to apply a cost-effective marketing
approach, utilising the capacities available and refraining
from cost-intensive measures such as media advertising.
This approach could be explained not only by resource
constraints but also by the local and regional nature of
operations of most NGOs in the sample, which makes
widespread media advertising unnecessary.

56
Product DevelopmentWith regard to the development of new microfinance
products, NGOs exercise some degree of decentralisation.
Even though in most cases it is handled at the central
level, inputs are collected from branches (64%). A
significant number of NGOs report that product
development is performed at branch level either by the
manager (19%) or by an internal team (13%). This
is in line with the rather flat governance structures
of NGO MFIs. 33% of the NGOs in the sample
declared that they base product development decisions
on a formal market survey and 10% said they hire an
external consultant. However, the majority report that
their microfinance products and services are developed
based on discussions with customers (78%) and field
officer and employee experience (77%). Interestingly, it
appears that in their approach to product development,
NGOs are not noticeably inspired by competitor
offerings (only 27% of the NGOs).
83% of NGOs expect to introduce or develop new
microfinance products and services in the near future.
The list of envisaged new products is headed by loans
(83%), savings (49%) and insurance (17%). Very
few NGOs seem to consider expanding their current
scope of services. Between 1% and 7% of the NGOs
mentioned other products such as fixed-term deposits,
leasing, pension products, pawning and money transfer
services. This hints to a lack of dynamism within this
group of institutions, possibly due to the operational
constraints mentioned earlier (e.g. shortage of funds,
competent staff, and equipment). It could also be due
to legal constraints (e.g. money transfer services). It is
interesting to note that during the last 2 years, 40% of
NGOs have not introduced any new products. 1/3rd
of the NGOs in the sample have introduced either 1 or
2 products. The high number of products introduced
by the rest of the respondents (up to 16 new products)
reflects a tendency of proliferation of loan and savings
products.
4.5 Human Resources
Table 4-4 provides an overview of NGOs’ microfinance
staff. Total staff employed by NGOs in the sample
ranges from 5 to 2,300 staff, with a total of 8,856
employees for all 83 respondents. This results in an
average of 107 staff per NGO. However, it should be
noted that this average is distorted by the few large
players in the group. 82% of all NGO staff is reported
to be involved in the microfinance business, which gives
an average of approximately 11 microfinance staff per
branch. Only 28% of NGOs interviewed declared that
the reported microfinance staff is exclusively involved
in microfinance activities so the degree of specialization
of staff is quite low.
An overview of staff structure and minimum
qualifications required for each staff category is provided
in the following table.
Table 4-4 Microfinance staff complement of NGOs
Total
Staff Managerial
Credit/Field
Officer Clerical
Others/
Support
Staff
1,527 (21%)7,273 3,418 (47%) 1,164 (16%) 1,164 (16%)
n/a
Absolute Number (%)
Microfinance
A/L passed (48%)/Tertiary
education (41%)
Minimum Qualification Required
A/L (48%) or O/L (30%)
passed
A/L (54%) or O/L (18%)
passed

MICROFINANCE INSTITUTIONSIN SRI LANKA 20
0957
It is interesting to note that the minimum job
qualification for clerical staff is slightly higher than for
credit/field officer positions.
With regard to the type of employment, 63% of the
microfinance staff employed by NGOs are permanent
workers and 21% are long-term contract workers (more
than 1 year), followed by volunteer workers (11%).
Recruitment ChallengesNGOs mentioned similar difficulties in recruiting
suitable staff in all categories – key issues are the lack of
skilled personnel (39%-53%), attractive remuneration
packages offered by competitors (27%-41%) and the
lack of personnel with microfinance experience (28%-
36%).
Staff RetentionThe most important retention issues related to
microfinance staff of NGOs are, in order of significance:
inadequate remuneration (64%), the difficult nature of
field operations (41%), inadequate incentives (40%),
lack of technology (30%) and the overload of work
(23%). The issues mentioned above are in line with
the operational and recruitment challenges mentioned
previously.
Incentives NGOs interviewed said they offer the following incentive
elements: staff training (81%), moral incentives (59%),
remuneration incentives, and performance appraisals,
rewards, awards and promotions (53%) and other
subsidies (transportation, funeral assistance, work
uniforms).
Training seems to be the most important incentive
offered. Training is related to the specific tasks of the
position such as HR development (81%), project
management (80%) and business planning (67%) for
managerial staff; record keeping (58%) and accounting
(52%) for clerical staff; and customer care (67%),
group mobilisation (59%), HR development (54%) or
credit evaluation (47%) for credit and field officers.
On the number of training opportunities received,
managers of NGOs participate, on average, in 6 training
sessions a year, clerical staff in 4, and support staff in 3.
Credit and field officers seem to have benefited from the
most training opportunities (the institutional average is
7 sessions a year).
4.6 Financial Performance
In the process of this survey, 43 out of 83 NGOs
submitted financial data, but only 29 could provide
microfinance-specific statements. Due to high
inaccuracy and/or incomplete data provided, the
financial statements of 5 of the 29 NGOs were
excluded from our analysis. In the process of gathering
and analysing data on the financial performance of the
NGOs, several difficulties were encountered. With the
hope that all key stakeholders of the sector are made
aware of the issues, and address them, we briefly discuss
the main issues below:
– while this is an overall
issue for Sri Lanka’s microfinance sector, the level
of response regarding financial performance is
particularly low for NGOs. However, it has to
be mentioned that the willingness to provide
information increased in the second round
of interviews conducted in November 2007
compared to the previous round held a year
before.
– the time period for which
data was submitted was 2003-2007. Only 23 of the
43 NGOs that submitted financial information
provided both the balance sheet and income
statement for the most recent 2 years (2006-
2007 and 2005-2006, depending on the end
of their fiscal year). Another 6 NGOs provided
information for 2005 and 2004. The remaining
NGOs either provided information for only 1
year or provided incomplete information (only
the balance sheet or the income statement). The
fact that NGOs are not regulated and supervised
and therefore, not required to submit financial
information within a set timeframe, means that
NGOs do not have the incentives to prepare these
statements on time.
year) – 8 NGOs had a financial year ending in
March, while the remaining 16 NGOs had their

58
reporting period end in December, with the
calendar year.
– for some institutions, the
quality of the statements was very poor, with
wrong classifications and serious mistakes.
– several NGOs
in the sample were not audited and some of the
remaining were audited by audit firms whose
credentials are unknown, resulting in a poor
quality of audit reports.
The above shortcomings make it impossible to present
a representative picture of the financial performance
of NGOs. Therefore, only a few tendencies can be
sketched here.
The view of NGO profitability is rather mixed. 13
of the 24 NGOs reported losses from operations in
the last financial year available. When non-operating
income was included, this figure decreased to 9. For
surplus-making NGOs, ROA ranges from 0.42% to
8.24%, while ROE takes values between 0.96% and
5.80%. As many NGOs benefit from donor funding or
other subsidies, it is difficult to assess the true financial
sustainability of this group of institutions. Based on the
available information, no subsidy-adjusted indicators
could be computed. Moreover, if the 2-digit inflation
rates in 2006 and 2007 (13.7% in 2006 and 17.5% in
2007, CCPI annual average change18) are considered,
the picture becomes even gloomier.
NGOs have a diverse financial activity profile –
their lending activity ratio varies from 18% to 91%.
However, only 17% of the NGOs in the sample have
lending activity ratios lower than 50%, which hints to
lending being the main activity for most of the NGOs
in the sample. Almost 1/3rd of the NGOs in the sample
have a lending activity ratio of over 75%.
Only a few NGOs finance their lending businesses
predominantly from savings and deposits. This is
a natural consequence of the fact that NGOs are
not legally allowed to mobilise deposits. Debt from
subsidised or programme-funding schemes plays an
18 Central Bank of Sri Lanka, Monthly Bulletin, January 2008, p. 14.
important role for most NGOs, while commercial
debt, both short- and long-term, remains limited. For
50% of the NGOs in the sample, equity was at least
partly donated. Considering this, for a majority of the
NGOs, the cost of funds is quite low (approximately
50% of the NGOs in the sample have a cost of funds
not exceeding 3%). The lending rate of the 24 NGOs
that provided financial data is between 6% and 27%
per annum, but 14 of the 24 are lending at 18% per
annum or more.
Of the 24 NGOs in the sample, only 8 NGOs maintain
a loan loss reserve.
The NGOs were also questioned regarding the
appropriation of earned surpluses between branches
and head office/ parent organisation. Of the 83 NGOs
in the overall sample, 7 stated that they do not have
surpluses, nor do they have an agreed methodology
for appropriation in the event they were to have
surpluses. For the majority of NGOs (72%), surpluses
remain at the level where they were generated (46% of
NGOs operate only from the head office, while 26%
deliberately chose to leave the surplus with the branches
where it is created). This is an important incentive for
branches to generate surpluses, as they directly benefit
from these. In 18% of the cases, the surplus is wholly-
transferred to the head office, while only 1 NGO
reported that the surplus is shared between head office/
parent organisation and branches.
With regard to the use of the surplus, on average, 78%
of earned surpluses are claimed to be invested back
into the microfinance business of the NGOs. This can
be interpreted as indicative of a long-term interest by
most NGOs in their microfinance business. 15% is
used to support other social welfare activities of the
institution while a small portion (7%) is distributed to
the members or shareholders.
Concluding this section, we note that there is a vital
need for standardisation and improvement in the
accounting standards and practices of NGO MFIs if
their long-term viability is to be assured. The regulation
and supervision of this sector would stimulate NGOs
to strive for greater professionalism.

Regional Development
Banks


MICROFINANCE INSTITUTIONSIN SRI LANKA 20
0961
5.1 Institutional Background
Commencing in 1985, the Government of Sri Lanka
established 17 Regional Rural Development Banks
(RRDBs) through an Act of Parliament. Financed
entirely by the Government, these institutions were
given the task of reaching remote rural areas and
smallholders without access to financial services from
commercial banks. The RRDBs covered all districts of
Sri Lanka with the exception of the North and East.
However, their success was limited by internal structural
weaknesses and excessive geographical fragmentation,
which prevented them from reaching a critical mass.
In addition, the banks lacked sound lending and
monitoring policies, and operations were difficult to
improve and standardise. A significant restructuring
and recapitalisation took place in 1998-1999 and
the RRDBs were consolidated into six Regional
Development Banks (RDBs). This involved granting
RDBs more autonomous management, allowing a
broader ownership base, and having Board Members
appointed by shareholders, all with the purpose of
increasing the professionalization of operations and,
thus, their viability and sustainability in the long-
term.19
The Government of Sri Lanka has recently announced
plans to merge all six RDBs into one Development
Bank which would operate nationwide. This would
have the advantage of better capabilities to mitigate
regionally specific risks, but the disadvantage of a less
flexible structure.20 At the time of writing this report,
a final decision was still in the offing.
All six RDBs were interviewed for the purpose of this
survey. All six stated that they started microfinance
activities in the respective year of establishment. While
one RDB (Ruhuna Development Bank) stated that it
provides financial services only, the remaining five offer
both financial and non-financial services:
19 National Microfinance Study of Sri Lanka, 2002 by Gant, de Silva, Atapattu and Durant and Fitch Ratings, Sri Lanka Special Report, Regional Development Banks, November 2006.
20 Fitch Ratings, Sri Lanka, Fitch Maintains Rating Watch on Six Sri Lankan Regional Development Banks, September 2007.
5. Regional Development Banks
All six RDBs offer loans, savings
and pawning facilities. Four RDBs provide short-
term credit and three provide leasing. Two RDBs
offer pension schemes (Ruhuna and Wayamba
Development Banks).
Financial advisory services,
training and skills development are offered by all
five RDBs that offer non-financial services, while
three RDBs also assist in group formation and
provide marketing assistance to their clients.
The respondents estimate RDBs’ microfinance activities
to represent, on average, 86% of their portfolio
of activities (based on the revenue earned), with
variations from 50% (Uva Development Bank) to 95%
(Sabaragamuwa Development Bank). This significant
difference in responses can be better explained by a
difference in understanding of microfinance than by a
significant difference in operations. However, due to
the increased popularity of microfinance, a tendency to
overestimate the percentage of microfinance activities
can be expected, especially in the case of formal
institutions such as the RDBs which have a commission
to reach the lower-income groups.
It is interesting to mention that RDBs do not distinguish
significantly between micro and small enterprises.
When asked to define microfinance and microcredit,
the answers ranged from “providing loans to people
who are unable to access loans from commercial banks”
and “loans under Rs 75,000” to broader definitions
such as “providing loans and accepting deposits” and
“providing loans for small businesses”. The findings of
this chapter, therefore, should be interpreted in light of
this heterogeneous understanding.

62
5.2 Organisational Structure and Governance
Organisational StructureRDBs are confined to specific regions across the country.
With an average of approximately 36 branches per
RDB, the organisational structure is more decentralised
compared to microfinance programs and institutions
which operate nationwide. The organisational structure
of all six RDBs is similar, as this is prescribed through
the Regional Development Banks Act.
OwnershipRDBs are owned by the Government of Sri Lanka either
directly through the Treasury or indirectly through
other Government-owned or managed institutions
such as the Bank of Ceylon, People’s Bank, National
Savings Bank and the Employees Provident Fund. They
are regulated and supervised by the Central Bank of Sri
Lanka (CBSL). In addition to the supervision carried
out by the supervisory department of the CBSL, a
special monitoring department was created within the
CBSL for the RDBs.21
Regulation and SupervisionRDBs are licensed specialised banks governed by the
Regional Development Banks Act No. 6 of 1997.
When interviewed, the respondents seemed to be
better equipped to identify the supervisory authority
than the regulatory one. All RDBs asserted that they are
supervised by the CBSL. When asked about regulation,
two RDBs even stated that they are not regulated at
all. Of the four that declared they were regulated, two
named the CBSL as the regulatory authority while the
remaining two, respectively, identified the Ministry
of Finance and the Government of Sri Lanka. When
asked about the supervisory actions taken by the
CBSL, the respondents mentioned measures such as
inspection/audit of accounts (three RDBs), submitting
operational information on a regular basis (three RDBs)
and representation on the Management Committee or
the Board of Directors (two RDBs).
21 Fitch Ratings, Sri Lanka, Fitch Maintains Rating Watch on Six Sri Lankan Regional Development Banks, September 2007.
AuditAccording to the results of the survey, the accounts of
all RDBs are audited both externally and internally.
RDBs are required by the law to conduct an external
audit. A list of approved auditors is provided by the
CBSL, and the shareholders, at the AGM, select the
external auditor. On the recommendation of the CBSL,
all RDBs are now also internally audited.
Decision making/Strategic planningMost RDBs follow an integrated business approach,
which means that microfinance activities are not
functionally separated from the other activities of the
bank. This is understandable against the backdrop of the
RDBs perception that, on average, over 85% of their
activities are microfinance-related in terms of revenues
earned, thus microfinance is their core business and
the question of a separate unit does not arise. Only
Kandurata Development Bank declared that it has a
specific microfinance unit with its own staff and books
of accounts.
The Board of Directors decides the overall operating
policies of RDBs in five of the six RDBs while a
Management Committee decides the overall operating
policies of the remaining RDB. All RDBs claim to
establish and follow business development goals, a
business plan and strategies for achieving the targets set
for their microfinance activities. These goals, plans and
strategies address interest rates, product design, human
resource management and target group orientation,
and are mostly designed by, and decided at, the top
management level (i.e. a centralised approach). Only
one RDB seems to allow management and staff at the
branch level to decide on product design and target
group orientation.
5.3 Operations
Branch distributionRDBs maintain a total of 215 outlets that offer banking
services to clients. Their distribution, by province and
sector, is presented in table 5-1.

MICROFINANCE INSTITUTIONSIN SRI LANKA 20
0963
Table 5-1 Regional and sectoral coverage of RDBs
RDBs cover seven out of the nine provinces entirely
and the Ampara District in the Eastern Province.
The number of outlets per province varies from seven
(Eastern Province) to 44 (Southern Province). 79.1% of
all RDB outlets are classified as rural and only five (i.e.
2.3%) outlets operate in the estate sector. The average
population served per RDB outlet is approximately
89,000. The population per outlet is significantly lower
Province
Outlets Sector
No. % Urban Rural Estate
Western
Central
Southern
North Western
North Central
Uva
Sabaragamuwa
Northern
Eastern
Total
Population Density per Outlet
(Population/No. of Outlets)*
29
32
44
29
25
20
29
7
215
13.5
14.9
20.5
13.5
11.6
9.3
13.5
3.3
100.0
9 (31.0%)
11 (34.4%)
5 (11.4%)
4 (13.8%)
1 (4.0%)
1 (5.0%)
6 (20.7%)
3 (42.9%)
40 (18.6%)
20 (69.0%)
20 (62.5%)
39 (88.6%)
25 (86.2%)
24 (96.0%)
15 (75.0%)
23 (79.3%)
4 (57.1%)
170 (79.1%)
0
1 (3.1%)
0
0
0
4 (20.0%)
0
0
5 (2.3%)
185,556
75,749
51,779
74,824
44,187
58,868
62,115
252,849
89,058
Table 5-2 Regional distribution of RDB outlets vs. poverty distribution
Province
Persons Below the PovertyLine (PBPL) RDB Outlets
No. % No. %
29
32
44
29
25
20
29
208
13.9
15.4
21.2
13.9
12.0
9.6
13.9
100.0
542,157
547,401
558,619
472,384
199,875
356,540
528,824
3,205,800
16.9
17.1
17.4
14.4
6.2
11.1
16.5
100.0
18,695
17,106
12,696
16,289
7,995
17,827
18,235
15,413
PBPL/ Outlet
Western
Central
Southern
North Western
North Central
Uva
Sabaragamuwa
Total
Note The PBPL percentage represents the percentage of the total population (excluding the Northern and Eastern Provinces) living under the poverty line in a given province. The percentage of RDB outlets was re-calculated due to the unavailability of poverty data for the Northern and Eastern Provinces.
Note *The source for population per province is the Census of Population and Housing, Department of Census and Statistics – Sri Lanka, 2001. For the Eastern Province, 2001 estimates from the Department of Census and Statistics were used.

64
than the average in the North Central, Southern and Uva
Provinces. The highest population density per outlet is
found in the Eastern Province with 252,849 people per
outlet and the Western Province with 185,556 people per
outlet. The high population densities per outlet can be
explained by the lack of presence of RDBs in the Batticaloa
and Trincomalee Districts in the Eastern Province, and, in
the Western Province, due to the focus being on a few
disadvantaged locations within the province.
Table 5.2 compares the regional distribution of RDBs
with that of the population living under the poverty
line in the respective provinces.
We notice that a higher concentration of outlets
relative to the percentage of PBPL can be found in
the Southern and North Central Provinces, which
suggests that these regions are relatively better served
than other regions. On the flipside, the provinces
that are underserved by RDBs relative to the poverty
rates are the Sabaragamuwa, Western, Central and
Uva Provinces. On average, PBPL/Outlet is 15,413.
However, the Sabaragamuwa, Western, Central,
Uva and North Western Provinces have values above
this average, supporting the finding that they are
underserved compared to the other provinces.
ClientsAccording to the respondents, the microfinance client
base of the RDBs is estimated at 1.85 million people.
It has to be noted that the way each RDB defines
microfinance has a significant impact on its definition
of the customer base. Moreover, only one bank collects
data on a client level while the remaining five estimate
their client base based on the number of accounts,
which very likely overstates the number of clients due
to the possibility of multiple accounts.
Five of the RDBs focus on specific target groups. These
are primarily low-income groups (all five RDBs), but
also women, youth, entrepreneurs and farmers (four
of the five RDBs which focus on target groups). Only
one RDB explicitly indicated the ‘rural population’ as
being a target group.
RDBs serve both female and male clients. Females,
however, represent the majority of clients for four of
the six RDBs, with Kandurata Development Bank
having more than 75% female customers. Only two
RDBs (Uva and Rajarata) have more male than female
customers. The income distribution of RDB clients is
given in Figure 5-1. Approximately 38% of all clients
have a monthly household income of no more than Rs.
5,000 and, hence, fall within the RDBs’ target group
definition of low income (the threshold for low income
households, as indicated by RDBs, is, on average, Rs.
4,417 a month). This implies that the remaining 62%
of RDBs’ customers do not fall within the microfinance
definition as provided by the RDBs, and raises the
question as to whether the initial purpose of the RDBs
and the targets stated above are met.
Figure 5-2 illustrates the economic activity that RDBs’
microfinance clients are engaged in. The client portfolio
seems to be reasonably well diversified, with the largest
group of clients involved in agriculture (37.7%),
followed by trading (15.8%) and manufacturing
(14.3%). This large involvement of clients in the
primary sector (agriculture, fisheries and animal
husbandry, represent 49.8% of the economic activities
of microfinance clients of RDBs) is well explained by
the fact that almost 80% of the branches of RDBs are
in the rural sector.
Figure 5-1 Monthly income of RDBs’ microfinance clients
< 3,000 LKR 10,001 - 20,000 LKR3,000 - 5,000 LKR 20,001 - 40,000 LKR5,001 - 10,000 LKR > 40,000 LKR
19.3%
18.3%
24.2%
28.3%
7.5% 2.3%

MICROFINANCE INSTITUTIONSIN SRI LANKA 20
0965
Lending methodologyRDBs declared that they are mainly engaged in
individual lending (90.5% on average, percentages
range from 80% to 97%), while group loans are also
offered (3%-19%, on average 8.8%). In addition, Uva
and Ruhuna Development Banks provide wholesale
loans to other intermediaries on a rather limited scale
(1%-3%, on average under 1%).
Identifying potential clientsRDBs identify potential microfinance clients through
inspection and field visits (all six RDBs), using the
opportunities arising from the non-microfinance
activities carried out (three out of the six RDBs) and
following up recommendations of reliable current
clients (three out of the six RDBs). Sabaragamuwa and
Wayamba Development Banks reported employing an
agency for sourcing potential clients. These “collecting
agencies” mobilise deposits and inform potential clients
about available loan products. The agency is paid a
commission depending on the number of clients they
secure. However, even in the case of these banks, field
officers remain the principal source for identification of
potential clients.
Loan processing time and approval procedureOn average, loans are processed in 26 days. The average
processing time for a loan varies from institution to
institution and is between seven and 60 days; only two
of the six RDBs indicated an average processing time
of less than two weeks. Opening a deposit or savings
account normally takes one day as does obtaining
a pawning facility. The processing time for lease
applications varies from three to seven days.
Figure 5-2 Economic activity of RDBs’ microfinance clients
For all six RDBs, Credit Committees are involved in
the approval process, either for all loans or when loan
approval limits are exceeded. Four of the six RDBs
interviewed have a rather decentralised loan approval
process in place, whereby branch managers have loan
approval powers subject to value limits. In certain cases,
two of the RDBs declared that they involve the Board of
Directors in the loan approval process but this is also likely
to be applicable in the case of loans above a certain value.
Loan monitoring and provisioningAll six RDBs manage their microfinance operations
using a mix of manual and computerised records. This
has an impact on the monitoring measures performed.
All RDBs use computerised statements and records
filed by field officers to track the quality of their loan
portfolio. Log books and manual records and entries
are also used by five of the RDBs in addition to
computerized statements.
While all RDBs declared that they measure Portfolio-at-
Risk (PaR) in relation to their loan portfolio, when asked
to define it, some of the RDBs provided an age analysis
of non-performing loans, or declared the overdue
instalments to be at risk. A proper understanding of
the concept is apparent only in the response of two of
the RDBs. PaR should be based on outstanding debt
and not only the instalments overdue.
Loans are subject to an age analysis and classified as
non-performing (NPL) based on the number of overdue
instalments or months (over three months in arrears).
NPLs are further broken down into four categories:
overdue (between 3 and 6 months), sub-standard
(between 6 and 12 months), doubtful (between 12 and
18 months) and loss (over 18 months).
Loan loss provisions are calculated according to
regulations set by the CBSL, based on age analysis
and the classification of the loan portfolio. Each loan
category carries its individual provisioning rate – 20%
for sub-standard, 50% for doubtful and 100% for loss.
Additionally, a statutory general provision of 1% on
total performing loans and the overdue loans category
net of loans and advances secured by cash deposits, gold
and government securities was introduced in December
2006 – RDBs have three years to progressively reach
the required level of general provision.
Agriculture/horticulture/cultivating Manufacturing Fisheries Services TradingAnimal husbandry Others
2.8%
37.7%8.2%
11.8%
14.3%
15.8%9.3%

66
The classification method and provisioning standards
mentioned above are the minimum prescribed by
CBSL but RDBs could choose to adopt more stringent
standards. The CBSL regulations are common to both
commercial and licensed specialised banks and are
therefore not adapted to the microfinance context.
According to the survey, the RDBs adhere only to the
minimum requirements set by CBSL; therefore, the
loan classification can be considered rather lenient and
the provisioning rates fairly low for microfinance.
Defaulting clientsIn case of a defaulting client, four RDBs claimed to
use social pressure by contacting guarantors or group
members, and freezing the client’s savings/deposit
accounts. If this fails to cover the loan, RDBs seize
mortgaged property and engage in legal action. Three
RDBs reported that they apply penalties and fines on
defaulting clients. It is interesting to note that only one
RDB makes use of arbitration.
Operational challengesRDBs define their main operational challenges, in order
of importance, as: strong competition (four RDBs),
shortage of staff (three RDBs) and delayed repayment
of loans (three RDBs).
5.4 Products and Markets
RDBs have a rather diversified product portfolio that
includes savings/ deposits, loans, pawning, leasing
and pension schemes. The first three types of products
are offered by all RDBs, while the remaining two
are offered by three and two RDBs, respectively. An
overview of the product portfolio in terms of volumes
outstanding, number of accounts and interest rates is
given in Table 5-3.
Table 5-3 Microfinance product portfolio of RDBs
Product / ServiceVolume
Outstanding (‘000 Rs.)
No. of Accounts Average outstanding account balance (Rs.)
Annual Interest Rate (%)
Savings and Deposits
Loans
Pawning
Leasing
Pension Products
13,329,144
9,426,380
4,041,562
86,344
58,271
2,063,988
311,204
485,084
1,282
14,485
6,458
30,290
8,332
67,351
4,023
3-15
6-24
14-20
12-16
7.5-10
Loan productsEach RDB has, on average, 52,000 microfinance loan
accounts with an average volume outstanding of Rs.
1.6 billion. Interest rates are set by four of the RDBs at
a rate that maintains a desired margin above the deposit
rate. In the remaining two RDBs, rates are set based on
Central Bank rates and on the rules and regulations
of funding agencies where specific loan schemes are
involved. Interest rates for loans are calculated on
a declining balance basis. Two RDBs apply penalty
interest rates for late payments, and three grant interest
rate reductions for early payments. All six RBDs have a
compulsory savings scheme as a condition for obtaining
a loan, and five charge service fees for processing the
loan. The minimum repayment period ranges from 1
to 6 months and the maximum period ranges from 36
to 60 months.

MICROFINANCE INSTITUTIONSIN SRI LANKA 20
0967
Lending conditionsRDBs report that, on average, 4.5% of loan applications
received are rejected. This could, however, be the
result of strict pre-selection procedures – as such, few
applications, once received, are rejected. This should
not be interpreted as easy access to credit. All RDBs
require loan applicants to present proof of established
residency and to have guarantors. Five RDBs require
proof of income sources, while four RDBs require
collateral and maintenance of a minimum deposit or
bank balance. The foregoing display RDBs’ tendency
to hedge risk related to lending; four out of the five
formal requirements mentioned are directly related to
securing the loan. Although not all RDBs require all
the collateral measures presented here, there is a risk
that loans are over-collateralised to the detriment of the
borrower.
Savings and depositsOn average, one RDB has 344,000 savings/deposit
accounts and a corresponding volume outstanding
of Rs. 2.2 billion. There are significant differences
between the RDBs, but it is not clear how much of these
differences reflect differences in the size and operations
of the banks and how much are due to a heterogeneous
understanding of microfinance. RDBs have, however,
classified the most important part of their total savings
and deposits portfolio as microfinance. Considering
the average outstanding balance per account of slightly
below Rs. 6,500, this seems realistic. An account can
be opened with as little as Rs. 10 in two RDBs and
with amounts varying between Rs. 100 and 500 in the
remaining RDBs.
Other productsPawning facilities are offered by all RDBs at an interest
rate ranging from 14% to 20% per annum. On
average, each institution has 80,850 pawning accounts
with a corresponding average volume outstanding of
Rs. 674 million. Four of the RDBs have no minimum
limits on the amount which may be obtained through
pawning; another RDB has a minimum limit of Rs.
500, and the remaining has a Rs. 12,000 minimum
value. Three RDBs have no explicit upper limit for
pawning, while the remaining three have limits between
Rs. 18,000 and 50,000. This explains the rather low
average outstanding balance for pawning of Rs. 8,332.
It is interesting to notice that for the RDBs, the total
number of pawning accounts is larger than the number
of loan accounts. This implies that the RDBs provide
more for the emergency cash needs of customers rather
than for income generating activities.
Leasing is a rather small product line for RDBs. Leasing
is mostly offered for small businesses for the purchase
of vehicles and equipment. Three of the six RDBs are
involved in leasing – the average number of accounts
per institution is 427, which is rather low. With regards
to volume outstanding, one institution has, on average,
Rs. 28.8 million.
Two RDBs (Wayamba and Ruhuna) offer a pension
product, but only Wayamba has a significant portfolio
(14,358 accounts and Rs. 57 million volume
outstanding). Since Ruhuna’s scheme has only 127
accounts, we restrict our comments to the former. The
minimum value of Rs. 100 required to participate in
the scheme makes it well adapted to the microfinance
segment. With an average outstanding account balance
of approximately Rs. 4,000, this is clearly a microfinance
product.
Delivery of products and marketing strategiesProducts and services are mainly directly delivered
through RDBs branches. In addition, two RDBs use
links with other institutions as well as field officers to
deliver their microfinance products.
RDBs utilise an array of direct and indirect marketing
instruments including printed material such as
leaflets, banners and posters (all RDBs) and doorstep
marketing (five RDBs). Advertisements in newspapers,
magazines or newsletters and joint programmes with
other institutions are used by three RDBs. Two RDBs
stated that they cross-sell their microfinance products
and services with other bank products. Only one RDB
reported utilising radio and television advertising as a
marketing instrument.
Product developmentNew product development mainly takes place at the
central level, but input from branches is sought. In
the case of one RDB, new products are developed by
the managerial committee alone, while in the case of

68
another, it takes place at the individual branch level
under the responsibility of an internal team.
Microfinance products and services are developed
based on the experience of field officers and employees
(all RDBs). In addition to this, four RDBs look into
products offered by competitors and three RDBs have
discussions with customers to identify their needs.
Three RDBs also reported that they base their product
development on a formal market survey.
During the last two years, on average, four new products
were introduced per RDB (the range is from one to eight
new products) while no product was withdrawn. Five
out of the six RDBs intend to introduce new products,
mainly loan and saving products. This indicates a
tendency to proliferate products within the traditional
range instead of introducing new, non-conventional
products.
5.5 Human Resources
The collective staff strength of the RDBs is 1,926
but there are quite wide variations across the
individual banks. The largest RDB in terms of staff,
Ruhuna Development Bank, employs 435. Rajarata
Development Bank, the smallest RDB in terms of
staff, has only a little over a third of the staff of Ruhuna
Development Bank. On average, the RDBs employ
approximately nine staff per branch. It has to be noted
also that two of the RDBs (Wayamba and Rajarata) have
a large number of trainees (307 and 52, respectively)
who have been excluded from the total staff figures
considered in this report. These trainees are school
leavers who join the RDBs to obtain work experience
until they start university. Despite their large number,
due to the short period that they are with the bank and
their lack of qualifications, they were not considered to
be playing an important role in the operations of the
two banks.
Out of the total staff employed by the RDBs, 80%
(1,554 staff members) is stated to be involved in
the microfinance business, resulting in an average of
approximately seven microfinance staff per RDB branch.
The actual number of staff involved in microfinance
ranges from 36 to 435. This wide range can also be
explained by the heterogeneous understanding of
microfinance among RDBs and by the differences in
the organisation of microfinance operations. Only
Kandurata Development Bank stated that microfinance
staff were exclusively involved in microfinance activities
– the remaining RDBs use their microfinance staff for
other activities as well.
Regarding the composition of the microfinance staff
employed, a breakdown is provided in table 5-4
together with the minimum qualifications required for
employment. With regards to the experience required
to fill the respective positions, 67% of the RDBs
reported that experience is not a must for recruitment,
while the remaining 33% considered it essential. 94%
of the RDB staff are permanent, while 6% are time-
bound contract staff.
Staff productivity1,414 microfinance staff (support staff were excluded for
the purpose of computing productivity) handle a total
of 2,876,043 microfinance accounts, resulting in staff
productivity of 2,034 accounts per staff member. Due
to the lack of a clear separation between microfinance
Table 5-4 Microfinance staff complement of RDBs
Total
Microfinance
Staff
Managerial ClericalOthers/
Support
Staff
1,554 329 (21%) 650 (42%)
435 (28%)
140 (9%)
Minimum
Absolute Number %
Qualification
Required
Graduate (67%)/A/L passed (17%)
A/L passed (67%)/O/L
passed (17%)
A/L passed (67%)/O/L
passed (17%)
Credit/Field
Officer
-

MICROFINANCE INSTITUTIONSIN SRI LANKA 20
0969
activities and the other operations of the RDBs, it is
difficult to assert how well this measure reflects the real
staff productivity within this group of institutions.
Recruitment challengesTwo of the RDBs (Ruhuna and Kandurata) did not
report any difficulties in recruiting staff. For all levels
of staff, the remaining four RDBs mentioned similar
difficulties in recruiting suitable staff for microfinance
operations. Interference, nepotism and political
issues, as well as the absence of a pension system, were
mentioned by two RDBs. The lack of skilled people
and people with microfinance experience were cited
by one RDB. In addition, the unattractive locations
and the fact that microfinance is not considered an
attractive career option were reported.
Staff retentionThe most important retention issue mentioned was
the difficult nature of field operations. Other issues
mentioned were inadequate incentives, the turnover of
highly qualified staff and the fact that microfinance is
not considered an attractive career option. Once again,
Ruhuna and Kandurata Development Banks stated
that they do not have staff retention issues.
Incentives RDBs claim to offer their staff a wide range of
incentives but these incentives appear to be inadequate
in retaining good employees (see section above on staff
retention). All RDBs stated that they offer performance
related rewards, staff training opportunities and
reimbursement of medical costs. Five of the six
RDBs have remunerative incentives and payment of
overtime. Four RDBs provide incentives in the form of
distribution of revenue.
Staff trainingOn average, managerial staff received seven training
courses during 2006, followed by clerical staff (five
training sessions), credit and field officers (five training
sessions) and support staff (three training sessions). All
RDBs reported that they offer training for managers
covering the following areas: project management,
marketing/promotional, costing, business planning,
credit evaluation, risk management and profitability
monitoring. All RDBs offer clerical staff training
on record keeping and five RDBs, on accounting
skills development. For credit and field officers, five
RDBs offer training on group mobilisation, project
management, record keeping, language, accounting
skills development, and credit evaluation. We conclude
that managers undergo a more comprehensive training
than other categories of staff, covering all relevant areas.
Training for credit and field officers is focused on technical
skills (accounting, appraisal) and language skills.
5.6 Financial Performance
Tables 5-5 and 5-6 present the consolidated balance
sheet and income statement of the six RDBs for
2005 and 2006. Financial data presented here reflects
the entire business of RDBs – microfinance specific
financial statements were not available. Given the fact
that the core business of RDBs was classified by the
respondents as microfinance, their overall performance
is briefly discussed below. The reader, should, however,
bear in mind the possible tendency of the respondents
to overstate the share of microfinance operations as
discussed in Section 1, and should thus interpret the
figures in this section with care.
Table 5-5 RDBs-Consolidated Balance Sheet (Rs. ’000)
2006
2005
5,654,921 4,072,089
924,188 719,382
19,549,779 15,868,103
26,128,888 20,659,574
18,750,757
2,256,972 1,956,690
2,887,652 2,480,193
23,895,381 18,657,587
2,233,507 2,001,987
26,128,888 20,659,574
Items
Total Current Assets
Total Non - current Assets
Net Loan Portfolio
Total Assets
14,220,704Total Short - term Deposits
Total Current Liabilities
Total Non - current Liabilities
Total Liabilities
Total Equity
Total Liabilities and Equity

70
Table 5-6 RDBs-Consolidated Income Statement (Rs.‘000)
RDBs’sources of funding are mainly short-term deposits
(78.5% of total liabilities), a pattern that was stable in
recent years (2005: 76.2%). The quantum of short-
term deposits might be slightly overestimated as no
clear age analysis is available for deposits, and are based
on estimates instead. Nevertheless, the major source of
funding for the RDBs is clearly their deposit base –
reliance on debt is relatively low. Funds mobilised are
mainly invested in credit as can be derived from the
lending activity ratio (i.e. gross loan portfolio over total
assets), which was 77.5% in 2006 (2005: 80.1%). This
shows a high level of financial intermediation.
The cost of funds, calculated as the ratio of interest
plus fees on funding liabilities to the average funding
liabilities of that period, was 7.1% in 2006. The lending
rate (interest income from lending to the average gross
loan portfolio) was 19.0% during the same period,
generating a financial spread of 11.9%.
Note * Net income from operations before provision and before tax
Financial performance: In 2006, the return on equity
(ROE) was 14.1%%, while the return on assets (ROA)
was 1.3%. At the end of 2006, RDBs’ loan loss reserves
were at 3.5% (2005: 4.1%) of the gross loan portfolio.
It has to be noted also that in 2006 the net income
of the RDBs represented only 8% of total operating
revenue – the comparable figure for 2005 was 13.5%.
The decline in net income in 2006, despite a 33%
growth in operating revenue is due to a 52% growth
in financial expenses and 43% growth in operating
expenses.
Items 2006
Total Operating Revenue
Total Financial Expenses
Total Operating Expenses
Net Income from Operations*
Net Income
3,731,156 2,809,784
1,359, 184 892,901
1,632,460 1,143,321
739,512 773,562
298,019 380,523
2005
Banks & Other Financial Institutions


MICROFINANCE INSTITUTIONSIN SRI LANKA 20
0973
6.1 Institutional Background
Microfinance has been for a long time regarded as
falling under the competence of social development
driven institutions and as being dependent on public or
donor funds. But with strong competition diminishing
the returns from the traditional business of formal
finance institutions and with the growing evidence
that microfinance can be profitable, new players
have become interested in this sector. While most
microfinance programmes were launched with a social
focus, experience has shown that if managed efficiently,
they could be a profitable venture. Initially, microfinance
programmes were launched in formal financial
institutions either as measures to show corporate social
responsibility, or as part of the obligations imposed by
governments on the financial sector. Only recently, a
global trend of formal institutions stepping into the
microfinance sector could be observed.
In Sri Lanka, the government has traditionally used the
two state-owned commercial banks (Bank of Ceylon
and People’s Bank) as implementing agencies of its
various policies in the fields of agricultural development
and poverty alleviation. These schemes were in the past
characterised by subsidised loans, re-financing and
periodic debt forgiveness. Of the private banks, Hatton
National Bank has had a development focus from
its very beginning, but focused more on large scale
development projects at first and less on the individual
development of the low-income population. With the
emergence of microfinance commercial banks have
oriented their programmes towards the lower income
group and other formal institutions have followed.
At present, a considerable number of traditional financial
institutions (which belong to what is commonly
referred to as the ‘formal financial sector’) have reported
significant operations in the field of microfinance (more
than 500 microfinance clients). But this has to be taken
with caution as it is based on the self-reporting of these
institutions. Since microfinance has become a trendy
concept and is positively perceived by the public, for
some of the institutions in the sample, microfinance
6. Banks and Other Financial Institutions (OFI)
is nothing more than a corporate social responsibility
measure. But it can be hoped that these institutions
discover the potential of this market and become in the
future more committed to the sector.
The formal financial institutions with microfinance
operations were selected for interviews following a
screening process, which included all licensed banks,
finance and insurance companies, according to the
information available from the Central Bank of Sri
Lanka and the Insurance Board of Sri Lanka. A total of
86 institutions were screened (38 banks, 33 leasing and
finance companies and 15 insurance companies). The
purpose was to identify formal financial institutions
engaged in microfinance with a client base of at least
500. The analysis of this chapter refers to the 19
institutions which met the screening criteria. Table 6-1
provides an overview of these institutions.
Table 6-1 Banks & OFIs interviewed
Bank of Ceylon
Peoples
Hatton National Bank
Sampath Bank
Sanasa Development Bank
Ceylinco Savings Bank
Housing Development Finance Company
Asian Finance Limited
LB Finance
Lanka Orix Leasing Company
Trade Finance and Investments Ltd
The Finance Company
Ceylinco Insurance Ltd
Sanasa Insurance
HNB Assurance PLC
Janashakthi Insurance Co. Ltd
Union Assurance PLC
Hayleys AIG Insurance Co. Ltd
Cooperative Insurance Company Ltd
19
Financial institution
Banks
- Commercial Banks
Government owned
Private banks
- Licensed Specialized Banks
Leasing & Finance Companies
Insurance Companies
Total
Bank

74
The banks, finance and insurance companies
interviewed for the purpose of this survey were
established between 1888 (Hatton National Bank) and
2001 (Ceylinco Savings Bank), and they have reported
they started their microfinance activities between 1970
(Bank of Ceylon) and 2006 (Sampath Bank). Banks
seem to have been the first group of formal institutions
entering the microfinance sector – most of the banks
in the sample have started microfinance operations in
the 80s and 90s, only two institutions of this group
(Ceylinco Savings Bank and Sampath Bank) have
started microfinance operations after 2000. According
to the information provided, the first finance company
starting microfinance operations was Trade Finance and
Investment in 1978, followed by Asian Finance in 1996.
The reader should however be aware that these two
institutions have a very broad definition of microfinance
(providing smaller scale financial services), which
differs considerably from the common understanding
of microfinance, which implies an income group
targeting and a poverty alleviation component. Since
the principle of this survey was to let the respondents
provide their own microfinance definitions, the results
of this chapter should be interpreted with care. The
remaining respondents are reported to have entered the
microfinance field in 2000 and after. The last group to
enter the microfinance sector is the group of insurance
companies, with Union Assurance reporting they have
ventured into microinsurance in 1988. But in the case
of this respondent the same comment applies as in
the case of Trade Finance and Investment and Asian
Finance above. The majority of the respondents from
this group (57%) have entered the sector after 2001.
12 out of the 19 financial institutions interviewed
provide financial services only; the remaining seven
provide both financial and non-financial services.
Most banks (86%) provide both financial and non-
financial services, most leasing and finance companies
(80%) offer financial services only, while all insurance
companies focus solely on financial services.
all seven banks offer short term
credit, loans (for specific purposes) and savings
products; pawning is offered by five of them,
leasing is offered by two, while products such
as insurance, share investment schemes, pension
schemes and fee based facilities and guarantees
are each offered by one institution All five finance
companies offer leasing, four of them offer loans
for specific purposes; savings products and hire
purchase facilities are each offered by three of the
respondents, pawning by two, while short term
credit and insurance are each offered by one of the
respondents. All insurance companies offer solely
insurance services to micro and small enterprises
or low income groups.
of the banks providing
nonfinancial services all offer financial advisory
services to their customers, 67% of them provide
training and skills development, 50% group
formation and 33% marketing facilities. Of the
finance companies, only LOLC provides non-
financial services to microfinance customers,
which include financial advisory services and
training and skills development. As a conclusion,
most of the non-financial services offered can be
regarded as “credit plus” services.
As to the extent to which the institutions covered in this
chapter are involved in microfinance operations, the
survey has revealed that for the five banks that provided
information, the average percentage of microfinance
activities was estimated to be 39%, expressed in terms
of the contribution of the microfinance business to
total revenue. This covers a broad range of quoted
Ceylon) at one end to 60% (SANASA Development
Bank) and 85% (Ceylinco Savings Bank) at the other.
On average, 28% of the activities of finance companies
are related to microfinance. This ranges from 5% in
the case of The Finance Company to 95% in the case
of Trade Finance and Investments. Except for the
latter respondent, none of the other respondents has
mentioned values above 15%. For the six insurance
companies which have provided information, an
average of 17% is represented by their micro insurance
activities. This ranges from 0.6% in the case of Hayleys
AIG to 80% in the case of SANASA Insurance and
100% for Cooperative Insurance Company. For half of
the respondents who have provided the information,
microinsurance activities represent less than 5% of
their portfolio. It has to be reminded though that the

MICROFINANCE INSTITUTIONSIN SRI LANKA 20
0975
answers to this question rely on the self evaluation
of each respondent and of their own interpretation
of microfinance, therefore the heterogeneity of the
sample is amplified by the different interpretations of
microfinance. Therefore a closer look at the definitions
provided by the respondents is necessary.
An analysis of the definitions offered for microfinance
products, target group, purpose of the services and
special conditions. In the case of banks, all seven
respondents mention products and target group, while
the remaining two categories are mentioned each by
two of the respondents. Regarding the products, one
of the respondents mentions loans alone, while the
remaining six mention a broader range of financial
services. The target group is defined by four respondents
in terms of income (e.g. lower income group), by three
respondents in terms of the sector of residence (i.e.
the rural sector) and by two respondents in terms of
activities (e.g. entrepreneurs, farmers). The purposes
stated by the two respondents who have mentioned
investment (one respondent) and fulfilment of basic
needs (one respondent). As a conclusion, the definitions
of microfinance given by banks are quite complex,
most of them include a broader range of products and
focus on a clearly defined target group. Compared with
them, the definitions provided by finance companies
are less specific. While all five mention the products
offered, only four of them include a target group (three
respondents mention income, while one refers to the
type of activity, i.e. entrepreneurs), while the purpose
(i.e. investment) and special conditions (a maximum
of Rs. 100,000 for loans) are mentioned each by only
one respondent . Of the six insurance companies who
could define the concept of microinsurance, all of them
mentioned a target group (based on income for five of
them and on the type of activity – i.e. SMEs for one of
them). Half of them have mentioned small premiums
as a characteristic of microinsurance.
When asked to define what they mean by “low
income” (i.e. the monthly income threshold of a
low income household), only three out of the seven
respondents belonging to the group of banks could or
were willing to do so. From the values stated by these
three respondents an average income below Rs. 6,333
qualifies a household to the “low income” status. The
actual values stated ranged between 3,000 (Bank of
Ceylon) and 10,000 (SANASA Development Bank).
All finance companies have provided a threshold, which
on average was as high as Rs. 11,000. The individual
values ranged between 5,000 (The Finance Company)
and 20,000 (Asian Finance). From the insurance
group, only one respondent (Ceylinco Insurance) had
a definition for a low income household – Rs. 3,500,
although almost all of the respondents have mentioned
“low income” as their target group.
The characteristics of microcredit given by the
respondents of the group of banks could be grouped
according to the target group – i.e. loans to the lower
income group (two respondents) or entrepreneurs
(five banks) – and in terms of conditions – i.e. simple
terms and conditions (two banks), small loans (one
bank) and small instalments (one respondent). The
definitions of finance companies included the following
Rs. 250,000 – mentioned by three of the respondents,
entrepreneurs (two respondents) or lower income
households (one finance company) as target groups.
6.2 Organisational Structure and Governance
Organisational StructureThis is a rather heterogeneous group; therefore it is
difficult to comment on the type of organisational
structure of the group. There seems to be a trade-
off between a centralised hierarchical structure and
outreach to the lower income groups. There is a large
degree of standardisation and monitoring, as these are
formal institutions, well organised.
OwnershipWith the exception of the two government-owned
banks (Bank of Ceylon and People’s Bank), established
by dedicated legislation (BOC Ordinance No. 53
of 1938 and People’s Bank Act No. 29 of 1961) all
other institutions are limited liability companies
registered under the Companies Act No. 7 of 2007.
The shareholders of this group of institutions are a
mix of national and international private enterprises

76
(including venture capital funds) and individuals,
the Government of Sri Lanka as well as state-owned
banks and enterprises, SANASA primary societies and
secondary unions, as well as Multi-Purpose Cooperative
Societies (in the case of Sanasa Development Bank).
Some of them are publicly listed companies.
Regulation and SupervisionCommercial and specialized banks are regulated by
the Banking Act No. 30 of 1988 with its consecutive
amendments, while leasing and finance companies
are regulated respectively by the Finance Leasing Act
No. 56 of 2000 and Finance Companies Act No. 79
of 1988 and subsequent amendments. For both types
of institution, the regulatory and supervisory authority
is the Central Bank of Sri Lanka, a situation correctly
identified by most respondents. Insurance companies
are governed by the Regulation of Insurance Industry
authority is the Insurance Board of Sri Lanka.
The respective supervising authority was reported to
information on a regular basis (mentioned by 71%
of the banks, all finance companies and 50% of the
insurance companies), inspection and audit of accounts
insurance companies).
AuditAll banks and insurance companies, and three finance
companies in the sample are audited both internally
and externally. Two finance companies (Asian Finance
and Trade Finance and Investments) rely solely on
external audit and do not have an own internal audit
function.
Decision making / Strategic planningFive banks, three finance companies and three insurance
companies have reported they set microfinance business
development goals and develop annual business plans
and strategies to achieve them. All of them have
indicated that these strategies and plans, once set, are
also put into practice.
Strategic decisions concerning interest rates, product
design, Human Resource Management and target
group orientation are taken centrally at management
level for all types of institutions covered by the survey.
The overall operating policies are decided by the Board
of Directors for six of the banks, four of the finance
companies and two of the insurance companies.
Overall operating policies for insurance companies are
mainly decided by the management committee (four
respondents) or international corporate guidelines are
followed (one respondent).
6.3 Operations
Branch distributionThe microfinance providers presented in this chapter
commercial banks with 921 branches, insurance
with 90 branches. The regional and sectoral breakdown
is presented in Table 6-2. Each institution has on
be observed. For the group of banks the number of
branches ranges from one (Ceylinco Savings Bank) to
zero (Trade Finance and Investments) to 37 (LB
Finance), and for insurance companies from 3 (Hayleys
fully fledged branches, the People’s Bank operates an
are also available through these centres, but the regional
and sectoral distribution could not be provided,
therefore they were not included in table 6-1.
79% of the respondents in this group have indicated
that their microfinance products are available in all of
their branches. According to the information provided
branches, microfinance products are not available in
102 branches of banks and 75 branches of insurance
companies.

MICROFINANCE INSTITUTIONSIN SRI LANKA 20
0977
Table 6-1 Regional and sectoral coverage of Banks and OFIs
Note *The source for population per province is the Census of Population and Housing, Department of Census and Statistics – Sri Lanka, 2001. For the Northern and Eastern Provinces, estimates of the Department of Census and Statistics for the same year (2001) were used.
Province
Branches Sector
No. % Urban Rural Estate
Western
Central
Southern
North Western
North Central
Uva
Sabaragamuwa
Northern
Eastern
Total
Population Density per Branch
(Population / No. of Branches)*
513
155
159
137
97
91
120
64
79
1,415
36.3%
11.0%
11.2%
9.7%
6.9%
6.4%
8.5%
4.5%
5.6%
100%
358 (69.8%)
57 (36.8%)
69 (43.4%)
45 (32.8%)
20 (20.6%)
13 (14.3%)
35 (29.2%)
20 (31.3%)
20 (25.3%)
637 (45.0%)
151 (29.4%)
65 (41.9%)
79 (49.7%)
92 (67.2%)
77 (79.4%)
63 (69.2%)
65 (54.2%)
44 (68.8%)
59 (74.7%)
695 (49.1%)
4 (0.8%)
33 (21.3%)
11 (6.9%)
-
-
15 (16.5%)
20 (16.7%)
-
-
83 (5.9%)
10,490
15,638
14,329
15,839
11,388
12,938
15,011
16,265
17,970
13,284
Banks and other financial institutions are present in
all nine provinces of Sri Lanka. Banks are present in
all districts, including those affected by the conflict.
Finance companies do not have a presence in Mannar,
Mullaittivu and , while insurance companies are not
present in Mullaittivu and . As for the number of
respondents with operations in the Northern Province,
five of the seven banks have a presence there (People’s
Bank, Bank of Ceylon, HNB, Sampath and SANASA
Development Bank), compared to only one of the
five finance companies (The Finance Company) with
presence in the Northern Provinces. As for insurance
companies, with the exception of Hayleys AIG and
SANASA Insurance, all other respondents have
operations in the Northern Province. The number of
Province to 513 in the Western Province. The presence
of outlets of banks and other financial institutions is
clearly concentrated in the Western Province, where
36.3% of the outlets are located, compared to 29% of
the population living there.
The average population served per branch ranges from
17,970 in the Eastern Province. The average lies at
As for the sectoral breakdown, branches are almost
equally divided between the rural and the urban
found in the estate sector. But this distribution varies
considerably between the provinces. The proportion of
branches in the urban sector ranges from 69.8% in the
estate sector accounts between 16.5% and 21.3% of
branches in Uva, Sabaragamuwa and Central provinces,
while in the Western Province it represents 0.8% of the
outlets.
An analysis of the sectoral breakdown differentiated
by the subgroups of the sample (banks, finance and
majority of the bank
outlets), followed closely by the number of outlets in
urban areas (367 outlets), the remaining 77 outlets
being situated in the estate sector. Finance companies

78
only a modest presence in the rural sector (26 outlets).
None of them has a presence in the estate sector. The
outlets of insurance companies are almost equally
located in the urban and rural areas, with a minor
Table 6-2 Regional distribution of Banks and OFI Branches vs. poverty distribution
and 192 are in the rural sector, while six branches are
located in the estate sector.
Note The poverty percentage was calculated as percentage of the total population living under the poverty line in a given province. The percentage of branches was recalculated, excluding the North and Eastern Provinces as poverty data for these provinces was not available.
Province
Persons Below the PovertyLine (PBPL) Banks & OFI Branches
No. % No. %
513
155
159
137
97
91
120
1,272
40.3
12.2
12.5
10.8
7.6
7.2
9.4
100.0
542,157
547,401
558,619
472,384
199,875
356,540
528,824
3,205,800
16.9
17.1
17.4
14.4
6.2
11.1
16.5
100.0
1,057
3,532
3,513
3,448
2,061
3,918
4,407
2,520
PBPL/ Branch
Western
Central
Southern
North Western
North Central
Uva
Sabaragamuwa
Total
Comparing the regional distribution of branches of
banks, finance and insurance companies with the
poverty distribution across provinces, considerable
disparities can be observed. The Western Province
is by far the best served by this group of institutions
compared to only 17% of the poor. At the other end
of the spectrum, Sabaragamuwa has only 9% of the
outlets, while being the home of 17% of persons below
the poverty line (PBPL). All provinces other than the
Western and North Central Provinces are underserved
compared to their respective shares of PBPL. An
average of 2,520 PBPL are served per branch by this
group of institutions, with values ranging from 1,057
in Sabaragamuwa.
Clients
Not all institutions maintain records concerning the
client base. Microfinance clients are not always separated
from the entire customer base of the institution and in
certain instances the overall client base is not known
and can be only roughly estimated.
Banks have reported a total of 706,600 microfinance
clients. However, this does not include the customers
of People’s Bank, which accounts for a large market
share, especially in terms of savings and pawning (see
section on products and markets). For the six banks
who have reported their customer base, this ranges
from 600 (Sampath Bank, a recent player in the
field of microfinance) to 500,000 clients (SANASA
Development Bank). Finance companies have reported
a total of 85,583 microfinance clients, again with
large variations from 550 (The Finance Company) to
65,033 (LB Finance). For insurance companies, a total
These figures seem to be in line with the data provided
regarding the number of accounts. In the case of banks,
if all savings and pawning clients of the People’s Bank
were included, the overall client base of the group of

MICROFINANCE INSTITUTIONSIN SRI LANKA 20
0979
The People’s Bank has 6.3 million savings accounts,
most of which are considered to belong to the lower
income group, and a large number of pawning accounts,
which could not be exactly estimated). As a conclusion,
the banks have the largest outreach among the three
subgroups presented in this chapter. Considering the
fact that they also have the longest tradition in the
sector, this is not surprising.
A word of caution needs to be added – all figures reflect
the own definitions of microfinance of the institutions
in the sample. In many cases, the definition is broader
than the traditional acceptance of the term, which leads
to an overestimation of the microfinance client base in
the case of these institutions.
In the case of banks, five of the seven respondents
institutions), farmers (four banks), low income groups
(three respondents), while two banks concentrate
on women, youth and the disabled. One of the
respondents, People’s Bank, focuses on estate workers,
which is also evident by the large number of branches
in this sector. Of the five finance companies, four of
target women, entrepreneurs and low income groups,
while youth, farmers or three-wheel drivers are each
chosen as target groups by one respondent. Only two of
the seven insurance companies focus on target groups
women and entrepreneurs for the first respondent and
low income groups and farmers for the latter.
The traditional customers of the formal financial sector
are men, a situation which is also true of the microfinance
customers of most institutions in the sample. Five of
the seven banks in the sample have more male than
female microfinance customers. In the case of HNB
the percentage of female customers is even lower than
25%. Only People’s Bank has reported more than 75%
female clients among their microfinance customer base.
All four finance companies which offered information
regarding the gender composition of their customer base
(Asian Finance could not provide such information)
have more male microfinance customers than female.
For The Finance Company the percentage of female
microfinance customers is lower than 25%. Of the
insurance companies Janashakthi and Union Assurance
could not provide information on the gender structure
of their microfinance clients. One respondent, Hayleys
AIG, has reported a percentage of between 50% and
75% of the served clients are women. This is, in fact, the
direct consequence of operating their microinsurance
scheme through an NGO-MFI (Sewa Finance). The
remaining four insurance companies estimate their
female customer base to be between 25% and 50%.
Five of the seven banks (with the exception of BOC
and Sampath Bank), all five finance companies in the
sample and four of the seven insurance companies
(with the exception of Union Assurance, Cooperative
Insurance and Janashatkhi) have provided information
regarding the income structure of their microfinance
clients. Only 28% of the microfinance customers of all
three groups have a household income of Rs. 5,000 or
less. This share is lower for finance companies (19%)
and banks (23%) and higher for insurance companies
companies have a monthly income between Rs. 5,000
and Rs. 20,000. As much as 39% of the microfinance
clients of the banks have a monthly income of more
than Rs. 20,000. The share of this income group is
lower for insurance companies (25%) and finance
companies (11%). We can therefore notice that a
significant proportion of their clients are well above
the low-income threshold as defined by the same
respondents.

80
Five of the seven banks (with the exception of Bank of
Ceylon and Sampath Bank), all five finance companies
and only two of the insurance companies (SANASA
Insurance and Hayleys AIG) have offered information
regarding the economic activity profile of their
microfinance clients. Due to the low response rate in
the case of insurance companies, only the data for the
banks and finance companies has been aggregated and
presented in Figure 6-2 below.
Figure 6-1 Monthly income of microfinance clients of Banks & OFIs
Figure 6-2 Economic activity of Banks & OFIs
As can be noticed from the chart above, the clients of
both banks and finance companies operate mainly in
engaged in this sector – 68% of the clients of finance
involved in agriculture, horticulture and cultivating
banks and finance companies. An important share of
the clients of banks (19%) is also involved in trading.
As for the data provided by the two insurance groups,
a large majority of their clients are in the agriculture,
horticulture and cultivating (65%), reflecting thus the
activity profile of the clients of their partner institutions
(SANASA societies for SANASA Insurance and Sewa
Finance for Hayleys AIG).
Over the last year almost all banks, finance and
insurance companies indicated that their customer
base has increased for each financial service provided,
despite perceived strong competition.
> 40,000 LKR
20,001 - 40,000 LKR
10,001 - 20,000 LKR
5,001 - 10,000 LKR
3,000 - 5,000 LKR
< 3,000
0%
10%
20%
30%
40%
50%
60%
70%
80%
90%
100%
Banks FinanceCompanies
InsuranceCompanies
Total
12%
11%
21%
17%
25%
14%
4%
15%
30%
40%
9%
2%
4%
38%
21%
13%
15%
9%
7%
21%
24%
23%
16%
9%
0%
10%
20%
30%
40%
50%
60%
70%
80%
90%
100%
Banks Finance Companies Total
12%17%
3%5%
19%
15%
41%
0%
4%
15%14%
67%
4%0%6%
6%
3%
15%
5%3%
11%
11%
54%
1%
Other
Services
Manufacturing
Trading
Animal husbandry
Fisheries
Agriculture/horticulture/cultivating

MICROFINANCE INSTITUTIONSIN SRI LANKA 20
0981
Lending methodologyAll banks offer individual loans. In addition to this, four
of them offer group loans as well, while three provide
wholesale funding to CBOs and village societies.
For the banks offering a lending methodology mix,
the share of individual lending is on average 79.5%.
These banks offer on average 11.75% based on joined
liability (individuals who receive the loan need to be
in a group which guarantees repayment of the loan).
The average share of loans offered to CBOs and village
societies represents 11.67% of the portfolio of banks
offering this service. Of the four finance companies
who offer loans, three of them provide individual
loans exclusively. The remaining institution has a loan
portfolio made up of 95% individual loans, 1% joint
observation, the prevalence of individual lending can
be observed, which for this group of institutions does
not come as a surprising fact.
For insurance companies, the question asked was
whether the policies offered were individual or
bulk policies. One respondent could not provide
information (Union Assurance), one offers only bulk
insurance policies (Hayleys AIG provides insurance
to microfinance customers of Sewa Finance), one
other respondent (Cooperative Insurance) offers only
individual policies, while the four remaining offer
a mix of both with an average of 58.75% individual
many individuals were covered under the bulk policies,
only two respondents could provide information and
reported a total of 303,000 clients. This shows that
the coverage of this subgroup extends well behind the
direct customer base reported.
Identifying potential clientsBanks rely mainly on inspections and field visits
(86%) in the process of identifying potential clients.
71% of the respondents evaluate the past transaction
performance of potential clients. An equal number of
respondents rely on recommendations from existing
reliable customers, while 57% use opportunities arising
out of non-microfinance activities of the organisations.
This suggests that this group of institutions exploits
well available opportunities.
All finance companies have reported they rely on
recommendations from existing reliable customers,
on the evaluation of past transaction records.
As for insurance companies,
no focused attempt to identify microinsurance clients.
This could be explained by the fact that quite a few
of the institutions in the sample have linkages with
other financial organisations belonging to the same
group (HNB Assurance, SANASA Insurance, Ceylinco
Insurance) or work through partners (Hayleys AIG
with Sewa Finance). These linkages are expected to play
a significant role in identifying potential clients. 29%
of the respondents have reported using inspections and
field visits for the purpose of identifying new clients.
Agencies for sourcing don’t play an important role
for any of the three groups of institutions mentioned
above (only one respondent from each group has
mentioned them), a surprising finding especially for
insurance companies which generally rely on a network
of brokers to acquire new clients. The fact that banks
and insurance companies don’t use sourcing agencies
might be explained by the KYC (know-your-customer)
requirements in place and perhaps the cost of using an
agency relative to the size of the MF portfolio.
Loan processing and approval procedureAll institutions have short processing intervals for all
types of products, none of them being of over 15 days.
days in the case of banks and from one to three days in
the case of finance companies offering loans. Savings
accounts are opened within one day for the institutions
offering the service, insurance products require one day
for banks and finance companies and one to 15 days
for specialised insurance companies. The longer time
required by specialised insurance companies could be
explained by the more complex products, sometimes
tailored to the needs of the customers. Leases and hire
approved, pawns one day.
Concerning the approval of loans, 71% of the banks
and 60% of finance companies give the branch
manager a maximum approval limit, while 29% of

82
the banks and 20% of the finance companies place the
responsibility for the approval of the loan in the hands
of a credit committee. In one bank, for loans exceeding
a set value, approval falls under the responsibility of
the Board of Directors, while in another the branch
manager can approve all microfinance loans. In the
case of the microfinance loans it is, however, unlikely
that the set value would be exceeded, thus requiring the
intervention of the Board of Directors.
Loan monitoring and provisioning
their microfinance operations on a computerised basis
while 53% of them operate a mixture of manual and
computerised systems. All institutions have both email
and internet access.
Of the banks, all have declared they measure portfolio-
at-risk (PaR) as an indicator of portfolio quality. Of
the four finance companies offering loans, one does
not monitor its portfolio quality; therefore of the 11
institutions offering loans, ten institutions (seven banks
and three finance companies) monitor the quality of
their microfinance portfolio.
The level of computerisation is also reflected in the
monitoring activities employed by banks and finance
companies. All three finance companies and six of
the banks, which monitor portfolio quality, rely on
computerised financial statements and client records.
In addition to this, all three finance companies and
five of the banks utilise field officer visit records. One
finance company and two banks use manual entries
and log books for this purpose.
When asked to define PaR, the majority of the
respondents do not seem to clearly differentiate between
the concept of PaR and that of non-performing loans
(NPLs). It remains in particular unclear whether they
consider only the respective overdue instalment as being
at risk or the entire loan amount in case one instalment
is not paid on time.
Most of the respondents have reported they use CBSL
regulations to classify NPLs, generally performing an
age analysis of defaulting loans. For commercial and
specialised banks, CBSL requires a loan to be classified
as non-performing after three months. Non-performing
loans are classified as special mention (between three
and six months), sub-standard (between six and 12
months), doubtful (between 12 and 18 months)
and loss (over 18 months). CBSL requires finance
companies to consider a loan non-performing after it
has been overdue for three months, but provisioning
commences after the loan has been overdue for more
than six months. The classification of loans as overdue,
doubtful or loss does not apply to finance companies,
although it seems that some of them have adopted these
classifications. For leasing companies, the provisions
are even more lenient. A lease is considered to be non-
performing after instalments have not been paid for
more than six months.
All institutions have reported they make provisions
for loans classified as NPLs, again following CBSL
doubtful ones. One respondent has stated that their
provisioning policy on overdue loans is 50% for loans
with collateral and 100% for loans without collateral.
The requirements of the CBSL differ slightly from
those cited by the respondents. Banks are required to
maintain a general provision of 1% on performing
loans and advances. In addition to this, they are to
on sub-standard loans, 50% on doubtful loans and
100% on loss loans. Finance companies are required to
maintain a provisioning rate of 50% on loans overdue
between six and 12 months and 100% for loans overdue
more than 12 months. Provisioning requirements for
leasing companies
for leases overdue between six and 12 months, 50% for
leases overdue between 12 and 18 months and 100%
for leases overdue for more than 18 months.
Banks and finance companies apply Central Bank
regulations as designed for their main lending business.
These regulations are not microfinance tailor-made
since loan classification is too lenient (i.e. periods are
too long) and provisioning rates are too low leading to
an over-stated asset base.
Defaulting clientsBoth banks and finance companies employ similar
have reported engaging in legal action, although it is not
clear whether for small loans such as for microfinance

MICROFINANCE INSTITUTIONSIN SRI LANKA 20
0983
clients this is indeed an option considered in practice
by banks or only a deterrent, remaining thus more at
declarative level. Another explanation could be that
the respondents have a broad understanding of the
measures implied by the legal action and include the
issuing of a legal Letter of Demand in this category.
71% of banks have declared they freeze savings and
deposit accounts of defaulting clients. 57% of banks
exert group or social pressure in order to recover loans,
which could be explained by the low level of joint
liability lending in this group of institutions. 80% of
finance companies and 57% of banks apply penalties
companies confiscate property. Only 29% of banks and
20% of finance companies use arbitration to ensure
repayment of defaulting loans. A possible explanation
for this could be that the institutions in this group have
experience in legal actions, an own legal department
and with this the mechanisms are set in place for legal
action. For this group of companies, social pressure and
arbitration may prove in fact more costly.
Operational challengesIt is interesting to notice that the operational challenges
mentioned by respondents were quite different from
one to the other. In the group of banks two respondents
did not mention any challenges while for finance
and insurance companies two and three challenges
respectively were mentioned each by two respondents.
This is indicative for the heterogeneity of the group.
Among the issues identified by banks, the following
shortage of staff or lack of microfinance experience
of existing staff, inadequate demand for products
and services or difficulty to identify solvent clients,
insufficient outreach to the low income segment,
political influence (from the respondent of a state-owned
bank) and lack of transparency and information about
microfinance. Delayed and non-repayment of loans
were each mentioned by two finance companies. Other
competition, shortage of funds and of staff. Insurance
companies have identified strong competition,
shortage of staff and inadequate demand for products
and services as the main operational challenges. Other
issues include rigid insurance rules and regulations, lack
of staff with microinsurance experience and insufficient
outreach to the low-income segment.
6.4 Products and Markets
There are significant differences in the products offered
by the three groups of companies presented in this
chapter; therefore they will be treated separately. It
should be mentioned here that the respondents were
specifically asked to provide microfinance specific
product information. As some of the respondents did
not keep specific records, especially for savings and
pawning, estimates were provided instead. The figures
of this section should therefore be taken with care.
BanksAll banks in the sample offer savings and deposit
products and loans, while five of them offer pawning
as well. Table 6-3 offers on overview of the products
offered by the seven banks in the sample.
Loan productsThe six respondents who provided information during
the survey have an average volume outstanding of
Rs. 1.5 bn and a corresponding average of 37,525
accounts. But significant disparities exist. The volume
Rs. 3.3 billion, while the number of accounts spans
between 60 (a recently started microfinance business)
interest on loans offered to microfinance customers.
Three of the seven respondents in this category have
indicated minimum amounts available between Rs.
10,000 and Rs. 50,000 therefore catering mainly to
the upper end of the lower income group. As to the
maximum values available, the clients of two banks can
access loans of up to Rs. 1 million, while other three
banks have maximum limits of up to Rs. 250,000. The
repayment period ranges from one to 120 months, but
most (57%) of the respondents have repayment periods
going up to 36 months.

84
Table 6-3 Microfinance product portfolio of Banks
Note * The average outstanding account balance was computed using data from banks which have provided information on both volume outstanding and number of accounts and therefore can differ from the ratio between the total volume outstanding and the number of accounts reported in this table.
** The number of respondents who have provided information regarding the volume outstanding.
*** The number of respondents who have provided information regarding the number of accounts.
Product / Service
No. of Banks Volume
Outstanding
(‘000 Rs.)
No. of
Accounts
Average
outstanding
account
balance
(Rs.) *
Annual
Interest
Rate
(%)
Offer the product/service
Providedinformation
7
7
5
2
1
1
5**/4***
6
2**/1***
2
1
1
70,404,508
8,849,072
66,636,942
1,057,586
102,057
6,000
6,512,619
225,147
238,875
9,868
4,094
400
10,795
39,304
2,415
107,173
24,928
1,500
4-16
8-24
18-23
8-34
11
-
Savings and Deposits
Loans
Pawning
Leasing
Pension Products
Insurance
PawningFive of the respondents interviewed offer pawning,
but only two have provided information regarding the
outstanding volume and only one regarding the number
of accounts. But even this scarce information shows
that pawning plays an important role for microfinance
customers. In terms of volumes, the pawning portfolio
of just two respondents is 7.5 times higher than the
loan portfolio of six reporting respondents. In terms
of number of accounts, the one reporting institution
has more pawning accounts than all six banks which
have reported the number of their microfinance loan
accounts. This could indicate that banks are not yet
ready to remove barriers to lower income groups and
prefer offering to this market segment products which
provide them with collateral.
Savings productsThe five banks who have offered information regarding
the volume outstanding have an average savings portfolio
of Rs. 15 billion, but the average is highly distorted by
the figures reported by one of the respondents (People’s
Bank). Excluding it, the average for the remaining
number of accounts, the four reporting institutions
have an average of 1.6 million accounts, but excluding
again People’s Bank, the average drops to just 70,873.
The average outstanding account balance of Rs.
10,795 shows that banks have a broader definition of
microfinance compared to other groups of institutions,
attracting thus customers with a higher saving capacity
than average microfinance clients. This is reflected also
For the savings and deposits mobilised, banks offer
Other productsTwo of the seven banks in the sample have reported
they offer leasing. The two respondents together have
a total portfolio of Rs. 1 billion to which correspond
9,868 accounts. The cost of a lease displays considerable

MICROFINANCE INSTITUTIONSIN SRI LANKA 20
0985
Finance companiesAll five finance companies offer microfinance customers
leasing services, four of them offer loans, while three
of them offer savings and deposits and hire purchase.
finance companies.
Leasing The average volume outstanding of leasing contracts
for microfinance customers reported by the five
finance companies is Rs. 863 million, while the average
Table 6-4 Microfinance product portfolio of Finance Companies
discrepancies within the group. The volume outstanding
of three of the five respondents is under Rs. 10 million
and under 100 accounts, while the remaining two have
portfolios of between Rs. 1 and 3 billion and over 5,000
accounts. The minimum amount of a lease ranges
between Rs. 5,000 and Rs. 100,000. Four of the five
respondents have a maximum lease amount between Rs.
100,000 and 500,000. This is also reflected in the high
average outstanding account balance (Rs. 213,670).
The cost of a lease is between 15% and 29%.
Loan productsFour finance companies offer loans to their microfinance
clients. On average, each of the four institutions has
corresponding number of 2,622 accounts, but large
discrepancies do exist. If LOLC is excluded, the average
higher than for banks. The customers of finance companies
Savings productsOnly three finance companies offer savings and deposits,
of which two have provided information. They have
explained by the fact that all savings under a certain
limit (e.g. Rs 100,000 for one of the respondents)
are considered to be microfinance, irrespective of the
income of the client. One of the respondents requests a
minimum of Rs. 2,500 to open an account, a significant
barrier for lower income groups to save with finance
companies. Clients of finance companies receive
between 9% and 17% for their savings and deposits.
Product / Service
No. of Finance Companies Volume
Outstanding
(‘000 Rs.)
No. of
Accounts
Average
outstanding
account
balance
(Rs.)
Annual
Interest
Rate
(%)
Offer the product/service
Providedinformation
5
4
3
3
2
5
4
2
3
1
4,314,000
573,100
81,500
3,846,400
900,000
20,190
10,486
1,820
10,511
62,533
213,670
54,654
44,780
365,940
14,392
15-29
4.5-25
9-17
15-29
23.5
Leasing
Loans
Savings & Deposits
Hire Purchase
Pawning

86
Other productsHire purchase plays an important role in the product
portfolio of the finance companies. The three companies
which offer this service have an average portfolio of
accounts per respondent. LB Finance has also an
important pawning portfolio with 62,533 accounts
and a corresponding volume outstanding of Rs. 900
million. The minimum value of a pawn is Rs. 5,000.
One respondent has claimed to offer insurance as well,
but no information regarding this product was made
available during the survey.
Insurance companiesInsurance companies have a diverse product portfolio
for low-income clients. The respondents in the sample
who were willing to provide information regarding their
product portfolio seem to have specialised in different
types of products. Therefore, only loan protection
insurance and life insurance are offered each by two
respondents while all other products are offered by
only one company each. An overview of the insurance
products offered by the insurance companies in the
sample is provided in Table 6-5.
Six of the ten insurance schemes presented in the
table target individual clients, one scheme targets
both individual and groups, while the remaining three
address only groups. Therefore, the picture of the
sector is diverse, with values of the annual average gross
written premium per policy ranging from Rs. 852 to
Rs. 720,000 in the case of one group policy covering
3,000 individuals.
Table 6-5 Microfinance product portfolio of Insurance Companies
insurance
Natural Disaster insurance
Education insurance
Total
No. of Insurance
Companies
Gross Written Premium (‘000 Rs. )
Insured Value
(‘000 Rs. )
Average Gross Written
Premium/Policy (Rs.)
Average Insured
Value/Policy (Rs.)
Loan Protection insurance
2 16,182 1,038,000* 7,687 2,105 143,767*
L ife insurance 2 60,977 414,170** 71,610 852 37,112**
Health insurance 1 2,120 26,000 52 40,745 500,000
Vehicle insurance
1 17,062 948,558 5,909 2,888 160,528
Personal Accident 1 720 300,000 1 720,000
1 4,564 40,000 2,000 2,282 20,000
1 6,975 - 5,580 1,250 -
1 18,600 - 7,440 2,500 -
10 schemes 127,200
100,279 1,268 27,590*** ****2,766,728
300,000,000 ***
No. of policies
Product
Note Janashakthi Insurance, Union Assurance and Co-operative Insurance have refused to disclose information regarding their products.
*The data refers to only one of the two respondents (SANASA Insurance). HNB Assurance could not provide information regarding the insured value under the Loan Protection Insurance scheme.
**The data refers to only one of the two respondents (SANASA Insurance). Ceylinco Insurance could not provide information regarding the insured value of the Life Insurance scheme.
***Group policy covering 3,000 individuals.
****Insured value information is not available for four of the ten insurance schemes.

MICROFINANCE INSTITUTIONSIN SRI LANKA 20
0987
Formal lending conditionsAll banks require proof of established residency, while
86% of the respondents have mentioned guarantors, a
minimum bank balance and proof of income sources
as conditions for obtaining a loan. Further, 57% of
them have mentioned insurance cover and collateral,
finance companies require guarantors, 80% of them
proof of established residency and income sources,
60% have mentioned insurance cover and collateral,
recommendation. The lending conditions of both
banks and finance companies are quite restrictive for
microfinance clients, therefore casting a doubt on
whether in practice the goal of providing financial
services to the disadvantaged can be attained by this
group of institutions.
Other lending conditions71% of the banks require clients to build compulsory
savings in order to approve a loan request. Only two
respondents (HNB and BOC) don’t. None of the
finance companies requires compulsory savings.
This group of institutions has a centralised approach to
interest rate setting. This is not surprising for this group
of structured, formal institutions offering a uniform
set of products and services across their outlets. Only
(one respondent from each group) allow individual
branches to take decisions concerning interest rates. The
remaining respondents have mentioned a centralised
system. In both groups (banks and finance companies)
there was one respondent operating only from the
head office, therefore the question was not applicable
to them.
Regarding the methodology used to set interest rates,
57% of banks and 80% of finance companies orientate
themselves at the deposit rate and decide on a set
margin above it. Surprisingly, no respondent from these
two groups has mentioned product cost computations
as a basis for interest rate setting for microfinance
products.
Four of the seven banks have mentioned special terms
with regard to interest rates. These refer to concessionary
rates for targeted groups (three banks) and penalties
for late payments (two banks). Four of the five finance
conditions for specific customer groups, three request
penalties on late payments, while another three offer
interest rate reductions on early payments.
As for the methods of interest rate calculation, all
banks, as well as two of the four finance companies
offering loans use the declining balance methodology.
The remaining two finance companies calculate interest
due based on the original loan amount.
Five of the seven banks and two of the four finance
companies offering loans charge a service fee for the
loan processing.
On average, 6.6% of all loan applications are rejected
in the case of banks and 17.6% in the case of finance
companies. Large discrepancies exist within these two
groups. While 2 of the banks have reported no loan
applications to be rejected, the rejection rate goes
up to 25% in the case of another respondent. In the
case of finance companies the rejection rate ranges
from 3% to 50%. But it has to be noted that these
discrepancies could also reside in the different loan
approval procedures of the institutions, some of which
may include an initial screening of the clients, which
results in a low rejection rate.
Delivery of products and marketing strategiesFor all institutions, the main delivery channel for the
products is their own branches and outlets (86% in the
case of banks and insurance companies and 80% for
finance companies). An important role is also played
process of product delivery. One bank, one finance
company and two insurance companies use links with
other institutions to deliver their products.
The most popular marketing instruments used by both
banks (86%) and finance companies (60%) are leaflets,
banners and posters, and door step marketing. 71% of
insurance companies prefer advertisement in the media

88
(radio, newspapers, magazines), instruments used by
an equal number of banks as well. Other instruments
employed by banks include joint programmes with
other institutions and cross-selling with other bank
products (each 57%). Only one bank relies on existing
customers to promote their products. For finance
companies media advertising also plays an important
role, but to a lesser extent than for the other two
groups of institutions and with a preference for TV
joint programmes with other institutions, cross selling
with other products and existing customers play only
a marginal role (one respondent). 57% of insurance
companies choose advertisements on TV, leaflets,
banners and posters, and door step marketing to
category use joint programmes with other institutions
and cross selling with other products (more than other
two categories). As a conclusion it can be mentioned that
respondents generally refer to the marketing strategies
of their overall business. It is not clear whether all the
above mentioned methods are utilised to promote
microfinance products. In fact, the instruments cited
are too costly to be employed for microfinance activities.
But it can be assumed that the microfinance business
can only benefit from a positive image of the company,
even if no direct marketing of microfinance products is
done. Another possible explanation is that companies
promote their microfinance activities as a means of
showing corporate social responsibility, microfinance
being thus used to promote the image of a company
interested in the disadvantaged.
Product developmentNew product development in the case of the institutions
interviewed is mostly performed at central level with
inputs from all branches (all insurance companies,
86% of banks and 60% of finance companies). In the
case of one bank this is done at individual bank level
by an internal team, for a finance company at branch
level by the manager. A respondent from a finance
company without branches has stated that new product
development is done at board level.
The majority of the respondents (80% of leasing
companies and 71% of banks and of insurance
companies) plan to introduce new products. 80% of
the banks planning to introduce new products consider
new savings products, while 60% of them loan products,
leasing and money transfer services. 75% of finance
companies plan to introduce loan products and 50%
of them other leasing products. In the case of insurance
companies no product was mentioned by more than
one respondent, therefore we can conclude that there is
a large heterogeneity within this group with regard to
product development. Among the products mentioned
insurance, and funeral aid insurance.
During the last two years, six of the seven banks in
the sample have introduced between two and 12
microfinance products. The average for this group of
institutions is 5.7 products per institution. Finance
companies have introduced an average of 2 microfinance
products per institution; three of the five respondents
have introduced between two and five new products.
Six of the seven insurance companies have introduced
between one and 10 new microfinance products, an
average of 2.6 products per institution. During the
same time, a few microfinance products have been
three and four products, respectively, and two finance
companies have each withdrawn one product. This is
an indication that this group of institutions monitors
product performance and withdraws unsuccessful
products.
The three groups of institutions covered in this chapter
have different approaches based on which product
field officer and staff experience (71%) and on formal
market surveys (57%), while only few (29%) resort
to discussions with customers or look at the products
offered by competitors. This last finding is surprising
since in practice, products across institutions have
a high degree of similarity, which suggests that there
might be less innovative behaviour in the market
than one could assume from the results of the survey.
Finance companies rely heavily on discussions with
while only a minority (20%) rely on field officer and
staff experience. Insurance companies give more weight
to formal market and needs surveys (71%), while only
few (29%) rely on staff experience.

MICROFINANCE INSTITUTIONSIN SRI LANKA 20
0989
6.5 Human Resources
The banks
but large discrepancies could be observed between the
individual respondents. Therefore total staff numbers
range from 150 to 10,100 staff. In fact the two largest
banks (Bank of Ceylon and People’s Bank) alone employ
71% of the total staff mentioned above. As for the
staff involved in microfinance activities, the survey has
of respondents. The staff involved in microfinance in
a respondent in the sample has 205 staff involved in
microfinance activities. If the number of staff involved
in microfinance activities is related to the number of
branches offering microfinance products, an average
of 1.7 staff per branch is obtained. Six of the seven
respondents have mentioned that their microfinance
staff is involved in other activities as well. Only HNB
had staff involved exclusively in microfinance related
activities. Of the microfinance staff, 96% had permanent
period of time. As for the levels of microfinance staff,
29% have managerial responsibilities, 33% are credit
or field officers, 26% performs clerical duties and 11%
are support staff.
The five finance companies in the sample have a total
Finance Company, the largest employer in the sample
is excluded, the average drops to just 266 staff per
are involved in microfinance activities. On average,
each institution has 92 microfinance staff. Each branch
has on average 5.2 microfinance staff. In two of the
institutions the microfinance staff is exclusively involved
in microfinance activities, while in the remaining three
microfinance staff is involved in other activities as
well. Of the microfinance staff, 98% had a permanent
contract, while 2% of the staff was represented by time
bound and casual staff. 18% of the microfinance staff
field officers, while 29% was represented by clerical
and 10% support staff.
The seven insurance companies in the sample employ
8,555 staff, an average of 1,222 staff per institution.
But there are significant disparities. The total staff
ranges from 100 to 3,500. The two largest institutions
in the sample account in fact for 70% of the total staff.
As for the staff involved in microfinance activities,
two respondents (Janashakthi and Union Assurance)
could not provide an estimate. Therefore, the five
respondents who have provided the information
have reported a total of 5,001 microfinance staff. The
number of staff involved in microfinance ranges from
1 (Hayleys AIG) to 3,500 (Ceylinco Insurance). In this
case the heterogeneity of the group is accentuated by a
diverging understanding of microfinance. The average
number of microfinance staff per branch offering
microfinance products is rather high at 15.2. But this
is also distorted by the assumption that all Ceylinco
Insurance staff is partly involved in microfinance
activities. All of the microfinance staff of insurance
companies are involved in other activities as well. The
five respondents who were willing to share information
reported that permanent staff represented 79% of their
microfinance staff, while the remaining 21% were time
bound employees. Regarding the type of positions
held by microfinance staff, six respondents who have
provided information (Janashakthi Insurance refused
To summarise, the three subgroups employed a total
be involved in microfinance. The microfinance
staff total is clearly distorted by the figures of the
insurance sub section, which accounts for 72% of
the total. This may seem surprising, especially against
the backdrop that insurance companies are among
the last to have entered the microfinance sector. But
in this fact may also reside a possible explanation of
this situation – an organisational development of the
microinsurance within established players has not yet
taken place, therefore a large number of staff seems
to be involved in providing a rather limited number
of policies. Overall, around 18% of the total staff is
involved in microfinance. Considering the fact that the

90
respondents estimated that on average 28% of their
revenues came from their microfinance activities (see
section 8.1), the staff involved in microfinance seems
to be quite efficiently employed. But since both figures,
the percentage of microfinance activities in terms of
Table 6-6 Minimum qualification requirements for microfinance staff of Banks & OFIs
revenue and the staff involved in microfinance, are
likely to be based on estimates and subject to under- or
overestimation, this conclusion needs to be supported
through further analysis.
We can observe that there are considerable differences
across the three groups of institutions presented in this
chapter, but also within each group. All institutions
have stricter minimum qualifications for managerial
staff. Between the clerical and field or credit officers,
the minimum qualifications are slightly stricter for
the first, while experience is required in most cases
for the second. Banks seem to have slightly stricter
conditions than finance and insurance companies, at
least for managerial and clerical staff. Banks require at
least a diploma for their managerial staff, compared to
finance and insurance companies, which accept A/L
as minimum qualification as well. But at the same
time, one bank accepts credit or field officers with a
qualification below O/L, while all other institutions
require at least an O/L as a minimum qualification.
For managerial positions, experience is in most cases
required. To a lesser extent this is also the case for credit
or field officers, a compensation for the not so stringent
qualification requirements compared to clerical staff.
Managerial
Clerical
Banks
Qualification Graduate (71%),Diploma (29%)
A/L passed (57%), O/L passed (29%),
Diploma (14%)
O/L passed (43%), A/L passed (29%), below O/L (14%),
not applicable (14%)
Experience Yes (86%) / No (14%)
Yes (0%) / No (100%)
Yes (43%) / No(43%) / Not
applicable (14%)
Qualification A/L passed (40%), Graduate (20%), Diploma (20%),
Professional Qualification (20%)
A/L passed (60%), O/L passed (40%)
A/L passed (60%), O/L passed (40%)
Experience Yes (100%) / No (0%)
Yes (40%) / No (60%)
Yes (60%) / No (40%)
Qualification Professional Qualification (43%),
Graduate (29%), Diploma (14%), A/L
passed (14%)
A/L passed (43%), O/L passed (29%),
Professional Qualification
(14%), Not applicable (14%)
O/L passed (43%), Professional
Qualification (29%), A/L passed (14%),
Not applicable (14%)
Experience Yes (71%) / No (29%)
Yes (43%) / No (43%) / Not
applicable (14%)
Yes (57%) / No(29%) / Not
applicable (14%)
Finance Companies
InsuranceCompanies
Credit/Field Officer
MICROFINANCE INSTITUTIONSIN SRI LANKA 20
0991
Recruitment challengesIn the case of six of the seven banks, the lack of skilled
staff category), the lack of people with microfinance
experience (29% for all staff groups), unattractive
have been identified as recruitment challenges. In
addition to this, for managerial staff the lack of a
pension scheme has been identified by one respondent
as an impediment to attracting competent staff. One
respondent has reported no difficulties in recruiting
suitable staff.
Two finance companies have mentioned they do not
have any recruitment issues for clerical, and credit
and field officers, while three respondents have stated
the same for managerial staff. Of the remaining
respondents, each of the following was mentioned
people with microfinance experience, poor working
conditions, lack of people in the desired age category
and remuneration issues. For clerical staff two of the
respondents have identified poor working conditions
as an issue, while for credit and field officers another
two respondents have mentioned the lack of skilled
people as a difficulty in the process of recruitment.
The recruitment challenge mentioned most often by
insurance companies was the lack of skilled people
(57% for managerial staff and 71% for clerical staff and
credit or field officers), followed by finding people in
the desired age category (29% to 57% depending on
the staff category). In addition to this, for managerial
staff the lack of people with microinsurance experience
and the fact that microinsurance is not considered
an attractive career option compared to traditional
insurance were each mentioned by two respondents.
It seems that the recruitment difficulties are related
to the minimum recruitment requirements and the
prevailing labour market conditions, such as the lack of
skilled, experienced people. Another issue is that since
microfinance and microinsurance are relatively new
business directions, the sector seems to suffer from the
lack of an experienced pool of workforce with specific
know-how and the career reputation enjoyed by the
traditional business of the respondents. It has to be
noted that remuneration generally does not seem to be
an issue for recruitment in this group of institutions.
Staff retentionIn the group of banks, three respondents have identified
inadequate remuneration as a retention issue, two
respondents have mentioned inadequate incentives,
while each of the following have been mentioned by
operations, microfinance is not an attractive career
option, and the lack of required skills.
Three of the five finance companies have no staff
retention issues, two of the respondents have mentioned
inadequate remuneration and the lack of operational
flexibility as impediments to retaining competent staff,
while remuneration, work overload, and difficulty of
team work and field operations were each identified by
one respondent.
Following staff retention issues were identified
each by three inadequate
remuneration, inadequate incentives, work overload
and difficult nature of field operations. In addition
to this, two respondents considered that the fact that
microinsurance is not considered an attractive career
option is an impediment to retaining competent staff.
The inadequacy of remuneration as a staff retention
issue is unexpected, especially since it was hardly
mentioned to be a recruitment issue.
IncentivesAll banks offer training opportunities as incentives
for their staff. Other incentives mentioned by banks
overtime pay and staff loans at concessionary rates
(five respondents), remunerative and moral incentives,
reimbursement of medical expenses (four banks).
All finance companies offer remunerative incentives and
performance appraisals and rewards. Other incentives
reimbursement of medical expenses, and staff loans
at concessionary rates (four respondents), workman
compensation in case of sickness or accident (three
finance companies).
Six of the seven insurance companies in the sample offer
remunerative incentives and performance appraisals and
rewards for their staff. Overtime pay is mentioned as an

92
incentive by four insurance companies. It is important
to notice that training doesn’t seem to be an important
incentive for this group of institutions.
Staff trainingStaff of the institutions covered in this chapter undergo
a broad training programme. While this is true for all
categories of staff, it is especially so for the managerial
staff. For managers of banks and finance companies
training in the field of marketing was the most cited
course. For insurance companies this was client
servicing and customer care. It is interesting to notice
that courses like business planning, risk management
and project management are less popular among
managers compared to the above mentioned courses.
HR development training courses for managers were
mentioned by 57% of banks, 75% of finance companies
In the case of clerical staff in banks, courses like
customer care and language skills development come
before more specific courses like record keeping and
accounting skills development. Finance companies
seem to have a more targeted approach for their clerical
skills development, followed by record keeping,
customer care and language skills development. Most
insurance companies offer clerical staff record keeping
and customer care courses, followed by IT, language
and accounting skills development.
Credit and field officers receive an extensive, broad
training in banks and a more focused, specialised training
in finance and insurance companies. Top courses for
marketing and language skills development training,
courses like credit evaluation, risk management and
profitability monitoring being cited by less than half of
the respondents. A large number of finance companies
offer customer care courses, followed by group
mobilisation, marketing and IT skills development.
In the group of insurance companies the agreement
offered by more than half of the respondents. Record
keeping, as well as IT and language courses are offered
each by only two respondents.
On average, bank managers receive the highest number
organised yearly, followed by clerical staff with 11
courses per institution, and credit and field officers with
the number of training sessions are less important for
training sessions per year, clerical staff 7.25 and credit
and field officers 6.75. The situation is reversed for
6.6 Financial Performance
Microfinance specific financial statements could not be
obtained.

Part II
The Consolidated Sector


MICROFINANCE INSTITUTIONSIN SRI LANKA 20
0995
1. Microfinance–an overview of the concept among Sri Lankan microfinance providers
Although microfinance has received wide attention
in the last decades, it lacks an operational definition
that is universally accepted (Khawari, 2004). While it
is generally acknowledged that microfinance is about
offering financial services to low-income clients, the
understanding among researchers and practitioners
diverges when it comes to a clearer articulation of the
range of services, the target group and the goals to be
attained. As Sriram and Upadhyayula (2002) comment:
“It appears that what microfinance means is very well
understood, but not clearly articulated.”
A problem encountered during the survey was the
screening and identification of microfinance providers
in the absence of a clearly articulated definition of
microfinance. This was especially difficult due to the
positive image this sector has received in the last decade,
which makes traditional financial service providers keen
to be associated with this development driven financial
tool. Without an operational definition of microfinance
generally accepted and implemented by all practitioners,
for the present survey it was decided to allow respondents
to provide their own definitions of microfinance.
The condition imposed for an activity to be defined as
“microfinance”, namely to be aimed at lower income
groups and micro and small enterprises, was considered
too vague. In order to have information on the
individual definitions of practitioners, the respondents
were asked to define microfinance and microcredit
and to provide the income threshold they consider to
define a low income household, as well as the number
of employees and average annual earnings which define
micro and small enterprises.
To further refine the selection of institutions participating
in the survey a condition was imposed to ensure the
commitment of the respondents to microfinance. This
was done by setting a threshold of a minimum of 500
microfinance clients. While this was an efficient filter
for NGOs and sorted out of the sample providers with
marginal microfinance operations, it didn’t work so well
for banks and other formal financial institutions. In the
absence of specific client information, a considerable
number of respondents from this group showed a
tendency to equate small size of services accessed
(especially with regard to savings and pawning) with
low income of the respondents.
The following elements of a microfinance definition
could generally be identified in the definitions provided
by the respondents:
- Range of financial services. Although microcredit
is an important component, the microfinance
concept includes a broader range of financial
services such as savings, pawning, leasing, and
insurance and pension products. Payment services
and money transfer services do not seem to be part
of the financial package offered to microfinance
clients in Sri Lanka. An overview of what type of
services the respondents belonging to the different
types of institutions include in the definition of
microfinance is provided in the table below:
Note The interview regarding the activities of the Samurdhi Banking Societies was conducted at Samurdhi Authority level and therefore all responses provided herein with regard to the SBSs reflect the views of one respondent (a senior manager of the programme).
Table 7-1 Range of services included in the microfinance definition
SANASA TCCSs
CRBs
SBSs
NGOs
RDBs
Banks & OFIs
Loans (67% of the responses); savings (13%)
Loans (92% of the respondents); deposits and savings (31%); financial services (17%)
Not mentioned
Loans (59% of the responses); non-financial services (28%); financial services (15%)
Loans (33% of the respondents); financial services (67%)
Banks: Loans (14%); financial services (86%); Finance companies: Loans (20%); financial services (80%)
Type of institution Range of services included

96
An analysis of the responses provided shows that
microfinance is largely associated with microcredit,
despite the fact that savings mobilisation plays an
important role in the Sri Lankan microfinance sector
compared to other countries in the region (World Bank,
2006). A large number of respondents has mentioned
only loans when asked to define microfinance, especially
among cooperatives (TCCSs and CRBs) and NGOs.
While NGOs are legally not allowed to take deposits,
both SANASA TCCSs and CRBs mobilise large
volumes of savings from the lower income population.
A possible explanation for this could be that generally
microcredit is considered to be the financial service
with a strong development component, as access to
n/a not available
Note *Although the respondents were explicitly asked to refer to household income, in view of the low figures cited it is likely that some of them provided information regarding individual income.
To further specify the understanding of the target group
among respondents we have asked them to define a
threshold for a low-income household, as well as the
loans is generally more difficult for the target group
than access to savings or pawning, due to the risks for
the provider associated with this microfinance product.
Respondents from more formal institutions such as
RDBs and banks and finance companies seem to have
a broader understanding of the concept. On the other
hand, definitions provided by respondents from the
NGO sector have identified associated non-financial
services among the range of services and included in
the microfinance concept.
- Target group. When defining the target group of
microfinance services, following characteristics
were generally considered: gender, income level,
economic activity and type of employment.
3,042
3,362
1,500
4,149
4,417
8,438
3
2
n/a
3
2
6
7
7
n/a
9
8
25
Type of institutionAverage income of a low-income HH* (Rs./month)
Average number of employees in a microenterprise
Average number of employees in a small
enterprise
SANASA TCCSs
CRBs
SBSs
NGOs
RDBs
Banks & OFIs
number of employees of a micro and small enterprise.
The results are summarised in the table below:
Analysis of the table above allows us to observe
the important heterogeneity in understanding of
the microfinance concept. The difference between
traditional MFIs such as co-operatives and NGOs
and the formal institutions such as banks is striking:
the income threshold doubles, as well as the average
Table 7-2 Target groups included in the microfinance definition
Table 7-3 Income and employee threshold for microfinance definition
SANASA TCCSs
CRBs
SBSs
NGOs
RDBs
Banks & OFIs
Low-income groups (36%); small enterprises (32%)
Low-income groups (39%); small enterprises (32%); rural population / farmers (17%)
Low-income groups
Low-income groups (59%); small enterprises (18%); rural population / farmers (13%); women (6%)
Small enterprises (50%)
Low income groups (47%); small enterprises (32%); rural population / farmers (26%)
Target groups includedType of institution

MICROFINANCE INSTITUTIONSIN SRI LANKA 20
0997
number of employees of a microenterprise, while the
average number of employees in a small enterprise
is on average three times higher for banks and other
financial institutions compared to the rest of the
institutional types. This suggests that the formal
financial institutions have a broader understanding of
the concept and address their products to a wider target
group, perhaps concentrating more on the higher end
of the low-income group and micro/small enterprises.
- Purpose of financial intermediation. Some of the
respondents mentioned a development goal in their
definition as can be observed in the table below:
Among the development goals mentioned by the
respondents the following were specified: empowering
the target group, improving their standards of living or,
more generally, contributing to economic development.
Although this element of the microfinance definition
is a very subjective one as it deals with the declared
intentions of the institution, which are hard to measure
against a benchmark in terms of results, it is interesting
to observe the large differences in the percentage of
respondents from each group of institutions who have
mentioned it in their microfinance definitions. While
almost two thirds of the respondents from the SANASA
TCCSs and from NGO MFIs view microfinance as a
development tool, the same is true for only 5% of the
respondents from banks and other formal financial
institutions.
- Size of service. A characteristic feature of microfinance
is the comparatively small volume of services
offered. This element was mentioned by some of the
respondents from each institutional group:
SANASA TCCSs
CRBs
SBSs
NGOs
RDBs
Banks & OFIs
Type of institution
61%
15%
Yes (single respondent)
61%
50%
5%
Percentage of respondents who mentioned a development goal in their microfinance definition
Table 7-4 Development goals in the microfinance definition
Table 7-5 Size of microfinance services
SANASA TCCSs
CRBs
SBSs
NGOs
RDBs
Banks & OFIs
Type of institutionPercentage of respondents who mentioned
small volumes in their microcredit definition
Percentage of respondents who mentioned small volumes in their microfinance
definition
18%
32%
Yes
41%
33%
37%
14%
15%
Not mentioned
10%
17%
11%

98
2. Governance issues in the microfinance sector
The rapid development of microfinance in the last
decades, characterised by increasing value of assets
and extensive outreach raises significant regulation,
ownership and governance issues. A sustainable
development of the microfinance sector and its inclusion
in the financial system depend on the efforts to adopt
best practices and to ensure a regulatory environment
conducive to growth.
Regulation and supervision
The role of regulation and supervision is to ensure an
efficient capital accumulation and resource allocation,
while at the same time protecting the soundness of
the financial system and the interests of depositors.
An overview of the current financial regulation and
supervision regimes governing microfinance providers
in Sri Lanka is presented in the following table:
SANASA TCCSs
CRBs
SBSs
NGOs
RDBs
Banks & OFIs
Type of institution Regulatory Authority Supervisory Authority Legislation
Department of Co-operative Development
Department of Co-operative Development
Samurdhi Authority (self-regulation)
-
Central Bank of Sri Lanka
Banks & Finance companies: Central Bank of Sri Lanka
Insurance companies: Insurance Board of Sri Lanka
Department of Co-operative Development
Department of Co-operative Development
Samurdhi Authority (self-supervision)
-
Central Bank of Sri Lanka
Banks & Finance companies: Central Bank of Sri Lanka
Insurance companies: Insurance Board of Sri Lanka
Cooperative Societies Act No. 5 (1972) and subsequent amendments
Cooperative Societies Act No. 5 (1972) and subsequent amendments
Samurdhi Authority Act No. 30 of 1995
no microfinance specific legislation
Regional Development Banks Act No. 6 of 1997
Banking Act No. 30 of 1988 and subsequent amendments
Finance Companies Act No. 78 of 1988 and subsequent amendements
Finance Leasing Act No. 56 of 2000
Insurance Industry Act No. 43 of 2000
Table 7-6 Regulation and supervision of microfinance institutions
It can be easily observed that the small size of services was
more often mentioned in the definition of microcredit than
in the broader definition of microfinance within each
group of institutions. Around a third of the respondents
have defined microcredit as a small scale loan.
We can conclude that the microfinance perception
among practitioners in Sri Lanka varies considerably.
This should be born in mind by the reader of the
present report. Difficulties and issues arising from this
situation are emphasised throughout the report.
A number of issues can be identified regarding the regulatory and supervisory framework:
(NGOs) escapes financial regulation and
supervision. Since most NGOs which are
engaged in microfinance mobilise savings either
directly as deposits or disguised as member
shares, there is a need for them to be monitored

MICROFINANCE INSTITUTIONSIN SRI LANKA 20
0999
by an external independent authority, in order
to protect the interests of depositors. While it
is true that the supervision of a large number of
small institutions is characterised by greater costs
than benefits, there is no justification to exclude
large NGOs from the regulatory and supervisory
framework. An attempt to remedy this issue was
made through the Microfinance Institutions
Act drafted by the Central Bank of Sri Lanka,
which is currently withheld for restructuring. At
the time of writing this report, neither the final
form of regulation and supervision proposed for
microfinance institutions, nor the date when it
will be presented to the Parliament, are known.
(Samurdhi) is self-regulated and self-supervised.
In the absence of an independent regulator and
supervisor the scheme risks being used to pursue
political objectives to the detriment of long term
sustainability and sound financial development.
responsibilities for the microfinance sector.
Different authorities are responsible for the
regulation and supervision of different groups of
microfinance providers. Considering that all these
groups offer similar products targeted at the same
market, the lack of coordination and coherence of
measures can result in considerable distortions of
the competition.
International best
practices regarding regulation and supervision
are not adhered to in the case of the cooperative
sector.22 Although efforts have been made to
introduce international monitoring standards to
the sector , the results remain modest.
22 The Department of Co-operative Development introduced COOP-RUPEES, an instrument to rate CRBs and SANASA primary societies. A mix of financial and non-financial indicators (C-Compliance; O – Organisation; O – Operations & Management; P – Plans, Programmes & Performance; R – Risk Management; U – Utilisation and Sources of Capital; P – Provisions for Liquidity; E – Efficiency of Operations; E – Equity & Stability; S – Signs of Growth) are used to score each institution. However, with the exception of some SANASA TCCSs, this standard is not widely used.
Lack of microfinance specific regulation and
supervision. The existing regulatory and
supervisory framework has been created with
a broader view of financial services and is not
adapted to microfinance specificities. For example,
RDBs, although involved to a great extent in
microfinance, are regulated and supervised
similarly to commercial banks. Considering the
fact that, for example, microfinance portfolio
management differs significantly from that
performed by banks, prudential requirements
should be different as well. Extending current
legislation to encompass microfinance providers
is not an option, since institutional structures of
microfinance service providers are different from
those of traditional providers of financial services
(banks, finance companies etc.)
The need of a coherent regulatory and supervisory
framework adapted to the necessities of the microfinance
sector seems vital. A conducive environment,
characterised by uniform standards, would support a
sound growth of the microfinance sector.
Another worrying issue which has emerged from the
survey is the lack of knowledge among respondents
regarding whether or not they are regulated and
supervised, and who the responsible authorities are.
Considering the fact that the interviews were conducted
at senior and middle management levels, this is a
puzzling finding. The table below offers an overview of
the perception of the respondents.

100
Table 7-7 Perceived regulatory / supervisory authority
Table 7-8 Audit of microfinance institutions
Type of institution
Regulation Supervision
Authority AuthorityYes Yes
Department of Cooperative Development (86%)
Department of Cooperative Development (84%);
Samurdhi Authority
Auditor General Office (20%); Funding agencies (18%)
CBSL (100%)
Banks & FCs: CBSL (92%); Audit and Rating Agencies (8%)
ICs: IBSL (83%); CBSL (17%)
Department of Cooperative Development (62%)
Director Board (44%); Department of Cooperative Development (41%)
Samurdhi Authority
Registrar of Companies (26%);NGO Secretariat (21%)
CBSL (60%); Government (20%); Ministry of Finance (20%)
Banks & FCs: CBSL (92%); Government (8%)
Insurance Companies (ICs): IBSL (100%)
75%
77%
Yes
23%
83%
95%
-
96%
Yes
72%
100%
95%
SANASA TCCSs
CRBs
SBSs*
NGOs
RDBs
Banks & OFIs
From the answers provided it is clear that not all
respondents have a clear understanding of what
regulation and supervision involve. Regulatory and
supervisory authorities might consider improving their
communication with regulated and supervised entities
in order to correct these deficiencies. On the other
hand, managers of microfinance institutions need to be
aware of the legal environment in which they operate
in order to better exploit business opportunities and
develop institutions viable in the long term.
Audit
The audit of microfinance activities is crucial for
ensuring long term sustainability of operations and
building institutional confidence. Both internal and
external audit are generally performed by most large
and medium sized microfinance providers. An overview
of the percentage of respondents having their accounts
audited internally, externally or both, as well as the
responsible external auditors is presented in the table
below:
SANASA TCCSs
SBSs
CRBs
NGOs
RDBs
Banks & OFIs
Type of institution Internal audit only External audit only Both External auditors
18% of secondary unions and 11% of primary societies
-
29%
1%
-
-
18% of secondary unions and 25% of primary societies
Yes
9%
20%
-
Finance companies: 40%
61% of secondary unions and 64% of primary societies
From Maha Sangam level upward; SBSs not directly audited internally
62%
77%
100%
Banks: 100%Finance companies: 60%Insurance companies: 100%
Department of Co-operative Development
Auditor General’s Department for Samurdhi Authority; accountants of the Divisional Secretariat offices for SBSs
Department of Co-operative Development
-
CBSL approved auditors
CBSL approved auditors

MICROFINANCE INSTITUTIONSIN SRI LANKA 20
09101
A first observation is that although CRBs and SANASA
TCCSs are required to be audited by the Department
of Co-operative Development, a significant number of
them (29% of CRBs, 18% of secondary unions and
11% of primary societies) are reported to be audited
only internally. SBSs, which are required to be audited
by the accountants of Divisional Secretariat offices,
also lack a meaningful external audit. Even when
audit is performed in the case of these institutions,
resource constraints have a bearing on its quality and
on its timely release. Furthermore, most auditors lack
microfinance specific knowledge, which has an impact
on the quality of the analysis.
A high percentage of NGOs are audited both
externally and internally, while a further significant
share is subjected to external audit only. This has to be
positively acknowledged since most of the NGOs are
not legally required to do so. According to the survey,
only 24% of NGOs are registered under the Companies
Act, being thus required by law to be audited annually.
The fact that such a large number of NGOs are audited
externally can be attributed to the influence of donors,
which often link their support to the availability of
meaningful audited information and offer funding to
support the costs thus incurred.
Decision making process
The organisational structure of a microfinance
institution impacts its efficiency and its potential to
reach its objectives. An overview of the decision making
process within each institutional group can provide
useful insights.
Respondents were asked at which level decisions on the
overall operating policies of the institution are taken.
An overview of the answers is provided in the table
below.
n/a
95%
BoD of Samurdhi Authority
67%
83%
63%
n/a
4%
-
29%
17%
21%
Type of institution Board of Directors Management
SANASA TCCSs
CRBs
SBSs
NGOs
RDBs
Banks & OFIs
Participatory decision process – group decision involving management, board members, staff and affiliated institutions (over ¾ of the respondents); a minority strictly follows the guidelines of the National Federation and does not make use of their right of self determination.
Participatory decision process – group decision involving management, board members, staff and affiliated institutions (around 90% of the respondents).
Highly centralized process; political decision - responsible Ministry is involved in setting interest rates, HR policies, target group definition.
Type of institution Characteristics of the decision making process
SANASA TCCSs
CRBs
SBSs
Table 7-9 Decision making in microfinance institutions
Table 7-10 Characteristics of the decision making process
The majority of institutions seem to entrust the
Board of Directors with these types of decision. The
highest centralisation is found in the case of SBSs,
where all operating policy decisions are taken at the
Board of Directors level of the Samurdhi Authority.
The respondents were further asked at which level
strategic decisions are taken regarding specific matters
such as products, interest rates, human resources and
target group. The results are briefly commented in the
following table:
Table 7-10 continued on next page

102
Centralised decision making process (head office or parent organisation level, board members involved); however, most MFIs in this group are small size institutions, almost half of them having no branches at all.
Centralised decision making process (senior management at head office level).
Strategic decisions taken centrally but at management level.
Type of institution Characteristics of the decision making process
NGOs
RDBs
Banks & OFIs
3. Clients
A considerable problem encountered in the process
of collecting and analysing the survey data was due
to the fact that most MFIs do not gather information
regarding their clients. Therefore the following section
mainly draws on estimates provided by the respondents
and less on statistical information collected at MFI
level.
Outreach
The overall outreach of the microfinance sector in Sri
Lanka is difficult to estimate with a high degree of
accuracy. During the survey following difficulties were
encountered:
The majority of microfinance providers (CRBs,
commercial banks) do not collect client
information, only account data. For some of the
large players in the sector (CRBs, People’s Bank)
not even an estimate could be provided.
Some of the respondents do not collect separate
information on their microfinance business.
Some microfinance providers maintain client
information only for loans, the outreach of other
microfinance products (savings, pawning) is
mostly estimated.
Member based MFIs keep evidence of their members,
some of which are no longer active clients.
Different understandings of the microfinance
concept influence the estimation of the client base
by the respondents. The respondents adhering to
a broader definition of microfinance will tend to
overestimate the number of microfinance clients.
The following table provides an overview of the
information provided by the respondents based on which
the client base of microfinance has been estimated. The
first column is based on the estimation of the client
base provided by the respondents. The second column
presents the total number of accounts provided by
the respondents for all products offered, while the last
column focuses on the number of loan accounts only.
Table 7-11 Client base and number of accounts
Table 7-11 continued on next page
SANASA TCCSs
CRBs
SBSs
Type of institution Client base / members Total number of accounts Total number of loan accounts
860,611 registered members; overestimated, since a large proportion of PTCCSs are inactive
Not available
2,300,000 members + 227,000 non-member clients
251,355 (savings and deposits, loans and pawning) – data available for a limited number of outlets, therefore not representative
13,885,211 (savings and deposits, loans and pawning) – account information for CRBs of between 190 and194 MPCSs
8,951,950 (voluntary & compulsory savings, shares and loans)
214,803 – account information provided by the Federation for 4,500 PTCCSs*
2,783,000 – account information for CRBs of 188 MPCSs
656,330

MICROFINANCE INSTITUTIONSIN SRI LANKA 20
09103
NGOs
RDBs
Banks & OFIs
Total
956,000
1,850,000
Banks: 706,600 (excluding microfinance clients of People’s Bank);
Finance companies: 85,583;
Insurance companies: 142,550
Total: 934,733
7,128,344
1,705,046
2,876,043
Banks: 6,991,003 (savings and deposits, loans, pawning, leasing, pension products and insurance)
Finance Companies: 105,540 (leasing, loans, savings and deposits, hire purchase and pawning)
Insurance companies: 100,279 policies
Total: 7,196,822
34,866,427
375,156
311,204
Banks: 225,147
Finance companies: 10,486
Total: 235,633
4,576,126
Type of institution Client base / members Total number of accounts Total number of loan accounts
Note: *Account information could not be obtained for all outlets directly from the respondents. A total number of 112,460 accounts were reported for 1,100 outlets.
If the number of loan accounts of CRBs is excluded
(since client information for this group was not
available) the proportion of loan accounts to the total
number of clients is extremely low (one loan to every
fourth client). The causes behind this situation remain
largely unknown and a subject for further research.
Possible explanations for this situation could be a
shortage of funding in the case of certain institutions
(such as NGOs) coupled with the investment of the
savings received by large deposit takers (such as CRBs,
SBSs) in activities other than lending. Some respondents
have also mentioned the low absorption capacity of
the target group for such loans. Despite microcredit
being essentially a non-collateralized lending business,
the survey found that many providers of microcredit
do impose collateral and other conditions which can
have a restrictive effect on the utilisation of the credit
facilities on offer.
Despite the shortcomings mentioned above and the
consequent impossibility of clearly estimating the
overall outreach of microfinance services in Sri Lanka,
its breadth seems to be considerable. Member based
MFIs seem to have the broadest outreach, with CRBs,
SBSs and TCCSs reaching a large number of clients.
Target group
One of the defining elements of microfinance is the target
group whose needs are addressed. The table that follows
offers an overview of the percentage of institutions in each
group which have set themselves a target group, as well as
the particular groups on which they focus.
Table 7-12 Target group for microfinance
71%
63%
All SBSs (target group set at central level)
93%
83%
70%
77%
Households with < Rs. 1,500 monthly income
71%
100%
90%
75%
-
78%
80%
65%
62%
-
40%
80%
80%
71%
-
47%
80%
Youth: 65%
Youth: 54%
-
Disabled: 29%
Youth: 80%
Type of institution YesOf those who focus on target groups
WomenLow-income Entrepreneurs Farmers Other
SANASA TCCSs
CRBs
SBSs
NGOs
RDBs
Table 7-12 continued on next page

104
Banks: 71%
Finance Companies (FC): 80%;
Insurance Companies (IC): 29%
Banks: 60%;
FC: 50%;
IC: 50%
Banks: 40%
FC: 50%;
IC: 50%
Banks: 100%;
FC: 50%;
IC: 50%
Banks: 80%;
IC: 50%
Banks: Youth: 40%; Disabled: 40%;
Type of institution YesOf those who focus on target groups
WomenLow-income Entrepreneurs Farmers Other
Banks & OFIs
Among the different types of microfinance providers,
NGO MFIs seem to be the group with the most focused
approach, with 93% of them having specific target groups.
Considering their social mission and their stronger focus
on development, this is not surprising. At the other end of
the spectrum, insurance companies seem to be the group
with the weakest target group orientation. Only 29% of
the respondents from this group have stated they focus on
specific customer groups.
RDBs and a large number of CRBs focus predominantly
on lower-income households, banks on entrepreneurs,
and SANASA TCCSs and NGOs on women.
Gender focus
Since the modern microfinance movement has been
characterised by a special focus on women, respondents
were asked to estimate the percentage of female customers
in their overall microfinance clientele. As mentioned
in the brief introduction to this section, the majority
of respondents do not collect client level information;
therefore the figures presented below are based on
estimates.
Among the groups of microfinance providers included in
the survey, NGOs seem to have the largest share of female
microfinance customers – only 5% of the respondents
Table 7-13 Gender composition of clients
Over 75% - 11% of respondents; Between 50% and 75% - 64% of respondents; Under 25% - 4% of respondents.
Over 50% - 51% of respondents; Between 25% and 50% - 38% of respondents; Under 25% - 9% of respondents.
65%
Over 75% - 73% of respondents; Between 50% and 75% - 22% of respondents; Between 25% and 50% - 4% of respondents; Under 25% - 1% of respondents.
Over 75% - 17% of respondents; Between 50% and 75% - 50% of respondents; Between 25% and 50% - 33% of respondents.
Banks: less than 50% - 71% of the respondents; Finance companies: less than 50% - all four respondents which provided information; Insurance companies: less than 50% - 80% of respondents which provided information.
Type of institution Percentage of female customers
SANASA TCCSs
CRBs
SBSs
NGOs
RDBs
Banks & OFIs
have stated their share of female customers is below 50%,
while 73% of the respondents claim that more than three
quarters of their customers are women. At the other end

MICROFINANCE INSTITUTIONSIN SRI LANKA 20
09105
of the scale, formal financial institutions have the lowest
shares of female customers – all finance companies which
have provided information on the gender profile of their
clients, 80% of insurance companies and 71% of banks
have declared their microfinance customers to be mostly
male.
Differences in income and activity profile of clients
across institutions
An overview of the income and activity profile of
microfinance clients was considered to bring interesting
insight regarding the direction of supply of microfinance
services in Sri Lanka. The results of the survey show
considerable disparities between the different groups of
institutions.
SBSs were not included in the analysis of this section.
Statistical information regarding the profile of customers
was not available at national level, the level at which the
interview was conducted. Considering the distance to the
grass-root level of the respondent and the conclusions
of studies of international organisations (World Bank,
2003 and ILO, 2000), the official estimate that 85%
SBS clients have a household income below Rs. 1,500
could present an over-statement. Similarly, the estimate
that 15% of SBS clients are involved in agriculture, while
the balance 85% are self employed in different fields of
activity, is too vague to be compared to the estimates of
other institutional groups.
The group with the highest outreach among the poorest
clients are NGO MFIs, half of their clients having,
according to the estimates of the respondents, a monthly
household income less than Rs. 3,000. Clients belonging
to this group (< Rs. 3,000), constitute 25%, 20% and
19% of the clients of CRBs SANASA TCCSs and RDBs
respectively. As expected, banks and other financial
institutions involved in microfinance have the lowest
outreach among the poorest layer of clients: only 7% of
their clients have a monthly household income below
Rs. 3,000. The same ranking in terms of outreach to the
lowest income group is maintained even if the threshold
income level is raised to Rs. 5,000.
Figure 7-1 – Income profile of clients
Figure 7-2 Activity profile of clients
The discrepancies between the different groups of
institutions are less marked in terms of the activity
profile of their clients. With the exception of banks and
other formal financial institutions, the clients of other
institutional groups have a similar activity structure: the
largest share is involved in agriculture (between 38% and
45%), followed by similar proportions of clients (12% to
20%) involved in other primary activities such as fisheries
and animal husbandry. Between 9% and 20% of the clients
of this group are engaged in manufacturing and trading.
The highest heterogeneity is displayed by the proportion
of clients involved in the service sector: here the share of
the total client base varies from 3% in the case of NGOs
and 54% in banks and other financial institutions.> Rs. 40,000
Rs. 20,001-40,000
Rs. 10,001-20,000
Rs. 5,001-10,000
Rs. 3,000-5,000
< Rs. 3,000
0
10
20
30
40
50
60
70
80
90
100
20%
29%
26%
15%
5%
5%
25%
30%
28%
12%
4%1%
50%
32%
13%
2%
19%
18%
24%
28%
8%3%
7%
21%
24%
23%
16%
9%
TCCSs CRBs NGOs RDBs Banks &OfIs
3%
0%
10%
20%
30%
40%
50%
60%
70%
80%
90%
100%
39%
17%
15%
9%
12%
8%
45%
16%
15%
16%
7%1%
39%
20%
20%
12%
3%6%
32%
12%
16%
14%
12%
14%
15%
7%
11%
11%
54%
2%
Other Service Manufacturing
Trading
Agriculture/horticulture/cultivating
Fisheries/Animal husbandry
TCCSs CRBs NGOs RDBs Banks &OfIs

106
4. Microfinance outlet network
Based on the information gathered in the survey, the
regional and sectoral distribution of microfinance outlets
was determined. The survey coverage in the conflict
affected districts of the Northern Province was limited
for most institutional groups and a threshold of 500
microfinance clients (100 microfinance clients in the
Northern and Eastern provinces) was set in order to
restrict the survey to those with significant microfinance
operations. However, all efforts were been made to ensure
an extensive coverage of all types of institutions, and there
are good reasons to believe this objective was achieved.
All RDBs and all SBSs were covered, together with 3,794
active SANASA societies, as well as a large number of
CRBs (1,452). Figure 7-3 depicts the distribution of the
10,907 outlets covered by the survey according to the type
of institution.
Figure 7-3 Number of outlets by type of institution
Figure 7-4 Regional distribution of microfinance outlets
It is observed that in terms of number of outlets, SANASA
TCCSs have the widest coverage (35% of total outlets),
followed closely by NGOs (27%). Together these two
groups of institutions hold almost two thirds of the total
number of outlets. The group with the most modest outlet
coverage is the group of RDBs. With 215 outlets they
represent only 2% of the total number of outlets covered
in this survey.
Regional coverage
Detailed information regarding the regional distribution
of outlets is provided in Figure 7-4
The Southern Province has by far the largest number of
microfinance outlets (21%), followed by the Western
Province (16%). At the other end of the spectrum, the
Northern Province is the province with the lowest number
of microfinance outlets (5% of the total), followed by the
North Central Province (7%). In view of the conflict
affecting the Northern Province, this is not a surprising
finding. On the one hand, the ongoing instability in
the area is a barrier to the development of microfinance
institutions in the area, and on the other hand, even
the few institutions still operating in districts such as
Kilinochchi, Mullaitivu and Mannar could not be covered
by the survey.
Sectoral coverage
The sectoral coverage of microfinance outlets is presented
in the table and figure below. It should be mentioned that
the sectoral breakdown of 965 TCCSs and 2,341 NGO
outlets was not available; therefore the data in this section
covers around 70% of the total sample.
27%
13%
35%
10%13%
2%
SBSsTCCSsCRBs
NGOsRDBsBanks & OFIs
10%5%10%
10%
7%
10%21%
11%
16%
WesternCentralSouthern
North WesternNorth CentralSabaragamuwa
UvaNorthernEastern

MICROFINANCE INSTITUTIONSIN SRI LANKA 20
09107
The rural sector has the largest coverage (82%), which is
not surprising considering the fact that 80% of the total
population live in rural areas. The estate sector is the least
covered by microfinance institutions: only 2% of the
outlets are located in this sector compared to 5.4% of the
population living there.
Correlation outlets – poverty
Considering the development and poverty alleviation
aspects of microfinance, it is of interest to analyse how
well does the distribution of outlets correlates with that of
the distribution of the population below the poverty line
(PBPL). Since poverty figures were not available for the
Northern Province and only some districts of the Eastern
Province, the analysis of this section excludes these two
provinces. The tables below summarise the regional and
sectoral distribution of outlets versus the distribution of
PBPL, as well as the correlation coefficients by group of
microfinance providers.
Table 7-14 Sectoral coverage of microfinance outlets
Table 7-15
Table 7-16
Note * PBPL figures were obtained from the Department of Census and Statistics Household Income and Expenditure Survey 2002.
The Southern Province is largely over-served also in
terms of poverty distribution while the Central and
Sabaragamuwa provinces are considerably underserved by
microfinance providers.
Figure 7-5 Sectoral distribution of microfinance outlets
19%
13%
25%
12%
8%
11%
12%
100%
17%
17%
17%
15%
6%
11%
16%
100%
Province Outlets (%) PBPL* (%)
Western
Central
Southern
North Western
North Central
Uva
Sabaragamuwa
Total
16%
82%
2%
100%
7%
82%
11%
100%
Province Outlets (%) PBPL* (%)
Urban
Rural
Estate
Total
124
2,669
36
2,829
207
1,237
8
1,452
54
982
2
1,038
169
465
8
642
40
170
5
215
637
695
83
1,415
1,231
6,218
142
7,591
Sector SANASA TCCSs* CRBs SBSs NGOs** RDBs Banks & OFIs Total
Urban
Rural
Estate
Total
Note * For Western, Southern and Uva Provinces, the total number of branches does not tally with the subtotals of urban, rural and estate branches, as the breakdown for the districts of Colombo (350 PTCCSs), Galle (255 PTCCSs) and Badulla (360 PTCCSs) was not provided by the respondents.
**The sectoral breakdown was not available for the 2,315 active societies and for 26 service centres of SEEDS.
Urban Rural Estate
16%2%
82%

108
Table 7-17
Table 7-18 Identification of potential clients
Note * The total poverty figures (people below the poverty line) used to calculate the correlation between SANASA outlet distribution and poverty by province were adjusted to account for the districts which were not covered during this survey (Gampaha, Puttalam, Anuradhapura).
The tightest correlation between the regional distribution
of outlets and the regional distribution of poverty is
displayed by CRBs, followed closely by SBSs and TCCSs.
Therefore it seems the outlet network of the co-operative
5. Operations
An extensive part of the questionnaire was aimed at
finding out how different microfinance providers have
organised their operations. This section presents and analyses
the findings of the survey concerning client relations and
portfolio management and closes with an assessment of the
operational challenges as identified by the respondents.
Client identification
Having procedures in place to ensure a good screening
of potential clients is vital to maintaining the quality of
the loan portfolio. An overview of the methods used to
identify potential clients is presented in the table below:
0.700959
0.737680
0.723488
0.274874
0.628024
0.413547
0.999011
0.986036
0.997716
0.913991
0.977110
0.470277
Province Correlation by province Correlation by sector
SANASA TCCSs*
CRBs
SBSs
NGOs
RDBs
Banks & OFIs
sector, as well as that of the Samurdhi programme is in a
good position to reach the country’s poor. A surprisingly
low degree of correlation is displayed by NGO MFIs, a
situation which can be explained by the high concentration
of this sector in the Southern and North-Central provinces
relative to their corresponding PBPL share, and the low
presence in provinces with high poverty incidence such as
Uva and Sabaragamuwa.
All groups of institutions with the exception of banks
and other financial institutions display strong correlations
between the sectoral distribution of outlets and the sectoral
distribution of poverty. Since this group of institutions uses
the same outlet network for their microfinance services as
for their traditional business, it is not surprising that this is
only weakly correlated to the incidence of poverty.
124
2,669
36
2,829
89%
68%
54%
36%
-
81%
57%
57%
21%
12%
yes
yes
yes
-
-
93%
n/a
76%
51%
-
100%
100%
50%
50%
33%
63%
42%
63%
37%
16%
Identification method SANASA TCCSs CRBs SBSs NGOs RDBs Banks & OFIs
One of the most used methods to identify and screen
potential clients is through field visits and inspections. This
method is utilised by all RDBs, 93% of NGOs, and also by
almost two thirds of banks and other financial institutions.
Considering the target group of microfinance institutions,
it is important that MFIs assess potential clients at the field
level itself in order to evaluate their social and economic
situation and gain an understanding of their business
Inspections / field visits
Past transaction performance
Third party recommendations (reliable customers, officials and institutions)
Opportunities arising out of non-microfinance activities
Employing an agency for sourcing

MICROFINANCE INSTITUTIONSIN SRI LANKA 20
09109
activities. Reaching out is also important in microfinance
where potential clients may not only be physically isolated
but may also be unaware of the financial services available
to them and may feel intimidated by financial institutions
and reluctant to approach them. This applies particularly
in the case of traditional financial service providers such
as banks. Closeness to client is especially important in
microfinance to prevent moral hazard issues which could
arise in the absence of collateral.
Evaluation of past transaction performance relies mostly
on informal sources, as microfinance institutions and
clients are not integrated into the system of the Credit
Information Bureau of Sri Lanka (CRIB). Surprisingly,
the lowest response rate for this option came from the
formal sector – banks and other financial institutions.
This might be explained by the fact that the credit
extended to microfinance clients consists of small
amounts and represents a minor proportion of the total
loan portfolio of the institution, a situation which does
not justify the relatively high investigation costs incurred
by such an evaluation. On the other hand, all RDBs have
mentioned they evaluate past transaction performance of
potential clients. Considering that microfinance activities
are estimated to account for an average of 86% of their
revenue earned, the need for a thorough appraisal of new
clients is acknowledged.
Recommendations from a trustworthy third party (reliable
customers, officials, institutions) play an important role in
new client identification for the majority of institutions
covered by the survey. At the same time, opportunities
arising out of non-microfinance activities do not seem to
be fully exploited, despite the fact that most institutions
are involved in a wide range of other activities.
Lending terms and conditions
An overview of the formal requirements of the different
groups of microfinance providers for granting a loan is
presented in the table below:
Table 7-19 Loan conditions
There is a strong reliance on guarantors to secure the
microfinance loans granted. Depending on the prevailing
lending methodology some rely on group guarantees
(especially from the NGO sector), while the majority
requires personal guarantees. In addition to this and for
a similar purpose, a large majority of respondents require
loan applicants to have a minimum deposit or bank
balance or, as in the case of Samurdhi, to build up a certain
share value. Member-based organisations (CRBs, TCCSs,
SBSs and some NGOs) also require membership in the
organization in order to have access to loans.
A worrying finding of the survey is that, with the exception
of NGOs and SBSs, a large number of respondents
require physical collateral to secure a loan. This suggests
that although microfinance seems to be widely available, a
considerable number of people from the bottom layer of
the income distribution may still face significant barriers to
accessing loans. The innovative approach of microfinance
compared to traditional finance rested in its reliance on
collateral substituting mechanisms. However, the findings
of the present survey indicate that a large proportion of
microfinance institutions impose collateral and collateral
124
2,669
36
2,829
93%
100%
93%
79%
71%
32%
61%
29%
94%
96%
80%
80%
86%
12%
63%
36%
yes
yes
yes
-
-
-
-
yes
92%
82%
75%
40%
55%
16%
8%
36%
100%
n/a
67%
100%
83%
17%
67%
17%
92%
n/a
58%
92%
83%
58%
58%
42%
Formal requirements SANASA TCCSs CRBs SBSs NGOs RDBs Banks & FCs
Guarantors (individuals / groups)
Membership
Minimum deposit / bank balance / share value
Proof of established residency
Proof of income
Insurance cover
Collateral
Group member/ leader / third party recommendation

110
Table 7-20 Lending methodology
substitutes as conditions for obtaining a loan. It may
well be that these collateral requirements are reduced as
compared to traditional finance, but they may still exclude
some of the most vulnerable clients.
The low reliance on insurance cover and on third party
recommendations should be noted. This shows that
there is considerable scope for development of the micro
insurance market. At the same time, social relationships
could be better exploited to ensure high repayment rates.
Lending methodology
The provision of microfinance services in Sri Lanka seems
to be mainly oriented towards individual clients although
the group mechanism is relied on to secure the loans. The
Samurdhi programme was designed to function based on
joint-liability mechanisms, but it is agreed that in practice
group formation is arbitrarily decided by Samurdhi
Development Officers, which creates frictions in the
group dynamic. The system thus does not seem to fully
exploit social relations to ensure repayment of loans.
Group mechanisms seem to be used at a wider scale in the
provision of insurance services to microfinance clients. A
large share of the traditional insurance companies involved
in microfinance had group policies.
Wholesale lending is, with the exception of secondary
unions of Thrift and Credit Co-operative Societies
belonging to the SANASA movement and of some
NGOs, a marginal activity.
Processing time
The processing time for the principal products offered by
microfinance providers is displayed in the table below.
Table 7-21 Processing time
124
2,669
36
2,829
23
1
14
1
3
18
1
19
1
17
14
1
-
-
-
19
1
1
1
8
26
1
6
1
-
Banks:8; FCs:2
Banks:1; FCs:1
Banks:6; FCs:4
Banks:1; FCs:1
Banks:1; FCs:1
Processing time (days) SANASA TCCSs CRBs SBSs NGOs RDBs Banks & FCs
Loans
Savings and Deposits
Leasing
Pawning
Insurance
CRBs
SBSs
NGOs
RDBs
Banks & OFIs
34%
92%
95%
-
45%
91%
Banks: 79.5%; FCs: 98.75%; ICs: 56% (individual insurance policies)
6%
8%
5%
100%
39.5%
9%
Banks: 11.75%; FCs: 0.25%; ICs: 44% (group insurance policies)
60%
<1%
<1%
-
15.5%
<1%
Banks: 8.75%; FCs: 1%
Type of institution Individual lending Group lending Wholesale lending
SANASA TCCSsSUs PTCCSs

MICROFINANCE INSTITUTIONSIN SRI LANKA 20
09111
It is interesting to notice that for loans, both the shortest
and the longest average processing times in days are found
among formal providers of financial services. Finance
companies with an average of two days and commercial
banks with an average of eight days seem to be the quickest
in processing loans, while RDBs require 26 days for the
same activity.
A possible explanation could be that for the former group,
microfinance operations represent an insignificant share
of their total loan portfolio, therefore there is little risk
for the overall performance of the banks in case of non-
repayment of microfinance loans. For the latter group
(RDBs), microfinance loans represent the majority of
their portfolio, therefore they are more inclined to bear
the cost of a lengthier and more complex loan assessment
procedure in order to reduce the risk of default.
The lack of computerisation of operations in most
microfinance providers (with the exception of those
belonging to the formal financial system) has a negative
impact on the processing time of loan applications.
However, loan processing times should, in general, be
improved as low-income individuals and micro/small
enterprises often do not have the resources to tide them
over a lengthy loan approval period and this can have the
undesired outcome of leaving them with little alternative
but to seek funding from expensive informal funding
sources.
Loan approval procedure
Loan approval procedures involve in most cases (with
the exception of banks and finance companies) a credit
committee or regional level body. This explains also the
long average processing time for loans. With the exception
of RDBs, the Board of Directors does not seem to play
an important role in approving loans. However, even in
this group, the Board’s approval is required only for loans
above a certain value.
Table 7-22 Loan approval
Table 7-23 Access to technology
93%
36%
7%
85%
41%
9%
yes
-
-
64%
53%
8%
100%
67%
33%
25%
67%
8%
Loan approval procedure SANASA TCCSs CRBs SBSs NGOs RDBs Banks & FCs
Approval by credit committee / regional level body
Manager approval up to a maximum loan value
Board of Directors
11%
6%
n/a
63%
83%
100%
11%
7%
n/a
73%
100%
100%
61%
74%
100%
37%
-
-
-
1%
-
5%
-
43%
39%
25%
-
58%
100%
57%
Type of institution Access to internet
Access to email Manual Computerised Mix
Operations and processes
SANASA TCCSs
CRBs
SBSs
NGOs
RDBs
Banks & OFIs
Access to technology
The table below focuses on the access of microfinance
institutions to modern information and communication
technology, such as internet and email facilities and on
the degree to which computerisation of operations and
processes permeates the sector.

112
The survey reveals one of the main weaknesses of the
microfinance sector in Sri Lanka. Member-based societies
such as SANASA TCCSs and CRBs almost entirely lack
access to modern communication technologies (email,
internet facilities). Combined with the lack of language
skills among staff this represents a significant barrier to the
dissemination of best practices within the sector.
The survey also reveals that in over two-thirds of member-
based institutions such as SBSs, SANASA TCCSs and
CRBs, operations and processes are performed manually.
Over half of NGOs and banks and other financial
institutions, as well as all RDBs employ a mix of manual
and computerised operations. With the exception of the
group of banks and other financial institutions, fully
computerised operations are almost entirely absent.
Defaulting clients
A variety of measures are employed in dealing with
defaulting clients. These are presented in the table below:
Table 7-24 Dealing with defaulting clients
Table 7-25 Monitoring portfolio quality
89%
54%
61%
39%
43%
11%
4%
83%
44%
57%
44%
28%
16%
2%
-
yes
yes
yes
yes
-
-
40%
84%
29%
51%
53%
4%
33%
83%
67%
50%
67%
33%
83%
17%
100%
33%
67%
42%
25%
50%
-
Measures taken SANASA TCCSs CRBs SBSs NGOs RDBs Banks & FCs
Legal action
Group or social pressure
Penalties/ fine
Freezing savings/deposit accounts
Arbitration
Confiscating/ seizing property
Recovery from guarantors
With the exception of NGO MFIs, engaging in legal
action against defaulting clients was cited by over 80%
of the respondents. This is a rather surprising finding
as microfinance loans are mostly so small in value that
it seems hardly probable that the cost of legal action is
justified. From this perspective, arbitration seems to be
under-utilised. It could be that engaging in legal action
is considered by MFIs a deterrent for other clients who
would otherwise be tempted to default, thus offering a
justification for such a costly and lengthy action.
NGO MFIs seem to have a different approach from the
rest of the MFIs, with more emphasis placed on group
or social pressure (84% of the respondents), arbitration
(53%) and recovery from guarantors (33%). This approach
is more appropriate in the case of microfinance loans, as
it functions also in the case of low-income clients, from
whom little can be recovered through legal action, seizing
of property or other collateral.
Portfolio management
The survey reveals a widespread lack of understanding
of principles and best practices with respect to portfolio
management and maintaining portfolio quality. This is
cause for concern, since the respondents in the survey were
all members of the senior management of their respective
institutions. A large number of respondents could not
distinguish between portfolio management measures and
actions employed to deal with defaulting clients.
Portfolio-at-Risk
The majority of respondents (see table below) claimed
that their respective institutions use Portfolio-at-Risk
in order to monitor the quality of their loan portfolio,
the percentage of respondents being higher among the
formal financial institutions (RDBs, banks and finance
companies involved in microfinance). NGO MFIs, which
do not fall under specific financial regulation, have the
lowest incidence of PaR monitoring.
57% 65% yes 51% 100% 91%
Type of institution SANASA TCCSs CRBs SBSs NGOs RDBs Banks & FCs
Monitoring PaR

MICROFINANCE INSTITUTIONSIN SRI LANKA 20
09113
However, even among the respondents who stated that their
institutions monitor Portfolio-at-Risk, the understanding
of the concept varied considerably. Only a minority of
them could offer a correct definition (see the individual
institutional chapters for more details on the different
definitions of PaR provided by the respondents).
Table 7-26 Portfolio tracking
Non-performing loans
The concept of non-performing loans seemed to be better
understood by the respondents. The majority related this
to an age classification of overdue loans but there were
large differences in the classification e.g. the number of
overdue instalments considered for the definition of a non-
performing loan. This large heterogeneity was manifested
even within the different institutional groups and was
highest among institutions which are not regulated or
supervised and therefore lack common guidelines in this
respect. Most of the classifications adopted are similar
to those of banks and not adjusted to take into account
Proper monitoring of the loan portfolio is also hampered
by lack of technology. The table below documents the
extensive reliance of the majority of microfinance providers
on a manual system of record keeping.
The responses provided reveal that provisioning is often
linked to the total loan portfolio or revenue, rather than
with non-performing loans or portfolio-at-risk.
Operational challenges
Difficulties in ensuring repayment of loans, strong
competition, and difficulties in obtaining funding for their
94%
33%
63%
91%
17%
-
yes
-
-
86%
71%
74%
83%
100%
-
30%
90%
80%
Formal requirements SANASA TCCSs CRBs SBSs NGOs RDBs Banks & FCs
Log books/ other manual records
Computerized financial statements/ client records
Field visit records
54% 58% yes 42% 100%
Type of institution SANASA TCCSs CRBs SBSs NGOs RDBs
Provision for non-performing loans
the specific nature of microfinance operations. They
are generally more lenient both in the definition and
classification of non-performing loans, as well as in the
subsequent provisioning policy.
Provisioning policy
Other than RDBs, banks and finance companies which
are regulated by the CBSL, the number of microfinance
providers which have provisioning policies in place is
quite modest.
microfinance operations, as well as inadequate technology
and equipment are the operational challenges mentioned
most often by the respondents across the different groups
of institutions. An overview is offered in the table below.
Table 7-27 Provisioning for non-performing loans

114
Table 7-28 Main operational challenges
With the exception of the group of banks and other
financial institutions, where the operational challenges
identified were quite diverse and less marked, which is not
surprising considering that these are strong institutions
with experience in the provision of financial services,
for the other groups there seems to be a large degree of
consensus as to the challenges faced. The most often
mentioned issue was Delayed repayment of loans was the
issue most mentioned by SANASA TCCSs, while RDBs
mostly cited strong competition, CRBs poor technology
and NGOs difficulties in obtaining adequate funding.
6. Products and Markets
The Sri Lankan microfinance market seems to be,
to a certain extent conservative, focusing more on a
proliferation of variations of the same traditional products
and lacking innovative approaches which could overcome
the inherent barriers in access to microfinance. Increasing
competition in the sector might provide the necessary
incentive for MFIs to innovate more in terms of products
offered, as well as in their marketing strategies.
Products
The most common products offered by microfinance
providers in Sri Lanka are savings and deposits, loans and
pawning. The figures provided in this section are as they
were reported in the survey. This section therefore reflects
the understanding of microfinance of the respondents and
their willingness to provide information. While in the case
of banks and other financial institutions a tendency to
overestimate their involvement in microfinance activities
is reflected in the data provided, in the case of TCCSs and
SUs belonging to SANASA, the data reported certainly
underestimates the involvement and importance of this
group of microfinance providers.
Savings
All SBSs, TCCSs, CRBs, RDBs and banks, as well as 89%
of the NGO MFIs and 60% of finance companies offer
savings and deposit products. An overview of the volumes
reported, number of accounts and other details such as
the interest rate on these products is presented in the table
below.
A significant problem encountered during the survey is
that respondents were not able to distinguish between the
savings and deposits of their microfinance clients. Therefore
the size of the microfinance savings portfolio was in most
cases estimated by the respondents, thus depending on
the perceptions of the respondents. Most of them defined
microfinance savings as small scale savings, without taking
the income level of the saver into consideration.
79%
68%
71%
64%
25%
39%
32%
-
14%
-
11%
4%
4%
4%
58%
55%
65%
46%
30%
29%
23%
-
7%
8%
8%
3%
10%
3%
-
-
-
-
-
-
-
-
yes
-
-
-
-
yes
64%
33%
32%
77%
25%
23%
25%
20%
10%
14%
4%
7%
-
2%
50%
67%
39%
17%
50%
-
-
33%
17%
-
-
-
-
-
26%
21%
-
5%
21%
-
-
11%
16%
21%
-
11%
5%
-
Challenges SANASA TCCSs CRBs SBSs NGOs RDBs Banks & OFIs
Delayed /non-repayment of loans
Strong competition
Inadequate MIS/poor technology/ lack of equipment
Difficulties in obtaining adequate funding
Difficulties in staff recruitment
Low profitability of MF operations
Poor local infrastructure
Lack of MF experience among staff
Inadequate demand for products/services
Difficult outreach of the target group
Security situation in the country
Regulatory environment
Political influence
Fraud

MICROFINANCE INSTITUTIONSIN SRI LANKA 20
09115
According to the survey, banks and finance companies
hold the largest share (56%) of the savings portfolio of
the microfinance providers in the sample. This is almost
entirely due to the savings portfolio of the People’s Bank,
and it would have been even larger if information regarding
the microfinance savings volume of the Bank of Ceylon
had been available. This finding supports the findings of
a household-level survey commissioned and published by
GTZ: Outreach of Financial Services in Sri Lanka, 2008
according to which around 70% of the households in
the first and second income quintiles (the lowest income
quintiles) save with the state banks.
Table 7-29 Savings portfolio
Figure 7-6 Volume of savings
Figure 7-7 Number of savings accounts
The largest number of savings accounts (39%) in the
sample was reported by CRB but due to the lower saving
capacities of their clients, they represent only 15% of
the total volume outstanding. NGO MFIs hold only a
marginal share both in terms of number of accounts (5%),
as well as of volume outstanding (3%). This is explained
by the fact that NGOs are not allowed to mobilise savings
under prevailing law although it is clear that many of them
do accept some deposits, primarily as security for loans.
Loans
All SBSs, TCCSs, RDBs and banks, as well as 99% of
CRBs, NGOs and 80% of finance companies offer a wide
range of loan products, the main characteristics of which
are presented in table 7-30
Note *Information regarding the savings and deposits offered by TCCSs was available for only 8% of the PTCCSs covered by the survey, therefore it cannot be considered to offer a representative overview of this group of MFI providers.
981,674
19,500,033
17,614,360
4,106,677
13,329,144
70,486,008
126,017,896
134,344
10,356,388
5,873,224
1,276,683
2,063,988
6,514,439
26,219,066
8,093
1,881
2,999
4,321
6,458
n/a
-
4-18
3-20
5.64-8.5
0-19.5
3-15
4-17
0-20
20-500
5-500
n/a
5-2,500
10-500
100-2,500
5-2,500
Type of institution
Volume outstanding (‘000 Rs.)
Number of
accounts
Average outstanding
balance
Annual interest rate
(%)
Minimum value
required (Rs.)
SANASA TCCSs*
CRBs
SBSs
NGOs
RDBs
Banks & OFIs
Total
SBSsTCCSsCRBs
NGOsRDBsBanks & OFIs
14%
1%
3%
15%
11%
56%
1%
22%25%
8%
5%
39%
SBSsTCCSsCRBs
NGOsRDBsBanks & OFIs

116
Figure 7-8 Volume of loans
Figure 7-9 Number of loan accounts
The largest share of the total loan portfolio in terms of
volume outstanding is held by CRBs (22%), followed
closely by NGOs (21%), RDBs (20%) and banks (18%).
In terms of the number of microfinance loans, again CRBs
have a clear lead, having in their portfolio 62% of the total
number of loans. SBSs come a distant 2nd with 15% of
the total number of loans.
Note *Information on the volume of loans outstanding and the number of loan accounts was available for only 7% and 29% respectively of SANASA TCCSs covered by the survey, therefore the figures cannot be considered to be representative of this group of MF providers.
824,151
10,829,698
7,785,071
9,876,316
9,426,380
8,849,072
573,100
48,163,788
112,460
2,783,000
656,330
375,156
311,204
225,147
10,486
4,473,783
25,825
3,631
11,862
32,175
30,290
39,304
54,654
-
4-18
2-24
14-18
0-36
6-24
8-24
15-29
0-36
1,000,000
5,000,000
100,000
500,000
3,000,000
1,000,000
500,000
100,000-5,000,000
1-96
1-180
3-60
1-60
1-60
0-120
6-60
0-180
Type of institution
Volume outstanding (‘000 Rs.)
Number of
accounts
Average outstanding balance (Rs.)
Annual interest rate
(%)
Maximum loan value
available (Rs.)
Repayment period
(months)
SANASA TCCSs*
CRBs
SBSs
NGOs
RDBs
Banks
FCs
Total
Table 7-30 Loan portfolio
With the exception of finance companies, the majority of
microfinance providers require the borrowers to have some
quantum of savings in order to qualify for a loan. Most
microfinance providers calculate the loan interest on the
reducing balance method. With the exception of NGOs,
most loan providers charge a service fee for processing the
loan application.
Table 7-31 Other loan conditions and calculation of interest
96%
62%
no
40%
83%
71%
50%
61%
97%
yes
90%
100%
71%
0%
100%
98%
yes
65%
100%
100%
50%
Type of institution Compulsory savings
Service charge
Interest calculation – reducing balance
SANASA TCCSs
CRBs
SBSs
NGOs
RDBs
Banks
FCs
Pawning
Pawning is a widespread microfinance product offered
by different types of providers of microfinance services
in Sri Lanka. Pawning is offered by all RDBs, 82% of
CRBs, 71% of banks, 40% of finance companies, 36% of
TCCSs, but only 1% of NGOs.
SBSsTCCSsCRBs
NGOsRDBsBanks
SBSsTCCSsCRBs
NGOsRDBsBanks
FCs
FCs
2%
16%1%
18%
20%
21%
5% 0% 15%
3%
7%8%
62%
22%

MICROFINANCE INSTITUTIONSIN SRI LANKA 20
09117
45,249
4,272,482
-
n/a
4,041,562
6,663,642
900,000
15,922,935
4,551
715,823
-
n/a
485,084
238,875
62,533
1,506,866
2,807
5,819
-
n/a
8,332
2,415
14,392
-
15-21
14-24
-
21
14-20
17-23
23.5
14-24
300,000
350,000
-
100,000
50,000
900,000
-
50,000-900,000
Type of institution
Volume outstanding (‘000 Rs.)
Number of
accounts
Average outstanding
balance
Annual interest rate
(%)
Maximum value available required (Rs.)
SANASA TCCSs
CRBs
SBSs
NGOs
RDBs
Banks
FCs
Total
Table 7-32 Pawing portfolio
Except for CRBs, the average outstanding balance on
pawning accounts is considerably lower than that of
loans. Pawning is used by most clients as a means of
quickly securing cash in exchange for unproductive
assets (jewellery, gold). Pawning has advantages for both
parties involved in the contract – it is simple and has low
transaction costs for the borrower and it implies very low
risks for the lender. But at the same time, clients who have
no assets of value are excluded from access to financing
through pawning.
Figure 7-10 Pawning volume
Figure 7-11 Number of pawning accounts
Banks have the highest share of the total outstanding
volume of pawns (42%), followed by CRBs (27%) and
RDBs (25%). But in terms of number of accounts, banks
have a share of only 16%, being surpassed by both CRBs
(48%) and RDBs (32%).
Leasing
With the exception of finance companies, for all other
institutional groups covered in the survey, leasing
represents only a niche product. It is offered by all finance
companies, 50% of RDBs, 29% of banks, 4% of TCCSs,
and 1% of CRBs and NGOs. The average outstanding
lease balance is considerably higher than that of loans.
RDBs FCs
48%
4%16%
32%
CRBs Banks
27%
25%
42%
RDBs FCsCRBs Banks
6%

118
n/a
19,268
-
n/a
86,344
1,057,586
4,314,000
5,477,198
n/a
202
-
n/a
1,282
9,868
20,190
31,542
n/a
95,385
-
n/a
67,351
107,173
213,670
-
15-19
12-18
-
n/a
11.9-16
8-34
15-29
8-34
500,000
165,000
-
n/a
1,500,000
200,000
500,000
165,000-1,500,000
Type of institution
Volume outstanding (‘000 Rs.)
Number of
accounts
Average outstanding balance (Rs.)
Annual interest rate
(%)
Maximum value
available (Rs.)
SANASA TCCSs
CRBs
SBSs
NGOs
RDBs
Banks
FCs
Total
Table 7-33 Leasing portfolio
Insurance
As in the case of leasing, with the exception of insurance
companies, this product is hardly offered by any other
institutional group: 28% of NGOs, 18% of TCCSs, two
CRBs, one finance company, and one bank. Considering
the fact that micro insurance is of very recent date, an
increase in its importance is expected. Around a fifth of
respondents in most institutional groups have reported
they plan to add insurance products to their microfinance
product portfolio. It is not clear whether they plan to offer
their own products (which they are not legally allowed
to do) or retail the products of registered insurance
companies.
Table 7-34 Insurance portfolio
30,319
4,878
-
53,207
-
400
-
100,279
189,083
406
27,122
-
39,630
-
6,000
-
127,200
200,358
1.336
5,560
-
1,373
-
15,000
-
1,268
-
Type of institutionVolume
outstanding (‘000 Rs.)
No. of policies
Average outstanding balance (Rs.)
SANASA TCCSs
CRBs
SBSs
NGOs
RDBs
Banks
FCs
ICs
Total
Product development
Product development is mostly performed at a central
level with inputs from the staff of the branches. Collecting
inputs from the local branches is important in designing
products which correspond to the needs of the customers.
Although the survey reveals a widespread practice of
consultation, the weight associated by each respondent to
the inputs received from their local representatives is not
known.
61%
46%
25%
14%
-
72%
15%
11%
1%
1%
yes
-
-
-
-
64%
13%
19%
10%
7%
50%
33%
33%
-
-
74%
5%
5%
-
5%
Product developmentSANASA TCCSs
CRBs SBSs NGOs RDBsBanks
& OFIs
At central (head office) level with inputs from all branches
At individual branch level by an internal team
At individual branch level by the manager
By an external consultant
Board of Directors
Table 7-35 Product development process

MICROFINANCE INSTITUTIONSIN SRI LANKA 20
09119
In the case of all groups of institutions, considerably more
products have been introduced than withdrawn from the
market within the last two years. SBSs and RDBs seem
to have been most active in introducing new products to
the market, while at the same time keeping all existing
products as well. This shows a tendency towards product
proliferation, with little attention given to the profitability
of individual products.
Table 7-36 Products introduced / withdrawn
0.3
0.1
0
0.2
0
0.5
2.4
1.6
4
2.2
4.3
3.6
79%
77%
yes
83%
83%
74%
Type of institutionNew products in the last 2
years (average)Withdrawn products in the
last 2 years (average)New products planned
(yes)
SANASA TCCSs
CRBs
SBSs
NGOs
RDBs
Banks & OFIs
Around 80% of the respondents from each group of
institutions have stated they plan to add new products
to their microfinance product portfolio. However, when
asked to elaborate on the type of products to be introduced,
the majority of them cited traditional products, with only
a minority quoting money transfer services, pension
products or leasing. This suggests a low level of innovation
among most respondents.
Table 7-38 Product delivery mechanisms
86%
29%
11%
96%
23%
9%
yes
yes
-
61%
43%
42%
100%
33%
33%
84%
53%
21%
Product delivery SANASA TCCSs CRBs SBSs NGOs RDBs Banks & OFIs
Direct delivery through own outlets
Delivery through field officers
Delivery through links with other institutions
Product delivery
Microfinance products are mainly delivered through the
branch network of the MFIs. A considerable number
utilise their field officers for delivery at the field level itself,
which has the advantage of reducing the barriers to access
for low-income clients who might be less mobile and find
it difficult to bear the cost of travel to the branch. Links
with other institutions also play an important role in
product delivery for NGOs and RDBs.
Product delivery and marketing
Table 7-37 Planned new products
73%
95%
55%
41%
14%
18%
14%
9%
-
85%
83%
33%
48%
6%
6%
10%
3%
3%
-
-
yes
yes
yes
-
-
yes
-
49%
83%
7%
4%
6%
23%
6%
1%
-
80%
100%
20%
20%
20%
20%
-
-
-
36%
43%
14%
14%
29%
29%
14%
21%
-
New products planned SANASA TCCSs CRBs SBSs NGOs RDBs Banks & OFIs
Savings products
Loan products
Fixed deposits
Pawning
Leasing
Insurance
Pension products
Money transfer services
Bill payments

120
Table 7-39 Product marketing strategies
Marketing tools and strategies
The marketing instruments most widely employed by
microfinance providers are printed material such as
leaflets, banners and posters and also hoardings. Around
two thirds of respondents from all institutional groups
with the exception of NGO MFIs, have stated that these
are their most used marketing tools. The most preferred
marketing strategy depends on the particular characteristics
of the institutions. NGO MFIs and SANASA TCCSs rely
mostly on clients or members to promote their products
to potential clients, while CRBs use printed leaflets and
also work through the non-microfinance activities of
MPCSs, RDBs, and banks and other financial institutions
rely mostly on printed material as well as on door step
marketing by field officers.
7. Human Resources
Given the door-step banking approach typical of
microfinance, human resources play an important role
in the provision of microfinance services. This section
presents the data collected on the human resource profile
of microfinance providers and addresses issues faced by the
sector in relation to recruitment, retention and training of
microfinance staff.
Staff figures
In terms of the total staff employed within each institutional
group, banks and other financial institutions are by far the
group with the most number of staff. This is an expected
result, since banks serve a large number of clients, most of
which do not fall under the microfinance classification.
However, when considering the staff allocated to the
microfinance activities of these institutions, CRBs have
the lead, followed by NGOs. As CRBs have the largest
reported number of microfinance accounts (both savings
and loans) the large number of staff may be justifiable. The
large number of staff in NGO MFIs may be explained in
part by the attention given by this group of institutions
to non-financial, ‘credit plus’ services which are generally
staff intensive.
71%
54%
46%
100%
64%
36%
21%
-
-
-
76%
68%
30%
67%
73%
20%
10%
-
-
-
yes
yes
yes
yes
yes
-
yes
yes
yes
-
31%
25%
30%
89%
42%
36%
13%
4%
4%
-
100%
100%
83%
-
-
50%
50%
17%
17%
33%
68%
68%
68%
11%
-
42%
58%
63%
58%
42%
Marketing strategies SANASA TCCSs CRBs SBSs NGOs RDBs Banks & OFIs
Leaflets
Banners/ posters/ hoardings
Door step marketing by field/ community development officers
Promotion through clients/ members
Through the non-MF activities of your organization
Joint programs with other institutions
Advertised in news papers/ magazines/ newsletters
Advertised on radio
Advertised on TV
Cross selling with other bank products

MICROFINANCE INSTITUTIONSIN SRI LANKA 20
09121
Table 7-40 Staff complement
n/a – not available;
An interesting finding of the survey is that only a minority
of the respondents (between 12 and 28%) who provided
this information have reported their microfinance staff
are exclusively involved in their microfinance operations.
A stricter delimitation of the different activities and a
higher degree of specialisation within the institution could
increase the productivity of microfinance staff.
Composition of staff
There are significant differences in the type of employment
offered to microfinance staff across the different groups
of institutions. While in the more traditional finance
institutions, such as banks, finance companies, and
regional development banks, the majority of microfinance
staff is employed on a permanent basis, member-
owned institutions rely more on temporary staff and on
volunteers. The percentage of volunteer staff (amounting
to 94% of the microfinance staff) is highest in the
SANASA TCCSs.
Figure 7-12 Type of employment
Figure 7-13 Composition of microfinance staff
With the exception of SANASA TCCSs, between a fifth
and a third of the microfinance staff of other institutional
types holds managerial positions. The case of the SANASA
TCCSs is a special one, with 69% of the microfinance
staff reported to hold managerial positions. This could be
explained by the small size of the majority of TCCSs, which
suggests that managerial staff is involved in a broader range
of operational activities, which are traditionally performed
by non-managerial staff in larger organisations. Another
explanation could be linked to the large share of volunteer
staff to which these positions are awarded more liberally,
having also the function of a non-pecuniary reward.
The proportion of credit and field officers varies significantly
across institutions (from 7% to 47%), depending on the
particular mechanisms of product delivery and on the
procedures in place for loan assessment and approval.
CRBs
SBSs
NGOs
RDBs
Banks & OFIs
Total
657
2,797
20,077
6,500
7,273
1,554
6,894
45,752
100%
100%
100%
45%
82%
81%
18%
67%
n/a
n/a
12%
n/a
28%
17%
16%
-
Type of institution Total staff Exclusively involved in microfinanceactivities
Of which, microfinance staff
No. % of total staff
SANASA TCCSs657
2,797
20,077
14,500
8,856
1,926
39,173
67,909
0%10%20%30%40%50%60%70%80%90%
100%
SBSs TCCSs CRBs NGOs RDBs Banks FCs ICs
Volunteer Time bound Permanent
100%
94%
1%
14%
15%
71%
21%
11%
63%
6%
94%
4%
96%
2%
98%
21%
79%
5%
Suport staff Credit / field officers Clerical Managerial
0%10%20%30%40%50%60%70%80%90%
100%
TCCSs-SUs
PTCCSs CRBs NGOs RDBs Banks FCs ICs
14%
35%
25%
26%
4%
69%
8%
19%
24%
30%
39%
7%
16%
21%
16%
47%
9%
21%
28%
42%
11%
29%
26%
33%
10%
18%
29%
42%
7%
28%
24%
42%
SUs PTCCSs

122
Table 7-41 Requirement Issues
Challenges
One of the purposes of the survey was to identify the
challenges faced by microfinance providers regarding staff
recruitment and retention. This section highlights the
main findings in this respect.
Recruitment
The respondents have identified similar recruitment
challenges for all three types of positions – managerial,
clerical and credit / field officer. The absence of retirement
benefits, the difficulty of finding people with the necessary
skills and with microfinance experience, as well as operating
in unattractive locations have been identified by most
respondents to be major challenges in the recruitment of
staff for their microfinance operations.
HR recruitment issues SANASA TCCSs
CRBs
SBSs
NGOs
RDBs
Banks & OFIs
Absence of a pension
scheme (retirement
benefits)
M** 50% yes 63% 27% 33% 11%
C** 43% - 60% 17% 33% -
C/FO** 36% - 61% 24% 33% 11%
Finding skilled people M 50% yes 52% 53% 17% 37%
C 39% - 49% 39% 17% 47%
C/FO 36% - 51% 50% 17% 50%
Finding people with
microfinance experience
M 46% yes 29% 36% 17% 26%
C 46% - 29% 28% 17% 16%
C/FO 39% - 34% 32% 17% 17%
Unattractive locations M 36% - 44% 19% 17% 5%
C 25% - 43% 13% 17% 5%
C/FO 18% - 42% 19% 17% 11%
Attractive packages
offered in other
companies
M 57% yes 51% 41% - -
C 46% - 51% 27% - -
C/FO 46% - 55% 36% - -
Microfinance not
considered an attractive
career option
M 25% - 20% 10% 17% 11%
C 14% - 21% 5% 17% -
C/FO 21% - 20% - 17% -
Finding people in the
desired age category
M 25% - 16% 8% - 37%
C 21% - 18% 10% - 11%
C/FO 14% - 22% 5% - 17%
Employment conditions
(probation, contract etc.)
M 21% - 6% 11% - -
C 25% - 6% 8% - -
C /FO 14% - 7% 11% - -
Poor working conditions M 18% yes 13% 1% - 11%
C 21% - 16% 1% - 16%
C/FO 18% - 15% - - 11%
Nepotism / Political
interference
M 18% - 14% - 33% -
C 18% - 12% - 33% -
C/FO 14% - 10% - 33% -
Note * The respondent reported no difficulties in the recruitment of Samurdhi Development Officers ** M – managerial; C – clerical; C/FO – credit / field officer.

MICROFINANCE INSTITUTIONSIN SRI LANKA 20
09123
Retention
Inadequate remuneration and incentives, together with the
lack of technology were the main challenges mentioned
by TCCSs, CRBs and NGOs when it comes to retaining
qualified staff in the organisation. Interestingly, the first
two were also mentioned by over a third of banks and
other financial institutions who are normally known to
offer attractive remuneration and incentive packages to
their staff. The difficult nature of field operations was
mentioned by half of the RDBs and by a quarter of banks
and other financial institutions.
Table 7-42 Retention Issues
Table 7-43 Incentives offered
64%
64%
61%
32%
39%
21%
14%
14%
4%
71%
63%
78%
17%
29%
36%
12%
13%
7%
-
-
yes
-
-
-
-
-
-
64%
40%
30%
41%
14%
23%
5%
5%
10%
-
17%
-
50%
-
-
-
17%
17%
37%
37%
-
26%
-
21%
11%
16%
11%
HR retention issues SANASA TCCSs CRBs SBSs NGOs RDBs Banks & OFIs
Inadequate remuneration
Inadequate incentives
Lack of technology
Difficulty nature of field operations
Incompatibility with new technology
Work overload
Lack of operational flexibility
Microfinance not considered an attractive career option
Difficulty of teamwork
Incentives
Almost all respondents have cited training opportunities
to be one of the most important incentives offered to their
microfinance staff. In addition to this, the majority of
respondents have mentioned the existence of performance
appraisals and performance linked rewards schemes as
incentives offered to their microfinance staff. However,
considering the retention challenges mentioned above, it
would seem that the incentive structures offered do not
meet the needs of the staff.
93%
50%
57%
43%
43%
-
36%
39%
36%
11%
18%
7%
93%
56%
68%
34%
35%
67%
26%
66%
19%
13%
13%
9%
yes
-
yes
-
yes
-
-
-
yes
-
-
-
81%
52%
52%
33%
18%
2%
59%
22%
24%
14%
39%
20%
100%
100%
83%
33%
67%
100%
50%
83%
50%
50%
100%
68%
89%
79%
42%
26%
58%
47%
58%
42%
5%
5%
58%
Incentives SANASA TCCSs CRBs SBSs NGOs RDBs Banks & OFIs
Training opportunities
Performance appraisals and rewards
Remunerative incentives
Other subsidies (funeral assistance, work uniforms etc.)
Distribution of revenue (stock, shares etc)
Staff loans at concessionary rates
Moral incentive (the right thing to do)
Overtime pay
Workman compensation for sickness, accidents
Free or subsidised meals
Free or subsidised transportation
Reimbursement of medical expenses
Staff development – Training
Microfinance providers offer their staff training
opportunities covering different key areas. The following
table depicts the main training areas offered to managerial
staff.

124
Table 7-44 Training
Table 7-45 Number of training programs
81%
81%
81%
73%
58%
58%
69%
69%
69%
65%
50%
67%
62%
52%
60%
54%
38%
44%
44%
36%
48%
28%
yes
yes
yes
-
yes
yes
yes
yes
-
-
yes
81%
80%
67%
52%
41%
53%
52%
51%
45%
48%
43%
83%
100%
100%
67%
100%
100%
100%
83%
100%
100%
67%
50%
50%
67%
61%
61%
61%
56%
17%
33%
11%
56%
Key training areas – managerial staff SANASA TCCSs CRBs SBSs NGOs RDBs Banks & OFIs
Human resource development/ people & productivity
Project management
Business Planning
Customer care
Marketing / promotional
Risk management
Profitability monitoring
Record keeping
Costing
Credit evaluation
IT skills
Managerial staff receives a broad range of courses n a
variety of subjects, which hints to a lack of focus on
relevant issues corresponding to their activities and
responsibilities. Courses such as customer care, record
keeping and marketing are more relevant for other staff
categories than for managers. The lack of focus on training
relevant to the nature of duties is also manifested in the
training offered to other staff categories (clerical, field /
credit officers). Microfinance providers should strive to
achieve better correlation between the training needs of
their staff and the training offered to them in order to
improve the capabilities of their staff to address current
issues and challenges.
Managers also benefit from the largest average number of
training sessions a year across all microfinance institutional
groups. Banks and other financial institutions have by far
the highest number of training sessions per institution,
while CRBs seem to offer the least training opportunities
to their microfinance staff.
Despite efforts to gather information regarding the
financial performance of microfinance providers in
Sri Lanka, a clear picture in this regard could not be
obtained. The situation with regard to the availability and
quality of financial information on the different types
of microfinance institutions has been presented in the
individual chapters in the report. However, in general, the
main issues encountered can be summarised as follows:
Lack of transparency. Reluctance to disclose financial
information was widespread. The general perception
seems to be that keeping this kind of information private
represents an advantage over competitors. Donor can
play an important role in stimulating more transparency
among microfinance providers.
8. Financial Performance
5
4
3
2
7
4
3
2
3
3
3
2
n/a
n/a
n/a
n/a
6
4
7
3
7
5
5
3
16
8
9
4
Average number of training courses CRBs SBSs NGOs RDBs Banks & OFIs
Managerial staff
Clerical staff
Credit / field officers
Support staff
SANASA TCCSs SUs PTCCSs

MICROFINANCE INSTITUTIONSIN SRI LANKA 20
09125
Lack of microfinance specific data. Many of the
institutions covered by the survey are not engaged
exclusively in microfinance and the majority of them
do not gather specific information pertaining to their
microfinance operations. This is also true of regulated and
supervised microfinance providers, such as RDBs, banks
and other financial institutions, for which overall financial
information is periodically published.
Poor data quality. Even when microfinance specific data
was available and was disclosed, there were serious quality
issues. This was especially the case with smaller institutions
– some CRBs, TCCSs and NGOs.
Lack of comparability. Even when financial data was
available, a lack of standardisation in the classification of
financial data and different definitions of certain concepts
made the computation of financial performance indicators
of little practical value, as they lacked comparability.
We conclude that there is substantial room for improvement
in the processes of financial data collection, monitoring
and disclosure in the microfinance sector in Sri Lanka. All
stakeholders should commit to this objective in order to
ensure the long-term viability of the sector.

126
From the information gathered in the survey, a complex,
yet fragmented picture of the microfinance sector in Sri
Lanka emerges. The outreach of microfinance services,
especially savings and deposits is considerable, financial
services being often accompanied by non-financial
facilities. Access to loans remains under its potential,
with barriers remaining for the lower income groups.
The microfinance market seems to be characterised by a
proliferation of traditional products (savings, loans) and
little innovation. The growth of the microfinance sector
is hampered by the lack of a coherent regulatory and
supervisory framework, governance issues, inadequate use
of modern technology and staff related issues.
Main strengthsExtensive geographical coverage. Microfinance providers
have an extensive network in the country with over 10,800
outlets covered during the present survey. The SANASA
movement has the largest number of active outlets,
followed by NGOs (with over 2,000 CBOs affiliated to
SEEDS). The largest share of these outlets is found in the
Southern Province and in the rural sector.
All groups of institutions with the exception of banks
and other financial institutions display strong correlations
between the sectoral distribution of outlets and poverty
distribution. The tightest correlation between the regional
distribution of outlets and poverty distributions is
displayed by CRBs, followed closely by SBSs and TCCSs.
Therefore it seems the outlet network of the co-operative
sector, as well as that of the Samurdhi programme is in a
good position to reach the country’s poor. A surprisingly
low degree of correlation is displayed by NGO MFIs, a
situation which can be explained by the high concentration
of this sector in the Southern and North-Central provinces
compared to their corresponding PBPL share, and the low
presence in provinces with high poverty incidence such as
Uva and Sabaragamuwa.
Traditional microfinance products are offered by a large
number of MFIs. Although microcredit is an important
component, a broader range of financial services is offered
such as savings, pawning, leasing, and insurance and
pension products. All SBSs, TCCSs, CRBs, RDBs and
banks, as well as 89% of the NGO MFIs and 60% of
finance companies offer savings and deposit products. All
SBSs, TCCSs, RDBs and banks, as well as 99% of CRBs,
NGOs and 80% of finance companies offer a wide range
of loan products. Pawning is offered by all RDBs, 82%
of CRBs, 71% of banks and 40% of finance companies,
while leasing and insurance products represent only niche
products except for the finance and insurance companies,
respectively. The microfinance market seems to be
characterised by a high degree of competition, especially
in the savings and deposits segment.
Credit-plus services. A large number of microfinance
providers (95% of NGOs, 92% of CRBs, 86% of
TCCSs and banks, 83% of RDBs and 64% of SANASA
secondary unions) have stated they offer complementary
non-financial services to their microfinance clients.
These services mainly include training and skills
development, financial advisory services, group formation
and mobilisation, business development services and
marketing assistance.
Significant savings culture. Microfinance providers
covered by the present survey have reported a total of
over Rs. 126 billion in volume outstanding of savings and
deposits and over 26 million savings accounts. While these
figures are likely to be slightly overestimated since some
of the respondents have included all small size savings
irrespective of the income of the saver, they nevertheless
point to a significant savings culture in Sri Lanka.
Major challengesFor microfinance providers
Outreach to the lower income groups. Only a small share
of the microfinance clients falls within the definition of
lower income groups, even though a large majority of
microfinance providers mentioned that they specifically
target this group. Even in the case of NGO MFIs, only
half of their clients have a monthly household income not
exceeding Rs. 3,000. This group of borrowers accounts
Conclusions

MICROFINANCE INSTITUTIONSIN SRI LANKA 20
09127
for 25% of the clients of CRBs, 20% of the clients of
SANASA TCCSs and 19% of the clients of RDBs. As
expected, banks and other financial institutions involved
in microfinance have the lowest outreach among the
poorest layer of clients: only 7% of their customers have
a monthly household income below Rs. 3,000. The same
ranking in terms of outreach to the lower income group
is maintained even if the threshold income level is raised
to Rs. 5,000.
Expanding lending activity. Many microfinance providers
focus extensively on savings and do not fully exploit the
resources thus mobilised to extend credit to finance the
income generating activities of their microfinance clients.
The ratio of loans to savings is one to 2.6 in terms of
volume outstanding and one to 5.9 in terms of number
of accounts. If the number of clients is considered,
excluding the number of loan accounts of CRBs (since
client information for this group was not available), the
proportion of loan accounts to the total number of clients
is extremely low (one loan to every fourth client).
The causes behind this situation remain largely unknown
and a subject for further research. Possible explanations for
this situation could be a shortage of deposit funding due
to legal restrictions coupled with reduced donor funding
in the case of certain institutions (such as NGOs) coupled
with the investment of the savings received by large deposit
takers (such as CRBs, SBSs) in other activities besides
lending. Some respondents have also mentioned the low
absorption capacity of the target group for such loans.
Despite microcredit being essentially a non-collateralized
lending business, the survey found that many providers
of microcredit do impose collateral and other conditions
which can have a restrictive effect on the utilisation of the
credit facilities on offer.
Bring innovative products to the market. The Sri
Lankan microfinance market seems to be to a certain
extent conservative, focusing more on the proliferation
of variations of the same traditional products, lacking
innovative approaches which could overcome the inherent
barriers in access to microfinance.
Staff recruitment and retention. Most of the microfinance
providers covered by the present survey have reported
difficulties in recruiting and retaining experienced staff. The
absence of retirement benefits, inadequate remuneration
and incentives, operating in unattractive locations, mostly
lacking modern technology, as well as the difficult nature
of field operations, were mentioned as reasons.
Financial performance monitoring. The majority of the
microfinance practitioners interviewed do not have an
adequate mechanism in place to monitor the financial
performance of their microfinance activities. A considerable
number of them do not keep separate records for their
microfinance activities, or if they do, not all microfinance
related costs are attributed to the activities which have
generated them. The lack of comprehensive performance
monitoring is a significant barrier to the achievement of
long term sustainability.
Governance. Interference of political interests in the
appointments of Directors and senior management and
in the day to day management of MFIs can endanger
their viability. This is particularly applicable in the case
of government owned/controlled microfinance providers.
Furthermore, microfinance activities in the case of a large
number of institutions are intertwined with other types
of activities (CRBs with the activities of Multi-Purpose
Cooperative Societies, SBSs with welfare schemes, NGOs
with social activities), which can result in conflict of
interests and objectives.
For policy makers
Regulation and supervision of microfinance institutions.
The absence of a coherent regulatory and supervisory
framework for the microfinance sector represents a barrier
to its development. A number of issues can be identified:
A large group of
microfinance providers (NGOs) escapes financial
regulation and supervision. Since most of the
NGOs mobilise savings either directly as deposits
or disguised as member shares, they should be
monitored by an external independent authority in
order to protect the interest of depositors.
The government
microfinance scheme (Samurdhi) is self-regulated
and self-supervised. In the absence of an independent
regulator and supervisor the scheme risks being
used to pursue political objectives to the detriment
of long term sustainability and sound financial
development.

128
A number of different
authorities (Central Bank of Sri Lanka, Department
of Cooperative Development, Samurdhi Authority
etc) are responsible for the regulation and supervision
of various microfinance providers. Considering that
all these groups offer similar products targeted at the
same market, the lack of coordination and coherence
of measures can result in considerable distortions of
the competition.
Doubtful quality. International best practices
regarding regulation and supervision are not always
adhered to, especially in the case of the cooperative
sector.
The
existing regulatory and supervisory framework has
been created with a broader view of financial services
and is not adapted to microfinance specificities.
The need for a coherent regulatory and supervisory
framework adapted to the necessities of the
microfinance sector is vital.
A surprising finding
of the survey is the lack of knowledge among
respondents (representatives of senior and middle
management of the MFIs interviewed) regarding
their regulatory status and the responsible authority
for regulation and supervision of their operations.
Sectoral strategies and policies. The microfinance sector
in Sri Lanka is characterised by significant fragmentation
and lack of coherence. The operating MFIs, especially in
the cooperative sector, have a large unexploited potential
which could be channelled in the right direction through
the adoption of an articulate development strategy.
International best practices. In terms of governance,
portfolio management, human resource management and
financial performance monitoring, standard international
practices are not observed in the case of a large majority
of the microfinance providers. Policy makers should focus
on creating the right incentives for the adoption of such
best practices.
For donors
Support transparency and information disclosure. One
of the main difficulties encountered in conducting the
survey for this report, was the reluctance of microfinance
providers to disclose even non-sensitive information about
their operations. Most MFIs are not willing to share any
information among themselves, even when they are not
direct competitors. Donors can play an important role in
stimulating transparency in the sector.
Support access to technology. The lack of information is
also a consequence of the lack of modern technology in
a large proportion of microfinance providers. Member-
based societies such as SANASA TCCSs and CRBs
almost entirely lack access to modern communication
technologies (email, internet facilities). Together with
the lack of language skills among staff this represents an
important barrier to best practice dissemination within
the sector.
Support capacity development measures. Microfinance
practitioners have often mentioned staff related issues
among the challenges faced. The minimum education
and experience requirements are low for most MFIs. A
large proportion of the microfinance staff does not have
the necessary language skills and access to technology in
order to be informed on international best practices.
This report aimed to fill the information gap in the sector
and to shed more light on the supply of microfinance
services in Sri Lanka. Its broad coverage of the sector
makes it a useful tool for all stakeholders. However, the
present report has several limitations:
despite our best efforts was that related to the
financial performance of the sector. Financial
information could either not be obtained from the
respondents or, when obtained, it was not usable (no
microfinance specific information or low quality of
data).
Samurdhi Authority level, which makes comparison
with information obtained at a more decentralised
level (e.g. for SANASA, CRBs) difficult.

MICROFINANCE INSTITUTIONSIN SRI LANKA 20
09129
information available at secondary union level
(especially quantitative information) was limited.
Most TCCSs do not report client and product data
to secondary unions.

130
