importance of reliable oil & gas data: update on us gom...
TRANSCRIPT

1
The Peak summit Alcatraz free university 27 June 2009 Corrected 1st July 2009 Importance of reliable oil & gas data: Update on US GOM data by Jean Laherrere ASPO France Long paper to be reduced for my presentation via Skype Most discussions on Peak Oil come from the fact that technical data is confidential and that published data is wrong because it is political (OPEC quotas) or financial (obsolete SEC rules which will change in 2010 allowing the up to now forbidden report of probable reserves). The only places where technical data is published are in UK (BERR), Norway (NPD) and federal US (MMS). US federal GOM is very interesting because the importance of world reserve growth in most publications, following the wrong USGS 2000 estimate where the US reserve growth (mainly from old onshore fields, some being unconventional such as Midway-Sunset) from proven current reserves (SEC obsolete rules) was extrapolated to the rest of the world 2P backdated reserves. This unscientific extrapolation led to believe in large world reserve growth! US GOM is a good place to study US “reserve growth”. MMS (Mineral Management Services with USDOI) is obliged to report all field data coming from the operators who are supposed to tell the truth. But its field database is reported with 3-4 years delay. The field data at end 2005 (MMS2009-012) was published in May 2009. We will see that unfortunately it is incomplete in part 1. The last survey on oceanic hydrates was carried in the GOM in May 2009 and a very optimistic report was issued, despite the lack of core as shown in part 2. Without core, reserve estimates are highly unreliable; in fact no estimate should be reported. -Part 1: Oil & gas fields What is deepwater? Its limit in water depth varies from 656 to 1500 ft (200 to 457 m). Royalties vary with water depth: 0-200m, 201-400 m, 401-800m, over 1000m and deepwater is defined as >200m (Outer Continental Shelf Deep Water Royalty Relief Act 1995), because MMS, being a federal agency, is obliged since 1993 to use the SI of units. The Energy Policy Act of 2005 has introduced new royalty suspension categories: 1600-2000 m (5249 to 6562 ft) and > 2000 m (6562 ft). But in MMS technical reports, to please the industry, deepwater is defined as >1000 ft (305 m) and ultra-deepwater is > 5000 ft (1525 m). But EIA deepwater is > 200 m. IHS frontier data for GOM is over 400 m. -1-1-Past production For 2007, oil and gas from the GOM represents 25% and 14% of US production: Figure 1: US oil and gas production: GOM share

2
What is the GOM past production? Natural gas (1 boe = 5.62 kcf) production displays a bumpy plateau from 1980 to 2000, when oil peaked in 2003. Figure 2: GOM annual oil & gas production 1947-2008
The state (Louisiana & Texas) oil production is negligible in front of federal production. Deepwater production is now 76% of GOM oil production in 2007. Figure 3: GOM crude oil production

3
MMS forecasts production using industry committed projects for the short term and undiscovered estimates (full potential) for the middle term. Figure 4: GOM Federal offshore oil production & MMS forecasts 1992-2018
A new peak is forecasted for oil around 2012. GOM natural gas production is declining (in 2005 Katrina worsened it). Deepwater represents 40 % in 2006. Figure 5: GOM Federal offshore natural gas production from EIA

4
MMS forecasts a natural gas decline for the next 10 years from industry in committed projects. Figure 6: GOM Federal offshore natural gas production & MMS forecasts 1992-2018
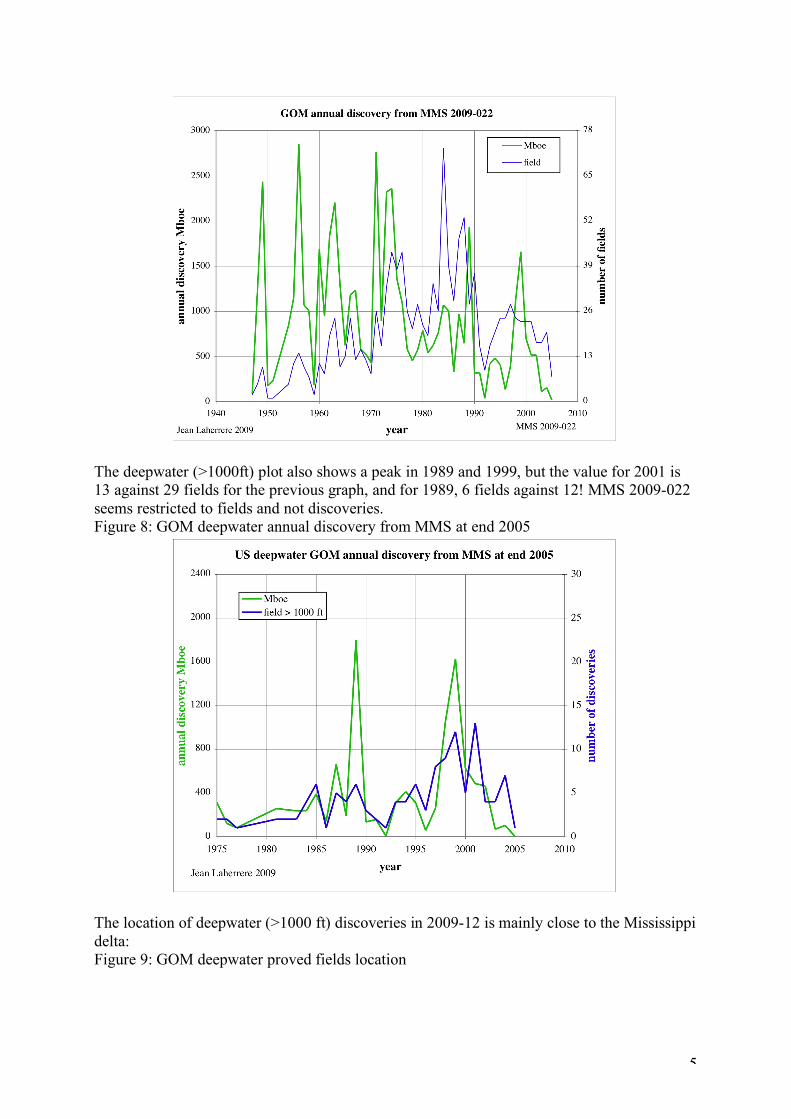
A possible increase is forecasted if large undiscovered reserves exist, but the creaming curve (see below) does not look too good with only one cycle of discovery trend (except for a new deep gas cycle). -1-2-Reserves For the whole GOM from MMS2009-022, the peak in number of discoveries is in 1984 (73) and in volume in 1956 (2,8 Gboe): Figure 7: GOM annual discovery from MMS 2009-022
5
The deepwater (>1000ft) plot also shows a peak in 1989 and 1999, but the value for 2001 is 13 against 29 fields for the previous graph, and for 1989, 6 fields against 12! MMS 2009-022 seems restricted to fields and not discoveries. Figure 8: GOM deepwater annual discovery from MMS at end 2005
The location of deepwater (>1000 ft) discoveries in 2009-12 is mainly close to the Mississippi delta: Figure 9: GOM deepwater proved fields location

6
Frontier scout data reports only discoveries for water depth deeper than 400 m and they are compared to MMS at end of 2005: Figure 10: GOM >400 m cumulative discovery from MMS & scout (corrected)
The difference (7 Gboe & 120 fields) is so large that it should be an explanation! It seems obvious that MMS 2009-022 reports only proved fields and not discoveries and is incomplete for the recent years. The breakdown into oil and gas shows at end 2005 a difference of 5 Gb for oil and 2 Gboe for gas. MMS is still reporting only proved reserves when scout reports 2P. Figure 11: GOM >400 m cumulative oil & gas discovery from MMS & scout (corrected)

7
It is a pity because MMS GOM field data is the most complete database in the world with UK and Norway files and should be the base of studies to be applied to the rest of the world. However the synthesis from this MMS data leads to the following forecasts. -1-3-discovery fractal display The fractal display (cumulative discovery versus size rank in a log-log scale) is obviously parabolic when corrected and a parabola can be taken as a model of what is in the ground. MMS field data ranks as largest field MC 807 but in fact they gather two fields: Mars (1989) and Ursa (1990) operated by the same operator, despite the fact that in other reports they report them separately. The corrected display with plot every 10 years shows that contrary to most fractal display, if the largest (the largest, Mars, was found in 1989, and the second, Thunder Horse, was found in 1999) are found first, there are still large fields to be found: Figure 12: GOM MMS oil discoveries parabolic fractal distribution & model

8
Using the parabolic model an ultimate of 33 Gb can be estimated. MMS gas field reserves at end 2005 is plotted as a fractal display and the display is more like the usual ones with large fields found first (before 1985) and the recent fields are mainly small fields. Figure 13: GOM MMS natural gas discoveries parabolic fractal distribution & model
-1-4-creaming curve The creaming curve = cumulative discovery versus the cumulative number of New Field Wildcats (or of fields when NFW are not available) is the best tool to estimate ultimates, but

9
field reserves must be the mean values (or 2P) and not the proven values (1P) used by MMS to follow the obsolete SEC rules (in 2010 SEC will allow to report 2P, meaning that the past reporting was wrong, leading to artificial reserve growth). The creaming curve for 1947-2005 is easily modelled for natural gas with one cycle for an ultimate of 36 Gboe or 200 Tcf. I do not know enough about deep gas geology to foresee a new cycle for deep gas! For oil three cycles are needed, leading to a possible fourth cycle (subsalt?). Minimum oil ultimate (no new cycle) is estimated at 23 Gb. Figure 14: GOM MMS creaming curves at end 2005
The creaming curve plotted at end of 1998 was extrapolated for an ultimate of 190 Tcf for gas and only 17 Gb for oil (the large deepest water fields were not drilled yet). Figure 15: GOM MMS creaming curves at end 1998
10
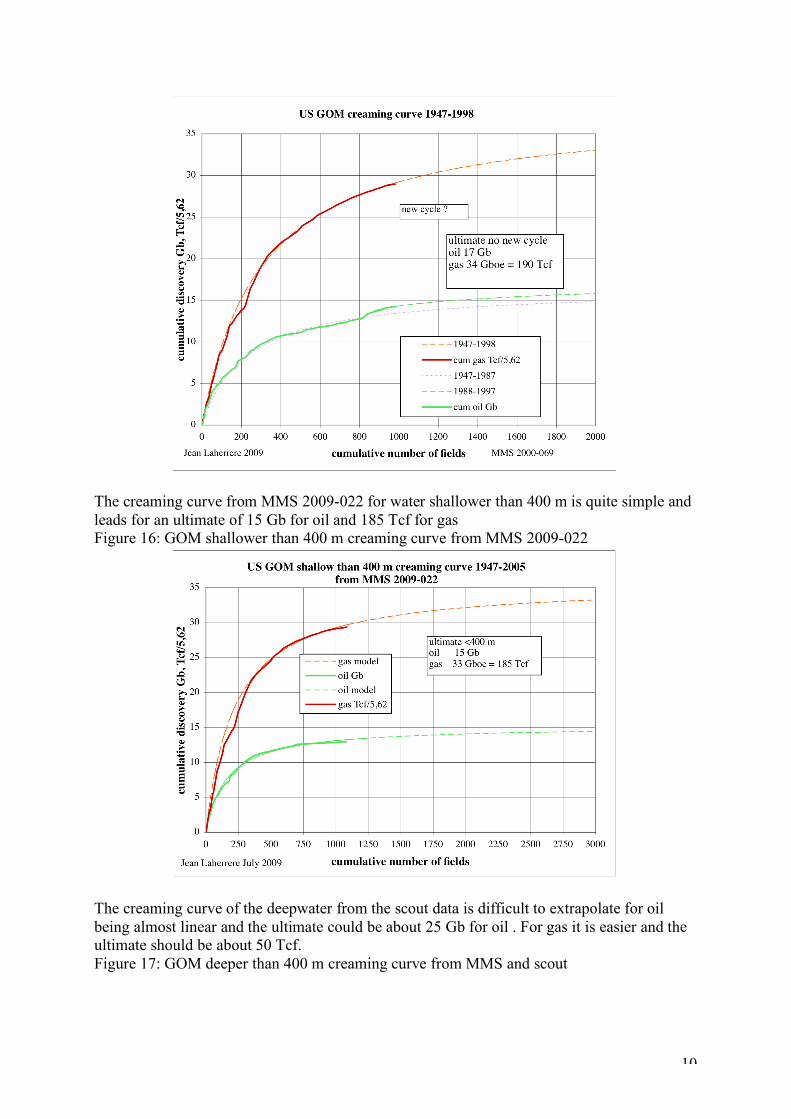
The creaming curve from MMS 2009-022 for water shallower than 400 m is quite simple and leads for an ultimate of 15 Gb for oil and 185 Tcf for gas Figure 16: GOM shallower than 400 m creaming curve from MMS 2009-022
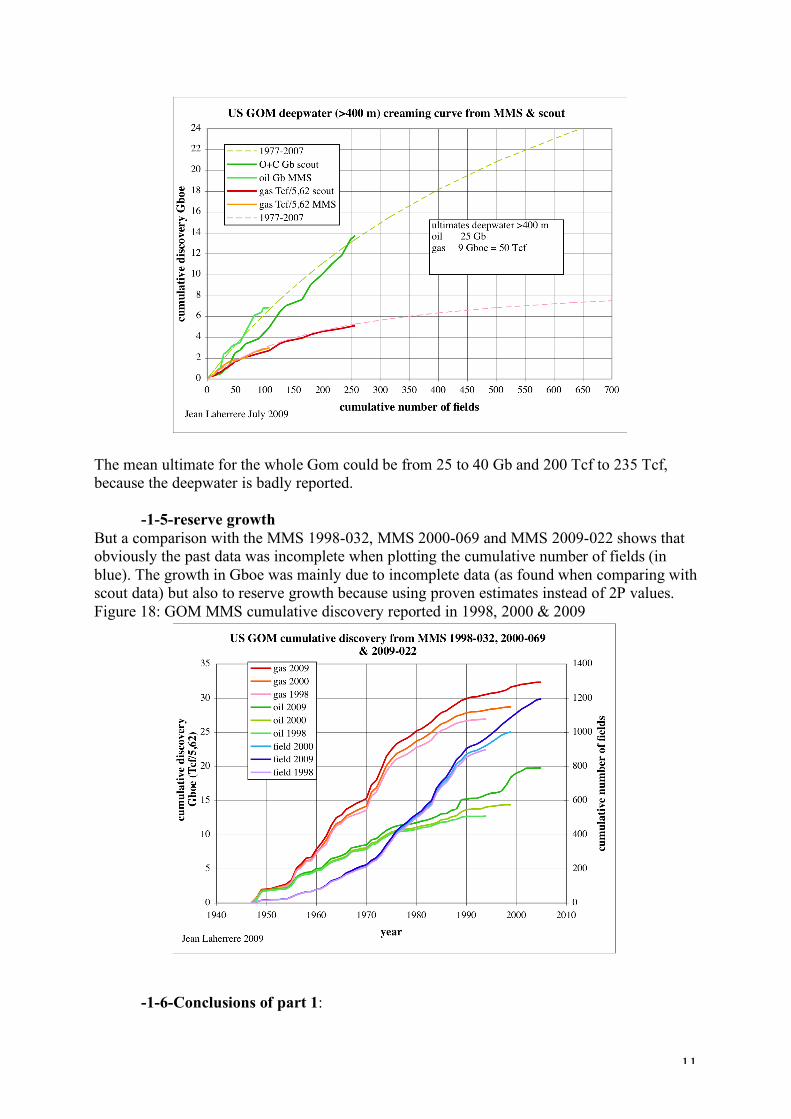
The creaming curve of the deepwater from the scout data is difficult to extrapolate for oil being almost linear and the ultimate could be about 25 Gb for oil . For gas it is easier and the ultimate should be about 50 Tcf. Figure 17: GOM deeper than 400 m creaming curve from MMS and scout
11
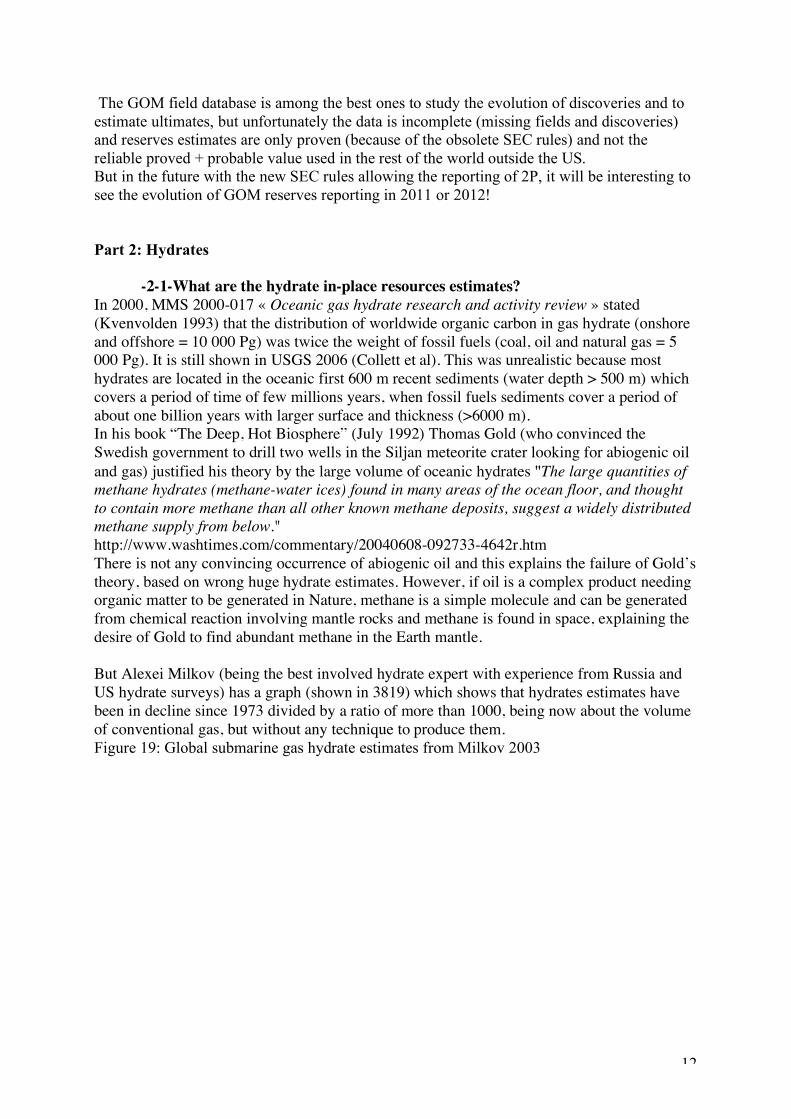
The mean ultimate for the whole Gom could be from 25 to 40 Gb and 200 Tcf to 235 Tcf, because the deepwater is badly reported. -1-5-reserve growth But a comparison with the MMS 1998-032, MMS 2000-069 and MMS 2009-022 shows that obviously the past data was incomplete when plotting the cumulative number of fields (in blue). The growth in Gboe was mainly due to incomplete data (as found when comparing with scout data) but also to reserve growth because using proven estimates instead of 2P values. Figure 18: GOM MMS cumulative discovery reported in 1998, 2000 & 2009
-1-6-Conclusions of part 1:
12
The GOM field database is among the best ones to study the evolution of discoveries and to estimate ultimates, but unfortunately the data is incomplete (missing fields and discoveries) and reserves estimates are only proven (because of the obsolete SEC rules) and not the reliable proved + probable value used in the rest of the world outside the US. But in the future with the new SEC rules allowing the reporting of 2P, it will be interesting to see the evolution of GOM reserves reporting in 2011 or 2012! Part 2: Hydrates -2-1-What are the hydrate in-place resources estimates? In 2000, MMS 2000-017 « Oceanic gas hydrate research and activity review » stated (Kvenvolden 1993) that the distribution of worldwide organic carbon in gas hydrate (onshore and offshore = 10 000 Pg) was twice the weight of fossil fuels (coal, oil and natural gas = 5 000 Pg). It is still shown in USGS 2006 (Collett et al). This was unrealistic because most hydrates are located in the oceanic first 600 m recent sediments (water depth > 500 m) which covers a period of time of few millions years, when fossil fuels sediments cover a period of about one billion years with larger surface and thickness (>6000 m). In his book “The Deep, Hot Biosphere” (July 1992) Thomas Gold (who convinced the Swedish government to drill two wells in the Siljan meteorite crater looking for abiogenic oil and gas) justified his theory by the large volume of oceanic hydrates "The large quantities of methane hydrates (methane-water ices) found in many areas of the ocean floor, and thought to contain more methane than all other known methane deposits, suggest a widely distributed methane supply from below." http://www.washtimes.com/commentary/20040608-092733-4642r.htm There is not any convincing occurrence of abiogenic oil and this explains the failure of Gold’s theory, based on wrong huge hydrate estimates. However, if oil is a complex product needing organic matter to be generated in Nature, methane is a simple molecule and can be generated from chemical reaction involving mantle rocks and methane is found in space, explaining the desire of Gold to find abundant methane in the Earth mantle. But Alexei Milkov (being the best involved hydrate expert with experience from Russia and US hydrate surveys) has a graph (shown in 3819) which shows that hydrates estimates have been in decline since 1973 divided by a ratio of more than 1000, being now about the volume of conventional gas, but without any technique to produce them. Figure 19: Global submarine gas hydrate estimates from Milkov 2003
13
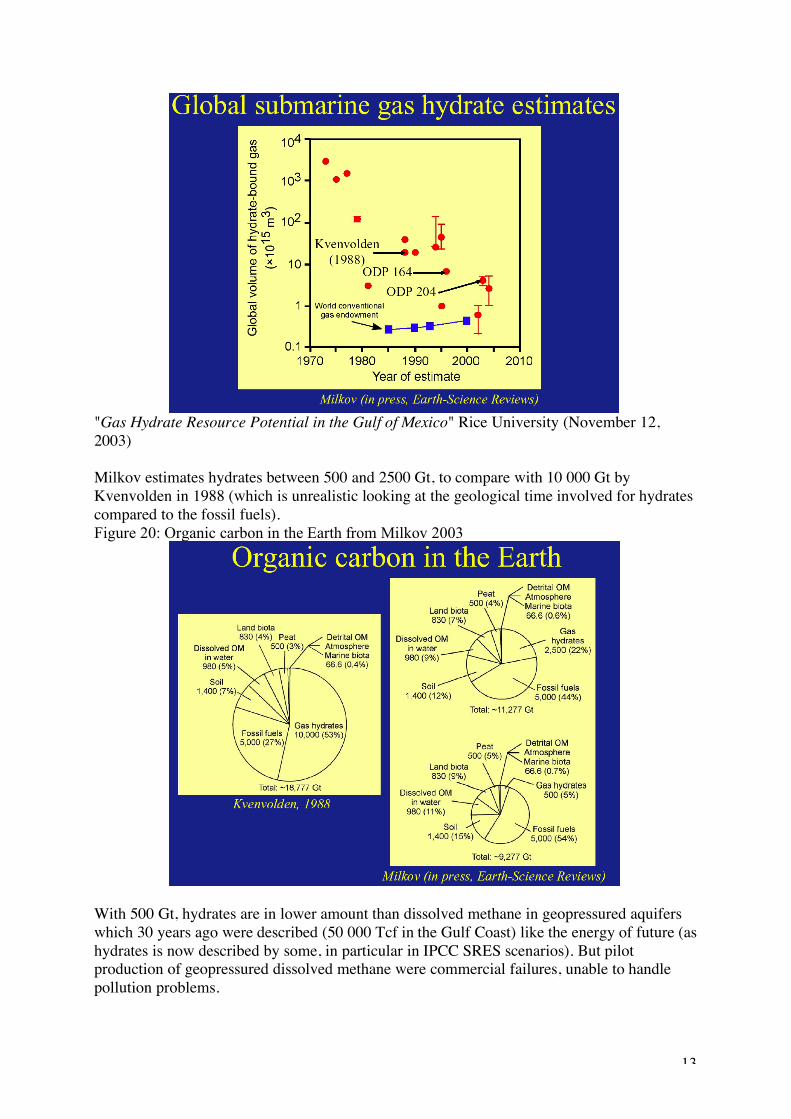
"Gas Hydrate Resource Potential in the Gulf of Mexico" Rice University (November 12, 2003) Milkov estimates hydrates between 500 and 2500 Gt, to compare with 10 000 Gt by Kvenvolden in 1988 (which is unrealistic looking at the geological time involved for hydrates compared to the fossil fuels). Figure 20: Organic carbon in the Earth from Milkov 2003
With 500 Gt, hydrates are in lower amount than dissolved methane in geopressured aquifers which 30 years ago were described (50 000 Tcf in the Gulf Coast) like the energy of future (as hydrates is now described by some, in particular in IPCC SRES scenarios). But pilot production of geopressured dissolved methane were commercial failures, unable to handle pollution problems.

14
-2-2-No core, no reserve estimate Oil and gas fields reserves need wells samples and production tests to calibrate all the other measures, in particular porosity and permeability estimated from well logs need to be calibrated by cores. To be brief: no core, no reserve estimate After my TOD3819 paper, one of the comments was that it does not matter that hydrate was not recovered in the core, because hydrate is very instable and disappears. So hydrate should be in the ground, even if it is not in the corer! The pressure corer is supposed to fix the problem and pressure corer was used in the GOM JIP. Furthermore it is surprising to see that in other places like Lake Baikal it is very easy to recover hydrate (see TOD 3819), why are GOM hydrates so hard to recover if present everywhere. All hydrate programmes mention this need for coring: For marine hydrates, there is a need for multi-well drilling expeditions in the Gulf of Mexico, with coring and logging (similar to the 2006 Indian hydrate expedition) to characterize hydrate deposits and to validate emerging exploration technologies. Chevron Gulf of Mexico Joint Industry Project with research partners ConocoPhillips, U.S. Geological Survey, Minerals Management Service, Total, Schlumberger, Rice U., Georgia Institute of Technology, Reliance Industries, JOGMEC, and Scripps Oceanographic Institute. Phases 1 and 2 resulted in the 2005 drilling, logging, coring of two sites in the Gulf of Mexico to investigate safety aspects of hydrates in fine-grained sediments. Phase 3 (currently in planning) will pursue improved pressure coring tools, evaluate locations for gas hydrates within coarse-grained (sand) sediments, conduct initial drilling and LWD evaluation of those sites (4Q2007) and conduct follow-on drilling and coring operations (FY2008/2009). « Report to Congress An Assessment of the Methane Hydrate Research Program and An Assessment of the 5-Year Research Plan of the Department of Energy » June 2007 http://www.fe.doe.gov/programs/oilgas/hydrates/MHAC-07-ReportToCongress-final.pdf Pressure core analysis has become the keystone that links these data sets together and is an essential component of modern gas hydrate investigations « Pressure core analysis: the keystone of a gas hydrate investigation » Schultheis et al International Conference on Gas Hydrates 2008 Vancouver https://circle.ubc.ca/bitstream/2429/1200/1/5720.pdf The main objective of the JIP cruise was to collect sediments cores and a full suite of logs on seismically well-characterized sediments that show evidence for occurrence of gas hydrates. Although the petroleum industry has operated in the Gulf for decades, relatively little information has been collected on the nature of the shallow sediments, and seismic records and well logs have not been calibrated for the interpretation of gas hydrates. « JIP GOM gas hydrate coring update » G.Claypool NETL Fire in ice Summer 2005 http://www.netl.doe.gov/technologies/oil-gas/publications/Hydrates/Newsletter/HMNewsSummer05.pdf Gas hydrate saturation cubes such as those shown in Figures 17 and 18 must be calibrated. It should be noted that, despite the large number of drilled hydrate wells worldwide, quality hydrate logging and coring data are scarce, especially in the Gulf of Mexico. Such data are urgently needed. Until we devote resources to undertake such logging, coring, and laboratory measurements, current estimates of possible gas that can be obtained from gas hydrates must be questioned. “Detection and estimation of gas hydrates using rock physics and seismic inversion:

15
Examples from the northern deepwater Gulf of Mexico” Dai et al The Leading Edge Jan. 2004 http://www.slb.com/media/services/seismic/reservoir/mapping/gas_hydrates_le.pdf -2-3-Where are the cores showing oceanic hydrates? It is very difficult to recover hydrate in cores, because hydrate smelts with change in temperature and pressure. It is necessary to keep the pressure within the core. Different core equipments were built since the problem occurred when JOIDES drilling began (it was a main concern when I was a member of the JOIDES Safety Panel in the 70s). Each new survey tests a new equipment (pressure corer like HYACE, HYACINTH, Fugro,..) and concludes that better equipment or new survey is needed. The first industrial hydrate survey, in Nankai (Japan) in 1999, did not recover any hydrate in the recovered cores and JNOC decided to get some hydrate core from permafrost sediments in Canada (logged since 1972 = Mallik 2) to know more on hydrate behaviour. But permafrost hydrate accumulations in Mallik (or Messoyakha in Russia) are completely different from oceanic hydrates, being gasfield in good sandy reservoirs trapped before the glaciation (2 Ma ago) and the shallow reservoirs are now within the hydrate stability zone (deeper reservoirs are just conventional natural gas). Figure 21: sand dominated gas hydrate reservoirs from Collett et al 2006 in permafrost
In contrary oceanic hydrates are in clay sediments where gas was converted into hydrate, which, solid, is unable to move into accumulation except by gravity being lighter than water. Figure 22: clay dominated gas hydrate reservoirs from Collett et al 2006

16
Ten years later Japan, after two drilling surveys in 2001 & 2004 (six months drilling with JOIDES Resolution ship) where finally they did core some hydrate (very little geological information is published and no picture of cores can be found on the Internet), estimates the hydrate reserves in Nankai trough at 20 Tcf (resources 40 Tcf Abe presentation IIASA march 2008). But production experiments are planned only in 2012 & 2014 (METI, AIST & JOGMEC). For a country in great need of domestic energy, hydrate is not the priority or they feel that the potential for domestic hydrate production is weak! -2-3-1-GOM The oil industry knows hydrates well, because it is a nuisance: plugging pipes, production tubes and being a hazard when drilling in deepwater. MMS requires, in the Application for Permit to Drill, to evaluate the hazards of hydrates in order to avoid them. USGS is active in the US hydrate programme (Collett et al 2006): Figure 23: 1980-2010 USGS gas hydrate research

17
In 2001 a Joint Industry Project (JIP) group was formed, led by Chevron to investigate the problems of hydrates in the GOM within the oil industry. JIP gathers Chevron, ConocoPhillips, Halliburton, JOGMREC (Japan), MMS, Reliance, Schlumberger, Total, KNOC (S. Korea) and recently StatoilHydro. -2-3-1-1-JIP Leg I The JIP launched a 35-day expedition in Spring 2005 to acquire well logs and sediment cores at sites in Atwater Valley lease blocks 13/14 and Keathley Canyon lease block 151 in the northern Gulf of Mexico minibasin province No gas hydrate was recovered at the drill sites, but logging data, and to some extent cores, suggest the occurrence of gas hydrate in inferred coarser-grained beds and fractures, particularly between 220 and 330 m below the seafloor at the Keathley Canyon site The expedition did not recover visible gas hydrate during any of the coring operations, nor was gas hydrate directly imaged in pressure cores that were subjected to X-ray analyses (Claypool, 2006) « Scientific results from Gulf of Mexico Gas Hydrates Joint Industry Project Leg 1 drilling: Introduction and overview » C. Ruppel, R. Boswell, E. Jones Marine and Petroleum Geology 25 (2008) 819–829 In my 2008 hydrate review (TOD3819), I indicated the lack of hydrate finding in 2005 cores, the oil industry then concluded that hydrates pose a minimum-drilling hazard For the world, Riedel has reduced the map of hydrate occurrences (previous ones were more generous!). “Marine gas hydrate occurrence -15 years of research ocean drilling for gas hydrates Results from ODP/IODP drilling and commercial projects (1992 –2007) -Recent advances in our understanding of marine gas hydrate provinces” M.Riedel IIASA 2008 Figure 24: marine & terrestrial gas hydrate occurrences from Riedel

18
Riedel displays the well known seismic section of leg 164 (offshore S.Carolina) with 3 sites: 994, 995 and 997. The so called BSR (Bottom Simulating Reflector) was absent on site 994, when present on sites 995 & 997, but the log on these three holes were similar on the hydrate zone and now it is well established that BSR depends on the so called “free gas” below the hydrate stability zone, before a small concentration of fizzy water (lemonade) drastically changes the velocity of the sediments. BRS has nothing to do with hydrate concentration like it is assumed in most of the resource estimates. Figure 25: Blake Ridge gas hydrate “accumulation” and BSR profile from Riedel
2-3-1-2-JIP Leg II In 2005 JIP Leg I drilled 7 wells on AT 13/14 & KC 151 in 35 days (Ruppell et al 2008) with a dynamic positioning semi-sub and recovered 19 cores (total length 6 m).

19
In 2009 JIP Leg II used slim hole techniques only with logging seven wells at 3 different locations (WR313, GC 955 and AC21), but no core despite that on all programmes on leg II sites, coring was planned. Phase III of the project is to collect data on hydrate bearing sands. Both logging and coring operations are planned. Phase III of the project began in September of 2007 and will focus on obtaining logs and cores of hydrate bearing sands in the GOM Coring was indicated in the recent planning of the selected locations. http://www.netl.doe.gov/technologies/oil-gas/FutureSupply/MethaneHydrates/projects/DOEProjects/CharHydGOM-41330.html Phase 3A is currently ongoing. Site selection and detailed scientific and operational planning for the drilling/logging expedition have been completed. The expedition was initiated on 3/16/09 and sites involved are to include Green Canyon 955, Walker Ridge 313 and East Breaks 992 (contingency sites include Green Canyon 781/825 and Alaminos Canyon 21/65). The multi-location, multi-hole program will include a full suite of well logs and will provide vital information related to occurrence of hydrate in coarse grained sediment in the Gulf of Mexico, will help prove out the prospecting methodologies used in the selection of targeted sites and will lay the ground work for Phase 3B coring expedition. Phase 3B will involve the planning and carrying out of a separate hydrate coring cruise (anticipated in 2011), the follow on analyses, interpretation and dissemination of information generated from project activities. Phase III of the project is to collect data on hydrate bearing sands. Both logging and coring operations are planned. Phase III of the project began in September of 2007 and will focus on obtaining logs and cores of hydrate bearing sands in the GOM “Characterizing Natural Gas Hydrates in the Deep Water Gulf of Mexico: Applications for Safe Exploration and Production Activities” Semi-Annual Progress Report #41330R16 (October 2008 – March 2009) But there was no coring in the JIP leg II completed last month, only well logs within slim holes (lack of funds, lack of suitable rig?)! There is no explanation for the absence of core despite it being in the planning! Pressure corers do not fit slim holes. Coring is now planned for 2011 Phase 3A is currently ongoing. Site selection and detailed scientific and operational planning for the drilling/logging expedition have been completed. The expedition was initiated on 3/16/09 and sites involved are to include Green Canyon 955, Walker Ridge 313 and East Breaks 992 (contingency sites include Green Canyon 781/825 and Alaminos Canyon 21/65). The multi-location, multi-hole program will include a full suite of well logs and will provide vital information related to occurrence of hydrate in coarse grained sediment in the Gulf of Mexico, will help prove out the prospecting methodologies used in the selection of targeted sites and will lay the ground work for Phase 3B coring expedition. Phase 3B will involve the planning and carrying out of a separate hydrate coring cruise (anticipated in 2011), the follow on analyses, interpretation and dissemination of information generated from project activities. http://www.netl.doe.gov/technologies/oil-gas/FutureSupply/MethaneHydrates/projects/DOEProjects/CharHydGOM-41330.html Figure 26: GOM JIP Leg I & II locations

20
We have to wait until 2011 to know more about GOM hydrate potential! 2009 drilling survey was on locations selected by seismic and industry wells. Three wells were drilled in Green Canyon 955 from April 22 to April 28 2009 This first well encountered more than 300 ft of porous sands as predicted; however the sands contained primarily water – with only modest proxy indications of gas hydrate. The seismic map displays so-called hydrate target which looks dispersed and of small horizontal extent (100 m!) Figure 27: JIP Leg II site GC 955 target map

21
The seismic line has bright colours, but what do they mean? The report is not yet published, but it will be based only on logs, without cores. Figure 28: JIP Leg II site GC 955 target profile
At the end of the survey of JIP Leg II, the result was claimed by Dr Collett to be great: “Our drilling at Walker Ridge block 313 and Green Canyon block 955 has discovered the most promising marine gas hydrate accumulations in the world,” "What's unique about the Gulf of Mexico accumulations identified is this. It's the first time we've seen highly concentrated hydrates in conventional sand reservoirs that could be commercially producible," http://www.rigzone.com/news/article.asp?a_id=76213 It is based on wishful thinking on interpretation of proxy data, not on cores! -2-4-permafrost hydrate: Alaska USGS estimates hydrate resources in the North Slope in a range of 25 Tcf to 157 Tcf with a mean of 85,4 Tcf (the mean was 590 Tcf in 1995 estimate, quite a drop! but they claim that it was then in-place when now it is technically recoverable gas) http://geology.com/usgs/alaska-gas-hydrates.shtml Two hydrates sites were drilled and cored in the last 5 years: 2-4-1-Hot Ice 1 In 2003 & 2004 Anadarko drilled a well with the goal to recover hydrate, because its name was clear Hot Ice. It was cored for more than 200 ft and no hydrate was found on core or logs! “Characterization of potential hydrate bearing reservoirs in the Ugnu and West Sak formations of Alaska’s North Slope” Signal et al http://www.searchanddiscovery.net/documents/abstracts/2004hedberg_vancouver/extended/sigal/sigal.htm During the winter operations seasons of 2003 and 2004, Anadarko Petroleum in cooperation with Maurer Technology and Noble Corporation and with the partial support of DOE drilled and cored a shallow well, Hot Ice 1, located at 30-T9N-R8E, Umiat Meridian, on the North Slope of Alaska. The Hot Ice 1 well was drilled from the surface to 2300 ft. There was almost 100% core recovery from the bottom of surface casing at 107 ft to TD at 2300 feet measured depth from the surface. Based on the best estimate of the bottom of the methane hydrate stability zone

22
core was recovered over its complete range. Approximately 565 ft of good sandstone reservoir rock was recovered in the Ugnu formation and approximately 215 ft were recovered in the West Sak. There were gas shows in the bottom part of the Ugnu and throughout the West Sak. No hydrate baring zones were identified either in the recovered core or on the well logs. -2-4-2-Milne Point BP 2007 Mt Elbert gas hydrate project 500 ft of continuous core was recovered in 2007 stratigraphic well « Mount Elbert » and logs indicate 30 m (in two layers) of gas-hydrate saturated, fine grained sand reservoir. But the only picture that I found shows grey sediment different (they mention ice cementation with gas saturation of 45 to 75%) from the typical white spots oceanic hydrate. Tests were conducted, recovering methane (thermogenic and microbial gas). Figure 29: Mt Elbert hydrate core
« Investigation of gas hydrate-bearing sandstone reservoirs at the « Mount Elbert » stratigraphic test well, Milne Point Alaska »R. Boswell ICGH 2008 Vancouver There is a video showing the gas dissociation of the Mt Elbert sample below: Figure 30: Mt Elbert gas dissociation

23
http://www.netl.doe.gov/technologies/oil-gas/FutureSupply/MethaneHydrates/rd-program/ANSWell/PhotoGallery.html There is obviously methane release from these cores, as in marshy gases or in cow flatulence (1 m3/d). 50% of GHG in New Zealand comes from cows and sheep, but only 14% in Australia where kangaroos do not emit any methane because a special bacteria in their guts (they are trying to move it into cows or sheep!) A long production test is needed to know more about Mt Elbert potential, but it is not yet decided! -2-5-Production: Permafrost hydrate in sandy sediments is quite different from oceanic hydrate in clay, mostly unconsolidated sediments. Permafrost hydrates were drilled in oil & gas producing basins: they are old accumulations and mainly thermogenic. Oceanic hydrates were drilled in oil & gas producing basins (GOM) and in North Slope hydrates seem quite uneconomical (Mallik test was less than a CBM test) and their interest is negligible (in unconventional production the size of the tank does not matter, it is the size of the tap!) when Prudhoe Bay free gas reserves are still stranded. It is a far future prospect, first needing a gas pipeline and much higher gas prices because the small flow. Collett at Petrotech 2009 « Geologic and engineering controls on the energy resource potential of gas hydrates » states that the maximum rates on Mallik 2008 was 4000 m3/d http://www.petrotech2009.org/upload/P-008corrected.pdf There is no production concept for oceanic hydrates, because no one knows how to do it, mainly in unconsolidated impermeable sediments? Furthermore the heterogeneity of the oceanic hydrates (few centimetres vertically and few meters horizontally) seems to be a difficult obstacle to overcome. -2-6-Conclusions of part 2

24
Hydrate is the Santa Claus of many who do not want to change their way of life, but hydrate occurrences are hard to be evaluated mainly by lack of samples (cores) which is the only way to calibrate all the visible proxy which are well logs and seismic data. GOM is now claimed to have the « most promising marine gas hydrate accumulations in the world,” but unfortunately it is only wishful thinking without the coring which are now planned in 2011 or later. As usual, the data is too incomplete to rely on such optimistic claims, in particular for the GOM. -Conclusions on the GOM The GOM is the most concentrated oil and gas activity in the world and being owned by the Federal government, all data is public and is the best source to study oil and gas patterns for discovery and production. Published data is well reported, unfortunately with a 3-4 years delay, and allows plotting many curves. But MMS reports what operators report and unfortunately the data is incomplete. Having reliable and complete field data is a must in worldwide oil and gas production forecasts. The US government should oblige operators to be more accurate in reporting and MMS should try to report discovery data better and sooner.