importance of human resource accounting practices and
TRANSCRIPT

XIMB Journal of Case Research Volume IV Issue 02
Page | 113
Importance of Human Resource Accounting Practices and Implications of Measuring Value of Human Capital: Case study of Successful PSUs in India.
Neerja Kashive*
Introduction
According to Dun & Bradstreet’s-India’s top PSUs 2011 study, public sector enterprises in
India have grown from only five enterprises post independence and with investment of 0.3
bn in 1951 to 249 enterprises as on March 31,2010.Total investment, including equity plus
long- term loans of Central PSUs went up from 5,135.32 bn in FY09 to 5799.20 bn in
FY10,growing 12.93 %.Overall profit of all Central PSUs was 925.93 bn during FY10 and
dividend declared was 332.23 bn. The CPSEs earned foreign exchange equal 777.45 bn
during the year compared with 742.06 bn in FY09.PSUs have contributed significantly to the
country’s economy and as on April 30 ,2011,of the total 247 Central PSUs and their
subsidiaries only 50 are listed. The 47 that were listed at the Bombay Stock Exchange(BSE)
constitutes 22% of the total market capitalization of 4,946 companies listed on the BSE.
Additionally,28 Public Sector Banks (PSBs) including their subsidiaries and six State Level
Public Enterprises(SLPEs),accounted for 6% of the total market capitalization at BSE. The
market capitalization of all PSUs taken together was 19.84 trn, constituting 28.7 % of the
total market capitalization at the BSE.
The growth and performance of Central PSUs runs parallel with the growth of the Indian
economy. As per data from the BSE as on Dec 15, 2010 there were 98 unlisted Central PSUs
that made profit for the past three years, clearly indicating the importance of Central PSUs
in the growth of the Indian economy. The Central PSU with the highest market capitalization
is Oil and Natural Gas Corporation Ltd (ONGC) at 2,642.8 bn on the BSE as on Apr 30,
2011.The total number of employees in Central PSUs was 1.53 mn in FY09 and came down
to 1.49 mn in FY10. While the number of people employed by Central PSUs came down by
2.7% in FY10, the average annual per capita emoluments given went up to 609,816 in FY10
up from541,716 in FY09. Moreover, several Central PSUs face high attrition with employees
* Prof. Neerja Kashive, Assistant Professor, VES’s Institute of Management Studies and Research, Mumbai. Email: [email protected]

XIMB Journal of Case Research Volume IV Issue 02
Page | 114
looking out for higher salaries elsewhere1.Thus it will be quite interesting to know their
human resource practices.
With new phase in economic development, which is characterized by continuous
innovation, spread of digital and communication technologies, relevance of network forms
of organization, the importance of intellectual capital, relational capital, and organizational
capital are emerging. There are many firms that have started measuring, managing and
reporting their intangibles. However, the complete disclosure of intellectual capital (IC) is
still at its nascent stage. Several researchers have focused on studying the accounting
disclosures made by firms (Abeysekera, 2006; Guthrie et al., 2004). IC has gained significant
attention not only among the researchers but also with the well-informed companies who
are conscious of the importance of disclosing their intangibles.
The researchers have proved that the difference between the market value of the firm and
its book value has to be attributed to the intangibles in the firm (Cordon, 1998). It has also
been proved that the market to book value of the firm which happens to be an indicator of
importance of IC in the firm has also been increasing over time (Rylander et al., 2000).IC
reporting provides companies with the opportunity to take advantage of increased
transparency to capital markets, establishing trustworthiness with stakeholders and to
employ a valuable marketing tool (van der Meer Kooistra and Zijlstra, 2001). Disclosure of IC
information could help in maintaining and enhancing IC value given that “intangible asset
creation occurs through enhanced reputation and disclosure influences the external
perception of reputation” (Toms, 2002).Thus this practice surely increase employer
reputation and creates its unique brand.
Disclosure of IC is not mandatory as per the existing accounting standards in most of the
countries. Indian accounting standards also keep these disclosures voluntary. According to
the Indian accounting standards (ICAI, 2007, AS 28,) an intangible asset is an identifiable
non-monetary asset, without physical substance, held for use in the production or supply of
goods or services, for rental to others, or for administrative purposes. Enterprises frequently
expend resources, or incur liabilities, on the acquisition, development, maintenance or
1 www.dnb.co.in/TopPSU2011/PSU_updates.as

XIMB Journal of Case Research Volume IV Issue 02
Page | 115
enhancement of intangible resources such as scientific or technical knowledge, design and
implementation of new processes or systems, licenses, intellectual property, market
knowledge and trademarks (including brand names and publishing titles).Goodwill is
another example of an item of intangible nature which either arises on acquisition or is
internally generated. Though the definition is broad, however the accountability of
disclosures is limited to the cases where the intangibles are actually leading to value
creation, expense or income.
The problem ultimately comes down to developing reliable measures of intangible assets.
Recently, several efforts have been made to measure the intangible assets in the New
Economy (Corrado, Haltiwanger and Sichel, 2005; De and Dutta, 2007). One approach
adopted for measuring the intangible assets is based on the use of expenditure data. In this
framework, intangible capital is estimated by capitalizing expenditures that create long-
lasting revenue flows (Corrado, Hulten and Sichel, 2005). Human Resource accounting (HRA)
helps the organizations to quantify their intangibles. Organizations are working hard to
make a mark in market by following new practices which are employee friendly and create
strong employer brand for themselves. This paper discusses the implication of such
practices in some of the leading PSUs in India.
Non-Financial Metrics
Non-financial metrics are the value drivers of the organization, representing the value of the
company’s work force, its customer relations and its ability to innovate. In a special 2001
report, the Financial Accounting Standards Board (FASB) defined non-financial metrics as
the indices, scores, ratios, counts and all other information that is not accounted for in
primary financial statements (i.e., balance sheet, income statement and statement of cash
flows) (Financial Accounting Series, 2001). These non-financial metrics address human
resources, customers, technology and internal processes. Non-financial metrics are not
required for any disclosure in neither International Financial Reporting Standards (IFRS), nor
U.S.Generally Accepted Accounting Principles (GAAP). However, international standards and
U.S. GAAP may converge. The Securities and Exchange Commission (SEC) and FASB are
bridging the gap between IFRS and GAAP. SEC Chairman Cox recently stated to investors and
business owners that the two reporting standards are moving towards convergence

XIMB Journal of Case Research Volume IV Issue 02
Page | 116
(Dzinkowski, 2007). The evolution of the New Economy (Knowledge Capital) and discussion
of convergence has brought the disclosure of non- financial metrics to the fore front.
Since 2001, the International Accounting Standards Board (IASB) has been developing and
promulgating the IFRS (International Accounting Standards Board, 2009). Prior to 2001, the
International Accounting Standards Committee (IASC) issued International Accounting
Standards (I AS), which were adopted initially by the IASB, when it replaced the IASC. While
the IFRS do not currently have standards requiring HRA, it could be argued that they are
moving closer to providing more flexible approaches to accounting measurements and
reporting. For example, the international standards IAS 38 Intangible Assets and IFRS 3 on
Business Combinations allows for the recognition of the intangible asset goodwill, which
indicates a willingness to allow for valuation of assets that are not traditional tangible
assets, such as human resources.
Consequently, despite the importance of non-financial metrics, U.S. companies generally
keep their non-financial metrics internal, avoiding public disclosure in their financial
statements. Without access to these metrics, investors, stakeholders, researchers, and
analysis have an incomplete knowledge. Thus there is increased realization that non-
financial data are important and should be valued.
Intangible Assets
Nakamura(2000) estimates the value of U.S. corporate investment in intangibles during
2000 to be around $1.0 trillion, making it roughly equal to the total investment of the non-
financial sector in property, plant and equipment. Further Hall (2000) estimates the total
value of intangible capital as ranging between half to two-thirds of the total market value of
publicly traded corporations, as indicated by the q ratio (market value to replacement cost
of physical assets). Nakamura (1999, 2000) argues that the major growth in value and
impact of intangible capital started roughly in the mid-80s, with the emergence of major
‘intangible industries’ (software, biotech, internet, etc). Gu and Lev (2001) show that firm-
specific estimates of intangible capital improve significantly the association between capital
market values and accounting-based measures of performance and value (e.g., earnings or
book values). More recently, McGrattan and Prescott (2007) emphasize the importance of

XIMB Journal of Case Research Volume IV Issue 02
Page | 117
considering intangible investments in explaining the real economic growth in the l990s.
Overall, it is widely accepted that intangible assets are the major drivers of national as well
as corporate success.
A framework developed by Lev (2001) for intangible capital classifies intangible assets into
the following four groups.
1. Discovery/learning intangibles—technology, know-how, patents and other assets
emanating from the discovery (R&D) and learning (e.g., reverse engineering)
processes of business enterprises, universities and national laboratories.
2. Customer-related intangibles—brands, trademarks and unique distribution channels
(e.g., internet-based sales), which create abnormal (above cost of capital) earnings.
3. Human-resource intangibles—specific human resource practices such as training and
compensation systems, which enhance employee productivity and reduce turnover.
4. Organization capital—unique structural and organizational designs and business
processes generating sustainable competitive advantages.
Olsson (2001) argued that a firm would disclose its personnel policy by managing, measuring
and reporting human capital (HC), since disclosures give transparency and transparency
gives the stakeholders information they need to predict the future value of HC. The
potential advantages for firms are that reporting their HC not only communicate the firm’s
advantages, but could also attract valued resources (Mouritsen et al., 2004).Skoog (2003)
found a positive correlation between the reported HC and profitability in the long run.
According to the VCI (value creation index) study conducted by Low(2000), a top non-
financial performance driver for financial services is HC. Wright and Snell (2005) argued that
in a knowledge-based industry, value creation could be achieved by giving attention to the
skills, knowledge, capability and commitment of workforce.
The value of HC is distinct in two types of firms in relation to how firms create value. First,
professional firms use HC as a direct resource, and second, other firms(such as computer
firms, high-technology firms and software firms) use HC as an indirect resource (Edvinsson
and Sullivan, 1996). Both types of firms create value from the commercialization of the
knowledge created by their employees. However, Edvinsson and Sullivan (1996) suggested

XIMB Journal of Case Research Volume IV Issue 02
Page | 118
that it is not the store of knowledge in employees but rather the ability of the firm to
leverage knowledge that drives the value creation. A successful firm would understand the
expectation of shareholders and their risk perception (Anderson, 2000) and transform the
firm’s HC capabilities to better meet shareholders’ expectations (Bassi et al., 2000; Meer-
Kooistra and Zijlstra, 2001).
Therefore, if a firm efficiently manages and reports its HC, it would result in increase in the
shareholder value. There has been a shift in the outlook of management towards employees
and contribution of employees to the firm (Bassi et a1., 2000). Firms have realized that HC
practices, and their reporting to shareholders play an important function in firm
performance (Boudreau, 1991; Wright and McMahan, 1992). The HC practices include
acquisition, development, allocation, replacement or retention of employees (Flamholtz,
1972). Selective staffing, comprehensive training, employee empowerment, participative
problem-solving, incentive compensation, job rotation and teamwork can increase the
firm’s value creation by the transformation of processes (Youndt et al.,l996).
Human Resource Accounting (HRA)
Human Resource Accounting (HRA) involves accounting for the company’s management and
employees as human capital that provides future benefits. In the HRA approach,
expenditures related to human resources are reported as assets on the balance sheet as
opposed to the traditional accounting approach which treats costs related to a company’s
human resources as expenses on the income statement that reduce profit. Objective of
human resource accounting is to facilitate the management to get information on the cost
and value of human resources which will enhance the quantity and quality of goods and
services. It provides data to the interested persons about the cost of human resources and
correspondingly comparing it with the benefit obtained out of its utilization. The human
resource accounting is used to furnish cost value information for making proper and
effective management decisions about acquiring, allocating, developing and maintaining
human resources in order to achieve cost effective organizational objectives.
Further, it helps the organization in decision making in the various areas like Direct
Recruitment vs. Promotion, Transfer vs. Retention, Retrenchment vs. Retention, Impact on
XIMB Journal of Case Research Volume IV Issue 02
Page | 119
budgetary controls of human relations and organizational behavior, decision on reallocation
of plants, closing down existing units and developing overseas subsidiaries etc. It helps in
evaluating the expenditure incurred for imparting further education and training in
employees in terms of the benefits. It helps an organization to take managerial decisions
based on the availability and the necessity of human resources. When the human resources
are quantified, it gives the investor and other client’s true insight in to the organization and
its future potential. Proper valuation of human resources helps an organization to eliminate
the negative effects of redundant labour.
Flamholtz (1979) describes the HRA paradigm in terms of the “psycho-technical systems”
(PTS) approach to organizational measurement. According to the PTS approach, the two
functions of measurement are: 1) process functions in the process of measurement and 2)
numerical information from the numbers themselves, thus one role of HRA is to provide
numerical measures, an even more important role is the measurement process itself. The
HRA measurement process helps to increase recognition that human capital is paramount to
the organization’s short and long-term productivity and growth.
When managers go through the process of measuring human resources, they are more
likely to focus on the human side of the organization and are more likely to consider human
resources as valuable organizational resources who should be managed as such (Bullen,
2007, p. 89).Flamholtz, Bullen & Hua (2003) utilized the HRA measure of expected realizable
value, and found that employees’ participation in a management development program
increased the value of the individuals to the firm. The HRA represented both a paradigm and
way of viewing human resource decisions, and the set of measures for quantifying the
effects of human resource management strategies upon the cost and value of people as
organizational resources.
Davidove & Schroeder (1992) indicate that although many business leaders still view
training as an overhead expense, with thorough ROI evaluations, training departments can
convince business to view them as partners in creating the assets crucial to organizational
success. Johanson & Mabon(l 998) indicate that expressing human resource interventions in
financial terms and or cost benefit terms is more effective than using soft accounting
information such as data on job satisfaction. Toulson& Dewe (2004) conducted a survey

XIMB Journal of Case Research Volume IV Issue 02
Page | 120
study utilizing component analysis and found two reasons for human resources to be
important. The first is that measurement reflects the strategic and competitive importance
of human resources, and the second suggests that to earn credibility, human resources must
be expressed in financial terms. McKenzie& Melling (2001) suggest that, if properly
implemented, the human capital planning and budgeting process will become a key driver of
strategy as strategic human capital planning and budgeting ensures that the best resources
are mobilized for each internal process..
Moore (2007) suggests that the value of human capital should be considered when making
decisions about the acquisition and disposal of people and accounting practices currently
employed by companies can have an undue influence in driving the strategic decisions of
these companies. Moore notes that there are link between the process of acquiring an
employee (a human capital asset) and that of acquiring a fixed capital asset. However while
most companies acknowledge the contributions of its employees, they do not think of the
acquisition or disposal of human capital assets in the same way or with the same thoughtful
planning or strategic thinking as they do fixed capital assets.
HRA Measurement Models
Flamholtz (1999, p. 160) noted that the concept of human resource value is derived from
general economic value theory as all resources people possess value because they are
capable of rendering future service. An individual’s value to an organization can be defined
as the present ‘value of the future services the individual is expected to provide for the
period of time the individual is expected to remain in the organization. The Stochastic
Rewards Valuation Model, originally developed by Flamholtz (1971) for human resource
valuation has five step process: It begins with defining the various service states or
organizational positions that an individual may occupy in the organization. The next step is
to determine the value of each state to the organization, the service state values, which can
be calculated either by using a number of methods such as the price-quantity method or the
income method. Then the person’s expected tenure or service life in the organization is
calculated and the person’s mobility probability or the probability that a person will occupy
each possible state at specified future times is derived from archival data. Next the expected
XIMB Journal of Case Research Volume IV Issue 02
Page | 121
future cash flows that the person generates are discounted in order to determine their
present value.
Similar to the Flamholtz model, another earliest model of human resource value measures
human capital by calculating the present value of a person’s future earnings (Lev &
Schwartz,(1971). Dobija (1998) proposes an alternate model for capitalization, where the
rate of capitalization is determined through the natural and the social conditions of the
environment. Utilizing a compound interest approach, this method takes into account the
three factors for valuing the human capital which include the capitalized value of cost of
living, the capitalized value of the cost of professional education, and the value gained
through experience. Turner (1996) refers to the framework issued by the International
Accounting Standards Committee and recommended the use of the present value of the
value added by enterprise, and measures assets by the four methods of historical cost,
current cost, realizable value and present value.
Cascio (1998) proposed a method for measuring human capital based on indicators of
human capital of innovation, employee attitudes and the inventory of knowledgeable
employees. According to him, innovation can be measured by comparing gross profit
margins from new products to the profit margins from old products. Similarly employee
attitudes predicting customer satisfaction and retention are an important indicator of
human capital and therefore need to be measured, as well as measures of tenure, turnover,
experience and learning.
Thus approaches to human resource accounting can be broadly classified as monetary
approaches and non monetary value-based approaches. The monetary approaches are
further classified as (a) Cost Based Approaches, which incorporate historical cost
approaches, replacement cost approach, opportunity cost model, standard cost method,
current purchasing power method, and (b) Value-Based Models that embrace Hermanson’s
adjusted discounted future earnings model, Lev and Schwartz present value of future
earnings model, rewards valuation model, Jaggi and Lau model, net benefit model, Eric
Flamholtz model and Morse model.

XIMB Journal of Case Research Volume IV Issue 02
Page | 122
Lev and Schwartz model
Many models have been created to value human capital. Some are based on historic costs
while some are based on future earnings. But each has its own limitations and one model
has proved to be more valid than other. Lev and Schwartz model has been the most widely
used for its ease of use and convenience. The Lev and Schwartz Model states that the
human resource of a company is the summation of value of all the Net Present Value (NPV)
of expenditure on employees. The human capital embodied in a person of age ‘r’ is the
present value of his earning from employment. Under this model, the following steps are
adopted to determine human resource value:
(i) Classification of the entire labour force into certain homogeneous groups like
skilled, unskilled, semiskilled etc. and in accordance with different classes and
age.
(ii) Construction of average earning stream for each group.
(iii) Discounting the average earnings at a predetermined rate in order to get
present value of human resources of each group.
(iv) Aggregation of the present value of different groups which represent the
capitalized future earnings of the concern as a whole.
Vr = I(t)/(l + r)t-r
Where, Vr = the value of an individual r years old
1(t) = the individuals annual earnings up to retirement
t = retirement age
r = discount rate specific to the cost of capital to the company

XIMB Journal of Case Research Volume IV Issue 02
Page | 123
The Lev and Schwartz Model suffers from the following limitations:
1. This model ascertained the earnings on the basis of skills but ignores the concepts of
productivity of employees. Skills can not be in directly proportional to earnings
unless the skills are properly utilized for productivity.
2. This model ignores the productivity of promotion of employees except retirement or
death.
3. Expenses of ‘training and development’ incurred by the company are not considered.
Sveiby’s (1997) Intangible Asset Monitor
Companies use frameworks such as the Lev Schwartz Model (Lev & Schwartz, 1974), Baruch
Lev’s Value Chain Scoreboard, Sveiby’s Intangible Asset Monitor (1997) and the Balanced
Scorecard(Kaplan & Norton, 1996) models to measure non-financial metrics.
Baruch Lev developed the Value Chain Scoreboard which combines non-financial metrics
that are quantitative, standardized and measurable supported by empirical evidence. Lev
categorizes these non-financial metrics into three sections; Discovery Learning;
Implementation; Commercialization (Financial Accounting Series, 2001). The Discovery
Learning section contains into Internal Renewal, Acquired Capability, and Networking
variables. The Implementation section contains intellectual property, technological
feasibility, and Internet-related variables. The Commercialization category is contains
Customer, Performance, and Growth Prospect variables.
Sveiby’s (1997) Intangible Asset Monitor non-financial metrics into three sections: external
structure, internal structure, and competence indicators. External Structure focuses upon
customer’s relationship with the organization while internal Structure focuses on activities
that develop system processes. Competence Indicators focus upon training and
development, maturity, and contributions of the employees. The drawback of this model is
the inconsistency in metric disclosure compromises the reliability of the data which causes
some investors concern in analyzing trends (Financial Accounting Series, 2001). Another
concern is that non-financial metric descriptions vary by organization and by industry which

XIMB Journal of Case Research Volume IV Issue 02
Page | 124
makes comparisons difficult. Hence, many organizations find it too costly to calculate non-
financial metrics. Still these models remain best guides on valuing non-financial metrics.
Culpepper & Smith (2009) in their study chose ,InfoSys, , Bahrat Heavy Electronics
Lmt(BHEL), SAIL (Steel Authority of India), as they are listed on the BSE 100 and used the
annual reports of the organizations listed in the BSE 100 as the source of data as per
Chandran (2003). Culpepper& Smith, (2009) have used Sveiby’s (1997) Intangible Asset
Monitor to analyze the balance sheets of these companies. As, firstly, the Internal Asset
Monitor (IAM) appears to be well substantiated by research and used in industry and
secondly, while Infosys employs both the Lev(2001) model and the Sveiby (1997) models, it
explicitly uses Sweiby’s (1997) model as its basis for non financial metric disclosure as shown
in Exhibit 1.
HRA in India
The concept of human resource accounting was first incorporated by Bharat Heavy Electrical
Ltd. (BHEL), a leading public enterprise, during the financial year l973-74. Later, it was
adopted by other leading public and private sector organization in the subsequent years.
Some of these organizations are Oil and Natural Gas Commission (ONGC),Minerals and
Metal Trading Corporation of India (MMTC), Steel Authority of India Ltd(SAIL),National
Thermal Power Corporation (NTPC),Engineers India Ltd. (EIL), Hindustan Machine Tools Ltd.
(HMTL), Cochin Refineries Ltd. (CRL), Madras Refineries Ltd. (MRL), Associated Cement
Company Ltd. (ACC) and Infosys Technologies Ltd. (ITL) and many more as seen in Exhibit 2.
Infosys leads all companies in thorough disclosure of non-financial metrics. Explicitly
adopting and combining the Lev & Schwartz (1974), Lev (2001) and Sveiby (1997) models as
their bases for disclosure, Infosys provides a prototype for non-financial metric disclosure.
Infosys provide additional information of the firm from intangible assets score sheet, Human
Resource Accounting and Value-Added statement. Infosys provides the information
regarding particular of employees under the provision of section 21 7(2A) of the Companies
Rules 1975. Infosys used the Lev & Schwartz model to compute the value of human
resources. The evaluation is based on the present value of future earnings of employees and
on the following assumptions:
XIMB Journal of Case Research Volume IV Issue 02
Page | 125
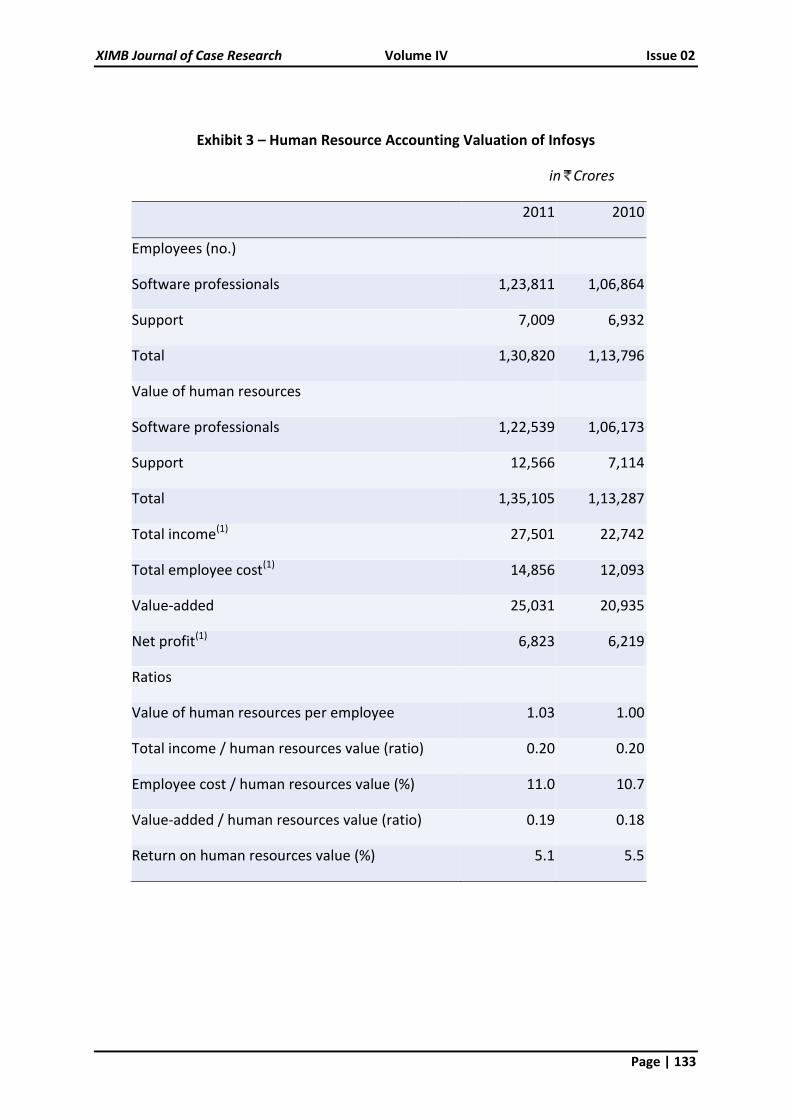
(a) Employee compensation includes all direct and indirect benefits earned both in India and
overseas (b) The incremental earnings based on group/age have been considered (c) The
future earnings have been discounted at the cost of capital of 11.21% (previous year
10.60%).
Infosys provide the information like No of Employee, Age wise Distribution and Category
wise Distribution of Employee, Net Worth, Value Added, Value of Human Resource and also
present the ratio like Value of Human Resource/Employee, Total income/Human Resource
Value, Employee Cost/human Resources Value, Value Added/Human Resource Value,
Return on Human Resource Value. The number of employees have increased to 1,30,820
from 1,13,796 and value of human resources increase to 1,35,105 Cr from 1,13,287Cr in
year 2011 from 2010.This gives increase in value of human resource per employee to 1,03
Cr in year 2011 from 1.00 Cr in 2010 as given in Exhibit 3.
Mahalingam(2001) notes that each person has a set of competencies and a value is assigned
to each, with the sum total of these values making up the value of the employee and the
value of all the employees making up the human capital of the organization—which
together with the customer and structural capital produces the revenue. In a case study
conducted in India, Patra, Khatik &Kolhe (2003) studied a profit making heavy engineering
public sector company which used the Lev & Schwartz (1971) model to evaluate HRA
measures. They examined the correlation between the total human resources and
personnel expenses for their fitness and impact on production and found that HRA valuation
was important for decision-making in order to achieve the organization’s objectives and
improve output.
Bhat (20000) provides a definition of “Human Resources Accounting” as depicting the
human resources potential in money terms while casting the organization’s financial
statements. Bhat (2000) notes that with global trade and foreign exchange transactions
becoming more complex with innovations in derivatives, more uniformity in accounting
practices and transparency will emerge. He further suggests that accounting and financial
management issues will soon be integrated in accounting statements facilitating more
meaningful use of accounts, as opposed to history and book keeping.

XIMB Journal of Case Research Volume IV Issue 02
Page | 126
Following companies annual reports were studied and data were collected from their
website between 30th August 2011 to 30th January 2012. These case analyses help us to
understand how Human Resource Accounting Practices are followed in some of the leading
PSUs in India.
1. Bharat Heavy Electricals Limited (BHEL)
BHEL is the largest engineering and manufacturing enterprise in India in the energy-
related/infrastructure sector, today. BHEL was established more than 40 years ago, ushering
in the indigenous Heavy Electrical Equipment industry in India with a dream to become self
sufficient. The company has been earning profits continuously since 1971-72 and paying
dividends since 1976-77. BHEL caters to the core sectors of the Indian Economy, viz. Power,
Transmission, Industry, Transportation, Renewable Energy, Oil & Gas and Defence. The wide
network of BHEL’s 15 Manufacturing Divisions, 4 Power Sector Regional Centres, 8 Service
Centres, 15 Regional Offices, 4 Overseas Offices, 2 Subsidiaries and over 150 project sites
spread all over India enables the Company to promptly serve its customers and provide
them with suitable products, systems and services -- efficiently and at competitive prices.
BHEL had started providing information related to Human Resource Accounting (HRA) in its
annual report from the financial year 1974-75 by using Lev and Schwartz model. It is the first
company in India who provided HRA. BHEL also started considering efficiency factor for the
purpose of Human Resource Valuation from the year 1980-81.
BHEL divides total employees of the organization according to group wise, category wise
and also as per physically challenged employee. The company followed the 12% as discount
rate. Company provide the information regarding particular of employee under section
217(2A) of the companies Act, 1956 with companies rules 1975.BHEL was reporting
information like total No of Employee, Value Added, Employee Remuneration and Benefit,
Value Added per Employee, Turnover per Employee. It also calculated the different ratio
related to Human Resource. The company has classified its employees into six categories
based on skill, type of work, experience and qualifications. In each category 10 to 15 salary
grades have been identified to facilitate the valuation of human resources.

XIMB Journal of Case Research Volume IV Issue 02
Page | 127
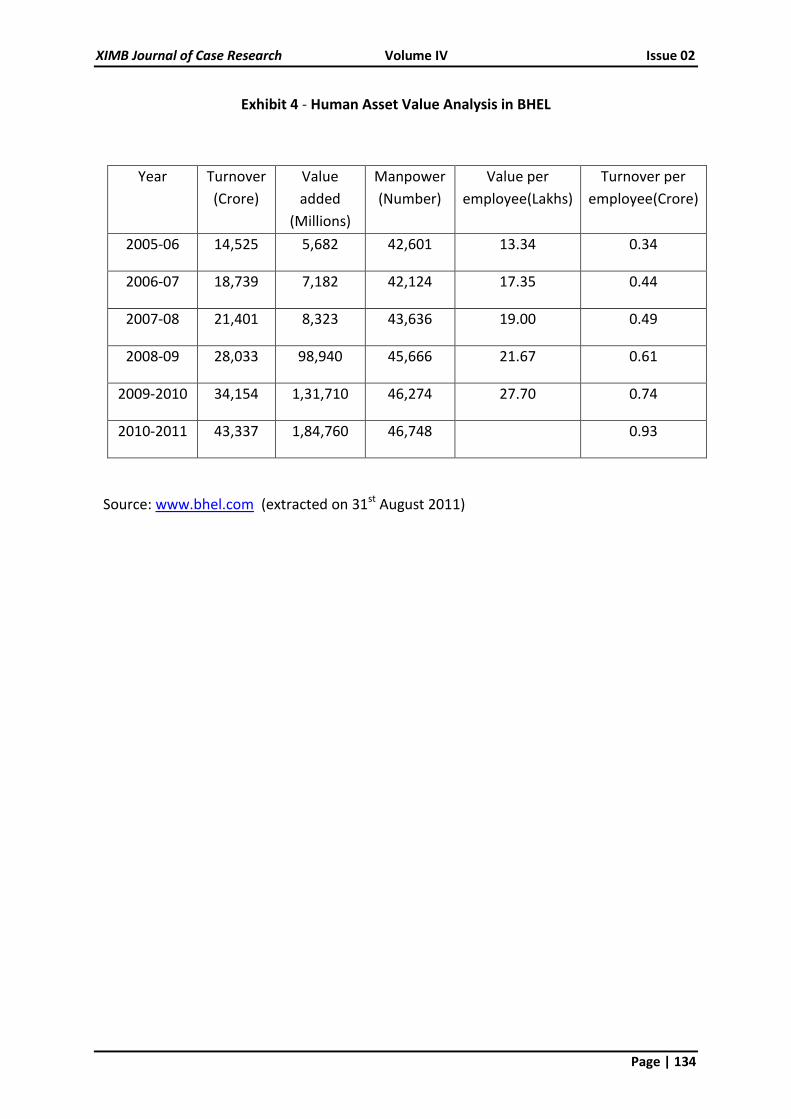
The company has shown an increase in turnover from 14,525 Cr in 2005-06 to 34,154 Cr in
2009-10.The number of employee has increased from 42,601 to 46,274 in five years. BHEL
have declared Value per employee for 2009-10 as 27.70 L, which has doubled from 13.34 L
as declared for 2005-06.Turnover per employee has also increased from 0.34 Cr in 2005-06
to 0.74 Cr in 2009-10.This has shown increased in 2.2 times. BHEL has declared 38,000 Cr
expected Turnover for the year 2010-11 as shown in Exhibit 4.
2. National Thermal Power Corporation (NTPC)
India’s largest power company, NTPC was set up in 1975 to accelerate power development
in India. NTPC is emerging as a diversified power major with presence in the entire value
chain of the power generation business. Apart from power generation, which is the
mainstay of the company, NTPC has ventured into consultancy, power trading, ash
utilization and coal mining. NTPC ranked 341st in the ‘2010, Forbes Global 2000’ ranking of
the World’s biggest companies. NTPC became a Maharatna company in May, 2010, one of
the only four companies to be awarded this status. In NTPC, People before Plant Load Factor
is the mantra that guides all HR related policies. NTPC has been awarded No.1, Best
Workplace in India among large organizations and the best PSU for the year 2010, by the
Great Places to Work Institute, India Chapter in collaboration with The Economic Times.
NTPC declares generation per employee which has increased from 7.81 in 2005-06 to 9.27 in
2010-11.They also declare value add per employee which was 4.44 in 2005-06 and increased
to 7.30 in 2009-10 in Millions. The number of employees have increased in last five years
from 21,870 to 25,144.The value added in millions was 97,206 in 2005-06 and increased to
1,73,313 millions in 2009-2010,which shows increase of 1.8 times. The Man-MW ratio has
increased from 0.77 in 2009-10 to 0.80 in year 2010-11 as depicted in Exhibit 5.
3. Steel Authority of India Limited (SAIL)
SAIL is India's largest steel producing company. With a turnover of Rs. 47,041 Cr, the
company is among the five Maharatnas of the country's Central Public Sector Enterprises.
SAIL has five integrated steel plants, three special plants, and one subsidiary in different
parts of the country. The company has the distinction of being India’s second largest
producer of iron ore and of having the country’s second largest mines network. This gives

XIMB Journal of Case Research Volume IV Issue 02
Page | 128
SAIL a competitive edge in terms of captive availability of iron ore, limestone, and dolomite
which are inputs for steel making.
SAIL started valuation and reporting of its human resource from the financial year 1983-
84.SAIL follows the human resource valuation model suggested by Lev and Schwartz by
accommodating some adjustments suggested by Flamholtz and Jaggi and Lou. SAIL uses the
constant rate of discounting the future expected return at 15%.Company provide the
information regarding employee under section 217(2A) of the Companies Act 1956 with
Companies Rules 1975.SAIL provides the information regarding No of Employee, as well as
Category wise Distribution of Employee. Company also provides the information about
Turnover, Value Added, and Capital Employed, EPS, Net worth per Share, Employee
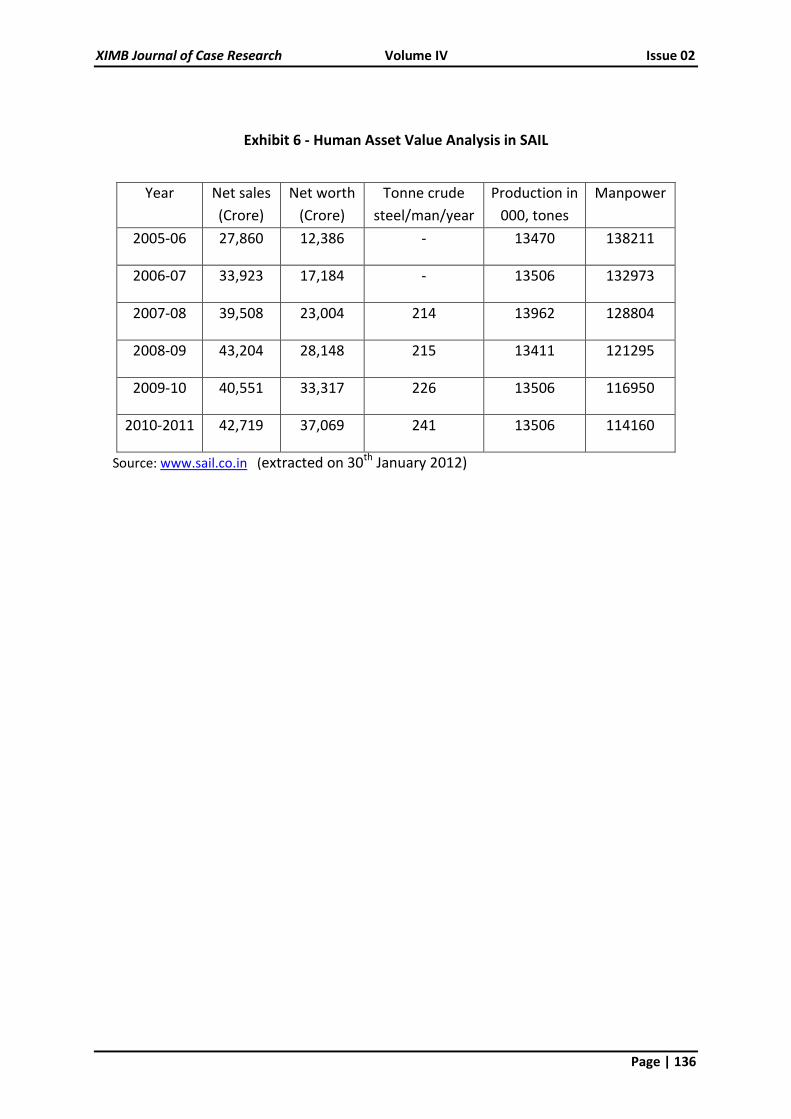
Remuneration and Benefit. The Net worth has increased from12,386 Cr in 2005-06 to
37,069 Cr in 2010-11. It also communicates different ratio like crude tone steel/man/year
which has increased from 214 in 2007-08 to 241 in 2010-11as shown in Exhibit 6. The
balance sheet includes other current assets as part of current assets. Other current assets
include employees, which is put as 14.87 Cr for March 2011 as compared to 18.95 Cr for
March 2010, as shown in Exhibit 7.
4. Oil and Natural Gas Corporation (ONGC)
ONGC is the only fully–integrated petroleum company in India, operating along the entire
hydrocarbon value chain. It holds largest share of hydrocarbon aggregates in India and
Contributes over 79 per cent of Indian’s oil and gas production. It has refining capacity of
about 12 MMTPA and created a record by turning Mangalore Refinery and Petrochemicals
Limited around from being a stretcher case for referral to BIFR to the BSE Top 30, within a
year. ONGC posted a net profit of Rs. 167.68 billion despite volatile oil markets and crude
prices. It has net worth Rs. 864 billion, practically zero debt corporate and contributed over
Rs. 281 billion to the exchequer.
ONGC ranked at 2nd position in FE 500 list 2010 in net worth and composite ranking.
ONGC & MRPL won 6 Oil Industry Safety Awards for 2008-09 instituted by OISD, MOP&NG.
It was ranked at top of the Best companies to work for in Core Sector by Business Today in
Feb 2010 edition andGolden Peacock Global Award 2007 for Excellence in Corporate

XIMB Journal of Case Research Volume IV Issue 02
Page | 129
Governance 2009”, conferred by World Council of Corporate Governance, London. It bagged
“BML Munjal Award” for Excellence in Learning & Development in Public Sector category. It
was bestowed with “Leadership for Business Excellence Award” for leveraging IT in Oil & Gas
Sector by Amity University. ONGC was awarded with Gold Trophy for SCOPE Meritorious
Award for Corporate Social Responsibility & Responsiveness for the year 2007-08 and for
R&D, Technology Development & Innovation for the year2008-09.
ONGC was given best Overall Performance Award amongst the upstream Sector Oil
Companies for Oil and Gas conservation programme for 2009 by PCRA. It received Dalal
Street investment Journal PSU awards 2010 for Excellent Overall Performance in the
category of heavy weights and Highest Market Capitalisation in the category of wealth
Builders. It was rated ‘Very Good’ in MOU Performance Rating for 2008-09 by the
Department of Public Enterprises, Ministry of Heavy Industries in Public Enterprises, GOI.
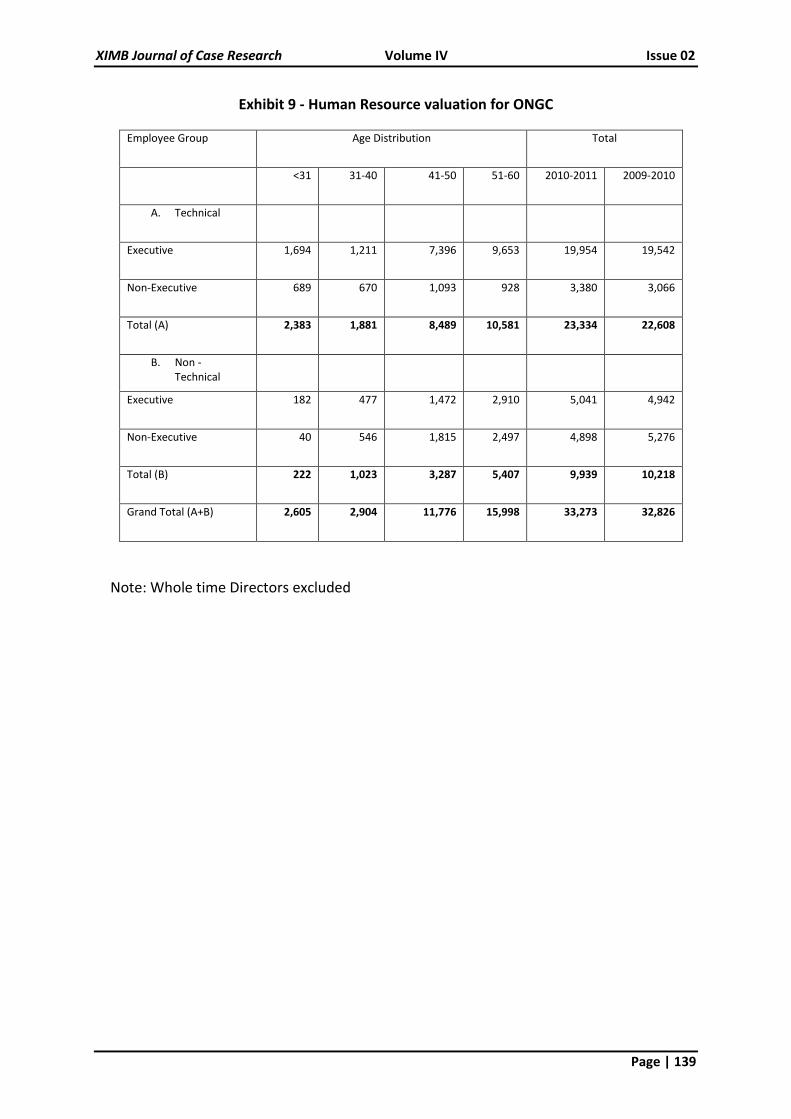
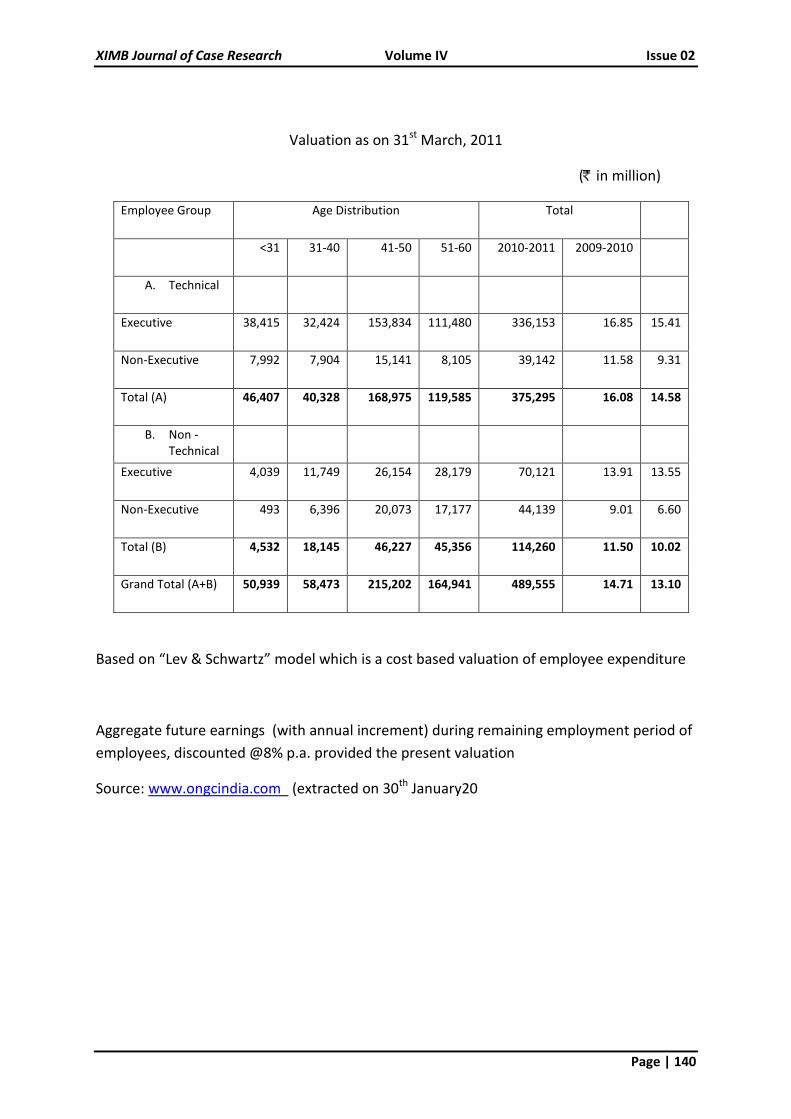
ONGC declares value per employee and calculate with help of Lev and Schwartz model
taking discounting rate at 8 % .The value per employee has increased to 14.71 million in
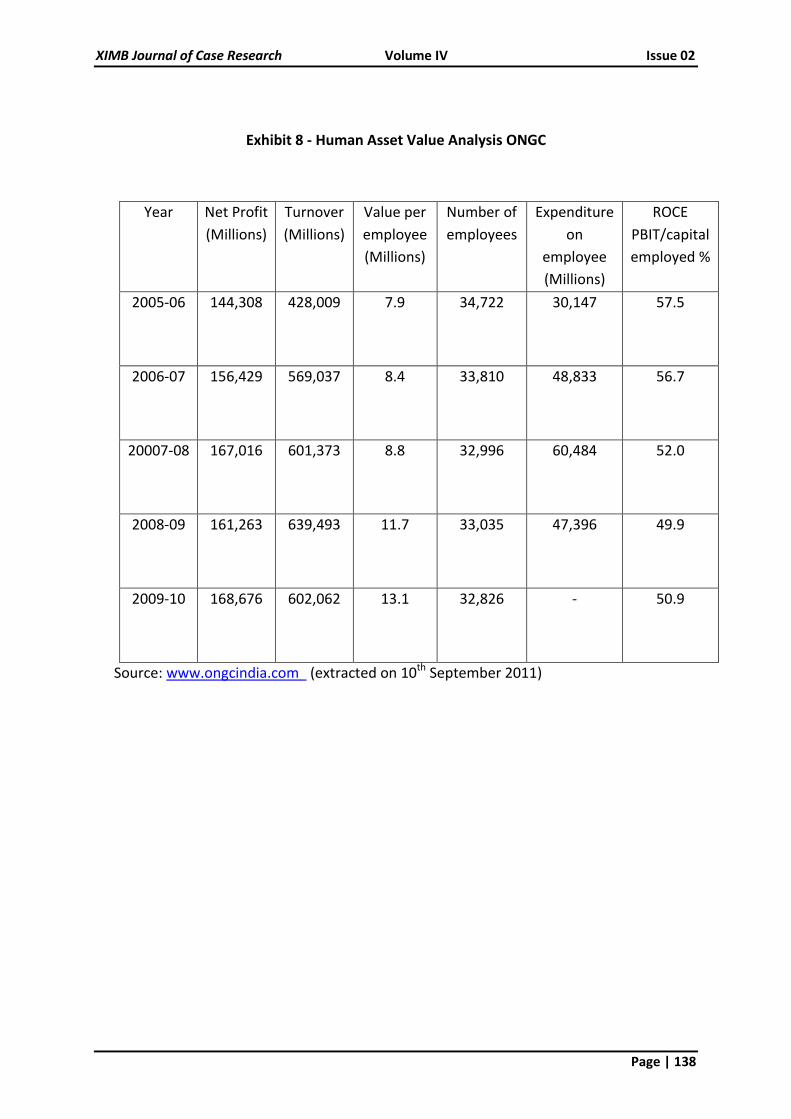
2010-11 from 13.10 million in 2009-10 as seen in Exhibit 9. The expenditure on employee
increased from 30,147 million to 60,484 in 2007-08 and was 47,396 million in 2008-09.The
net profit of ONGC has increased from144,308 million in 2005-06 to 168,676 million and
ROCE (PBIT/capital employed) has increase to 50.9 in year 2010-11 as depicted in Exhibit 8.
Thus in all total 12 disclosure variable for human resource information are identified. The
Exhibit 10 gives comparable table for disclosure and non –disclosure of these variables in
selected leading PSUs. Average 8 disclosure variables are disclosed for these companies
which shows good HR practices followed in leading PSUs.

XIMB Journal of Case Research Volume IV Issue 02
Page | 130
Conclusion:
The Indian firms are way behind other firms in European and American continents in terms
of the extent and quality of intellectual capital(IC) measurement, reporting and disclosures.
The significance of disclosure on the firm’s performance and market valuation needs to be
highlighted and focused to turn their attention towards voluntary disclosures. Thus, it can
be said that though many firms accept that IC is a very useful part of their asset and
appreciate its role and know that it surely enhances the firms valuation in the market, few
firms actually understand its meaning, use any specific management and measurement
tools, and adopt uniform reporting and voluntary disclosure practices. Many Indian
companies have understood the importance of measuring human capital and disclosing it
value in their balance sheet. This is seen as the major practices of successful public sector
companies. This practice not only helps them to identify their total worth in terms of
tangible asset and intangible asset, but also project themselves as employee friendly
companies who value their employee and are proud to say so. It enhances their employer
brand in terms of good place to work or valued human resources.

XIMB Journal of Case Research Volume IV Issue 02
Page | 131
Exhibit 1 - Sweiby’s Intangible Asset Monitor, Culpepper & Smith (2009)
Company
Name
Industry Country
of Origin
Founded External
Structure -
clients
Internal Structure -
Org
PLS –
Consult A/S
Mgmt & I.T
Consulting
Denmark 1968 Intangible Assets
Software Licenses
and Good\
Bharat Heavy
Electronics
Ltd (BHEL)
Engr &
Mfg
India 1954 Repeat Orders Value Added
Economic Value
Added
Steel
Authority of
India Ltd
(SAIL)
Steel mfg. India 1954 Value Added
Products
Infosys
Technologies
Ltd
IT
Consulting
India 1981 Clients Added
Marquee Clients
Sales per client
Client
Concentration
Client
Distribution
Repeat Business
Exports/Total
Revenue
Revenue derived
by country
Sales & Mktg
Expenses/
revenue
Days Sales
Outstanding
Brand
Evaluation
Research and
Development
Technology
Investment Sales per
support staff General
and Administration
e: percentage of
revenue Support
staff as a percentage
employees Average
age of support staff
Skandia AFS Financial
consulting/
Svcs
Sweden 1855 Number of
contracts
Savings/Contrac
ts Surrender
Ratio Points of
Sales
Number of
contracts/employee
administration
expenses/gross
information
Technology
expenses premiums
Value Added for
Employee
WM-Data
AB/LogicaC
GM
I.T.
Consulting
Sweden 1969 Revenue by
market sector
Revenue from
Outsourcing
Brand Names
Customer
Contracts &
Relationships
Process
Improvement
Internally Generated
Assets (I costs)
Value Added growth
by empl

XIMB Journal of Case Research Volume IV Issue 02
Page | 132
Exhibit 2 – Human Resource Accounting in India
Table: Chronological Order of Human Resources Accounting Introduction in India
Sl. No Name of the Organization
HRA introduced in Year Model
1 BHEL 1973-74 Lev and Schwartz Model
2 ONGC 1981-82 Lev and Schwartz Model
3 MMTC 1982-83 Lev and Schwartz Model
4 SAIL 1983-84 Lev and Schwartz Model with some refinements as suggested by Eric.G
5 NTPC 1984-85 Lev and Schwartz Model
6 INFOSYA 1995-96 Lev and Schwartz Model
Source: A Report on HRA from http://www,indiamba.com
XIMB Journal of Case Research Volume IV Issue 02
Page | 133
Exhibit 3 – Human Resource Accounting Valuation of Infosys
in Crores
2011 2010
Employees (no.)
Software professionals 1,23,811 1,06,864
Support 7,009 6,932
Total 1,30,820 1,13,796
Value of human resources
Software professionals 1,22,539 1,06,173
Support 12,566 7,114
Total 1,35,105 1,13,287
Total income(1) 27,501 22,742
Total employee cost(1) 14,856 12,093
Value-added 25,031 20,935
Net profit(1) 6,823 6,219
Ratios
Value of human resources per employee 1.03 1.00
Total income / human resources value (ratio) 0.20 0.20
Employee cost / human resources value (%) 11.0 10.7
Value-added / human resources value (ratio) 0.19 0.18
Return on human resources value (%) 5.1 5.5
XIMB Journal of Case Research Volume IV Issue 02
Page | 134
Exhibit 4 - Human Asset Value Analysis in BHEL
Year Turnover
(Crore)
Value
added
(Millions)
Manpower
(Number)
Value per
employee(Lakhs)
Turnover per
employee(Crore)
2005-06 14,525 5,682 42,601 13.34 0.34
2006-07 18,739 7,182 42,124 17.35 0.44
2007-08 21,401 8,323 43,636 19.00 0.49
2008-09 28,033 98,940 45,666 21.67 0.61
2009-2010 34,154 1,31,710 46,274 27.70 0.74
2010-2011 43,337 1,84,760 46,748 0.93
Source: www.bhel.com (extracted on 31st August 2011)

XIMB Journal of Case Research Volume IV Issue 02
Page | 135
Exhibit 5 - Human Asset Value Analysis in NTPC
Year Revenue
(Millions)
Employee
strength
Commercial
Generation
Generation per
employee MU
Value add
(Millions)
Value add
per
employee
(Millions)
Man:
MW
Ratio
2005-06 188674 21,870 169789 7.81 97,206 4.44 0.91
2006-07 170880 23,602 188140 7.99 111012 4.70 0.91
2007-08 188670 23,674 200280 8.48 127538 5.39 0.87
2008-09 200280 23,639 206156 8.76 140548 5.95 0.85
2009-10 206939 23,743 218439 9.22 173313 7.30 0.82
2010-11 218840 25,144 - 9.27 - - 0.77
XIMB Journal of Case Research Volume IV Issue 02
Page | 136
Exhibit 6 - Human Asset Value Analysis in SAIL
Year Net sales
(Crore)
Net worth
(Crore)
Tonne crude
steel/man/year
Production in
000, tones
Manpower
2005-06 27,860 12,386 - 13470 138211
2006-07 33,923 17,184 - 13506 132973
2007-08 39,508 23,004 214 13962 128804
2008-09 43,204 28,148 215 13411 121295
2009-10 40,551 33,317 226 13506 116950
2010-2011 42,719 37,069 241 13506 114160
Source: www.sail.co.in (extracted on 30th January 2012)

XIMB Journal of Case Research Volume IV Issue 02
Page | 137
Exhibit 7 - Current Assets including Employees for SAIL
As at 31st March
2011
As at 31st March
2010
( in crore) Gold Coins on Hand 0.40 2.63 Interest Receivable / Accrued
Loans to other companies 1.70 0.00 Deposits 466.24 755.00 Employees 14.87 18.95 Others 13.92 496.73 12.13 786.08
497.13 788.71
Less Provision for Doubtful interest
2.64
2.39
494.49 786.32
Particulars Secured, considered good 9.67 11.74 Unsecured, Considered good
484.82 774.58
Unsecured, considered doubtful
2.64 2.39
497.13 788.71
Source: www.sail.co.in (extracted on 30th January 2012)
XIMB Journal of Case Research Volume IV Issue 02
Page | 138
Exhibit 8 - Human Asset Value Analysis ONGC
Year Net Profit
(Millions)
Turnover
(Millions)
Value per
employee
(Millions)
Number of
employees
Expenditure
on
employee
(Millions)
ROCE
PBIT/capital
employed %
2005-06 144,308 428,009 7.9 34,722 30,147 57.5
2006-07 156,429 569,037 8.4 33,810 48,833 56.7
20007-08 167,016 601,373 8.8 32,996 60,484 52.0
2008-09 161,263 639,493 11.7 33,035 47,396 49.9
2009-10 168,676 602,062 13.1 32,826 - 50.9
Source: www.ongcindia.com (extracted on 10th September 2011)
XIMB Journal of Case Research Volume IV Issue 02
Page | 139
Exhibit 9 - Human Resource valuation for ONGC
Employee Group Age Distribution Total
<31 31-40 41-50 51-60 2010-2011 2009-2010
A. Technical
Executive 1,694 1,211 7,396 9,653 19,954 19,542
Non-Executive 689 670 1,093 928 3,380 3,066
Total (A) 2,383 1,881 8,489 10,581 23,334 22,608
B. Non - Technical
Executive 182 477 1,472 2,910 5,041 4,942
Non-Executive 40 546 1,815 2,497 4,898 5,276
Total (B) 222 1,023 3,287 5,407 9,939 10,218
Grand Total (A+B) 2,605 2,904 11,776 15,998 33,273 32,826
Note: Whole time Directors excluded
XIMB Journal of Case Research Volume IV Issue 02
Page | 140
Valuation as on 31st March, 2011
( in million)
Employee Group Age Distribution Total
<31 31-40 41-50 51-60 2010-2011 2009-2010
A. Technical
Executive 38,415 32,424 153,834 111,480 336,153 16.85 15.41
Non-Executive 7,992 7,904 15,141 8,105 39,142 11.58 9.31
Total (A) 46,407 40,328 168,975 119,585 375,295 16.08 14.58
B. Non - Technical
Executive 4,039 11,749 26,154 28,179 70,121 13.91 13.55
Non-Executive 493 6,396 20,073 17,177 44,139 9.01 6.60
Total (B) 4,532 18,145 46,227 45,356 114,260 11.50 10.02
Grand Total (A+B) 50,939 58,473 215,202 164,941 489,555 14.71 13.10
Based on “Lev & Schwartz” model which is a cost based valuation of employee expenditure
Aggregate future earnings (with annual increment) during remaining employment period of
employees, discounted @8% p.a. provided the present valuation
Source: www.ongcindia.com (extracted on 30th January20

XIMB Journal of Case Research Volume IV Issue 02
Page | 141
Exhibit 10 - Disclosure of Selected Variables for HR related information for given PSUs.
D=Disclosure & ND=Non Disclosure
Disclosure of variable BHEL SAIL ONGC NTPC Total
1 Value add D D ND D 3
2 EVA D ND ND ND 1
3 Value add per employee D ND D D 3
4 Valuation model used D D D D 4
5 Discount rate D D D D 4
6 Value of HR ND ND D ND 1
7 Value of HR per
employee
ND ND D ND 1
8 Number of employee D D D D 4
9 Age wise distribution ND ND D ND 1
10 Group wise distribution D D D D 4
11 Turnover per employee D ND ND
D(Genera
tion per
employee
)
2
12 Employee
Remuneration &Benefit
D D D
(Expend
on
employee)
D
4
Total 9 6 9 8 32

XIMB Journal of Case Research Volume IV Issue 02
Page | 142
References
Bhat, V.P. (2000, January 13). India: Towards transparency and uniformity. Business line. Chennai, l.
Bhattacharyya, D.K. (2007). Human Resource Research Methods. Oxford University Press.
Bullen, ML. & Novin, A.M. (2000). Human Resource Accounting and the Balanced Scorecard. http://www.clayton.edul,November 09, 2009
Bullen, M.L. (2007). Human resource accounting: A useful tool for measurement and management in organizations. Leadership and Organizational Management Journal .85-103.
Bontis, N. (2003), “Intellectual capital disclosure in Canadian corporations”, Journal of Human Resource Costing & Accounting, Vol. 7 Nos 1/2, pp. 9-20.
Chhabra, T.N. (2006). Text and Cases in Human Resource Management. New Delhi: Dhanpat Rai and Company Limited.
Culpepper, Anthony J., and Smith, J.G.(2007), “To Tell or Not to Tell ? How does culture impact corporate disclosure of non-financial metrics?”, Graziadio Business Report, 10(3).
Culpepper, A.(2005) The Effect of Disclosure of Human Assets on Publicly Traded Companies in India (Doctoral dissertation, Pepperdine University).
DeCenzo, D.A. & Robbins, S.P. (2007).Fundamentals of Human Resource Management. New Delhi: Wiley India(P) Publication.
Falmholtz, Eric G. & Main, Erica D. (1999).Current Issues, Recent Advancements, and Future Directions in Human Resource Accounting. Journal of human Costing and Accounting.4(1),l 1-20
Flamholtz, E.G., Bullen, ML., & Hua, W. (2002). Human Resource Accounting: A historical perspective and future implications. Management Decision, 40 (10),947-54.
Flamholtz, E.G., Bullen, M.L., & Hua, W. (2003). Measuring the ROI of management development: An application of the stochastic rewards valuation model. Journal of Human Resource Costing and Accounting, 7 (1-2), 21-40.
Flamholtz, E. 0, Kannan-Narasimhan, R., & Bullen, M.L.(2004). Human Resource Accounting today: Contributions, controversies and conclusions. Journal of Human Resource Costing & Accounting, 8 (2), 23-37
Gupta, R.K. (2003). Human Resource Accounting. New Delhi: Anmol Publication Pvt. Ltd.
Gupta, S.C. (2009). Advance Human Resource Management: Strategic Perspective. New Delhi: Ane Books Pvt. Ltd.
Mahalingam, S. (2001),Of human capital. Praxis, Business Line. Meeting, D.T., Luecke,R.W. & Garceau, L.(2001).Future cash flow measurements. Journal of Accountancy, 192(4), 57-67.
Moore, R. (2007). Measuring how ‘human capital’ appreciates in value over time. Plant Engineering 61(4), 29.
Malik, R.K. (1997). Human Resource Accounting and Decision Making. New Delhi: Anmol Publication Pvt. Ltd.

XIMB Journal of Case Research Volume IV Issue 02
Page | 143
Mirza, S. (2003). Human Resource Management. New Delhi: Tata McGrawHill Publishing Company Limited.
Parameswaran, R. & Jothi, K. (2005). Human Resource Accounting.The Chartered Accountant. January, 867-874
Rahman, A. (2005). Human Resource Accounting and Its Reporting Practices. Pakistan Journal of Social Science. 3(6):889-891
Jaggi, B., and S. Lau (1974).Toward a Model for Human Resource Valuation.The Accounting Review, 321-29
Lev, Baruch., & Schwartz, A. (1974). On the Use of Economic Concepts of Human Capital in Financial Statements. Accounting Review, 71.
Lev, B., & Schwartz, A.(1971, January). On the Use of the Economic Concept of Human Capital in Financial Statements. Accounting Review , 103-112.
Sveiby, Karl E. (1989). The Invisible Balance Sheet. Stockholm: Affarfgarblen. 1989.
Sveiby, Karl E. (1997). The New Organizational Wealth. San Francisco: Berrett-Koehler. 1997.
Sweiby, Karl B. The Intangible Assets Monitor, Journal of HRCA, 20), Spring 1997.
Patra R., Khatik, 5K., & Kolhe, M. (2003). Human resource accounting policies and practices: A case study of Bharat Heavy Electricals Limited, Bhopal, India. International Journal of Human Resources Development and Management, 3 (4), 285.
XIMB Journal of Case Research Volume IV Issue 02
Page | 144
Case Review Questions
1. Is it necessary for Indian companies to follow Human Resources accounting
practices? If so under what section such disclosures are needed?
2. What are intangible assets and why are they so much talked about? Discuss the role
of Human Capital as intangible asset?
3. Why are leading PSUs in India following Human Resource Accounting practices from
so many years? What are the major benefits in terms of building employer
reputation or brand?
4. What are the implications for Human Resource valuation for different companies?
Discuss the tradeoff between cost and benefits.