import summary report egypt - saudiexports.sa · countries in gcc under greater arab free trade...
TRANSCRIPT

Import Summary ReportEgyptMay 2015
Egypt

1
Import Summary ReportEgyptContents
DisclaimerThe Import Summary Report has been prepared by Saudi Exports (Saudi Export Development Authority) as a part of its continuous publication on countries. The purpose of this study is to provide a high-level view of global imports based on available public information. Its analysis, perceptions, and anticipations are subject to personal judgment. Saudi Exports is not liable for any consequences caused by the understanding and interpretation of any part of this report. In general, the information in the report present a broad view of the imports to the country. Saudi exporters are encouraged to carry out further studies for any potential opportunities identified in this report.
Disclaimer
1. Imports Overview
2. Non-oil Imports
3. Industry Import Profiles
3.1 Food & Beverage
3.2 Heavy Machinery & Electronics
3.3 Building Materials
3.4 Chemicals & Polymers
3.5 Textiles
3.6 Pharmaceuticals
3.7 Consumer Durables
3.8 Packaging
Appendix
1
3
3
5
5
7
8
10
11
13
14
16
18

2
Import Summary ReportEgypt
For comments and queries please contact:
Telephone: +966 11 874 2000Fax: +966 11 874 2002Email: [email protected] of Saudi ArabiaP.O. Box 75169, Riyadh 11578
Saudi Export Development Authoritywww.saudiexports.sa
• Egypt’s GDP has grown at 3% per year from 2009 to 2013. The political situation of the country has been stabilizing, leading to economic boost and growth in Egypt’s imports by 10% over the past five years
• Non-oil imports which constituted 86% of Egypt’s overall imports in 2013, increased by 9% per year from 2009 to 2013. Among the non-oil imports food & beverages, heavy machinery & electronics, building materials, chemicals & polymers, textiles, pharmaceuticals, consumer durables and packaging are the major product categories
• Though currently the Kingdom occupies only 3% of Egypt’s non-oil import segment, imports from KSA have seen a rapid growth of 19% in past five years. The Kingdom is a major supplier of chemicals & polymers, packaging, consumer durables and building materials to Egypt
This report looks into Egypt’s non-oil import market vis-à-vis the Kingdom’s share in the segment. It also outlines the import potentials in certain industries such as food & beverages, heavy machinery & electronics, building materials, chemicals & polymers, pharmaceuticals, consumer products, and packaging. Imports of services by Egypt are not part of this Import Summary Report.
Summary

3
Import Summary ReportEgypt
1. Imports Overview According to International Monetary Fund1, Egypt is the 40th largest economy in the world and the fifth largest economy in the Middle East and North Africa (MENA) region. Between 2009 and 2013, the country’s real Gross Domestic Product (GDP) grew at a cumulative annual growth rate (CAGR) of 3% to 482 billion SAR2 in 2013.
Figure 1 shows distribution of Egypt’s imports from 2009 to 2013. Total imports to the country increased by 10% per year. Imports of oil increased significantly by 21%. However imports of chemicals & polymers also increased by 13% annually in these five years. Non-oil, Non-chemical and non-polymers imports constituted more than 75% of total imports in 2013 and grew at an annual rate of 9% during the last five years.
Figure 1: Import profile of Egypt3
Figure 1 also shows country wise breakup of Egypt’s import portfolio. Among its partner countries, China is the biggest contributor to Egyptian imports, supplying 11% of total imported goods in 2013, primarily heavy machinery & electronics, building materials, consumer durables, and textiles. China is followed by Germany which exports pharmaceuticals, building materials, and consumer durables to Egypt. The Kingdom accounted for 5% of the total imported products, which primarily include oil, chemicals & polymers, packaging, and consumer durables. Egypt has trade agreements (refer to Appendix 1) with EU. Egypt also enjoys free trade with other countries in GCC under Greater Arab Free Trade Agreement (GAFTA).
2. Non-oil ImportsEgypt imports food & beverages, heavy machinery & electronics, building material, chemicals & polymers, precious metals & jewelry, and textiles. A strong domestic demand for these products witnessed the non-oil imports grow by 9% annually from 152 billion SAR in 2009 to 216 billion SAR in 2013 (Figure 2).
1. Report for Selected Countries and Subjects, World Economic Outlook, IMF, October 20142. GDP (constant 2005 US$), The World Bank3. Trade Map Database, International Trade Center
Oil Chemicals & Polymers
Others
in billion SAR
2013
Impo
rt P
rofil
e –
by co
untr
y
10% 11% China
8% Germany
8% USA
6% Italy
5% Ukraine
5% KSA
4% Turkey
55% Others
11%
8%
8%
6%
5%
5%4%
55%1613
139
168
2615
158
199
34
18
181
234
48
20
194
262
34
21
195
250
Total Imports250 bn SAR
2009 2010 2011 2012 2013

4
Import Summary ReportEgypt
* include Packaging, Automobiles, Scrap/ Used items, Consumer Curables, Pharmaceuticals, Minerals etcFigure 2: Non-oil products Imported by Egypt4
Figure 3 shows country wise breakup of Egypt’s non-oil imports in 2013.China leads the segment with 12% of total imports. It is closely followed by Germany which accounts for 9% of non-oil product supply.
Figure 3: Non-oil Imports to Egypt by country (2013)5 Non-oil imports from the Kingdom have seen a staggering growth. Figure 4 shows that non-oil imports from KSA doubled in the five years from 2009 to 2013.
In non-oil imports from KSA, chemicals & polymers contributed 2.9 billion SAR i.e. close to 50% of the total non-oil imports from the Kingdom in 2013. The high growth rate over the last five years emphasizes the need to explore opportunities in non-oil segments especially for food & beverages, packaging, building materials, and heavy machinery & electronics.
Others*Chemicals & PolymersBuilding MaterialsHeavy Machinery &Electronics
Food & Beverages
9%
28
29
30
13
52
152
36
30
29
15
63
173
54
31
31
18
66
200
57
31
35
20
70
214
43
35
34
21
83
216in billion SAR
2009 2010 2011 2012 2013
12% China
9% Germany
9% USA
5% Ukraine
5% Italy
4% Brazil
3% KSA
53% Others
12%
9%
9%
5%
5%4%3%53%
Total Imports216 bn SAR
4. Trade Map Database, International Trade Center 5. Trade Map Database, International Trade Center

5
Import Summary ReportEgypt
Figure 4: Non-oil products imported by Egypt from KSA6
3. Industry Import Profiles3.1 Food & BeverageFood & Beverage products contribute 17% to Egypt’s non-oil imports in 2013. Egypt imports a diverse set of Food & Beverage products – cereals, cooking oil & fats, meat products, fruits & vegetables, dairy products, and fruit juices & beverages. In the past five years, Egypt’s import of Food & Beverage products increased by 11% CAGR.Figure 5 shows the distribution of Egypt’s imports of Food & Beverage products. Due to growing demand in the domestic market, imports of Foods & Beverages stood at 43 billion SAR in 2013.
*include Bakery & Confectionery and Seasoning, Flavoring & Sweeteners etcFigure 5: Food & Beverage products Imports to Egypt٧
Figure 6 shows country wise breakup of Egypt’s imports of Food & Beverage products. Supply of imported machinery goods is concentrated with the top five countries supplying 53% of the total imports in 2013.Argentina is the major contributor in this product category. Along with frozen meat and butter & milk products, Egypt also imports dried fruits & vegetables and corn & soya beans from Argentina. Egypt imports meat products, coffee, & other beverages from Brazil and USA.
Chemicals and Polymers Others
in billion SAR
19%33% Building Materials
20% Packaging
15% Consumer Durables
7% Pharmaceuticals
7% Food & Beverages
7% Textiles
11% Others
33%
7%
7%
7%
11%
20%15%
1.8
1.1
2.9
2.2
1.7
3.9
2.6
2.4
5.0
2.8
2.3
5.1
3.0
2.9
5.9
Total Imports3.0 bn SAR
2009 2010 2011 2012 2013
in billion SAR
Expa
ndin
g 20
13 im
port
s fur
ther
11%33% Cereals
21% Cooking Oil & Fats
14% Meat Products
9% Fruits & Vegetables
7% Dairy Products
7% Fruit Juice & Beverages
9% Others
33%
9%
7%
7%
9%
21%14%
8
44
12
28 10
6
5
16
36
14
6
10
24
54
16
8
8
24
57
14
6
9
14
43
Total Imports43 bn SAR
2009 2010 2011 2012 2013
Cereals Cooking Oil & Fats
Others*Meat Products
6. Trade Map Database, International Trade Center 7. Trade Map Database, International Trade Center

6
Import Summary ReportEgypt
Figure 6: Food & Beverage products imports to Egypt- by country٨
In 2013, KSA exported Food & Beverage products worth of 221 million SAR to Egypt. As shown in figure 7 imports have increased by 16% CAGR from 2009 to 2013. There has been growing demand for dairy products, fruits & vegetables produced in the Kingdom. High demand in the segment gives Saudi exporters an opportunity to target this market aggressively.
*include Dairy Products, Fruits & Vegetables, Cereals etcFigure 7: Food & Beverage products Imported by Egypt from KSA٩
14% Argentina
13% Brazil
12% USA
10% Ukraine
4% Indonesia
4% India
1% KSA
42% Others
14%
13%
12%
10%4%4%1%
42%
Total Imports43 bn SAR
in million SAR
Expa
ndin
g 20
13 im
port
s fur
ther
16%50% Fruit Juice & Beverages
20% Bakery & Confectionary
9% Cooking Oil & Fats
6% Dairy Products
6% Fruits & Vegetables
5% Cereals
4% Others50%20%
9%
6%
6%
5%4%
78
1824
12049
23
45
34
151
67
25
85
70
247
54
7
127
45
234
46
20
110
45
221
Total Imports221 mn SAR
2009 2010 2011 2012 2013
Fruit Juice & Beverages Bakery & Confectionary
Others*Cooking Oil & Fats
8. Trade Map Database, International Trade Center 9. Trade Map Database, International Trade Center
7
Import Summary ReportEgypt
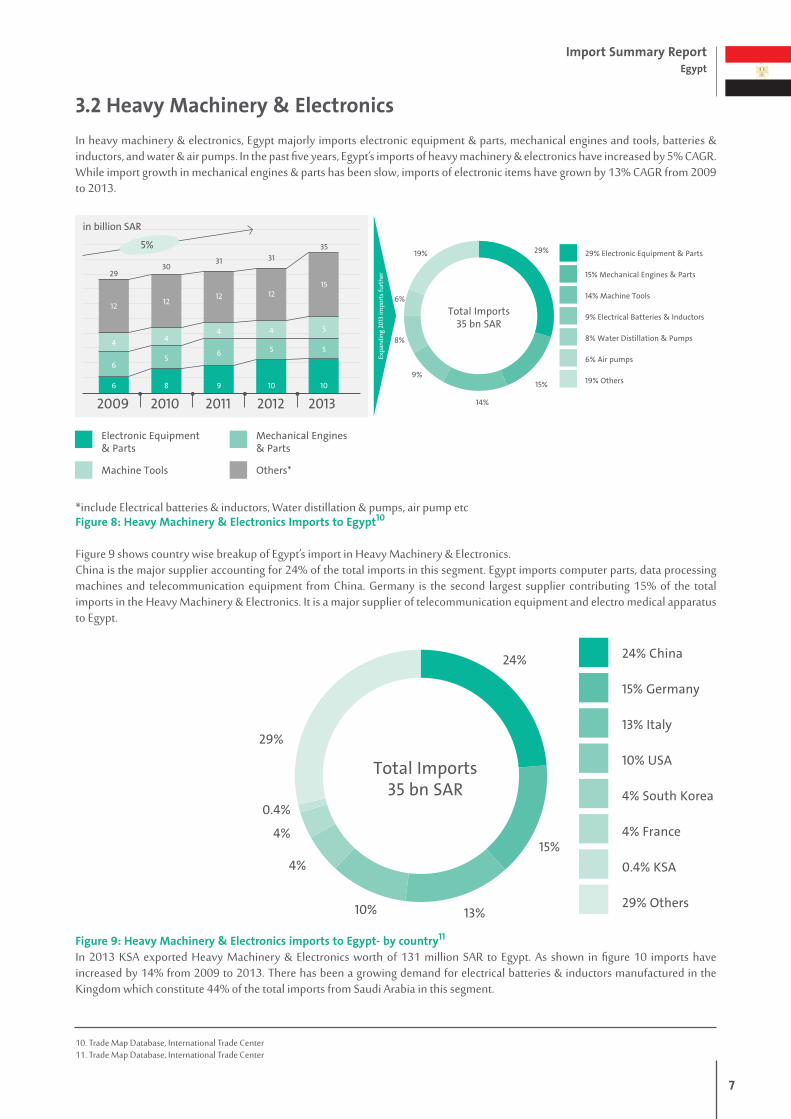
3.2 Heavy Machinery & ElectronicsIn heavy machinery & electronics, Egypt majorly imports electronic equipment & parts, mechanical engines and tools, batteries & inductors, and water & air pumps. In the past five years, Egypt’s imports of heavy machinery & electronics have increased by 5% CAGR.While import growth in mechanical engines & parts has been slow, imports of electronic items have grown by 13% CAGR from 2009 to 2013.
*include Electrical batteries & inductors, Water distillation & pumps, air pump etcFigure 8: Heavy Machinery & Electronics Imports to Egypt١٠
Figure 9 shows country wise breakup of Egypt’s import in Heavy Machinery & Electronics. China is the major supplier accounting for 24% of the total imports in this segment. Egypt imports computer parts, data processing machines and telecommunication equipment from China. Germany is the second largest supplier contributing 15% of the total imports in the Heavy Machinery & Electronics. It is a major supplier of telecommunication equipment and electro medical apparatus to Egypt.
Figure 9: Heavy Machinery & Electronics imports to Egypt- by country١١
In 2013 KSA exported Heavy Machinery & Electronics worth of 131 million SAR to Egypt. As shown in figure 10 imports have increased by 14% from 2009 to 2013. There has been a growing demand for electrical batteries & inductors manufactured in the Kingdom which constitute 44% of the total imports from Saudi Arabia in this segment.
in billion SAR
Expa
ndin
g 20
13 im
port
s fur
ther
5%29% Electronic Equipment & Parts
15% Mechanical Engines & Parts
14% Machine Tools
9% Electrical Batteries & Inductors
8% Water Distillation & Pumps
6% Air pumps
19% Others15%
14%
9%
8%
6%
19% 29%
12
4
6
6
29
12
4
5
8
30
12
4
6
9
31
12
4
5
10
31
15
5
5
10
35
Total Imports35 bn SAR
2009 2010 2011 2012 2013
Electronic Equipment& Parts
Mechanical Engines& Parts
Others*Machine Tools
24% China
15% Germany
13% Italy
10% USA
4% South Korea
4% France
0.4% KSA
29% Others
24%
15%
13%10%
4%
4%
0.4%
29%
Total Imports35 bn SAR
10. Trade Map Database, International Trade Center11. Trade Map Database, International Trade Center

8
Import Summary ReportEgypt
*include Electronic Equipment, and Air Pump etcFigure 10: Heavy Machinery & Electronics Imported by Egypt from KSA١2
3.3 Building MaterialsWith growing population and economy the demand for imported building materials has increased steadily. Imports of building materials increased by 2%CAGR between 2009 and 2013 as shown in figure 11.Imports of metal sheets increased by 12% CAGR in the five years while imports of electric wires & fittings increased by 10% CAGR. In 2013 imports of metal sheets contributed more than 40% of the total imports in this product category.
*include paints & dyes, glass ceramics etcFigure 11: Building Materials Imports to Egypt١3
Figure 12 shows country wise breakup of Egypt’s import in building materials. Ukraine is the major supplier of building materials accounting for 15% of the total imports in this segment. China is the second largest supplier contributing 12% of the total imports in 2013.
in million SAR
Expa
ndin
g 20
13 im
port
s fur
ther
14%44% Electrical Batteries & Inductors
19% Machine Tools
13% Mechanical Engines & Parts
8% Electronic Equipment & Parts
5% Water Distillation & Pumps
1% Air pumps
10% Others44%19%
13%
8%
5%1%
10%
24
21
15
18
79
29
30
28
32
11815
27
27
56
126
16
10
22
38
85
32
17
24
58
131
Total Imports131 mn SAR
2009 2010 2011 2012 2013
Electrical Batteries& Inductors
Machine Tools
Others*Mechanical Engines& Parts
in billion SAR
Expa
ndin
g 20
13 im
port
s fur
ther
2%
44% Metal Sheets
15% Pipes & Tubes
12% Electric Wires & Fittings
4% Paints & Dyes
3% Glass & Ceramics
22% Others
44%
15%
12%
4%
3%
22%
12
3
5
9
29
10
3
4
11
28
9
3
4
13
30
10
3
5
15
33
9
4
5
14
32
Total Imports32 bn SAR
2009 2010 2011 2012 2013
Metal Sheets Pipes & Tubes
Others*Electric Wires & Fittings
12. Trade Map Database, International Trade Center 13. Trade Map Database, International Trade Center

9
Import Summary ReportEgypt
Figure 12: Building Materials imports to Egypt - by country١4
In 2013 KSA exported Building Materials worth of 527 million SAR to Egypt. As shown in figure 13, imports from KSA have remain stagnant from 2009 to 2013. Exports of paints & Dyes constituted 39% of the total exports from the Kingdom in 2013. Import of pipes and tubes witnessed the decline of 10% per year in past five years.
*include cement & plaster, metal sheets, electric wires & fittings etcFigure 13: Chemicals & Polymers Imported by Egypt from KSA١5
15% Ukraine
12% China
9% Germany
8% USA
8% Italy
5% Turkey
3% KSA
40% Others
15%
12%
9%
8%8%5%
40%
3%
Total Imports34 bn SAR
in million SAR
Expa
ndin
g 20
13 im
port
s fur
ther
-2%
39% Paints & Dyes
5% Pipes & Tubes
4% Cement & Plaster
3% Metal Sheets
3% Electric Wires & Fittings
46% Others39%
5%4%3%3%
46%
375
422
149
420
376
204
331
402
279
265
497
199
272
2720
208
569
667 653
521 527
Total Imports527 mn SAR
2009 2010 2011 2012 2013
Paints & Dyes Pipes & Tubes
Others*Cement & Plaster
14. Trade Map Database, International Trade Center 15. Trade Map Database, International Trade Center

10
Import Summary ReportEgypt
3.4 Chemicals & PolymersEgypt imports basic chemicals, polymers, inorganic chemicals, and fertilizers from partner countries. In the past five years, Egypt’s imports of chemicals & polymers increased by 13% CAGR.Imports of polymers have witnessed a growth of 15% from 2009 to 2013 while imports of basic chemicals & inorganic chemicals have increased by 9% each as shown in figure 14.
*include fertilizers etcFigure 14: Chemicals & Polymers Imports to Egypt١6
Figure 15 shows country wise breakup of Egypt’s import in chemicals & polymers. Saudi Arabia is the major supplier supplying 14% of the total imports in this segment. China, another major supplier of chemicals & polymers, is the second largest supplier contributing 11% of the total imports in 2013.
Figure 15: Chemicals & Polymers imports to Egypt by country١7
In 2013 KSA exported Chemicals & Polymers worth of 2.9 billion SAR to Egypt. As shown in figure 16 imports increased by 26% from 2009 to 2013. In 2011, Egypt imported polymers worth 2.6 billion SAR from KSA to meet the growing domestic demand.
in billion SAR
Expa
ndin
g 20
13 im
port
s fur
ther
13%
46% Polymers
29% Basic Chemicals
9% Inorganic Chemicals
3% Fertilizers
13% Others
46%
29%
9%
3%
13%
4
6
12
13
5
7
2
2
15
6
9
2
3
19
6
9
2
3
21
6
10
2
3
21
Total Imports21 bn SAR
2009 2010 2011 2012 2013
Polymers Basic Chemicals
Others*Inorganic Chemicals
14% KSA
11% China
10% Germany
8% USA
5% South Korea
4% India
4% Italy
44% Others
14%
11%
8%
10%
5%4%4%
44%
Total Imports21 bn SAR
16. Trade Map Database, International Trade Center 17. Trade Map Database, International Trade Center

11
Import Summary ReportEgypt
*includes fertilizers, inorganic chemicals etcFigure 16: Chemicals & Polymers Imported by Egypt from KSA18
3.5 TextilesTextile is one of the fastest growing import segment. Egypt import products spanning from cloths, fabrics to carpets to hand-woven tapestries. In the past five years, Egypt’s import of Textiles has increased by 7% CAGR.Due to growing domestic market for imported clothing materials, demand of fabrics and cloths increased steadily. Imports in both these categories have grown by 7.5% CAGR, higher than overall segment’s growth.
*include accessories, carpets, synthetic textiles etcFigure 17: Egypt’s Imports of Textiles١9
Figure 18 shows country wise breakup of Egypt’s imports in textile segment. Supply of imported textile products is concentrated with China supplying 43% of total imports.Along with woven cotton fabrics, Egypt also imports synthetic yarn and shirts & blouses from China. Egypt primarily imports textile garments and knitted fabric from India.
in thousand SAR
Expa
ndin
g 20
13 im
port
s fur
ther
89% Polymers
10% Basic Chemicals
1% Inorganic Chemicals
0.1% Fertilizers
0.1%1%10%
89%
1,060
1,1331657
1,506
1,67324143
2,054
2,36720
293
2,039
2,33532
263
2,588
2,89830
280
Total Imports2.9 bn SAR
2009 2010 2011 2012 2013
Polymers Basic Chemicals
Others*
26%
in billion SAR
Expa
ndin
g 20
13 im
port
s fur
ther
7%
54% Fabrics
38% Cloths
4% Accessories
2% Carpets
2% Others
54%
38%
4%2% 2%
4
1
5
9
5
2
5
12
4
6
11
4
1
6
11
5
1
7
12
Total Imports12 bn SAR
2009 2010 2011 2012 2013
Fabrics Cloths
Others*
18. Trade Map Database, International Trade Center 19. Trade Map Database, International Trade Center

12
Import Summary ReportEgypt
Figure 18: Egypt’s Import of Textile Products by Country20
As shown in figure 19, the Kingdom exported textile products worth of 199 million SAR in 2013 though the imports have decreased at a rate of 61% over the last five years.
* include synthetic textiles etcFigure 19: Egypt’s Import of Textile Products from KSA21
43% China
9% India
9% Turkey
4% Indonesia
3% Pakistan
3% USA
1.6% KSA
44% Others43%
9%9%
4%
3%
3%
1.6%
44% Total Imports12 bn SAR
in million SAR
Expa
ndin
g 20
13 im
port
s fur
ther
8%
54% Fabrics
28% Cloths
18% Carpets
0.1% Others
54%
28%
18%
0.1%
38
27
79
1451
48
70
83
2032
27
71
114
211
24
57
108
1891
35
57
107
199
Total Imports199 mn SAR
2009 2010 2011 2012 2013
Fabrics Cloths
Others*Carpets
20. Trade Map Database, International Trade Center 21. Trade Map Database, International Trade Center

13
Import Summary ReportEgypt
3.6 PharmaceuticalsEgypt imports drugs, medical instruments, and vaccines from its partner countries. Over the past five years, Egypt’s import of pharmaceuticals has increased by 14% CAGR as shown in figure 20.
Figure 20: Egypt’s Import of Pharmaceuticals22
Figure 21 shows country wise breakup of Egypt’s import of pharmaceuticals. Germany is the major contributor to pharmaceuticals imported by Egypt, supplying 44% of the total pharmaceutical imports. Switzerland and France supplied 12% and 8% of total imports respectively while KSA contributed 3% of the pharmaceuticals imported by Egypt.
Figure 21: Egypt’s Imports of Pharmaceuticals by Country23
As shown in figure 22, Saudi Arabia exported pharmaceuticals worth of 227 million SAR in 2013. Demand for pharmaceuticals manufactured in the Kingdom increased by 38% per year over the last five years.
in billion SAR
Expa
ndin
g 20
13 im
port
s fur
ther
14%
82% Drugs
11% Medical Instruments
7% Vaccines
0.3% Others
82%
7%
11%
0.3%
4.0
0.60.45.0
4.1
0.50.45.0
5.2
0.60.56.3
6.5
0.80.57.8
6.9
0.9
0.58.3
Total Imports8.3 bn SAR
2009 2010 2011 2012 2013
Drugs Medical Instruments
OthersVaccines
44% Germany
12% Switzerland
8% France
8% USA
3% UK
3% China
3% KSA
19% Others44%
12%
8%
8%
3%
3%
3%
19%
Total Imports8.3 bn SAR
22. Trade Map Database, International Trade Center 23. Trade Map Database, International Trade Center

14
Import Summary ReportEgypt
Figure 22: Pharmaceutical Imports to Egypt from KSA24
3.7 Consumer DurablesEgypt imports consumer electronics, toiletries, kitchen goods, furniture, sports equipment & toys from its partner countries. Over the past five years, Egypt’s import of consumer durables has increased by 13% CAGR as shown in figure 23.
*include Furniture, Sports Equipment & Toys etcFigure 23: Egypt’s Import of Consumer Durables25
Figure 24 shows country wise breakup of Egypt’s import of consumer durables. China is the major contributor to food products imported by Egypt, supplying 23% of the total consumer durables imports. Each of Lithuania and Germany supplied 8% of total imports while KSA contributed 6% of the consumer durables imported by Egypt.
Medical InstrumentsDrugs
38%
60
633
93
973
140
1455
167
1758
219
2278
in million SAR
2009 2010 2011 2012 2013
in billion SAR
Expa
ndin
g 20
13 im
port
s fur
ther
13%
25% Consumer Electronics
15% Toiletries
8% Kitchen Goods
7% Furniture
5% Soprts Equipment & Toys
40% Others
25%
15%
8%7%
5%
40%2.1
0.30.5
1.1
4.03.0
0.4
0.7
1.1
5.2
3.2
0.5
0.8
1.3
5.8
3.6
0.5
1.1
1.4
6.7
3.4
0.5
1.0
1.6
6.5
Total Imports6.5 bn SAR
2009 2010 2011 2012 2013
Consumer Electronics Toiletries
Others*Kitchen Goods
24. Trade Map Database, International Trade Center 25. Trade Map Database, International Trade Center

15
Import Summary ReportEgypt
Figure 24: Egypt’s Imports of Consumer Durables by Country26
As shown in figure 25, Saudi Arabia exported consumer durables worth of 443 million SAR in 2013. Demand for consumer durables manufactured in the Kingdom increased by 40% per year over the last five years.
* include kitchen goods, furniture etcFigure 25: Consumer Durables Imports to Egypt from KSA27
23%
8%
8%
6%5%5%
4%
41%
Total Imports6.5 bn SAR
23% China
8% Lithuania
8% Germany
6% KSA
5% France
5% Italy
4% USA
41% Others
in million SAR
Expa
ndin
g 20
13 im
port
s fur
ther
40%
50% Toiletries
32% Consumer Electronics
13% Soap & Washing Agents
4% Kitchen Goods
0.5% Furniture
1% Others
50%
32%
13%
4% 0.5% 1%
21
72
14
114
84
31
106
19
174
184
84
176
27
305
18106
261
31
421
23
142
221
56
443
24
Total Imports443 mn SAR
2009 2010 2011 2012 2013
Toiletries Consumer Electronics
Others*Soap & Washing Agents
26. Trade Map Database, International Trade Center 27. Trade Map Database, International Trade Center

16
Import Summary ReportEgypt
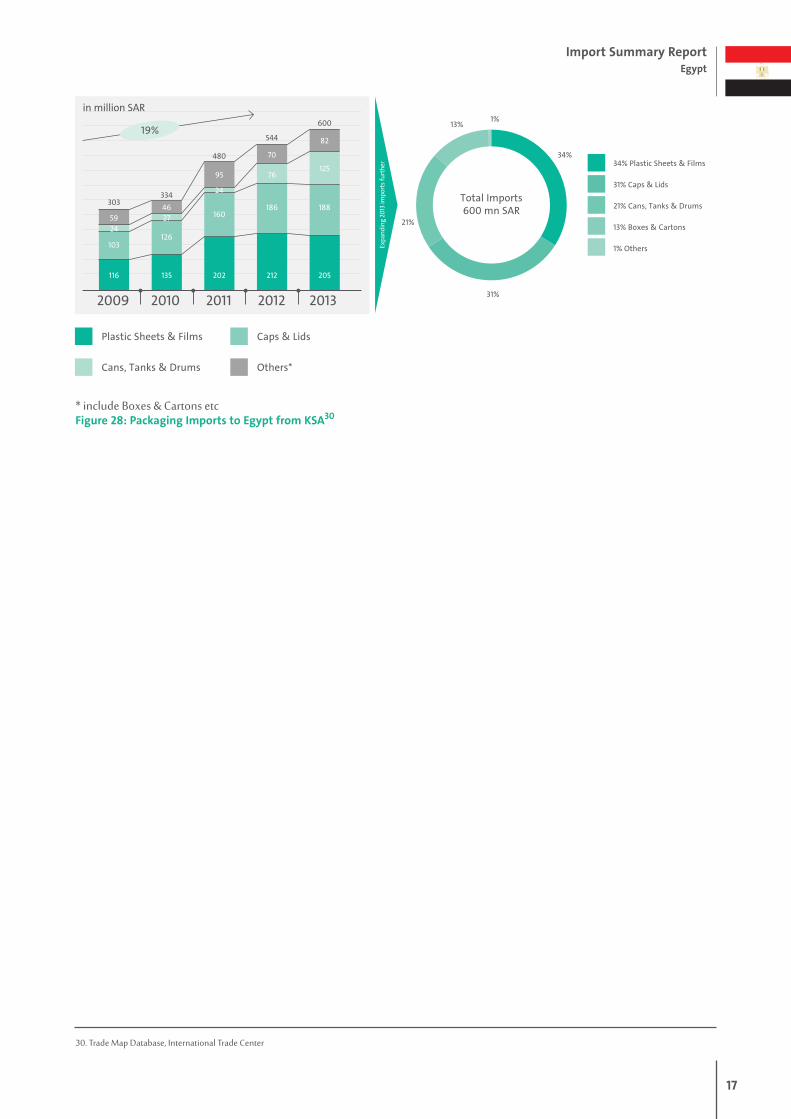
3.8 PackagingIn Packaging, Egypt imports products ranging from plastic sheets and films to cans, tanks & drums containers. Over the past five years, Egypt’s import of packaging products has increased by 8% CAGR as shown in figure 26.
*include boxes & cartons etcFigure 26: Egypt’s Import of Packaging Materials28
Figure 27 shows country wise breakup of Egypt’s import of packaging products. Supply of imported packaging products is fairly concentrated with top 5 countries contributing close to two third of total import demand.Saudi Arabia is the major contributor to packaging products imported by Egypt. Along with containers, Egypt also imports paper based products such as boxes and cartons from the Kingdom.
Figure 27: Egypt’s Imports of Packaging Materials29
As shown in figure 28, Saudi Arabia exported packaging products worth of 600 million SAR in 2013. Demand for packaging material manufactured in the Kingdom is increasing over the last five years especially for cans, tanks & drums which grew by 51% CAGR of the past five years.
in billion SAR
Expa
ndin
g 20
13 im
port
s fur
ther
8%
47% Plastic Sheets & Films
20% Caps & Lids
15% Cans, Tanks & Drums
13% Boxes & Cartons
5% Others
47%
20%
15%
13%
5%
0.4
0.5
0.4
0.8
2.1
0.4
0.3
0.4
1.0
2.2 0.5
0.3
0.5
1.3
2.60.5
0.4
0.6
1.4
2.9
0.5
0.4
0.6
1.4
2.9
Total Imports2.9 bn SAR
2009 2010 2011 2012 2013
Plastic Sheets & Films Caps & Lids
Others*Cans, Tanks & Drums
21%
15%
12%9%
7%
5%
3%
28%
Total Imports2.9 bn SAR
21% KSA
15% China
12% Germany
9% Turkey
7% Italy
5% UAE
3% France
28% Others
28. Trade Map Database, International Trade Center 29. Trade Map Database, International Trade Center
17
Import Summary ReportEgypt
* include Boxes & Cartons etcFigure 28: Packaging Imports to Egypt from KSA30
in million SAR
Expa
ndin
g 20
13 im
port
s fur
ther
19%
34%
31%
21%
13%1%
103
2459
116
303
126
2746
135
334
160
24
95
202
480
186
76
70
212
544
188
125
82
205
600
Total Imports600 mn SAR
2009 2010 2011 2012 2013
Plastic Sheets & Films Caps & Lids
Others*Cans, Tanks & Drums
34% Plastic Sheets & Films
31% Caps & Lids
21% Cans, Tanks & Drums
13% Boxes & Cartons
1% Others
30. Trade Map Database, International Trade Center

18
Import Summary ReportEgypt
Appendix Trade AgreementsEgypt has several trade agreements with many of the countries under the Egypt-EU partnership. Under the partnership Egypt can export its products to EU member nations while Egypt can access products manufactured in those countries.Egypt also has several agreements with other countries which have been listed in Table 1.
Table 1: Trade agreements
Tariff Preferential Agreements Countries
Greater Arab Free Trade Agreement Algeria, Bahrain, Egypt, Iraq, Kuwait, Lebanon, Libya, Morocco, Oman, Qatar, Saudi Arabia, Sudan, Syria, Tunisia, and UAE
European Free Trade Association (EFTA) Iceland, Liechtenstein, Norway, and Switzerland
Common Market for Eastern and Southern Africa (COMESA)
Burundi, Comoros, Congo, Djibouti, State of Eritrea, Ethiopia, Kenya, Libya, Madagascar, Malawi, Mauritius, Rwanda, Seychelles, Sudan, Kingdom of Swaziland, Uganda, Zambia, Zimbabwe
Egypt Turkey Free Trade Agreement Turkey
Egypt-MERCOSUR Agreement Argentina, Brazil, Paraguay and Uruguay