implications of shale gas development for climate...
TRANSCRIPT
Implications of Shale Gas
Development for Climate Change
Richard G. Newell
Director, Duke University Energy Initiative and Gendell Professor of Energy and Environmental Economics,
Nicholas School of the Environment, Duke University
Workshop on Risks of Unconventional Shale Gas Development, National Academy of Sciences
May 31, 2013 | Washington, D.C.

Context
Richard Newell, NAS Shale Gas Workshop, May
31, 2013 2
• This presentation is part of larger workshop on the risks of
shale gas development, covering issues relating to water, air,
health, ecology, community, climate, and other impacts.
• This presentation focuses only on the greenhouse gas
impacts of shale gas development.
• Comprehensive analysis should consider the array of risks
relative to other energy sources, as well as the benefits of
shale gas development.

What questions are at play?
Richard Newell, NAS Shale Gas Workshop, May
31, 2013 3
• Greenhouse gas (GHG) accounting
– Aggregate level. What are the total lifecycle GHG emissions of natural gas
use, including both combustion and upstream non-combustion emissions?
– Sectoral technology level. What are the relative GHG impacts of
technologies that use natural gas for electricity generation, transportation, and
buildings, compared to competing technologies?
• Decisions by producers, policymakers, equipment
manufacturers, and corporate and individual purchasers
– Which technologies are advantageous to promote/develop/market/purchase
taking into account GHG impacts?
– What issues need to be addressed to improve the GHG profile of technologies
based on natural gas?
– How does natural gas abundance change the baseline outlook for GHG
emissions and domestic and international policy responses?

Overview
Richard Newell, NAS Shale Gas Workshop, May
31, 2013 4
• U.S. natural gas use and shale gas development
• Understanding the potential implications of increased natural
gas use on the climate
• Aggregate effects on U.S. energy and economy
• Non-combustion GHG emissions from natural gas
• Sectoral impacts: electricity, residential and commercial
buildings, transportation, and industry
• International implications
• Policy interactions and implications

Relevant existing evidence
Richard Newell, NAS Shale Gas Workshop, May
31, 2013 5
• Baseline statistics
– Emissions accounting (EPA, industry, academia, NGOs)
– Energy data (U.S. Energy Information Administration (EIA), industry)
• Technology lifecycle analysis
– Various studies (source list at close of presentation)
• Energy modeling projections
– EIA Annual Energy Outlook 2013
• Reference case: current policies
• High oil and gas resource case (note also increases oil)
• Low oil and gas resource case (note also decreases oil)
– International Energy Agency World Energy Outlook 2011 and 2012
• New Policies case
• Golden Age of Gas case
– Other modeling studies
U.S. natural gas use and shale gas
development
Richard Newell, NAS Shale Gas Workshop, May
31, 2013 6

7
Image source: U.S. Energy Information Administration, Annual Energy Review 2012.
Richard Newell, NAS Shale Gas Workshop, May
31, 2013
trillion cubic feet in 2011
U.S. natural gas production, distribution, and use

Natural gas was about 26% of total CO2 and
CH4 emissions from U.S. fossil energy in 2011
8
Data source: U.S. EPA Greenhouse Gas Inventory 2013.
Richard Newell, NAS Shale Gas Workshop, May
31, 2013
US GDP
Energy
8%
CH4 4%
Oil CO2
39%
Coal CO2
33%
Natural gas CO2
24%
2011 fossil energy
CO2 and CH4
emissions
5,553 Tg CO2e
Natural gas
CO2 and CH4
1,469 Tg CO2e
(26%)

Shale gas is a globally distributed and abundant
resource
9
Image source: U.S. Energy Information Administration.
Richard Newell, NAS Shale Gas Workshop, May
31, 2013

North America has thus far been the focus
for shale gas production
Image source: U.S. Energy Information Administration.
10 Richard Newell, NAS Shale Gas Workshop, May
31, 2013

0
5
10
15
20
25
30
35
1990 1995 2000 2005 2010 2015 2020 2025 2030 2035 2040
Alaska 1%
U.S. shale gas production has surged and is
expected to growth further U.S. natural gas production
trillion cubic feet per year
Data source: U.S. Energy Information Administration, Annual Energy Outlook 2013, Reference case.
Non-associated offshore
EIA Projection
Associated with oil
Coalbed methane
Non-associated onshore
Shale gas
2012
10%
5%
7% 6%
16%
34%
7%
6%
6%
50%
4%
Tight gas 24% 22%
11 Richard Newell, NAS Shale Gas Workshop, May
31, 2013
History

Current and projected U.S. natural gas prices have
declined Henry Hub spot price
2010 dollars per million Btu
Data source: U.S. Energy Information Administration, Annual Energy Outlook 2008 and 2013, Reference case.
12 Richard Newell, NAS Shale Gas Workshop, May
31, 2013
0
1
2
3
4
5
6
7
8
9
10
1990 1995 2000 2005 2010 2015 2020 2025 2030 2035 2040
2008 EIA projection
2013 EIA projection
Historical prices

Understanding the potential
implications of increased natural gas
use on the climate
Richard Newell, NAS Shale Gas Workshop, May
31, 2013 13

Natural gas abundance has both direct and
indirect effects on GHG emissions and climate
Richard Newell, NAS Shale Gas Workshop, May
31, 2013 14
Increased
natural gas
resources
and
production
Lower
natural gas
prices
Lower overall
energy prices
Net
climate
impact
( +/- ?)
Decreased
renewables & nuclear
consumption (-)
Decreased oil
consumption (-)
Increased natural gas
consumption (+)
Fuel
substitution
Increased
overall energy
consumption
(+)
Policy
Decreased coal
consumption (-) CO2
CH4

Aggregate effects on U.S. energy
economy
Richard Newell, NAS Shale Gas Workshop, May
31, 2013 15

Natural gas is an important energy source, but is only
13% of all U.S. energy expenditures and 1% of GDP
16
Data source: U.S. Energy Information Administration Annual Energy Review 2012.
Richard Newell, NAS Shale Gas Workshop, May
31, 2013
US GDP
Energy
8%
Natural gas 1%
2010 US GDP $15 Trillion
Energy
expenditures $1.2 Trillion
Natural gas
expenditures $159 Billion

Effects related to fuel substitution are likely to
dominate effects on aggregate energy demand
Richard Newell, NAS Shale Gas Workshop, May
31, 2013 17
• Aggregate energy demand is driven primarily by
– Population growth
– Overall economic growth and stage of economic development
– Composition of GDP (e.g., share of services, manufacturing)
• Price changes have much bigger effects on fuel substitution
than overall energy demand
– Economists summarize this responsiveness through demand elasticities
measuring the % increase in consumption with respect to a % decrease in price
– EIA modeling, e.g., which embodies numerous such relationships has:
• very low elasticity of aggregate energy demand with respect to natural gas
price changes (<0.1)
• low-moderate elasticity of natural gas demand with respect to natural gas
prices in the residential/commercial (<0.3) and industrial sectors (<0.5)
• quite elastic demand for natural gas for electricity generation (1.5 - 2.5)

Greater U.S. shale gas leads to lower gas prices,
more energy use, slightly higher GDP, and slightly
lower GHG emissions in EIA projections
18 Richard Newell, NAS Shale Gas Workshop, May
31, 2013
Scenario
(for 2040)
Natural gas
price $2011 at Henry Hub
Total energy
use Quadrillion Btu
GDP Trillion $2005
Cumulative
emissions
2010-2040* billion tonnes CO2e
Reference 7.83 $/mmBtu
108 $27.3 179
Percent difference relative to Reference case
High oil/gas
resource -45% +3% +1% -0.4%
Low oil/gas
resource +32% -1% -0.1% -0.8%
Data source: U.S. Energy Information Administration, 2013 Annual Energy Outlook.
Notes: *CO2e emissions computed by augmenting EIA CO2 emission estimates for coal, oil, and natural gas by
3.3%,1.5%, and 12.7% respectively to account for non-combustion CO2 and CH4 emissions, based on EPA
Greenhouse Gas Inventory 2013.
Non-combustion GHG emissions from
natural gas
Richard Newell, NAS Shale Gas Workshop, May
31, 2013 19

87% of greenhouse gas emissions from
natural gas occur during the combustion phase
20
Data source: U.S. EPA Greenhouse Gas Inventory 2013.
Richard Newell, NAS Shale Gas Workshop, May
31, 2013
0
200
400
600
800
1,000
1,200
1,400
CH4 CO2 N2OField processing
Processing Transport/storage
Distribution
Combustion
Commercial
Residential
Industrial
Electricity
Combustion Transportation
million tonnes CO2e

0
20
40
60
80
100
120
140
160
180
200
1990 2005 2007 2008 2009 2010 2011
Non-combustion emissions from natural gas are
variable, but have fallen in the past several years
21
Data source: U.S. EPA Greenhouse Gas Inventory 2013.
Richard Newell, NAS Shale Gas Workshop, May
31, 2013
million tonnes CO2e
Field processing
Processing
Transmission/
storage
Distribution
CH4
CH4
CH4
CH4
CO2
CO2

0
2
4
6
8
10
12
0
1
2
3
4
5
6
7
8
9
10
1990 2005 2007 2008 2009 2010 2011
Upstream non-combustion GHG emissions have
fallen per unit of natural gas production
22
Data source: U.S. EPA Greenhouse Gas Inventory 2013 and U.S. Energy Information Administration.
Richard Newell, NAS Shale Gas Workshop, May
31, 2013
tonnes non-combustion CO2e per million cubic feet of gross withdrawals
-11%
grams CO2e per megajoule

0
50
100
150
200
250
1990 1995 2000 2005 2006 2007 2008 2009 2010 2011
EPA estimates of methane emissions from natural
gas systems have changed over time million tonnes CO2e per year
2010 inventory
2011 inventory 2012 inventory
2013 inventory +120%
-33%
Data source: EPA Greenhouse Gas Inventories 2010, 2011, 2012, and 2013.
Richard Newell, NAS Shale Gas Workshop, May
31, 2013 23

Non-combustion GHG emission estimates for shale gas are not
consistently lower or higher than conventional gas
Richard Newell, NAS Shale Gas Workshop, May
31, 2013 24
Image source: Weber and Clavin 2012 with additional annotation based on data from U.S. EPA Greenhouse Gas
Inventory 2013.
Implied upstream
emissions from
2013 EPA inventory
(7g CO2e/MJ)

Electricity sector
Richard Newell, NAS Shale Gas Workshop, May
31, 2013 25

0.0
0.2
0.4
0.6
0.8
1.0
1.2
1.4
1.6
conventional
unconventional
Most estimates have 40%-50% lower lifecycle GHG
emissions for electricity from natural gas than coal
26 Richard Newell, NAS Shale Gas Workshop, May
31, 2013
life-cycle emissions for power generation
ratio of CO2e emission estimates for electricity generation from natural gas relative to coal
Lower per kWh emissions than coal
Higher per kWh emissions than coal
Data source: Listed authors. Notes: 100-year global warming potential (GWP) used unless otherwise indicated. *Howarth does
not account for differences in combustion efficiency of coal versus gas.
Skone et al
(NETL 2011)
Fulton et al
(2011)
Alvarez et al
(2011)
Burnham et al
(2011)
Howarth et al
(2011)*
Howarth et al
(20 Yr. GWP)*
CO2
CO2 CH4
CH4

0
500
1,000
1,500
2,000
Coal Natural gas Nuclear Renewables Petroleum liquids
+470 GWh
2005
2012
+138 GWh
-87 GWh
-12 GWh
-496 GWh
U.S. electric-sector CO2 emissions have declined
16% since 2005 due to fuel switching
27 Richard Newell, NAS Shale Gas Workshop, May
31, 2013
annual net generation, 2005 and 2012
gigawatt hours Total net electricity generation
(all sources, gigawatt hours)
2005 4,055
2012 4,054
Data source: U.S. Energy Information Administration.

Greater shale gas leads to lower prices, fuel switching to gas,
and lower electricity GHG emissions in EIA projections
28 Richard Newell, NAS Shale Gas Workshop, May
31, 2013
Scenario
(for 2040)
Natural
gas prices (delivered
for elec.)
Average
electricity
prices
Electricity
consumption
Natural gas
consumption
for electricity
Coal
consumption
for electricity
Nuclear and
renewables
consumption
Cumulative
electricity
CO2e
emissions*
2010-2040
Reference 8.55
$/mmBtu
10.8 ¢/kWh
5,200 GWh
1,600 GWh
1,800 GWh
1,800 GWh
71 billion
tonnes
Percent and absolute difference relative to Reference case
High oil
and gas -39% -14%
+4.2% (+200 GWh)
+49% (+800 GWh)
-21% (-400 GWh)
-9% (-200 GWh)
-5%
Low oil
and gas +26% +7%
-2.4% (-100 GWh)
-34% (-500 GWh)
+4% (+100 GWh)
+19% (+300 GWh)
+0.2%
Data source: U.S. Energy Information Administration, 2013 Annual Energy Outlook. Notes: *CO2e emissions computed
by augmenting EIA CO2 emission estimates for coal, oil, and natural gas by 3.3%,1.5%, and 12.7% respectively to
account for non-combustion CO2 and CH4 emissions, based on EPA Greenhouse Gas Inventory 2013.

Residential and commercial buildings
sector
Richard Newell, NAS Shale Gas Workshop, May
31, 2013 29

Natural gas space and water heating tends to have
significantly lower GHG emissions than electricity
Richard Newell, NAS Shale Gas Workshop, May
31, 2013 30
• Space heating*
– Natural gas boilers are about 50% less GHG-intensive (CO2 and CH4) than
electric heat from natural gas electricity
– Natural gas-powered heat pumps could further reduce emissions
– Lower-GHG electricity would improve the electric heat footprint
• Water heating**
– Natural gas water heating systems in 46 out of 50 states are less CO2 intensive
than electric heating systems
– In most states, natural gas water heating systems are ~60% less CO2 intensive
than electric heating systems
– Variation occurs between states due to electricity fuel mix
– Lower-GHG electricity would improve the electric water heating footprint
Sources: *Delucchi 2003 and Brenn et al 2010. **Czachorski and Leslie 2009, Gas Technology Institute.

Greater shale gas leads to lower prices, more energy use, and
lower GHG emissions in EIA residential and commercial
projections
31 Richard Newell, NAS Shale Gas Workshop, May
31, 2013
Scenario
(for 2040)
Natural
gas prices (avg. res/
comm price)
Electricity
prices (avg. res/
comm price)
Aggregate
res/comm
energy*
consumption
Natural gas
consumption
for res/comm
Electricity*
consumption
for res/comm
Cumulative
res/comm
CO2e
emissions**
2010-2040
Reference 15.13
$/mmBtu
11.7 ¢/kWh
21.8 QBtu
7.9 QBtu
11.8 QBtu
67 billion
tonnes
Percent and absolute difference relative to Reference case
High oil
and gas -22% -13%
+5% (+1.1 QBtu)
+7% (+0.6 QBtu)
+4% (+0.5 QBtu)
-3%
Low oil
and gas +18% +7%
-3% (-0.6 QBtu)
-4% (-0.3 Qbtu)
-2% (-0.2 QBtu)
-0.2%
Data source: U.S. Energy Information Administration, 2013 Annual Energy Outlook. Notes: *Does not include
electricity-related losses. **CO2e emissions computed by augmenting EIA CO2 emission estimates for coal, oil, and
natural gas by 3.3%,1.5%, and 12.7% respectively to account for non-combustion CO2 and CH4 emissions, based on
EPA Greenhouse Gas Inventory 2013.

Transportation sector
Richard Newell, NAS Shale Gas Workshop, May
31, 2013 32
0.0
0.2
0.4
0.6
0.8
1.0
1.2
TIAX (2007 for CA) Alvarez et al (2012) AEA (for EU 2011) Burnham et al (2012) Venkatesh et al (2011)
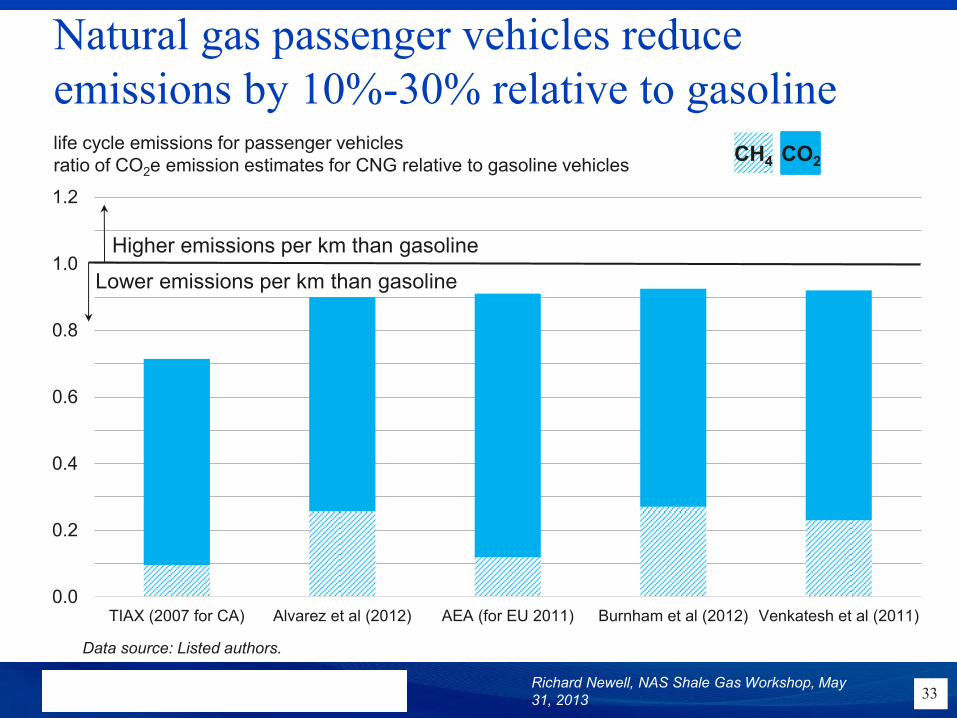
Natural gas passenger vehicles reduce
emissions by 10%-30% relative to gasoline
33
Data source: Listed authors.
Richard Newell, NAS Shale Gas Workshop, May
31, 2013
life cycle emissions for passenger vehicles
ratio of CO2e emission estimates for CNG relative to gasoline vehicles
Lower emissions per km than gasoline
Higher emissions per km than gasoline
CO2 CH4
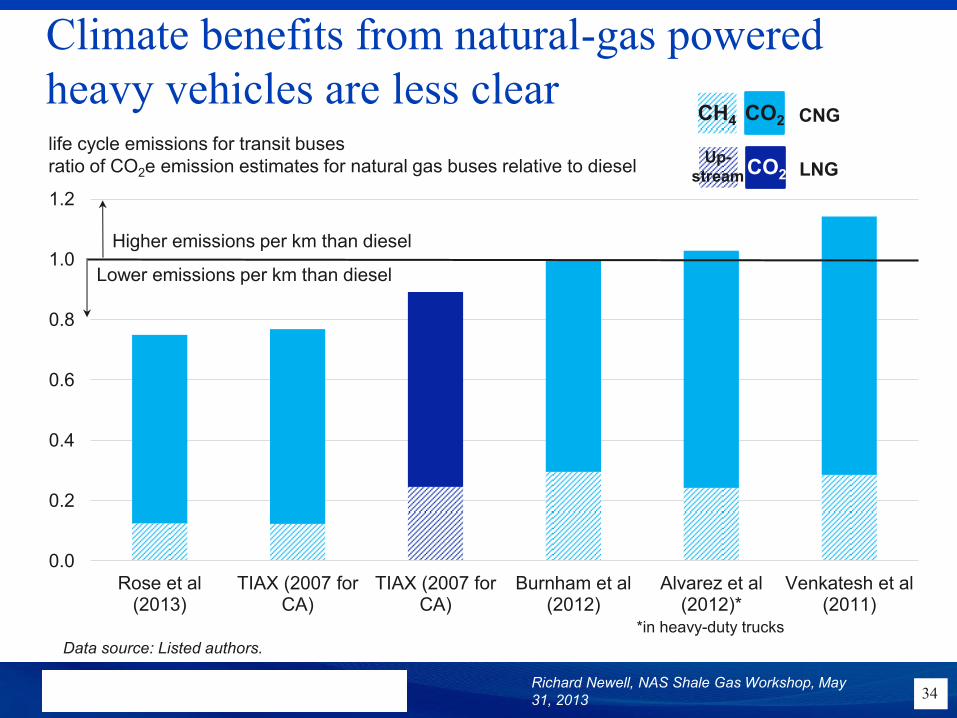
0.0
0.2
0.4
0.6
0.8
1.0
1.2
Rose et al(2013)
TIAX (2007 forCA)
TIAX (2007 forCA)
Burnham et al(2012)
Alvarez et al(2012)*
Venkatesh et al(2011)
Climate benefits from natural-gas powered
heavy vehicles are less clear
34
Data source: Listed authors.
Richard Newell, NAS Shale Gas Workshop, May
31, 2013
life cycle emissions for transit buses
ratio of CO2e emission estimates for natural gas buses relative to diesel
Lower emissions per km than diesel
Higher emissions per km than diesel
*in heavy-duty trucks
LNG
CO2 CH4
CO2
CNG
Up-
stream

Industrial sector
Richard Newell, NAS Shale Gas Workshop, May
31, 2013 35

Greater shale gas leads to more industrial energy use
and slightly higher GHG emissions in EIA projections
36 Richard Newell, NAS Shale Gas Workshop, May
31, 2013
Scenario
(for 2040)
Industrial
natural gas
prices
Aggregate
industrial
energy*
consumption
Natural gas
consumption
by industry
Coal
consumption
by industry
Electricity*
consumption
by industry
Cumulative
industrial
CO2e
emissions**
2010-2040
Reference 9.09
$/mmBtu
28.7 QBtu
10.4 QBtu
1.6 QBtu
3.9 QBtu
52 billion
tonnes
Percent and absolute difference relative to reference scenario
High oil
and gas -39%
+7% (+2.1 QBtu)
+18% (+1.8 QBtu)
-3% (-0.05 QBtu)
+2% (+0.1 QBtu)
+0.3%
Low oil
and gas +28%
-4% (-1.1 QBtu)
-8% (-0.9 QBtu)
-5% (-0.1 QBtu)
-1% (-0.02 QBtu)
-1.4%
Data source: U.S. Energy Information Administration, 2013 Annual Energy Outlook. Notes: *Does not include
electricity-related losses. **CO2e emissions computed by augmenting EIA CO2 emission estimates for coal, oil, and
natural gas by 3.3%,1.5%, and 12.7% respectively to account for non-combustion CO2 and CH4 emissions, based on
EPA Greenhouse Gas Inventory 2013.

International implications
Richard Newell, NAS Shale Gas Workshop, May
31, 2013 37

3,000
3,500
4,000
4,500
5,000
5,500
2010 2015 2020 2025 2030 2035
Projections for global natural gas use are rising
38
Data source: International Energy Agency 2011 and 2012 World Energy Outlook and 2011 “Golden Age of Gas” report.
Richard Newell, NAS Shale Gas Workshop, May
31, 2013
primary global natural gas demand
billion cubic meters
2011 “Golden Age of Gas” scenario
2012 “New Policies” scenario
2011 “New Policies” scenario
3% lower CO2 emissions
than 2011 New Policies
scenario in 2035

-
200
400
600
800
1,000
1,200
2009 2010 2011
U.S. Rest of world
U.S. coal exports have increased, but represent a
fairly small share of global trade
39
Data source: U.S. Energy Information Administration and the World Coal Association. Calculated as U.S. net exports
as a share of global coal trade.
Richard Newell, NAS Shale Gas Workshop, May
31, 2013
4% 5% 7%
global coal trade
million metric tons
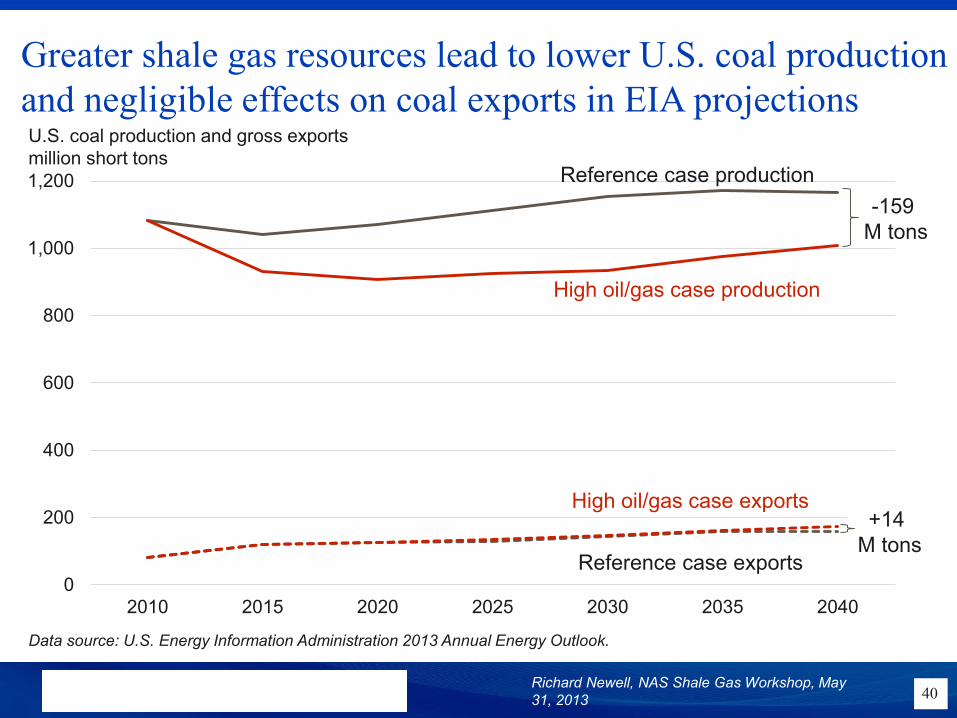
Greater shale gas resources lead to lower U.S. coal production
and negligible effects on coal exports in EIA projections
40
Data source: U.S. Energy Information Administration 2013 Annual Energy Outlook.
Richard Newell, NAS Shale Gas Workshop, May
31, 2013
U.S. coal production and gross exports
million short tons
0
200
400
600
800
1,000
1,200
2010 2015 2020 2025 2030 2035 2040
Reference case production
High oil/gas case production
Reference case exports
High oil/gas case exports
-159
M tons
+14
M tons

0.0
0.2
0.4
0.6
0.8
1.0
1.2
Skone et al (2011 NETL) Venkatesh et al (2011) Jaramillo et al (2007)
NG LNG
LNG tends to have higher GHGs than domestic
natural gas for electricity, but still lower than coal
41
Data source: Listed authors.
Richard Newell, NAS Shale Gas Workshop, May
31, 2013
life cycle emissions for electricity generation
ratio of CO2e emission estimates for electricity from natural gas relative to coal
Lower emissions per kWh than coal
Higher emissions per kWh than coal

Policy interactions and implications
Richard Newell, NAS Shale Gas Workshop, May
31, 2013 42

How does abundant natural gas interact with
and affect climate/energy policy?
Richard Newell, NAS Shale Gas Workshop, May
31, 2013 43
• Lower natural gas prices make the cost of some policies lower
and other policies higher
– lowering the cost of options with relatively low GHG intensity will tend to make
achievement of climate goals less costly
• e.g., in current baseline scenarios no new US coal power is built in part due
to low natural gas prices; as a result, regulations that would regulate new
coal plant GHG emissions have no apparent impact
• e.g., under an emissions constraint, lower natural prices lower the cost of
meeting emission targets and (by design) do not affect emissions (e.g., EIA
AEO 2013, Jacoby et al. 2011, Brown and Krupnick 2010)
– in the context of renewable energy standards, however, lower gas prices will tend
to increase the incremental cost of maintaining those standards
• With substantial long-term GHG reductions, natural gas would
need to incorporate carbon capture and storage at reasonable
cost to continue as a competitive option

Concluding thoughts
Richard Newell, NAS Shale Gas Workshop, May
31, 2013 44
• The GHG emissions intensity of natural gas has fallen; further
reductions in non-combustion emissions and improved combustion
efficiency could further this trend
– upstream emission estimates have fluctuated, but not sufficiently to alter the main
conclusions
• Thus far, shale gas has lead to decreased GHG emissions by
lowering prices and displacing more coal than renewables/nuclear
• Using current lifecycle GHG estimates, natural gas tends to lower
GHG emissions relative to coal electric power, gasoline personal
vehicles, and electricity for space/water heating
• Natural gas abundance alone will probably not have a substantial
effect on future GHG emissions; policy is the key factor
– but could influence relevant policy in ways that have a substantial effect

Sources
Richard Newell, NAS Shale Gas Workshop, May
31, 2013 45
Advanced Resources International and ICF International. Greenhouse gas life-cycle emissions study: Fuel life-cycle of U.S. natural
gas supplies and international LNG. Prepared for Sempra Energy, Nov. 2008.
AEA, 2012. Climate impact of potential shale gas production in the EU. Report for the European Commission DG CLIMA
AEA/R/ED57412.
Alvarez, R.A., Pacala, S.W., Winebrake, J.J., Chameides, W.L., Hamburg, S.P., 2012. Greater focus needed on methane leakage
from natural gas infrastructure. Proceedings of the National Academy of Sciences 109, 6435-6440.
Brenn, J., Soltic, P., Bach, Ch., 2010. Comparison of natural gas driven heat pumps and electrically driven heat pumps with
conventional systems for building heating purposes. Energy and Buildings 42, 904-908.
Brown, S.P.A., Krupnick, A.J., 2010. Abundant shale gas resources: long-term implications for U.S. natural gas markets. Resources
for the Future Discussion Paper 10-41.
Burnham, A., Han, J., Clark, C.E., Wang, M., Dunn, J.B., Palou-Rivera, I., 2011. Life-Cycle Greenhouse Gas Emissions of Shale
Gas, Natural Gas, Coal, and Petroleum. Environmental Science & Technology 46, 619-627.
Czachorski, M., and Leslie, N., 2009. Source energy and emission factors for building energy consumption. Prepared for American
Gas Association.
Delucchi, M., 2003. A lifecycle emissions model (LEM): lifecycle emissions from transportation fuels, motor vehicles, transportation
modes, electricity use, heating and cooking fuels, and materials. UC Davis Institute of Transportation Studies.
Fulton, M., Mellquist, N., Kitasei, S., Bluestein, J., 2011. Comparing life-cycle greenhouse gas emissions from natural gas and coal.
Deutsche Bank Group, Worldwatch Institute, and ICF International. August, 2011.
Hekkert, M.P., Hendriks, F.H.J.F., Faaij, A.P.C., Neelis, M.L., 2005. Natural gas as an alternative to crude oil in automotive fuel
chains well-to-wheel analysis and transition strategy development. Energy Policy 33, 579-594.
Howarth, R.W., Santoro, R., Ingraffea, A., 2011. Methane and the greenhouse-gas footprint of natural gas from shale formations.
Climatic Change 106, 679-690.
Hultman, N., Rebois, D., Scholten, M., Ramig, C., 2011. The greenhouse impact of unconventional gas for electricity generation.
Environmental Research Letters 6.
International Energy Agency, 2011. Are we entering a golden age of gas? . Organization for Economic Cooperation and
Development.
International Energy Agency, 2012. World Energy Outlook 2012.
Jacoby, H.D., O'Sullivan, F., Paltsev, S., 2011. The influence of shale gas on U.S. energy and environmental policy. MIT Joint
Program on the Science and Policy of Global Change, Report No. 207.

Sources
Richard Newell, NAS Shale Gas Workshop, May
31, 2013 46
Jaramillo, P., Griffin, Michael W., Matthews, Scott H., 2007. Comparative life-cycle air emissions of coal, domestic natural gas, LNG,
and SNG for electricity generation. Environmental Science and Technology 41, 6290-6296.
Lu, X., Salovaara, J., McElroy, M.B., 2012. Implications of the Recent Reductions in Natural Gas Prices for Emissions of CO2 from
the US Power Sector. Environmental Science & Technology 46, 3014-3021.
National Energy Technology Laboratory, 2011. Life cycle greenhouse gas inventory of natural gas extraction, delivery, and electricity
production. DOE/NETL-2011/1522.
Paltsev, S., Jacoby, H.D., Reilly, J.M., Ejaz, Q.J., Morris, J., O’Sullivan, F., Rausch, S., Winchester, N., Kragha, O., 2011. The future
of U.S. natural gas production, use, and trade. Energy Policy 39, 5309-5321.
Rose, L., Hussain, M., Ahmed, S., Malek, K., Costanzo, R., Kjeang, E., 2013. A comparative life cycle assessment of diesel and
compressed natural gas powered refuse collection vehicles in a Canadian city. Energy Policy 52, 453-461.
TIAX LLC, 2007. Full fuel cycle assessment: well-to-wheels energy inputs, emissions, and water impacts. Consultant report for
California Energy Commission.
U.S. Energy Information Administration, 2011. World Shale Gas Resources: An Initial Assessment of 14 Regions Outside the United
States.
U.S. Energy Information Administration, 2012. Annual Energy Review. DOE/EIA-0384(2011).
U.S. Energy Information Administration, 2013. Annual Energy Outlook. DOE/EIA-0383ER(2013.)
U.S. Environmental Protection Agency, 2013. Inventory of U.S. Greenhouse Gas Emissions and Sinks: 1990-2011. Washington, D.C.
EPA 430-R-13-001.
Venkatesh, A., Jaramillo, P., Griffin, W.M., Matthews, H.S., 2012. Implications of changing natural gas prices in the United States
electricity sector for SO2, NOx and life cycle GHG emissions. Environmental Research Letters 7.
Venkatesh, A., Jaramillo, P., Griffin, W.M., Matthews, H.S., 2011. Uncertainty in life cycle greenhouse gas emissions from United
States natural gas end-uses and its effect on policy. Environmental Science and Technology 45, 8182-8189.
Weber, C.L., Clavin, C., 2012. Life Cycle Carbon Footprint of Shale Gas: Review of Evidence and Implications. Environmental
Science & Technology 46, 5688-5695.
World Coal Association, 2013. Coal Statistics. URL http://www.worldcoal.org/resources/coal-statistics/.

For more information
Richard Newell, NAS Shale Gas Workshop, May
31, 2013 47
Duke University Energy Initiative
www.energy.duke.edu
919-613-1305

Extra slides
Richard Newell, NAS Shale Gas Workshop, May
31, 2013 48

EIA’s National Energy Modeling System
(NEMS)
Richard Newell, NAS Shale Gas Workshop, May
31, 2013 49

Energy consumption in the U.S. by source
and sector
Richard Newell, NAS Shale Gas Workshop, May
31, 2013 50
Source: U.S. Energy Information Administration, Annual Energy Review 2011.
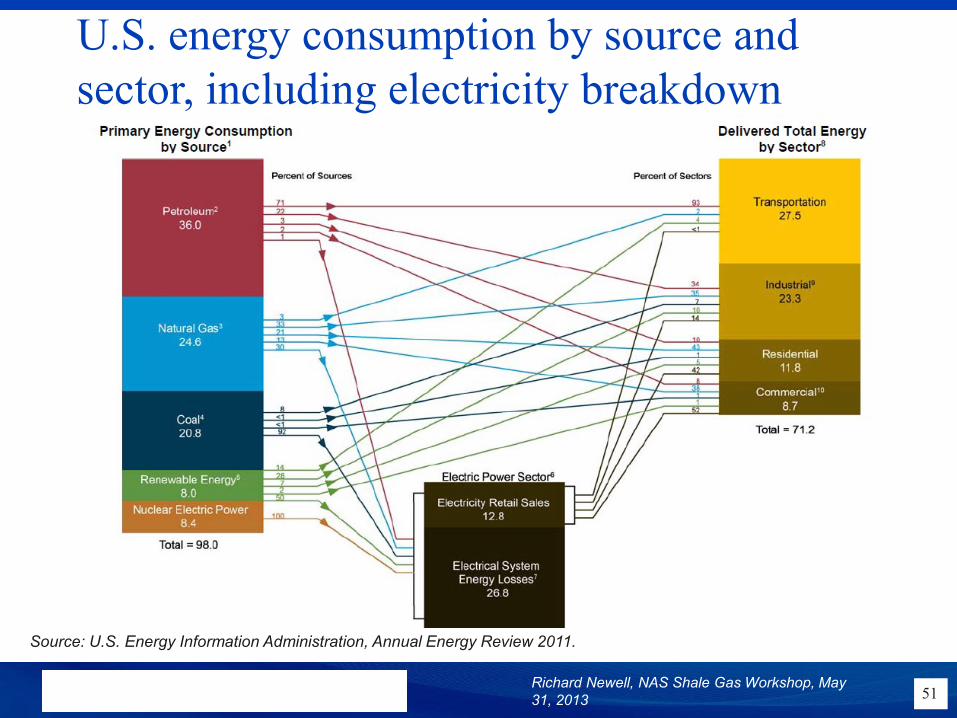
U.S. energy consumption by source and
sector, including electricity breakdown
Richard Newell, NAS Shale Gas Workshop, May
31, 2013 51
Source: U.S. Energy Information Administration, Annual Energy Review 2011.
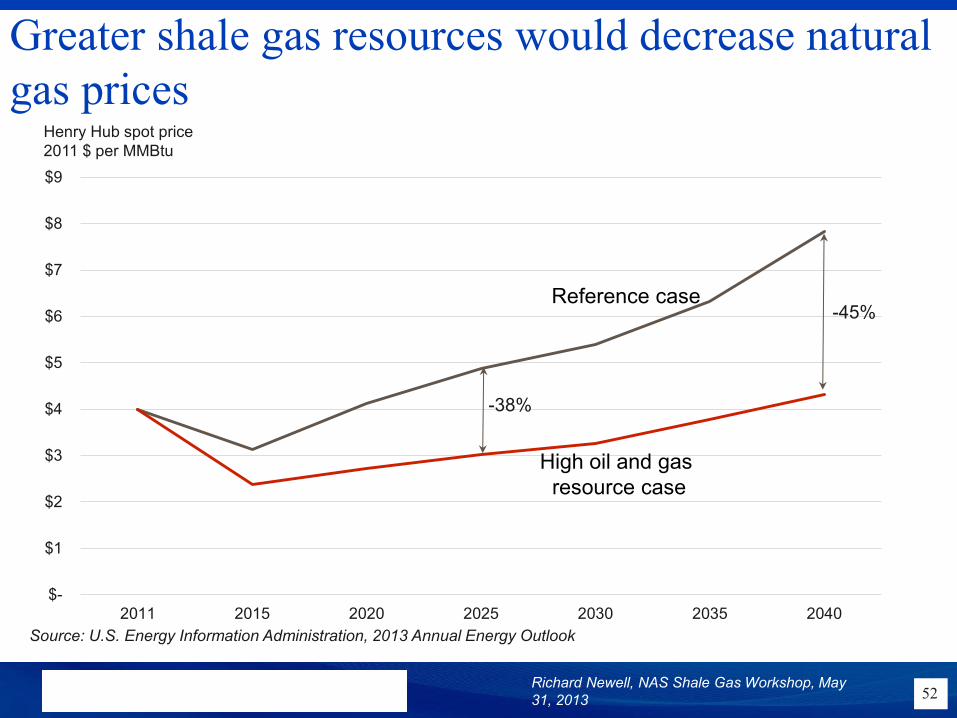
Greater shale gas resources would decrease natural
gas prices
52
Source: U.S. Energy Information Administration, 2013 Annual Energy Outlook
Richard Newell, NAS Shale Gas Workshop, May
31, 2013
$-
$1
$2
$3
$4
$5
$6
$7
$8
$9
2011 2015 2020 2025 2030 2035 2040
High oil and gas
resource case
Reference case
Henry Hub spot price
2011 $ per MMBtu
-38%
-45%

Lower natural gas prices also increase overall
energy use
53 Richard Newell, NAS Shale Gas Workshop, May
31, 2013
90
95
100
105
110
115
2011 2015 2020 2025 2030 2035 2040
+1.6%
-1%
+3%
-1%
Source: U.S. Energy Information Administration, 2013 Annual Energy Outlook
Reference case
High oil and gas
resource
Low oil and gas
resource
Quadrillion Btus

Estimates of lifecycle natural gas emissions vary
54
Source: listed authors. Note: Skone estimates are based on current fleet of gas-fired electricity, not only NGCC.
Richard Newell, NAS Shale Gas Workshop, May
31, 2013
0
200
400
600
800
1000
1200
Alvarez et al (2012) Burnham et al(2012)
Hultmann et al(2011)
Jiang et al (2011) Skone et al (2011)*
Conventional NGCC Unconventional NGCC Supercritical Coal
Life cycle emissions
gCO2e/kWh

Efficiency improvements in natural gas combustion for
electricity have reduced emissions intensity
Richard Newell, NAS Shale Gas Workshop, May
31, 2013 55
natural gas combustion emissions
tonnes of CO2e per MWh
Source: Duke University Energy Initiative based on data from U.S. EPA Greenhouse Gas Inventory 2013 and U.S.
Energy Information Administration.
0.35
0.37
0.39
0.41
0.43
0.45
2007 2008 2009 2010 2011

Energy, electricity, and natural gas
consumption under different scenarios
Richard Newell, NAS Shale Gas Workshop, May
31, 2013 56
0
20
40
60
80
100
120
140
Energy Electricity Natural gas
Reference High OG High growth
energy consumption in 2040
quadrillion Btu
Data source: Duke University Energy Initiative based on projections from the U.S. Energy Information Administration
2013 Annual Energy Outlook.
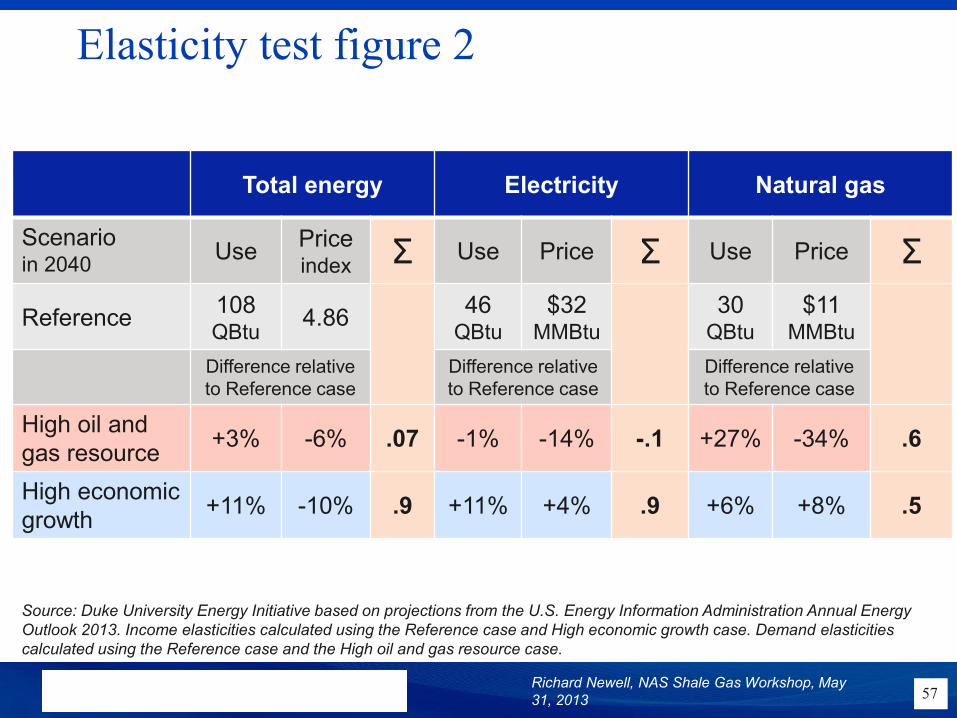
Elasticity test figure 2
Richard Newell, NAS Shale Gas Workshop, May
31, 2013 57
Total energy Electricity Natural gas
Scenario in 2040
Use Price index Σ Use Price Σ Use Price Σ
Reference 108 QBtu
4.86 46
QBtu
$32 MMBtu
30 QBtu
$11 MMBtu
Difference relative
to Reference case
Difference relative
to Reference case
Difference relative
to Reference case
High oil and
gas resource +3% -6% .07 -1% -14% -.1 +27% -34% .6
High economic
growth +11% -10% .9 +11% +4% .9 +6% +8% .5
Source: Duke University Energy Initiative based on projections from the U.S. Energy Information Administration Annual Energy
Outlook 2013. Income elasticities calculated using the Reference case and High economic growth case. Demand elasticities
calculated using the Reference case and the High oil and gas resource case.

Scenario in 2040
Use GDP Σ Use GDP Σ Use GDP Σ
Reference 108 QBtu
$27 trillion
46 QBtu
$27 trillion
30 QBtu
$27 trillion
Difference relative to Reference case
High economic
growth +11% +12% .9 +11% +12% .9 +6% +12% .5
Elasticity test figure 3
Richard Newell, NAS Shale Gas Workshop, May
31, 2013 58
Total energy Electricity Natural gas
Scenario in 2040
Use Price index Σ Use Price Σ Use Price Σ
Reference 108 QBtu
4.86 46
QBtu
$32 MMBtu
30 QBtu
$11 MMBtu
Difference relative to Reference case
High oil and
gas resource +3% -6% .07 -1% -14% -.1 +27% -34% .6
Source: Duke University Energy Initiative based on projections from the U.S. Energy Information Administration Annual Energy
Outlook 2013. Income elasticities calculated using the Reference case and High economic growth case. Demand elasticities
calculated using the Reference case and the High oil and gas resource case.

Energy consumption is influenced by a
variety of factors
Richard Newell, NAS Shale Gas Workshop, May
31, 2013 59
• Income elasticities
– Aggregate energy demand (.7 in 2020, .9 in 2040)
– Electricity demand (.7 in 2020, .9 in 2040)
– Natural gas demand (.5 in 2020, .5 in 2040)
• Demand elasticities
– Aggregate energy demand (.03 in 2020, .07 in 2040)
– Natural gas demand (.44 in 2020, .60 in 2040)
• Electricity (2.4 in 2020, 1.4 in 2040)
• Industrial (.3 in 2020, .5 in 2040)
• Residential/commercial (.1 in 2020, .3 in 2040)
– Electricity demand (-.1 in 2020, -.1 in 2040)
Source: Duke University Energy Initiative based on projections from the U.S. Energy Information Administration Annual Energy
Outlook 2013. Income elasticities calculated using the Reference case and High economic growth case. Demand elasticities
calculated using the Reference case and the High oil and gas resource case.

All else equal, increased natural gas use could
decrease global emissions
60 Richard Newell, NAS Shale Gas Workshop, May
31, 2013
Source: International Energy Agency 2011 World Energy Outlook “New Policies” scenario and 2011 “Golden Age of
Gas” report.
0 5 10 15 20 25 30 35 40
projected global emissions in 2035, gigatonnes
Emissions under 2011 “Golden Age of Gas” Scenario
2011 “Golden Age of Gas” scenario
Emissions under 2011 “New Policies” Scenario
-3%
International status of shale gas development
Richard Newell, NAS Shale Gas Workshop, May
31, 2013 61
• Poland: Some companies have pulled out after unsuccessful tests (ExxonMobil,
Talisman, Marathon). Chevron and ENI are still there. Dozens of test wells drilled. No
production yet.
• UK: Test drilling by Cuadrilla Resources has occurred in Northern and Southern
England. No production yet.
• AU: Chevron has invested in the Central-AU Cooper Basin, no production yet.
• S. Africa: A moratorium on shale gas development was lifted in 2012, but no permits
for exploration have been issued. Shell and Chevron are interested.
• China: Shell has invested $1B. Dozens of test wells have been drilled in the Sichuan
basin. No production yet—geological and infrastructure challenges.
• Argentina: Chevron and EOG are in the Vaca Muerta shale, claiming good geology.
Test wells have been drilled, no production yet. This is an oil and gas play.
• Algeria: The government is pushing to develop shale gas, has partnered with ENI.
No production yet.
• Saudi Arabia will also drill some test wells into shale formations this year. Al-Naimi
(KSA oil minister) estimated over 600Tcf of unconventional gas reserves.
• EU: France, Bulgaria, and Romania have moratoria.
• Germany/Spain: Some companies have expressed interest in exploring, but nothing
has gone forward. Considerable local opposition.

Terminology for upstream emissions: EPA
and Weber/Clavin
Richard Newell, NAS Shale Gas Workshop, May
31, 2013 62
Activity EPA calls it: Weber and Clavin call it:
Well pad construction Field production Preproduction
Well drilling Field production Preproduction
Fracking materials Field production Preproduction
Well completion Field production Preproduction
Flaring Field production Production/processing
Fugitive CH4 and CO2 at well Field production Production/processing
Workovers Field production Production/processing
Liquids unloading Field production Production/processing
Lease/plant energy Processing Production/processing
Vented CO2 at plant Processing Production/processing
Fugitive CH4 and CO2 at plant Processing Production/processing
Compression fuel Transmission/storage Transmission
Underground storage Transmission/storage n/a
Fugitive transmission Transmission/storage Transmission
Fugitive distribution Distribution Transmission??