implications of prolonged low oil prices - pwc · outlook for southeast asia 3. implications for...
TRANSCRIPT

www.pwc.com/my
Getting the house in order Implications of prolonged low oil prices

PwC Malaysia | Getting the house in order
Table of contents
1. The “New Normal”
2. Outlook for Southeast Asia
3. Implications for Malaysia
4. Case Study: A National Oil Company’s response
1 PwC Malaysia | Getting the house in order

PwC Malaysia | Getting the house in order
Introduction
2
Notwithstanding its cyclical nature, since 2014 the oil and gas industry has had to contend with a prolonged period of low oil prices. This has forced an industry-wide rethink of how – and when – oil and gas resources will be developed. In 2016, the National Oil Company's upstream profit after tax declined by 90% relative to 2014, and activity in this segment may remain muted as International Oil Companies (IOCs) and resources owners apply more rigour before making investment decisions.
While PwC’s 2017 CEO survey revealed that oil and gas CEOs short-term confidence about their company’s growth has risen compared to last year, they remain less confident than CEOs in other sectors about their company growth.
As a country with over 3.6 million barrels of oil equivalents (mmboe) of reserves, producing 744,000 barrels of oil equivalent per day (boe/day) and a major exporter of liquefied natural gas (LNG) with over 30 metric tons per annum (MTPA) of sales registered, Malaysia remains a key oil and gas producer.
To this end, its oil and gas industry which has thrived under the stewardship of Malaysia’s National Oil Company, PETRONAS must now reposition itself to survive in the “new normal” of lower prices. This will likely involve a complete rethinking on how upstream developments are carried out, combined with a possible rationalisation of the services sector.
In reviewing the possible avenues towards ensuring the industry’s sustainability, this paper also highlights a case study from Norway, where another National Oil Company (NOC) applied a different approach to lowering upstream breakeven costs and allowed market forces to shape a leaner services sector.
These were seen as a necessary correction as the global oil and gas sector braces itself for a “lower forever” price outlook, and presents a number of lessons that can be emulated elsewhere.

PwC Malaysia | Getting the house in order
The “New Normal”
3 3 PwC Malaysia | Getting the house in order
1

PwC Malaysia | Getting the house in order
4
0
10
20
30
40
50
60
70
80
90
100
110
120
1970 1975 1980 1985 1990 1995 2000 2005 2010 2015
USD/bbl
1997/98 Asian financial crisis
1980 Iran – Iraq War begins; exports from the region
slows further
1979 Iran cuts production and exports during revolution; cancels contracts with US
companies
1990 Iraq invades Kuwait;
Kuwaiti exports cut until 1994
Mid 2005 Asia drives rising
demand as production stagnates and Saudi
spare capacity declines
2011 Arab Spring; civil
war disrupts Libyan output
2014-2015 Shale boom leads strong non-OPEC production; OPEC
acts to defend market share
Source: Business Insider, Goldman Sachs
Yearly average crude oil price 1970 – 2015
The oil and gas industry is cyclical, with large oil price fluctuations evident over the past 40 years
2007/2008 Global financial crisis
PwC Malaysia | Getting the house in order
20
30
40
50
60
70
80
90
100
110
120
130
140
150
2006 2007 2008 2009 2010 2011 2012 2013 2014 2015 2016 2017 2018
5
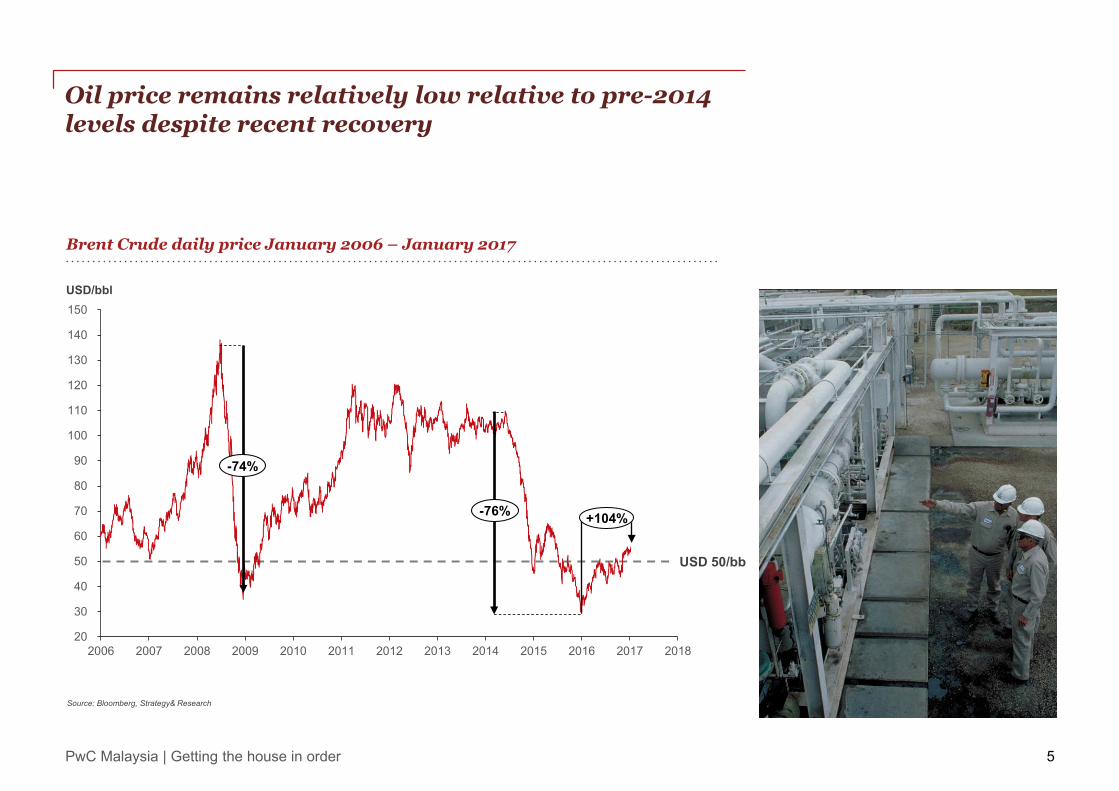
Brent Crude daily price January 2006 – January 2017
USD/bbl
Source: Bloomberg, Strategy& Research
+104% -76%
-74%
USD 50/bb
Oil price remains relatively low relative to pre-2014 levels despite recent recovery

PwC Malaysia | Getting the house in order
“Will the Global economic growth improve, stay the same or decline over the next 12 months(2017)?”
The oil and gas CEOs said:
Source: PwC 20th CEO Survey
34% 16% 49%
Limited recovery in overall hiring and spending going forward
6
Energy companies, particularly in North America, will be well-positioned to increase production activity in response to higher prices
Number of global rigs, June 2014–Dec 2016
2015 2016 2017
7.3%
0
100
200
300
400
500
Global oil and gas CAPEX
2014 2015 2016
U.S. Canada Asia Pacific Middle East Africa Europe Latin America
0
1,000
500
1,500
2,000
3,000
2,500
3,500
4,000
USD billions
Source: Rystad Energy; Strategy&
Improve Maintain Decline
Since 2014, investments have been declining. This is set to continue throughout 2017 but the industry is expecting a mild recovery.
Capital expenditure (CAPEX) spending is expected to increase beyond 2018. However, it will be modest, with a 4% increase in 2018, down from 8% in 20171. Projects will be subjected to more vigorous scrutiny going forward to ensure returns.
1 According to preliminary results of Barclays’ major global spending survey of more than 200 companies.
Source: Rystad Energy; Strategy&

PwC Malaysia | Getting the house in order
Limited recovery in overall hiring and spending going forward
7
As evident in the United States (US) and the United Kingdom (UK), the recent oil price plunge negatively impacted upstream investment.
Given the current oil price range, projects will tend to primarily focus on existing regions, mature fields and lower cost plays.
These projects will likely place emphasis on criteria such as short lead time, lower risk and quicker value realisation instead of purely pursuing resource additions.
This is set against a backdrop which sees future projects becoming more challenging and increasingly complex.
Source: Rystad Energy; Strategy&
0
100,000
200,000
300,000
400,000
500,000
600,000
2013 2014 2015 2016 Direct employment Indirect employment Induced employment
0
100,000
200,000
300,000
400,000
–27% 500,000
2013 2014 2015 2016
Number of U.S. employees in upstream oil and gas
Number of U.K. offshore employees in upstream oil and gas
–24%
Source: Rystad Energy; Strategy&

PwC Malaysia | Getting the house in order
Outlook for Southeast Asia
8 8
2 PwC Malaysia | Getting the house in order

PwC Malaysia | Getting the house in order
Southeast Asia remains heavily reliant on hydrocarbon
9
Gas has emerged as a prominent fuel source and is expected to remain as one of the top three fuel sources in the region.
Source: IEA South East Asia Outlook 2015
* Includes solar PV, wind and geothermal
Bioenergy
Other renewables*
Hydro Nuclear
50
100
150
2020 2030 2040
Mto
e
200
250
300
350
Gas
Coal Oil
2010 2000 1990
Primary energy demand by fuel in Southeast Asia (SEA), 1990-2040
1Source: BP Energy Outlook
With the increase of population and urbanisation in SEA, energy consumption is set to increase by 62% by 2035.1
Fossil fuel is still expected to dominate the fuel mix for the next few decades with an increase in prominence of gas consumption. Escalation in coal use is also expected due to the ability to access huge resources at low production costs.
However, as countries and consumers shift to address emissions and climate change, renewable sources will also gain significance.
SEA economy grew 5.3% p.a. (2007 – 2015). And the region’s economy is the 6th largest in the world, and the 3rd largest in Asia.
GDP
Population
SEA has the 3rd largest population in the world (2015). More than half are under the age of 30, and 47.7% living in urban areas.
PwC Malaysia | Getting the house in order
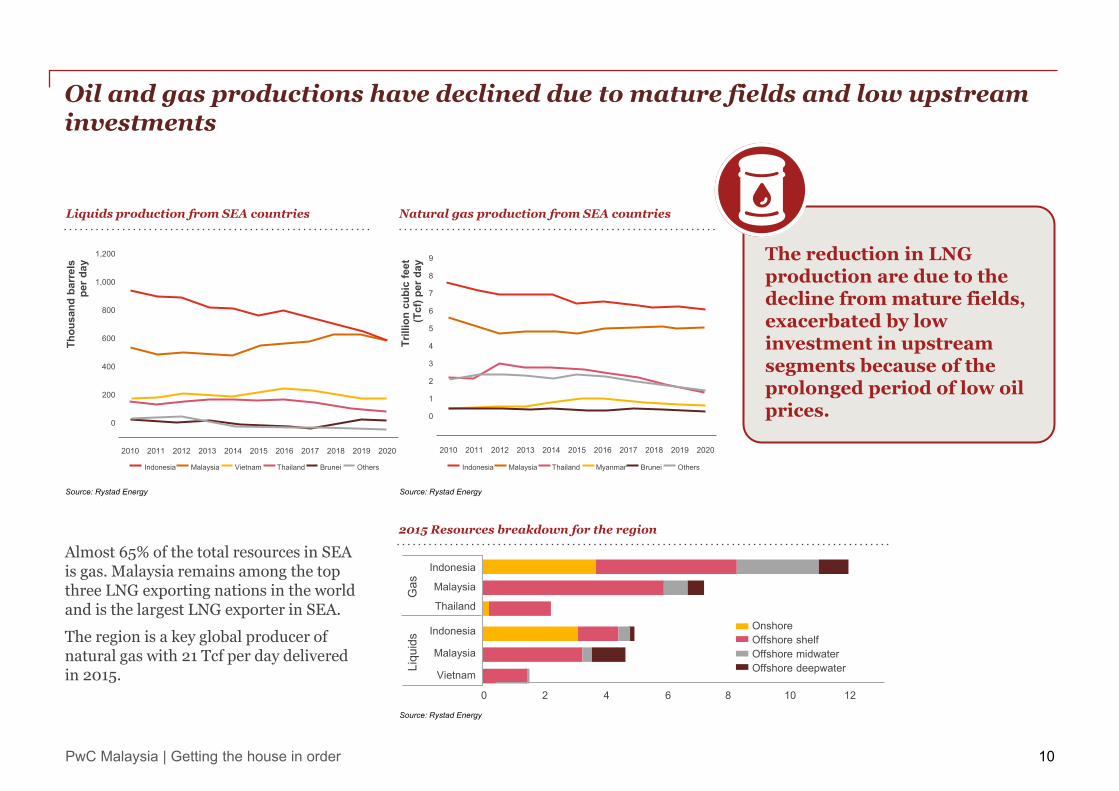
The reduction in LNG production are due to the decline from mature fields, exacerbated by low investment in upstream segments because of the prolonged period of low oil prices.
Oil and gas productions have declined due to mature fields and low upstream investments
10
Liquids production from SEA countries Natural gas production from SEA countries
Indonesia Malaysia Vietnam Thailand Brunei Others
1,200
1,000
800
600
400
200
0
2010 2011 2012 2013 2014 2015 2016 2017 2018 2019 2020
Indonesia Malaysia Thailand Brunei Others Myanmar
9
8
7
6
5
4
3
2
1
0
2010 2011 2012 2013 2014 2015 2016 2017 2018 2019 2020
Source: Rystad Energy Source: Rystad Energy
Indonesia
Malaysia
Thailand
Indonesia
Malaysia
Vietnam
Onshore Offshore shelf Offshore midwater Offshore deepwater
Gas
Li
quid
s
6 8 10 4 2 0 12
Almost 65% of the total resources in SEA is gas. Malaysia remains among the top three LNG exporting nations in the world and is the largest LNG exporter in SEA.
The region is a key global producer of natural gas with 21 Tcf per day delivered in 2015.
2015 Resources breakdown for the region
Source: Rystad Energy
Thou
sand
bar
rels
pe
r day
Trill
ion
cubi
c fe
et
(Tcf
) per
day

PwC Malaysia | Getting the house in order
The region faces high breakeven oil price1, which will adversely affect upstream investments
11
Given the relatively higher average breakeven price average of SEA oil fields, the upstream investment segment is expected to be adversely affected.
As such SEA upstream will be less attractive for international Exploration and Production (E&P) companies, since a significant number of projects will likely be deemed uneconomic to pursue.
New entrants will likely comprise smaller players in the region but they would not have the same capacity as larger IOCs in initiating and undertaking major projects.
Concerted action by both resource owners and the oil service providers needs to be taken to reduce the breakeven price to remain competitive.
Action required: A concerted effort involving both NOCs and service providers must be undertaken to reduce breakeven prices.
Source: Rystad Energy
South East Asia
America N
America S
Russia
Africa
Rest of Asia
Australia
Europe
Middle East
30 40 50 20 10 0 60 70
2015 Average Brent breakeven price for non-sanction project by region. (USD/bbl)
! 1 For non-sanctioned projects in the world

PwC Malaysia | Getting the house in order
Implications for Malaysia
12 12
3 PwC Malaysia | Getting the house in order

PwC Malaysia | Getting the house in order
Local oil and gas service players continue to face challenges
13
“A prominent marine support company foresees it will continue registering losses this year following a net loss of RM142.87 million incurred last year.”
The Sun Daily, May 2017 “The impairment of this drilling company resulted it taking a big hit in its 4th quarter ended Dec 31, 2016 results, recording RM1.57bil in net losses, believed to be among the biggest losses in its history.”
The Star, Feb 2017
“Banks and oil and gas companies made record provisions for bad debts in 2016 had been increasing their provisions for bad debts since 2014 in light of the weak commodity price.”
The Star, March 2017
“Five out of eight of this company’s drilling rigs still idle without any contract secured. The utilisation rate is expected to fall from 2015’s 52% to 41% in 2016.”
Alliance DBS, May 2016
“Local oil and gas service provider and operator reported 1QFY18 core net loss of RM15.6mn. The shortfall was mainly due to lower than expected contribution from the drilling division.”
TA Securities, Jun 2017
“The overall OSV business outlook still appears rather tepid and operations of hook-up commissioning (HUC) and topside maintenance services (TMS) are expected to be slow this year.”
Alliance DBS, Aug 2016
“The RM1bil impairment by a local FPSO player indicates that we are addressing the burden of the severe under-utilisation of several assets, particularly in the OSV segment.”
The Star, March 2017

PwC Malaysia | Getting the house in order
Whilst PETRONAS works to reduce cost for the local upstream sector
14
Three major cost areas of focus are: The objectives are:
Target annual cost-savings of
RM4.0 to RM7.0 billion from the year 20191
PETRONAS continues to focus on its group-wide efforts to optimise costs, further improve efficiency and operational excellence through an initiative called CORAL 2.0, which covers the following:
Expected result:
Lower industry cost base.
Achieve world-class efficiency and lean operations through benchmarking and asset sharing.
Infuse global innovations through industry collaboration.
Ensure competitiveness through an engaged ecosystem.
Drilling and completion
Engineering and construction
Operations and maintenance
Source: PETRONAS Presentation at Oil & Gas UK Conference 2016 and PETRONAS website
PwC Malaysia | Getting the house in order
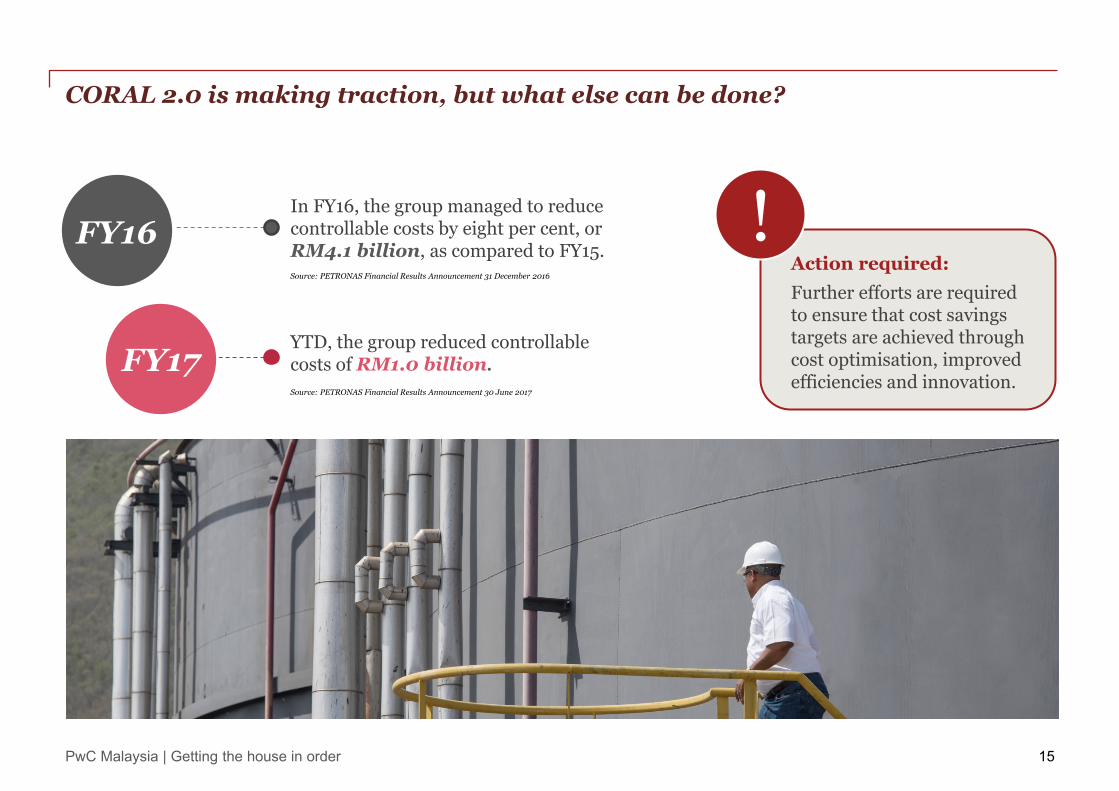
CORAL 2.0 is making traction, but what else can be done?
15
Source: PETRONAS Financial Results Announcement 31 December 2016
In FY16, the group managed to reduce controllable costs by eight per cent, or RM4.1 billion, as compared to FY15.
YTD, the group reduced controllable costs of RM1.0 billion. FY17
FY16
Source: PETRONAS Financial Results Announcement 30 June 2017
Action required: Further efforts are required to ensure that cost savings targets are achieved through cost optimisation, improved efficiencies and innovation.
!

PwC Malaysia | Getting the house in order
16
Sen
ior
Len
der
s fo
cus
area
s
No leakage to un-prioritised: • Subordinated
loans • Dividends • Investments • Non-core
business
No payments to bondholders: • Payments-in-
kind • Write-down • Runway after
bank runway
Suspend newbuilding program: • Cancellation
(preferred) • Transfer of
contract • Postponement
Owner contribution: • Fresh capital
needed from owners
• 1:2 Norwegian Krone regarding deferment of repayments
Conversion of debt to equity: • Increased
understanding of need for write downs
• Demands more favourable terms than bondholders if equitised
Harmonisation of terms: • Establish master
agreement that includes all lenders and regulates all conditions
Define strategic assets: • Market
non-core assets for sale
• Develop segment competencies
Amended credit arrangements: • Runway
2020/(23) • Maintain interest • Limited
amortisation • Cash sweep of
surplus cash • New covenants
- Min. cash - LTV > 1
1 2 3
5 6 7
4
8
Banks and market participants must all work together to find viable solutions
Similar to Malaysia, excess capacity and reduced utilisation in the Norwegian O&G service sector compelled banks to respond aggressively to protect their interests.
Source: PwC analysis

PwC Malaysia | Getting the house in order
Bondholders need to be realistic going into restructuring negotiations
17
Return
1
Difference between expectations and solutions
Wanted interest Must accept payments-in- kind
Wanted down payment as compensation
Accepted write-downs of principal
Wanted redemption as settlement
Accepted share conversion at less favourable rate
Wanted redemption instead of increased maturity
Accepted a longer payment runway than the banks
Instalment
2
Settlement
4
Maturity
3
Bondholders’ ask Observed solutions
Norway O&G debt restructuring experience: “Despite refinancing negotiations between the largest stakeholders and efforts to conduct out-of-court restructuring, overcapacity in the market and serious liquidity problems will probably result in several large bankruptcy proceedings in Norway in 2016 and 2017.”
“The question may in many cases no longer be what the parties are obligated to under a written contract, but how the contract can be amended in order to ensure the survival of the parties.”
Source: The Strategic View
Stine D. Snertingdalen, Partner, KVale
Source: PwC analysis
PwC Malaysia | Getting the house in order
18
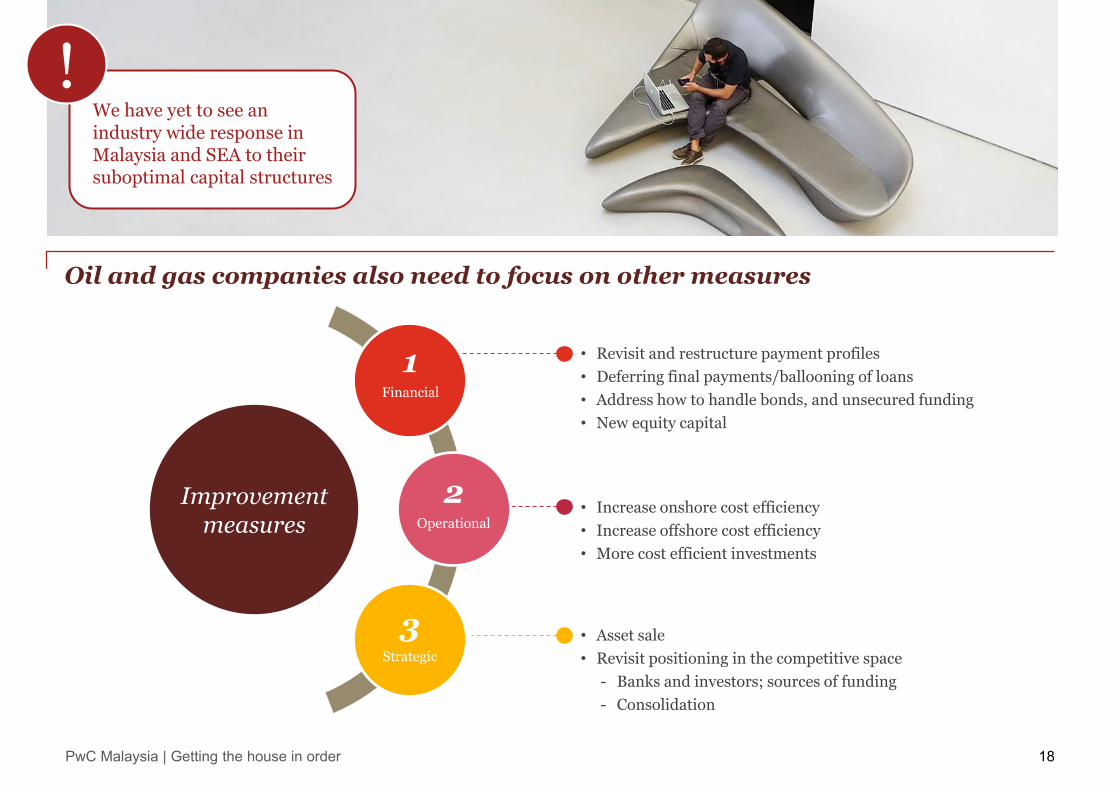
Oil and gas companies also need to focus on other measures
Improvement measures
• Revisit and restructure payment profiles • Deferring final payments/ballooning of loans • Address how to handle bonds, and unsecured funding • New equity capital
• Increase onshore cost efficiency • Increase offshore cost efficiency • More cost efficient investments
• Asset sale • Revisit positioning in the competitive space
- Banks and investors; sources of funding - Consolidation
2 Operational
1 Financial
3 Strategic
We have yet to see an industry wide response in Malaysia and SEA to their suboptimal capital structures
!

PwC Malaysia | Getting the house in order
Case study: A National Oil Company’s response
19 19
4 PwC Malaysia | Getting the house in order

PwC Malaysia | Getting the house in order
32
20
Statoil1 successfully reduced breakeven price from USD70/bbl to USD27/bbl in three years
Breakeven price for major projects 20-30% reduction in oil price => 12% increase in NPV
USD
-17/
bbl
Current CMU 2016 2013
80
60
40
20
0
Development breakeven major project decisions 2015- 2017
2013
70 USD/bbl
CMU 2016
41 USD/bbl
Current
27 USD/bbl
Average break-even price project portfolio
Average break-even price next generation portfolio
43% +12% +12%
Source: Statoil
Development CAPEX Recoverable resources NPV
Development CAPEX, recoverable resources and NPV
Source: Statoil
1 Statoil is Norway’s National Oil Company

PwC Malaysia | Getting the house in order
In 2016 Statoil revealed yearly OPEX efficiencies of USD 3.2billion
21
Significant cost reductions have been undertaken
Breakeven oil price continues to fall for unsanctioned projects in 2017
Continuous improvement USD billion
New measures from continuous improvement3
Forward impact from improvement programme3
1.3 2.5
3.2 1.0
Original 2016 ambition
2016 ambition
2016 delivery
2017 ambition
2018
More for less1
100
90
80
70
60
50
40
30
20
10
0 -
Recoverable resources (mmboe)
Bre
ak-e
ven
oil p
rice
(USD
/bbl
)
February 2016
February 2017
1000 2000 3000 4000 5000 6000
1 Total non-sanctioned portfolio (operated and non-operated)
Source: Statoil Source: Statoil
PwC Malaysia | Getting the house in order
How did Statoil do it?
22
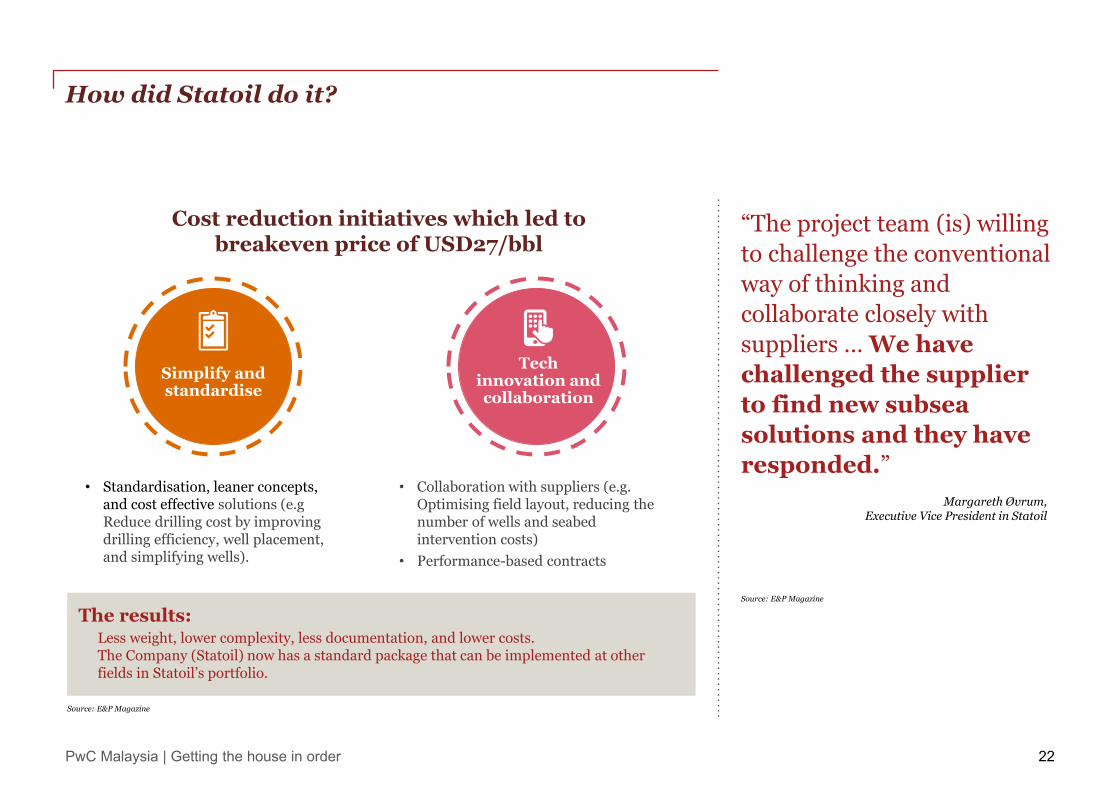
The results: Less weight, lower complexity, less documentation, and lower costs. The Company (Statoil) now has a standard package that can be implemented at other fields in Statoil’s portfolio.
Cost reduction initiatives which led to breakeven price of USD27/bbl
• Standardisation, leaner concepts, and cost effective solutions (e.g Reduce drilling cost by improving drilling efficiency, well placement, and simplifying wells).
• Collaboration with suppliers (e.g. Optimising field layout, reducing the number of wells and seabed intervention costs)
• Performance-based contracts
“The project team (is) willing to challenge the conventional way of thinking and collaborate closely with suppliers … We have challenged the supplier to find new subsea solutions and they have responded.”
Margareth Øvrum, Executive Vice President in Statoil
Source: E&P Magazine
Simplify and standardise
Tech innovation and collaboration
Source: E&P Magazine

PwC Malaysia | Getting the house in order
Conclusion
23 23
5 PwC Malaysia | Getting the house in order

PwC Malaysia | Getting the house in order
Reshape the business and rethink operational, financial and strategic imperatives to reflect a different operating environment.
This means quickly adopting new thinking, exploring risk sharing models and pursuing greater industry collaboration.
Achieve differentiated and sustainable performance going forward, companies need to look outside their traditional business areas and innovate.
The protracted low oil price environment provides a window of opportunity to get the “house in order”
24
Recent mergers and acquisition (M&A) activity in the OFS sector such as GE’s recent acquisition of Baker Hughes is an effort to create a business focused on more efficient well operations through automation, enhanced imaging, and data analysis. And the just-completed combination of Technip and FMC Technologies has fashioned a company whose core capabilities will be subsea engineering and equipment.
2017 Oil and Gas Trends by Strategy&
BP’s recent alliance with Kosmos to seek assets in Mauritania and Senegal is a good example of a major IOC leveraging the technical exploration skills of a smaller rival.
Schlumberger and Halliburton, already offer integrated field management solutions that oversee and operate assets on behalf of companies such as Petrofac in managing day-to-day operations.
2017 Oil and Gas Trends by Strategy&
M&A can be a fulcrum for transforming a company like Shell’s $70 billion deal to buy Britain’s BG Group in 2016, a move that greatly expanded Shell’s position in the natural gas market. Or M&A can be used to bolt on less ambitious but equally promising new capabilities, which was the purpose of several deals over the past few years by Total and Statoil that give these companies a foothold in renewable energy.
2017 Oil and Gas Trends by Strategy&
1
2
3

PwC Malaysia | Getting the house in order
Contacts
25
Tengku Muhammad Taufik Oil and Gas Leader
PwC Malaysia
Tel: +60 (3) 2173 0324
Email: [email protected]
Acknowledgements:
We would like to thank Ole Martinsen and Torbjørn Larsen, Partners and Oil and Gas experts from PwC Norway for their contributions. We would also like to thank Aizuddin Amran, Ong Khar Keong, Jane Gan, Scott Goh, and Karthikeyan Arunachalam, for their involvement in the development of the report.
PIX
Lee Chui Sum Deals Senior Executive Director
PwC Malaysia
Tel: +60 (3) 2173 1388
Email: [email protected]
Albert Lee Deals Senior Executive Director
PwC Malaysia
Tel: +60 (3) 2173 1082
Email: [email protected]
Lavindran Sandragasu Tax Senior Executive Director
PwC Malaysia
Tel: +60 (3) 2173 1494
Email: [email protected]

twitter.com/PwC_Malaysia
facebook.com/pwcmsia
youtube.com/pwcmalaysia
www.pwc.com/my
linked.com/company/pwc-malaysia instagram.com/pwc_malaysia
©2017 PwC. All rights reserved. “PricewaterhouseCoopers” and/or “PwC” refers to the individual members of the PricewaterhouseCoopers organisation in Malaysia, each of which is a separate and independent legal entity. Please see www.pwc.com/structure for further details. CS09665
PwC helps organisations and individuals create the value they’re looking for. We’re a network of firms in 157 countries with more than 223,000 people who are committed to delivering quality in assurance, tax and advisory services. Tell us what matters to you and find out more by visiting us at www.pwc.com.
http://www.pwc.com/my/en/industry/energy-utilities.html