implications of child undernutrition for africa's … · cost of hunger in africa implications...
TRANSCRIPT
Cost of Hunger in
Africa
Implications of Child
Undernutrition for
Africa's Social
and Economic
Transformation
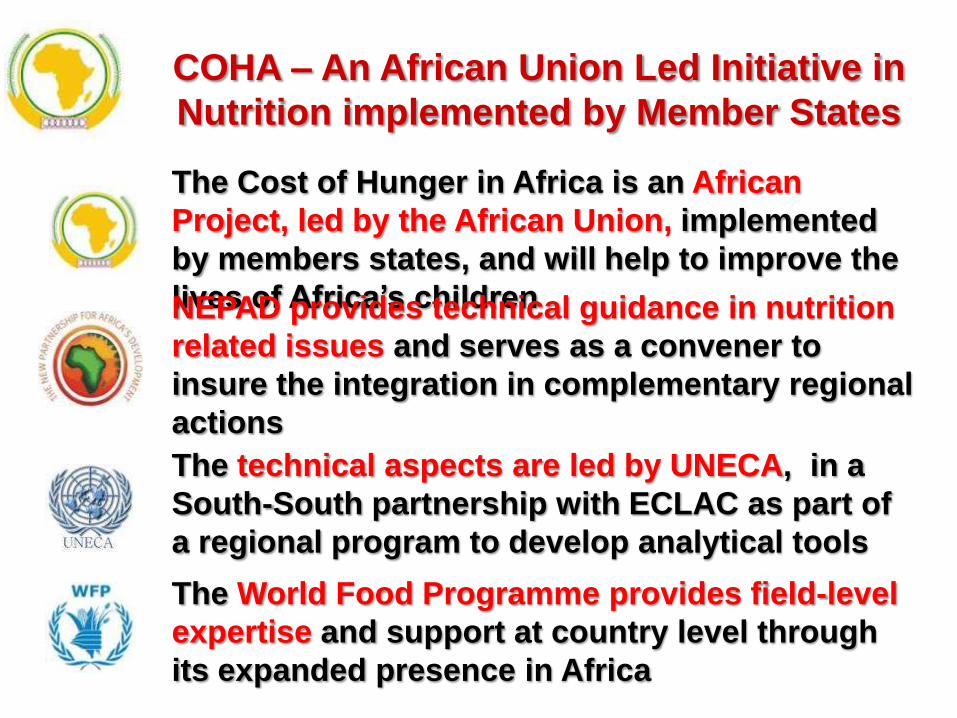
COHA – An African Union Led Initiative in
Nutrition implemented by Member States
The Cost of Hunger in Africa is an African
Project, led by the African Union, implemented
by members states, and will help to improve the
lives of Africa’s children
The technical aspects are led by UNECA, in a
South-South partnership with ECLAC as part of
a regional program to develop analytical tools
The World Food Programme provides field-level
expertise and support at country level through
its expanded presence in Africa
NEPAD provides technical guidance in nutrition
related issues and serves as a convener to
insure the integration in complementary regional
actions

Progress
Report on
initial
Results at
AU/ECA 6th
Conferenc
e of
MOFAD
201
2
AU/ECA 5th
Conferenc
e of
MOFAD,
Declaration
898
Adapting Methodology to
the African Context
w/support of 4 Pilot
countries
A Brief RECAP of the COHA
201
3
Endorsem
ent of
Methodolo
gy by 4th
ATFFND,
Malawi
Validation of
Results at for
Egypt, Ethiopia,
Swaziland and
Uganda
Presented
at AU
Summit
Feasibility
Analysis Roll out to 8
Countries
BOTSW
ANA
ALGERIA
LIBYA
SUDAN
SOUTH
l
SUDAN
KENY
A
TANZANI
A
South Africa
ZIMBA
BWE
ANGOLA
ZAMBIA
NAMIBIA
DEMOCRATIC
REPUBLIC
OF
THE
CONGO
CENTRAL
AFRICAN
REPUBLIC
GAB
ON
CAME
ROON
CHAD
NIGER
NIGERIA
BEN
IN
GH
ANA
BE
NIN
LIBE
RIA
TOG
O
SIER
RA
LEO
NE
GUI
NEA-
BISS
AU
GAM
BIA
MALI
BURK
INA
FASO
SENE
GAL
LESOTHO
SAO
TOME &
PRINCIP
E
RWA
NDA BURU
NDI
SWAZILAN
D
COM
OROS
MAURITI
US
EQUAT
ORIAL
GUINEA
WESTE
RN
SAHAR
A
GUIN
EA
EGYPT
MAURITAN
IA
ETHIOPIA
UGAN
DA
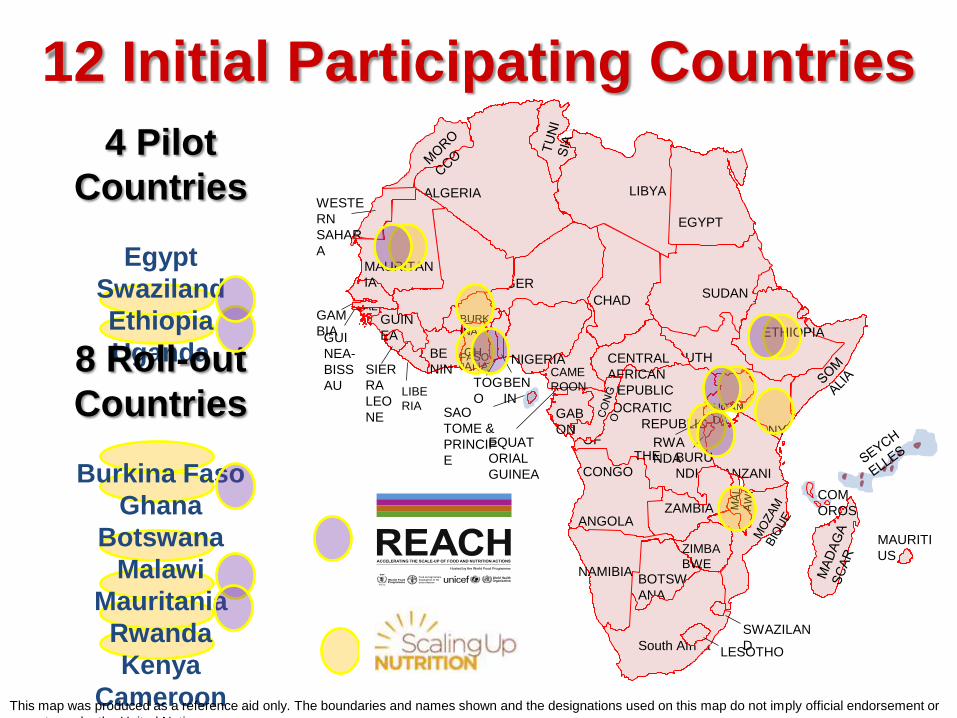
4 Pilot
Countries
Egypt
Swaziland
Ethiopia
Uganda 8 Roll-out
Countries
Burkina Faso
Ghana
Botswana
Malawi
Mauritania
Rwanda
Kenya
Cameroon
12 Initial Participating Countries
This map was produced as a reference aid only. The boundaries and names shown and the designations used on this map do not imply official endorsement or
acceptance by the United Nations
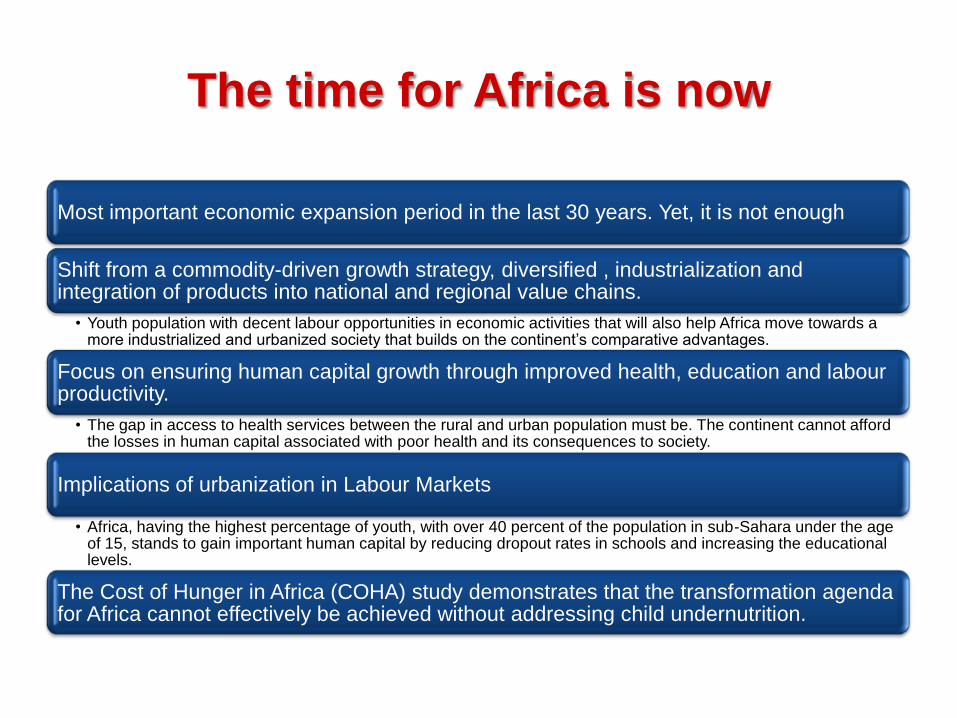
The time for Africa is now
Most important economic expansion period in the last 30 years. Yet, it is not enough
Shift from a commodity-driven growth strategy, diversified , industrialization and integration of products into national and regional value chains.
• Youth population with decent labour opportunities in economic activities that will also help Africa move towards a more industrialized and urbanized society that builds on the continent’s comparative advantages.
Focus on ensuring human capital growth through improved health, education and labour productivity.
• The gap in access to health services between the rural and urban population must be. The continent cannot afford the losses in human capital associated with poor health and its consequences to society.
Implications of urbanization in Labour Markets
• Africa, having the highest percentage of youth, with over 40 percent of the population in sub-Sahara under the age of 15, stands to gain important human capital by reducing dropout rates in schools and increasing the educational levels.
The Cost of Hunger in Africa (COHA) study demonstrates that the transformation agenda for Africa cannot effectively be achieved without addressing child undernutrition.

Framework for the Cost of Hunger in Africa
Undernutrition
Higher
mortality risk
Higher morbidity
risks: Acute and
Chronic illnesses
Cognitive and
psychomotor
underdevelopment
Lower
educational
performance
Higher labor
absenteeism
Social inclusion
problems
Lower Productivity
Lower
Performance in
Manual Labor
Lower physical
capacity
Increased
demand to social
services
Presentation of Results
The following data are the result of the work carried-out by a national
implementation team that collected, processed and analyzed official data, and
supported the adaptation of the model to estimate the social and
economic impact of child undernutrition in Africa.
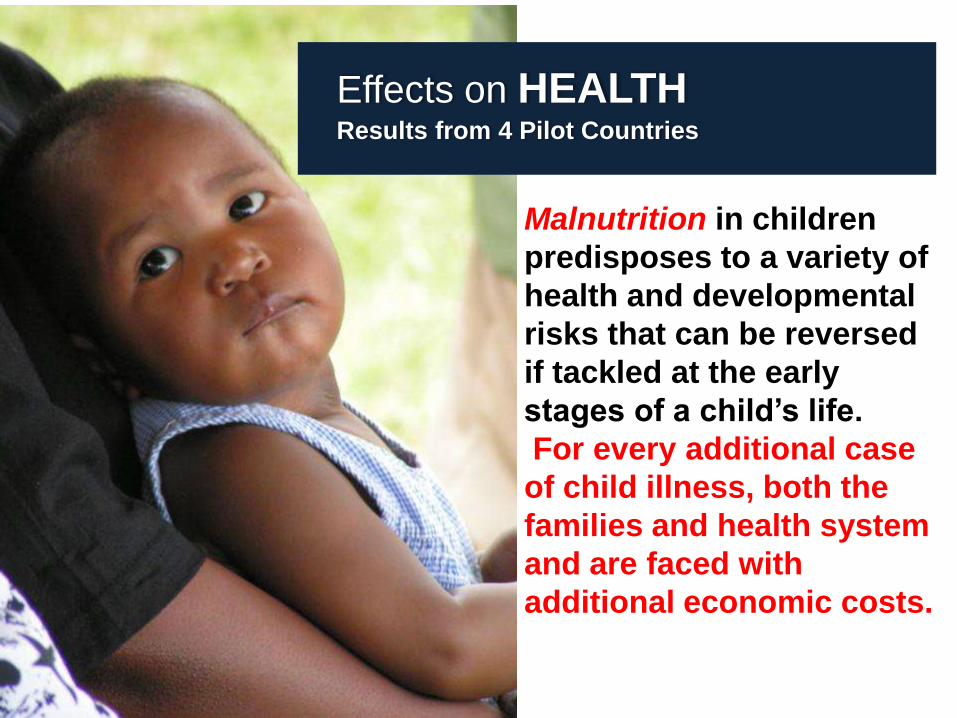
Effects on HEALTH Results from 4 Pilot Countries
Malnutrition in children
predisposes to a variety of
health and developmental
risks that can be reversed
if tackled at the early
stages of a child’s life.
For every additional case
of child illness, both the
families and health system
and are faced with
additional economic costs.
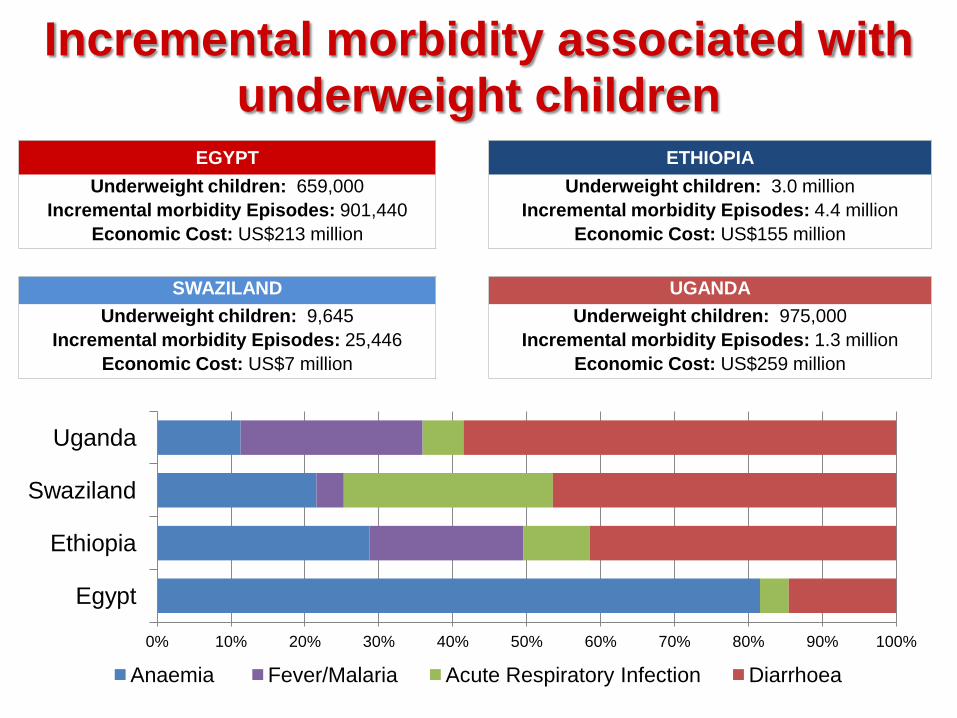
EGYPT ETHIOPIA
Underweight children: 659,000
Incremental morbidity Episodes: 901,440
Economic Cost: US$213 million
Underweight children: 3.0 million
Incremental morbidity Episodes: 4.4 million
Economic Cost: US$155 million
SWAZILAND UGANDA
Underweight children: 9,645
Incremental morbidity Episodes: 25,446
Economic Cost: US$7 million
Underweight children: 975,000
Incremental morbidity Episodes: 1.3 million
Economic Cost: US$259 million
0% 10% 20% 30% 40% 50% 60% 70% 80% 90% 100%
Egypt
Ethiopia
Swaziland
Uganda
Anaemia Fever/Malaria Acute Respiratory Infection Diarrhoea
Incremental morbidity associated with underweight children
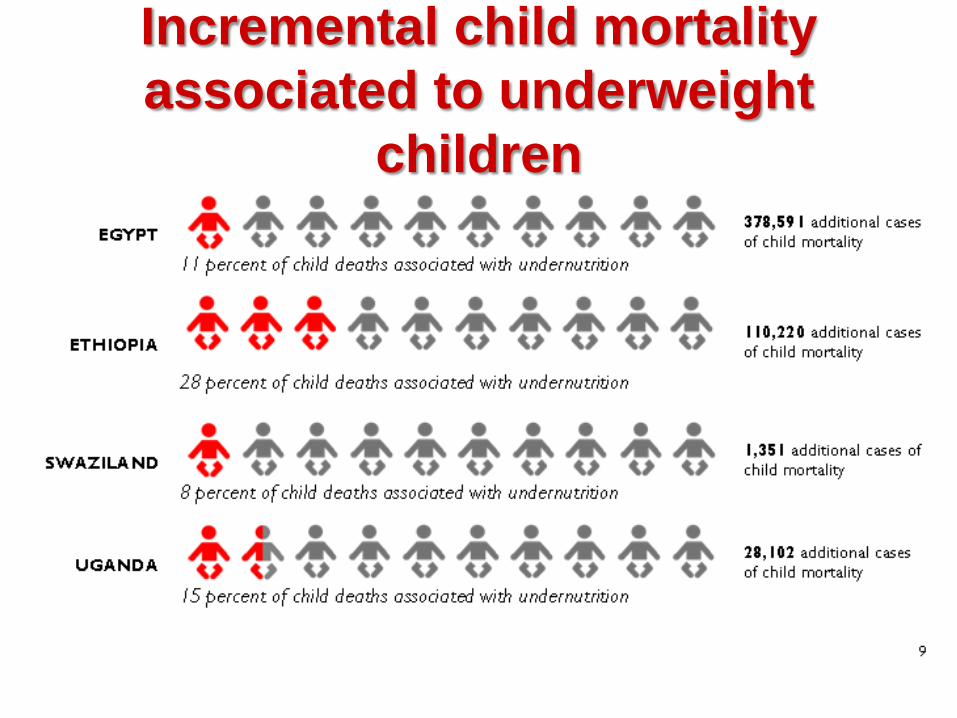
Incremental child mortality
associated to underweight
children
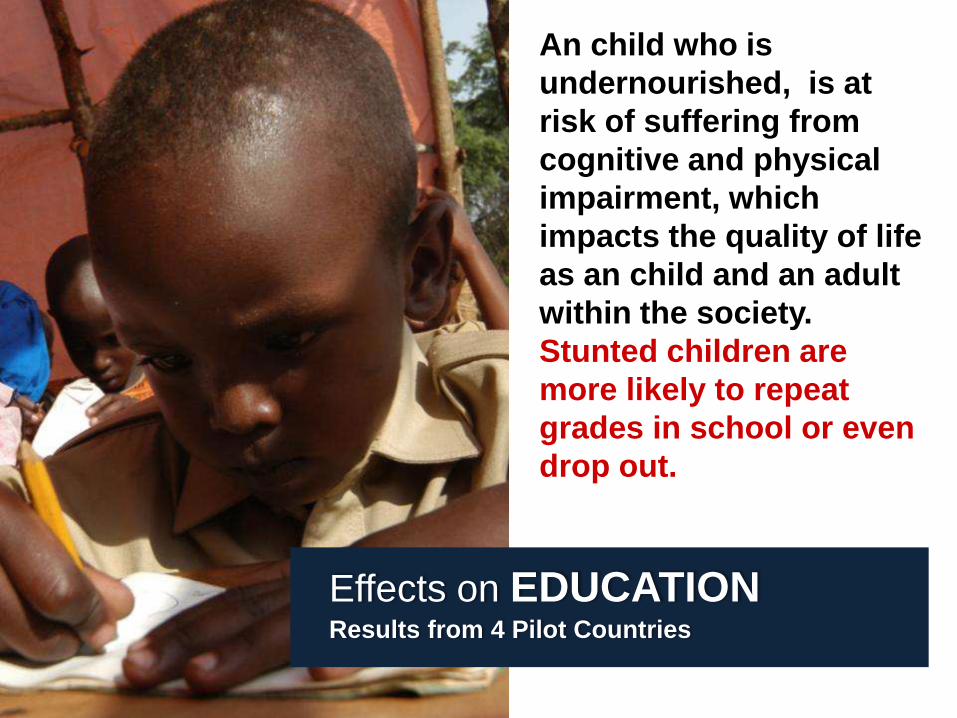
Effects on EDUCATION Results from 4 Pilot Countries
An child who is
undernourished, is at
risk of suffering from
cognitive and physical
impairment, which
impacts the quality of life
as an child and an adult
within the society.
Stunted children are
more likely to repeat
grades in school or even
drop out.
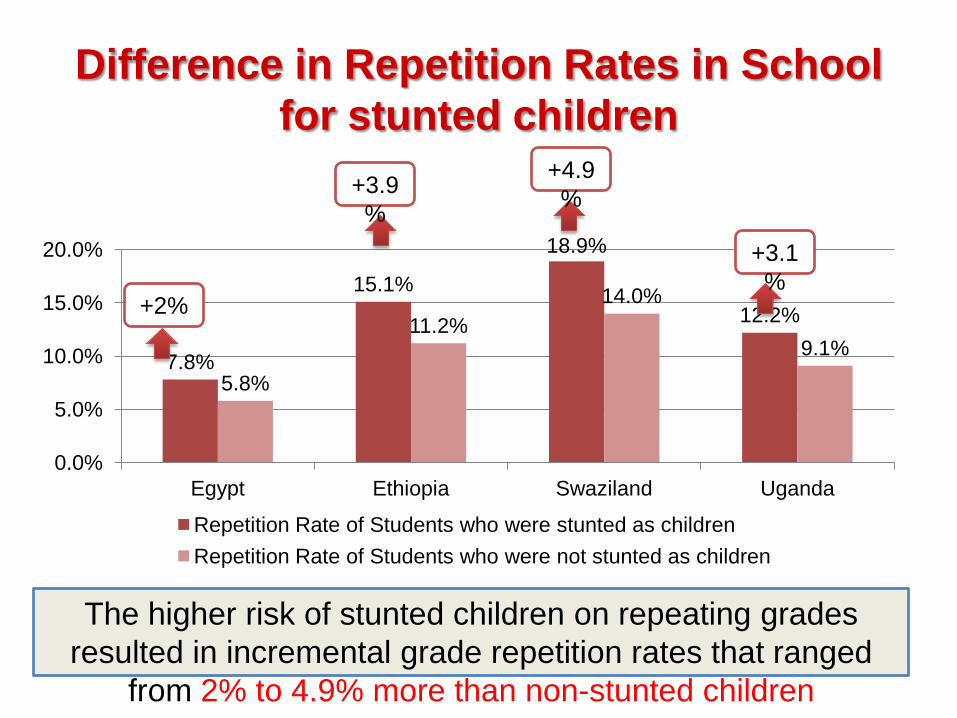
7.8%
15.1%
18.9%
12.2%
5.8%
11.2%
14.0%
9.1%
0.0%
5.0%
10.0%
15.0%
20.0%
Egypt Ethiopia Swaziland Uganda
Repetition Rate of Students who were stunted as children
Repetition Rate of Students who were not stunted as children
Difference in Repetition Rates in School
for stunted children
The higher risk of stunted children on repeating grades
resulted in incremental grade repetition rates that ranged
from 2% to 4.9% more than non-stunted children
+2%
+3.9
%
+4.9
%
+3.1
%
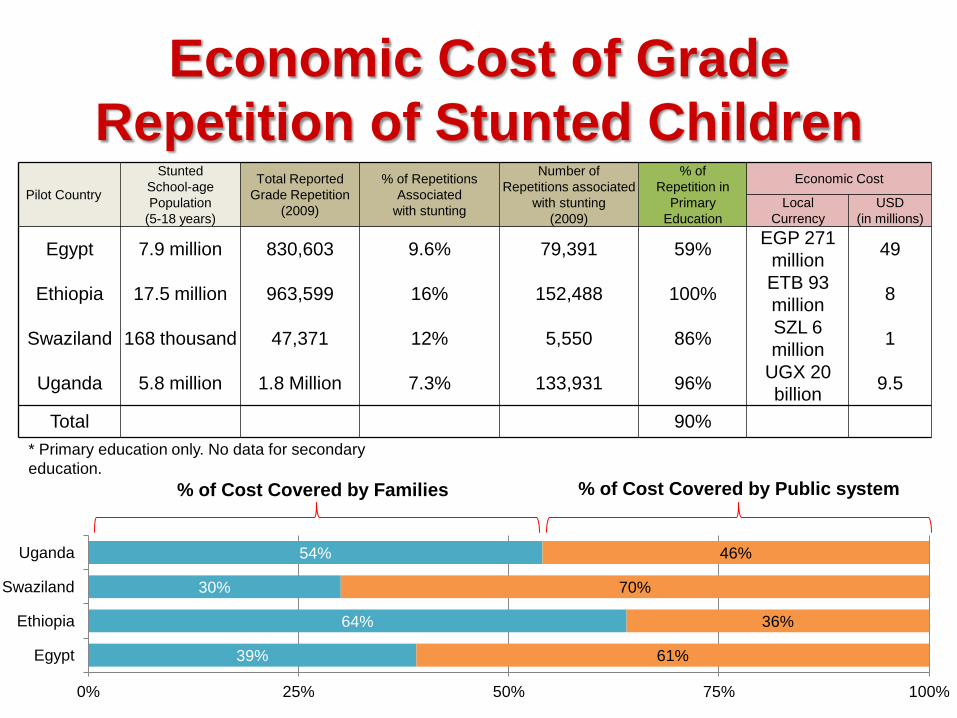
Economic Cost of Grade
Repetition of Stunted Children
* Primary education only. No data for secondary
education.
Pilot Country
Stunted
School-age
Population
(5-18 years)
Total Reported
Grade Repetition
(2009)
% of Repetitions
Associated
with stunting
Number of
Repetitions associated
with stunting
(2009)
% of
Repetition in
Primary
Education
Economic Cost
Local
Currency
USD
(in millions)
Egypt 7.9 million 830,603 9.6% 79,391 59% EGP 271
million 49
Ethiopia 17.5 million 963,599 16% 152,488 100% ETB 93
million 8
Swaziland 168 thousand 47,371 12% 5,550 86% SZL 6
million 1
Uganda 5.8 million 1.8 Million 7.3% 133,931 96% UGX 20
billion 9.5
Total 30.7 Million 1,841,573 371,360 90%
39%
64%
30%
54%
61%
36%
70%
46%
0% 25% 50% 75% 100%
Egypt
Ethiopia
Swaziland
Uganda
% of Cost Covered by Families % of Cost Covered by Public system
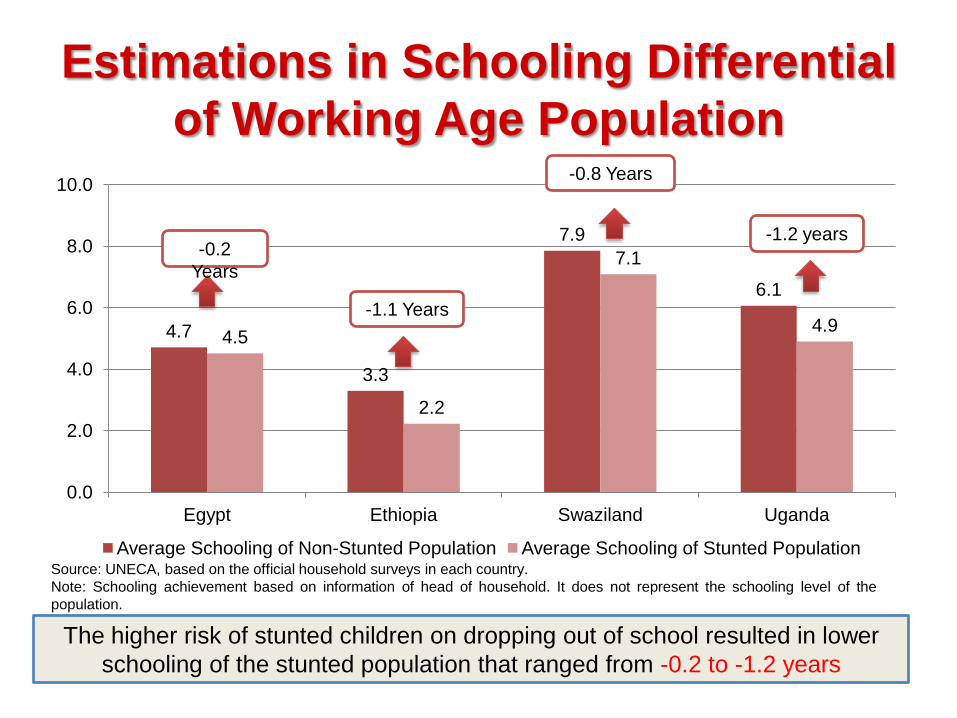
Estimations in Schooling Differential
of Working Age Population
4.7
3.3
7.9
6.1
4.5
2.2
7.1
4.9
0.0
2.0
4.0
6.0
8.0
10.0
Egypt Ethiopia Swaziland Uganda
Average Schooling of Non-Stunted Population Average Schooling of Stunted Population Source: UNECA, based on the official household surveys in each country.
Note: Schooling achievement based on information of head of household. It does not represent the schooling level of the
population.
-0.2
Years
-1.1 Years
-0.8 Years
-1.2 years
The higher risk of stunted children on dropping out of school resulted in lower
schooling of the stunted population that ranged from -0.2 to -1.2 years
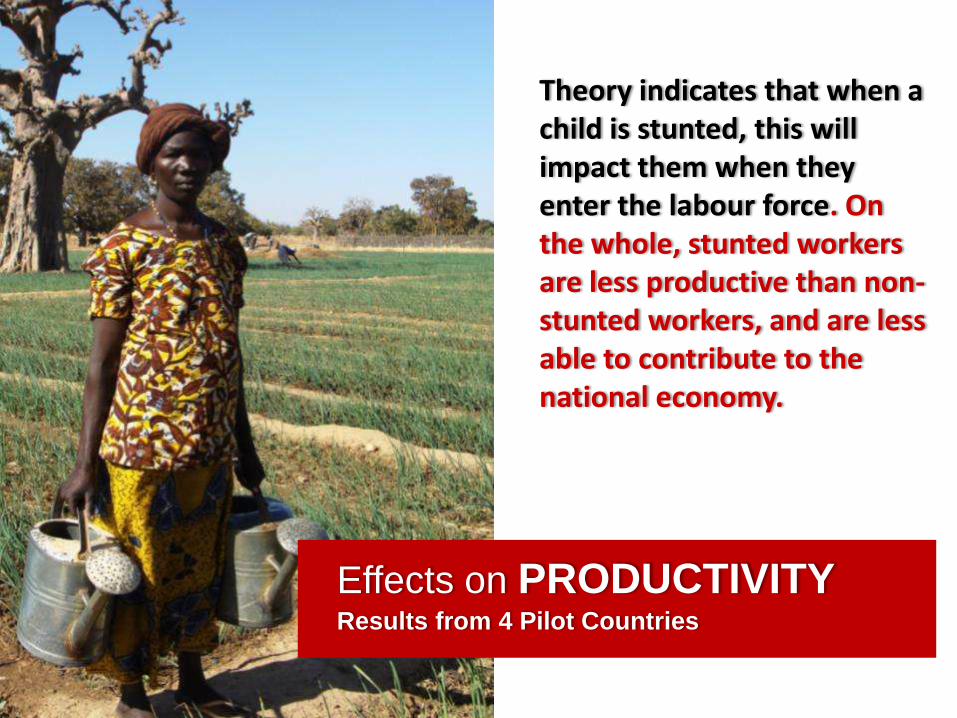
Theory indicates that when a child is stunted, this will impact them when they enter the labour force. On the whole, stunted workers are less productive than non-stunted workers, and are less able to contribute to the national economy.
Effects on PRODUCTIVITY Results from 4 Pilot Countries

Impact of Child Undernutrition in Working Age
Population
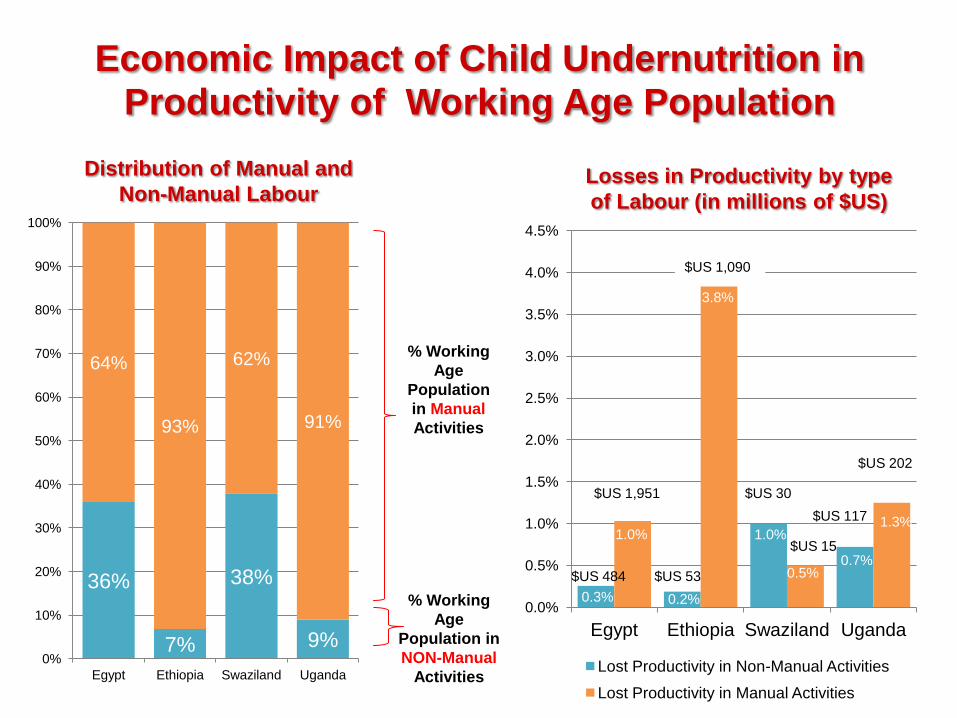
Economic Impact of Child Undernutrition in Productivity of Working Age Population
% Working
Age
Population
in Manual
Activities
% Working
Age
Population in
NON-Manual
Activities
36%
7%
38%
9%
64%
93%
62%
91%
0%
10%
20%
30%
40%
50%
60%
70%
80%
90%
100%
Egypt Ethiopia Swaziland Uganda
0.3% 0.2%
1.0%
0.7%
1.0%
3.8%
0.5%
1.3%
0.0%
0.5%
1.0%
1.5%
2.0%
2.5%
3.0%
3.5%
4.0%
4.5%
Egypt Ethiopia Swaziland Uganda
Lost Productivity in Non-Manual Activities
Lost Productivity in Manual Activities
$US 484
$US 1,951
$US 53
$US 1,090
$US 30
$US 15
$US 117
$US 202
Distribution of Manual and
Non-Manual Labour Losses in Productivity by type
of Labour (in millions of $US)

Impact of child mortality on working age
population
The impact of undernutrition on child mortality rates increases in
countries with higher prevalence. A percentage of the WAP is absent
from the economy due to incremental risk associated to undernutrition
1%
8%
2%
4%
0%
2%
4%
6%
8%
10%
Egypt Ethiopia Swaziland Uganda
0.5%
12%
1.4% 2%
0.0%
2.0%
4.0%
6.0%
8.0%
10.0%
12.0%
14.0%
Egypt Ethiopia Swaziland Uganda
Working Hours Lost
as % of Working Age Population Economic Value of WH lost
as % of GDP (in millions of $US)
857
million
WH
4,786 million
WH
37 million
WH
943
million
WH
$US 988
$US
3,396
$US 40 $US 317
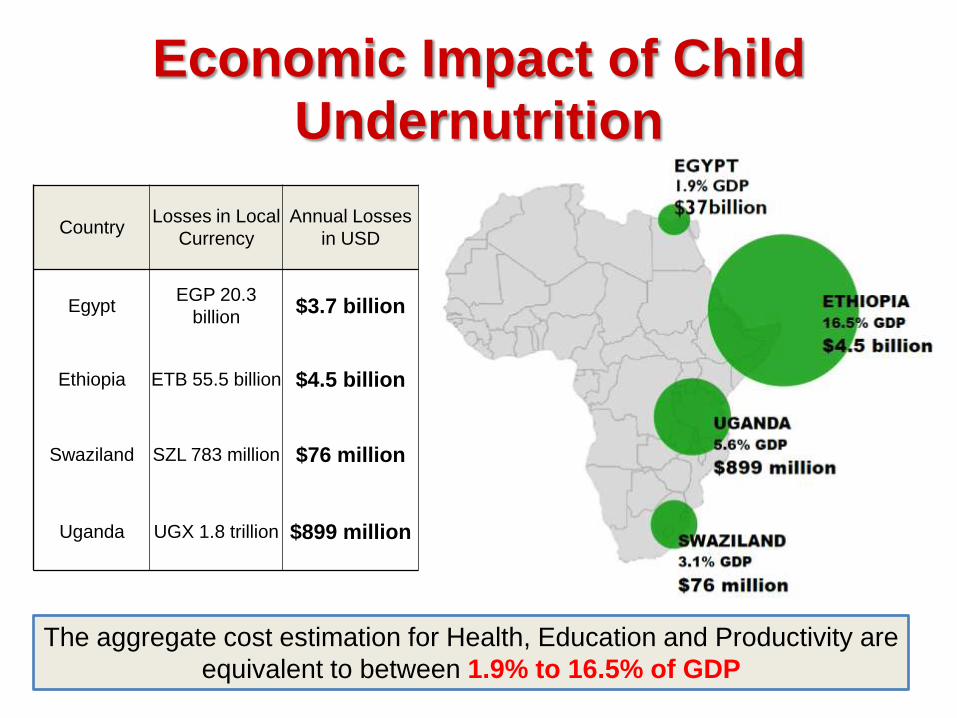
Economic Impact of Child
Undernutrition
Country Losses in Local
Currency
Annual Losses
in USD
Egypt EGP 20.3
billion $3.7 billion
Ethiopia ETB 55.5 billion $4.5 billion
Swaziland SZL 783 million $76 million
Uganda UGX 1.8 trillion $899 million
The aggregate cost estimation for Health, Education and Productivity are
equivalent to between 1.9% to 16.5% of GDP
What are the potential
savings of a reduction in
child stunting
prevalence?
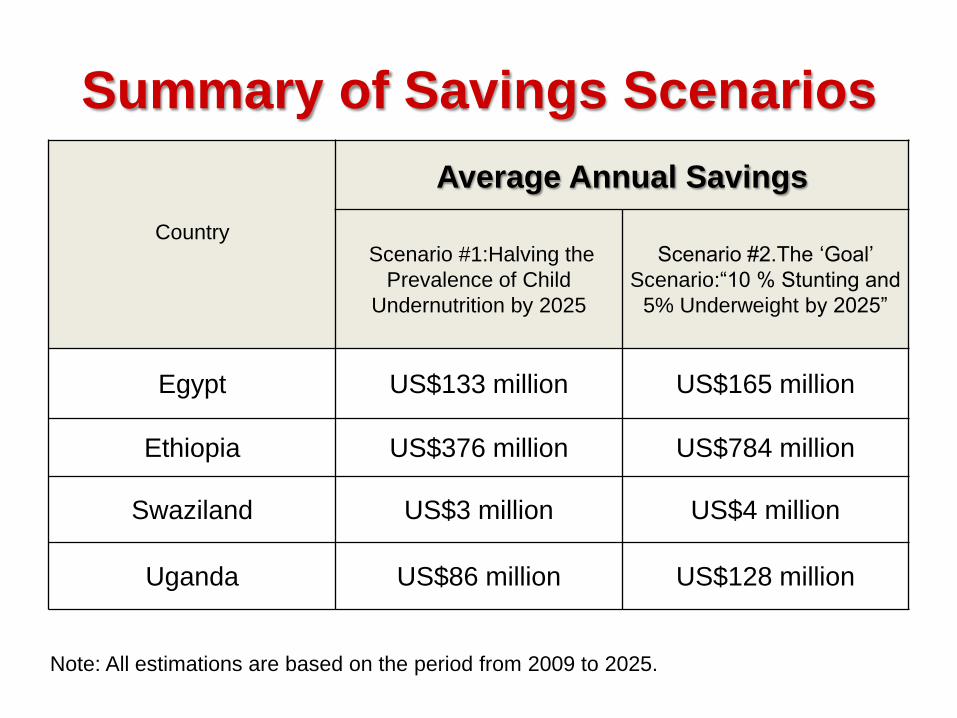
Summary of Savings Scenarios
Country
Average Annual Savings
Scenario #1:Halving the
Prevalence of Child
Undernutrition by 2025
Scenario #2.The ‘Goal’
Scenario:“10 % Stunting and
5% Underweight by 2025”
Egypt US$133 million US$165 million
Ethiopia US$376 million US$784 million
Swaziland US$3 million US$4 million
Uganda US$86 million US$128 million
Note: All estimations are based on the period from 2009 to 2025.
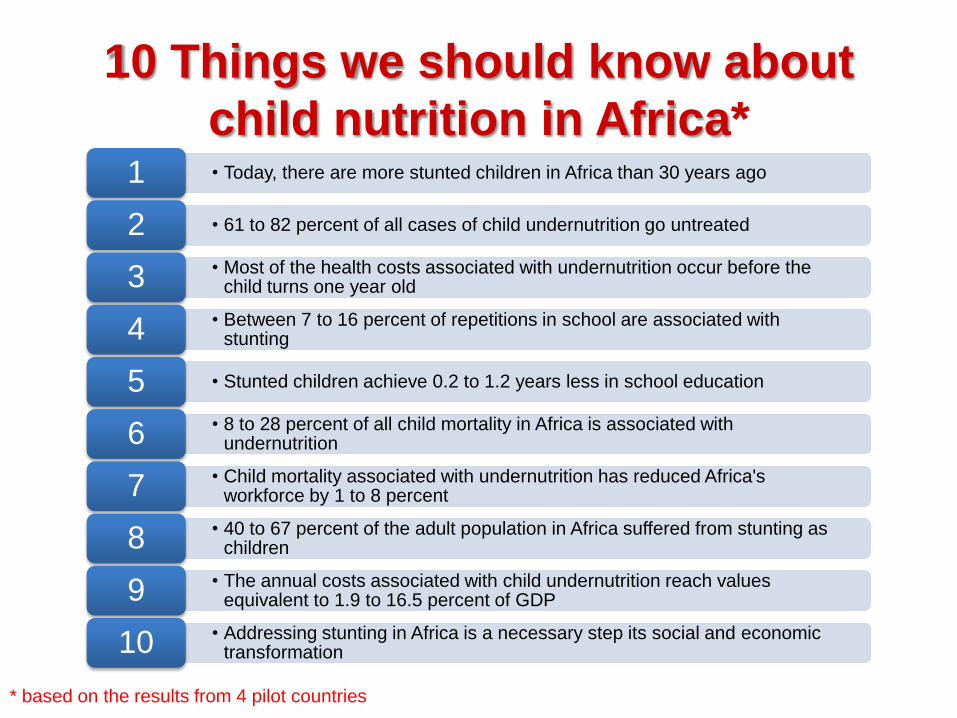
10 Things we should know about
child nutrition in Africa* • Today, there are more stunted children in Africa than 30 years ago 1
• 61 to 82 percent of all cases of child undernutrition go untreated 2
• Most of the health costs associated with undernutrition occur before the child turns one year old 3
• Between 7 to 16 percent of repetitions in school are associated with stunting 4
• Stunted children achieve 0.2 to 1.2 years less in school education 5
• 8 to 28 percent of all child mortality in Africa is associated with undernutrition 6
• Child mortality associated with undernutrition has reduced Africa's workforce by 1 to 8 percent 7
• 40 to 67 percent of the adult population in Africa suffered from stunting as children 8
• The annual costs associated with child undernutrition reach values equivalent to 1.9 to 16.5 percent of GDP 9
• Addressing stunting in Africa is a necessary step its social and economic transformation 10
* based on the results from 4 pilot countries
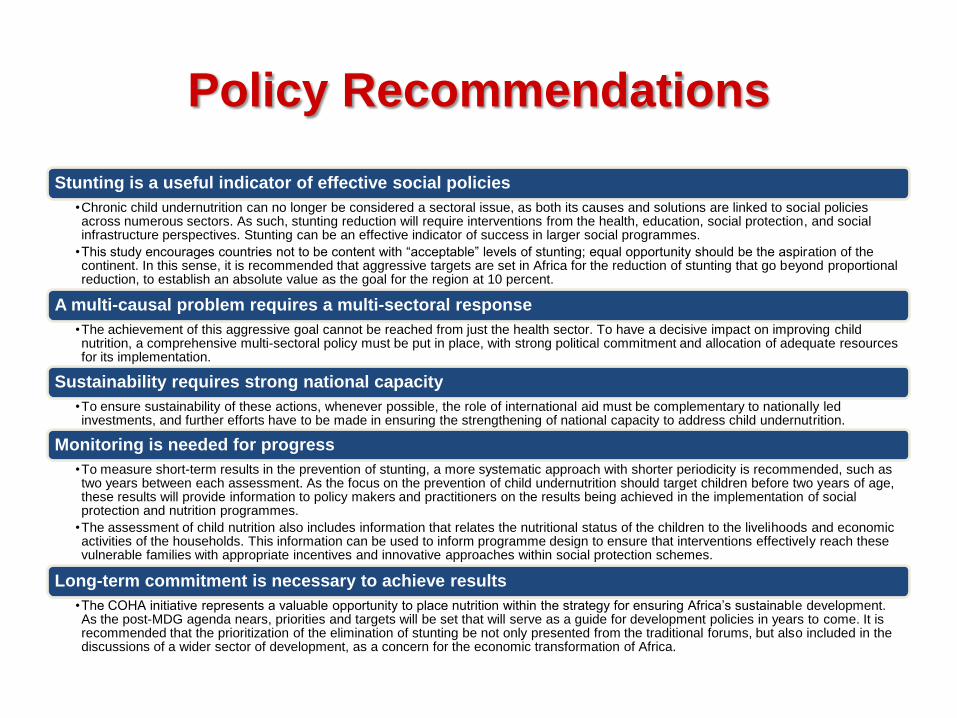
Policy Recommendations
Stunting is a useful indicator of effective social policies
•Chronic child undernutrition can no longer be considered a sectoral issue, as both its causes and solutions are linked to social policies across numerous sectors. As such, stunting reduction will require interventions from the health, education, social protection, and social infrastructure perspectives. Stunting can be an effective indicator of success in larger social programmes.
•This study encourages countries not to be content with “acceptable” levels of stunting; equal opportunity should be the aspiration of the continent. In this sense, it is recommended that aggressive targets are set in Africa for the reduction of stunting that go beyond proportional reduction, to establish an absolute value as the goal for the region at 10 percent.
A multi-causal problem requires a multi-sectoral response
•The achievement of this aggressive goal cannot be reached from just the health sector. To have a decisive impact on improving child nutrition, a comprehensive multi-sectoral policy must be put in place, with strong political commitment and allocation of adequate resources for its implementation.
Sustainability requires strong national capacity
•To ensure sustainability of these actions, whenever possible, the role of international aid must be complementary to nationally led investments, and further efforts have to be made in ensuring the strengthening of national capacity to address child undernutrition.
Monitoring is needed for progress
•To measure short-term results in the prevention of stunting, a more systematic approach with shorter periodicity is recommended, such as two years between each assessment. As the focus on the prevention of child undernutrition should target children before two years of age, these results will provide information to policy makers and practitioners on the results being achieved in the implementation of social protection and nutrition programmes.
•The assessment of child nutrition also includes information that relates the nutritional status of the children to the livelihoods and economic activities of the households. This information can be used to inform programme design to ensure that interventions effectively reach these vulnerable families with appropriate incentives and innovative approaches within social protection schemes.
Long-term commitment is necessary to achieve results
•The COHA initiative represents a valuable opportunity to place nutrition within the strategy for ensuring Africa’s sustainable development. As the post-MDG agenda nears, priorities and targets will be set that will serve as a guide for development policies in years to come. It is recommended that the prioritization of the elimination of stunting be not only presented from the traditional forums, but also included in the discussions of a wider sector of development, as a concern for the economic transformation of Africa.
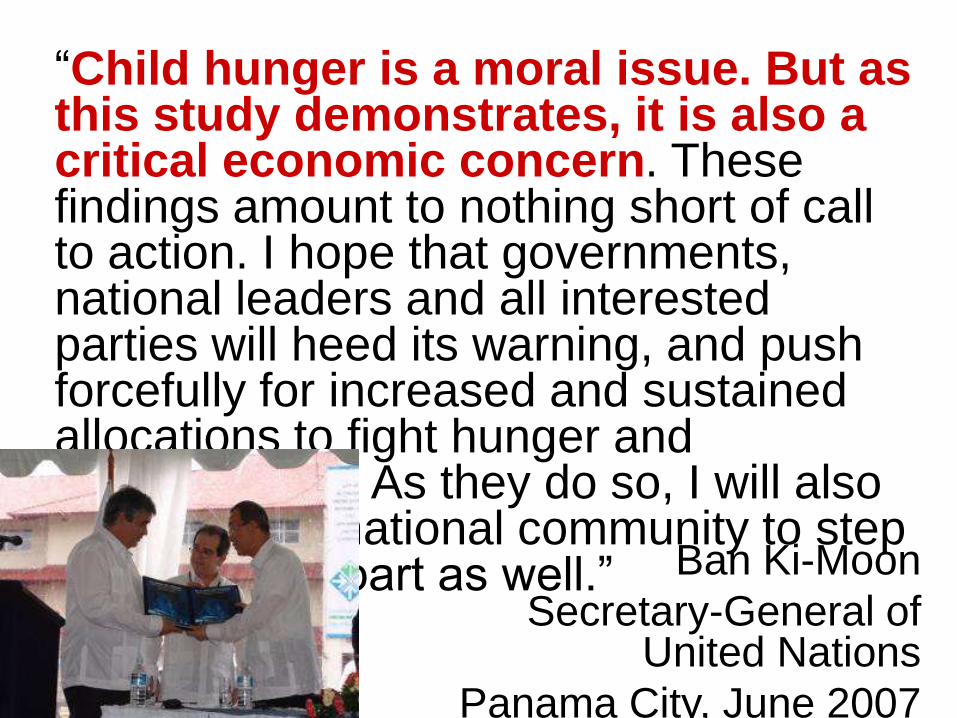
“Child hunger is a moral issue. But as this study demonstrates, it is also a critical economic concern. These findings amount to nothing short of call to action. I hope that governments, national leaders and all interested parties will heed its warning, and push forcefully for increased and sustained allocations to fight hunger and undernutrition. As they do so, I will also urge the international community to step up and do its part as well.” Ban Ki-Moon
Secretary-General of United Nations
Panama City, June 2007
Opportunities of this Study
• Position Child Undernutrition in the Centre of the Economic and Social Development agenda in Africa
– Stunting as a priority for Development
• Engage this issue as a key element of the Post-MDG agenda
– Africa can set a target that evidences technical and political commitment
• Partner and Donor support
– Special funds directed at nutrition interventions