implementing s&op using currently available sap applications · 2019-11-12 · asug annual...
TRANSCRIPT

Tod StengerSCM Solution Management, SAP Labs
ASUG Annual Conference, May 15, 2006
Implementing S&OP using currently available SAP applications
S&OP Overview
SAP Application Support
Challenges
What might it look like?
Conclusion
SAP AG 2006, Title of Presentation / Speaker Name / 3
Learning Points
Get to know what applications help support the S&OP process
See example data flows
Identify challenges in the current solution
See example screens for the S&OP process

S&OP Overview
SAP Application Support
Challenges
What might it look like?
Conclusion

SAP AG 2006, Title of Presentation / Speaker Name / 5
All five steps of the process are integrated
1. Strategic Planning� Market Planning� New Product Planning
� Resource Planning� Alignment to Corporate Goals� Margin Management
2. Demand Planning� Quantitative Forecasting
� Sales, Marketing Input� What-if Analysis� Orders/Demand Balancing� Consensus
3. Supply Planning� Capacity Planning � Inventory Planning� Procurement Planning� Logistics
5. Management
Evaluation & Analysis� KPI Measurement� Plan vs. Actual� Forecast error� Root Cause Analysis
4. Supply/Demand Balancing� Product Mix� Constraint Management� What-if Analysis� Allocation of Demand to Supply
� Consensus
SAP View: Fully Integrated, Closed-Loop Process

SAP AG 2006, Title of Presentation / Speaker Name / 6
Class A B C D
Customer Service 26% 18% 13% 8%
Productivity 20% 13% 9% 5%
Purchasing Costs 13% 9% 6% 4%
Inventory Levels 30% 21% 13% 8%
Source: Oliver Wight
(Best-in-Class)
S&OP Adds Value

SAP AG 2006, Title of Presentation / Speaker Name / 7
All departments can see the same data at the same time
Sales
Finance
Manufacturing & Logistics
Marketing
Channels
and Brands
Products, Sources, Capacity & Destinations
Revenues, Margins
& Working Capital
Customers andProduct Families
The Same Data, But from Different Perspectives

SAP AG 2006, Title of Presentation / Speaker Name / 8
1. Strategic Planning� Strategic Enterprise Management (SEM)
� Business Intelligence - Business
Warehouse – Business Planning &
Simulation (BW – BPS)
� BW – CRM Analytics� Pricing and Margin Management
(Vendavo®)
2. Demand Planning� APO Demand Planning (DP)
� Supply Chain Event
Management (SCEM)
3. Supply Planning� APO Supply Network Planning (SNP)
� Supply Chain Event Management (SCEM)
� Supply Network Collaboration (Inventory
Collaboration Hub – ICH)
4.Supply/Demand Balancing� APO Demand Planning (DP)
� APO Supply Network Planning
(SNP)
5. Management Evaluation & Analysis� Supply Chain Analytics and Visibility (Supply
Chain Performance Management – SCPM)
� APO Demand Planning (DP)
� Event Management (SCEM)
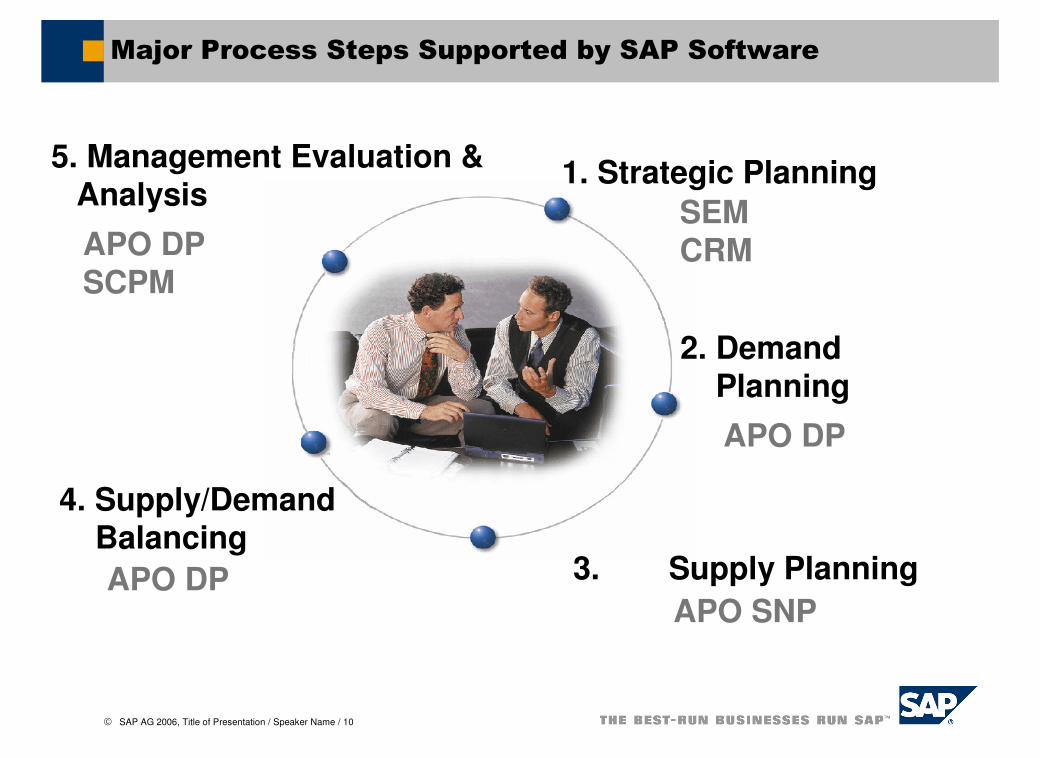
Major Process Steps Supported by SAP Software

S&OP Overview
SAP Application Support
Challenges
What might it look like?
Conclusion
SAP AG 2006, Title of Presentation / Speaker Name / 10
1. Strategic Planning
2. DemandPlanning
3. Supply Planning
4. Supply/DemandBalancing
5. Management Evaluation & Analysis
SEMCRM
APO DP
APO SNPAPO DP
APO DPSCPM
Major Process Steps Supported by SAP Software

SAP AG 2006, Title of Presentation / Speaker Name / 11
System Attributes: SEM
Typically used for Financially oriented planning
Plan not done at Product Level
Both Currency and Units may be needed
Needs a basis to disaggregate to Product level to interact with Demand Planning
SAP AG 2006, Title of Presentation / Speaker Name / 12
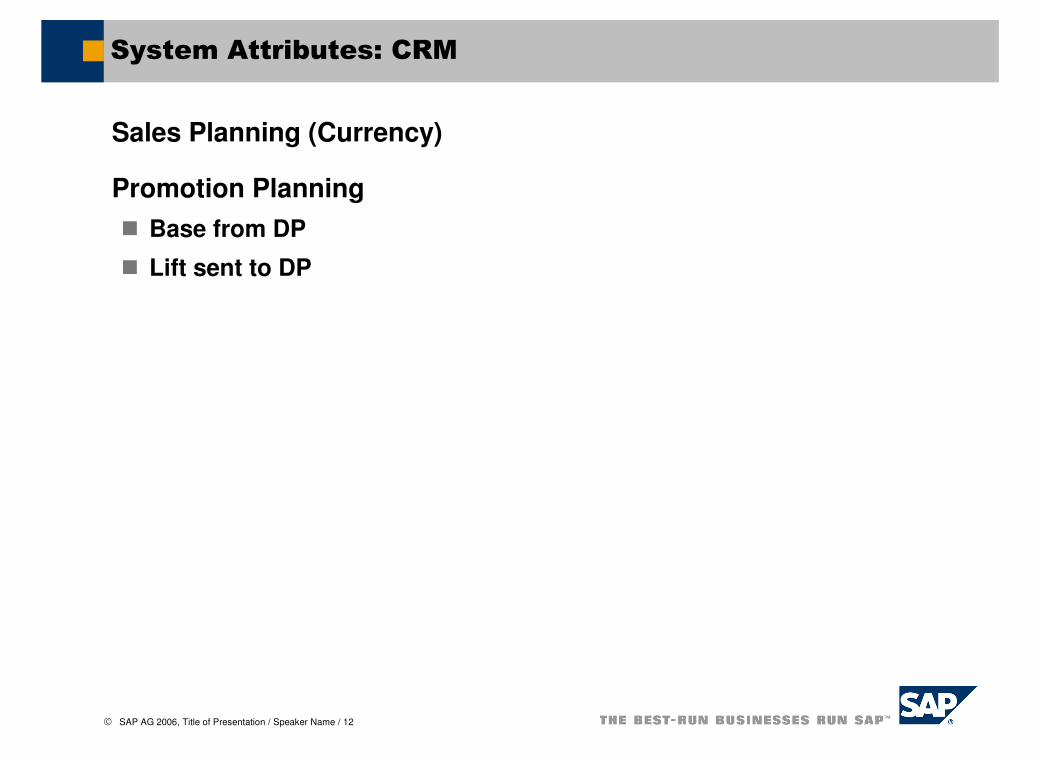
System Attributes: CRM
Sales Planning (Currency)
Promotion Planning
� Base from DP
� Lift sent to DP

SAP AG 2006, Title of Presentation / Speaker Name / 13
System Attributes: APO DP
Produces Unit Demand Plan
Consolidate Sales Plan, Budget, Marketing Plan
Promotions available from CRM
Clearinghouse for data in S&OP process
Flexible views for all aspects of S&OP process

SAP AG 2006, Title of Presentation / Speaker Name / 14
System Attributes: APO SNP
Create Production and Procurement plans
Uses Demand Plan from APO DP
Rough Cut Capacity Planning
Ability to have separate version for S&OP process

SAP AG 2006, Title of Presentation / Speaker Name / 15
System Attributes: BW
Reporting
Support for Supply Chain Analytics
Visual Composer (as of BW 3.5)

SAP AG 2006, Title of Presentation / Speaker Name / 16
System Attributes: SEM
Typically used for Financially oriented planning
Plan not done at Product Level
Both Currency and Units may be needed
Needs a basis to disaggregate to Product level to interact with Demand Planning

SAP AG 2006, Title of Presentation / Speaker Name / 17
Basic Data Flow
SEM/BW
DPSNP
CRM

SAP AG 2006, Title of Presentation / Speaker Name / 18
SEM/BW and DP interaction
Forecast at Product Level
Price
Forecast Revenue
Supply Plan
SEM/BW
DP
Budget at Product Level
�Currency
�Convert to Units in DP

SAP AG 2006, Title of Presentation / Speaker Name / 19
CRM and DP Interaction
Promotion Lift
Sales Plan
�Currency
�Convert to Units in DP
Promotion Base
DP
CRM

SAP AG 2006, Title of Presentation / Speaker Name / 20
DP and SNP Interaction
Supply Plan
�Production
�Procurement
Demand Plan
�Adjusted for Marketing and Sales Plans
DPSNP

S&OP Overview
SAP Application Support
Challenges
What might it look like?
Conclusion

SAP AG 2006, Title of Presentation / Speaker Name / 22
Challenges in the current environment
Data Mapping
New Resources
New LocationsJob Streams
Versions in SNP
New Products

SAP AG 2006, Title of Presentation / Speaker Name / 23
SEM-DP Data Mapping
No Product in SEM
Need Unit to Currency conversion done (DP)
May have additional characteristics in SEM or DP
�Need Update Rules when passing data
Dummy products may be included in SEM plan
SEM/BW
DP

SAP AG 2006, Title of Presentation / Speaker Name / 24
New Products - DP
Dummy Products
�Need additional Char. Combinations
�Need Product Master data if need for
Lifecycle Planning
�Can not map to SNP
Increase existing products
�Need separate key figure for
Demand Plan
�Loss of visibility and may overstate a
Product or Product Group

SAP AG 2006, Title of Presentation / Speaker Name / 25
New Locations/Resources - SNP
Need to employ version specific master data (Resource, PPM, Location)
Must manually create additional master data objects and add to model
Additional Model in SNP
High maintenance cost for additional master data
SAP AG 2006, Title of Presentation / Speaker Name / 26
Version Management
Additional Key Figure in DP
Additional Version in SNP
� Use tcode /SAPAPO/VERCOP to get snapshot of current order data
� Need to copy order categories that are relevant to your process

SAP AG 2006, Title of Presentation / Speaker Name / 27
Basic Jobs
Calculate Revenue from DP forecast
Extract Unit and Revenue plan from DP to SEM/BW
Extract Revenue Plan from SEM/BW to DP (Separate Key figure)
Extract Sales Plan from CRM
Calculate Unit Plan from Revenue Plan (SEM and CRM)
Pass Demand Plan Key figure to SNP
SNP solver (including Capacity Leveling if needed)
Pass SNP plan to DP
Calculate KPIs for display in DP or extract to BW
Extract plans and KPIs from DP to BW for Reporting

S&OP Overview
SAP Application Support
Challenges
What might it look like?
Conclusion

SAP AG 2006, Title of Presentation / Speaker Name / 29
We have already been through the demand planning process of anticipating market requirements from all of the best perspectives (sales, marketing, customer, quantitative, etc.). Here we are looking at the supply picture and automatically highlighting issues that need to be addressed, relative to various demand scenarios (expected forecast, high side forecast and another simulation forecast).

SAP AG 2006, Title of Presentation / Speaker Name / 30
The data in APO can be directly read by BW to create information in other formats.
SAP AG 2006, Title of Presentation / Speaker Name / 31
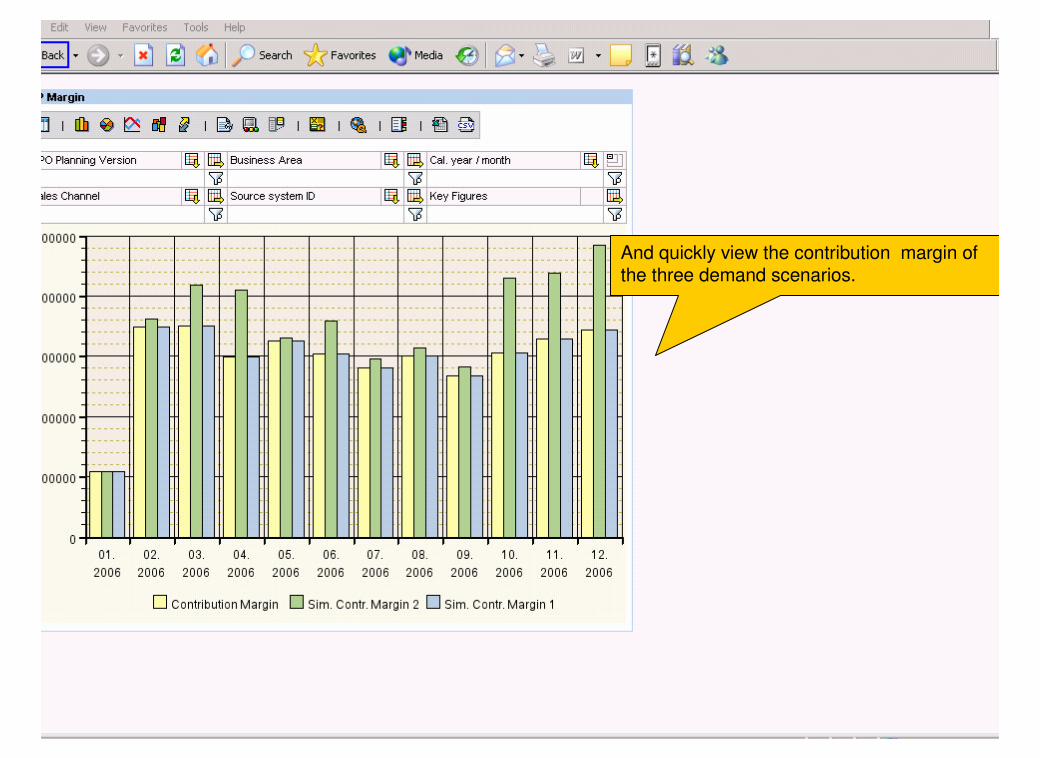
And quickly view the contribution margin of the three demand scenarios.

SAP AG 2006, Title of Presentation / Speaker Name / 32
Or, the high level forecast by plant or any other selection of data that puts it in the terms of the relevant S&OP stakeholder.

And, quickly graphed the impact on contribution margin.

S&OP Overview
SAP Application Support
Challenges
What might it look like?
Conclusion

SAP AG 2006, Title of Presentation / Speaker Name / 35
Key Learnings
Current SAP applications can support the S&OP process
New products/locations/resources can be included in the plan – but will require extra master data maintenance
Example data flow
Challenges with using current applications
There is no facility for tracking the S&OP process in current applications
Note: for additional S&OP information see session 4410 on Wednesday

SAP AG 2006, Title of Presentation / Speaker Name / 36
4101Session Code: