implementation plan for minnesota’s statewide mercury ... 2009d.pdf · for more information about...
TRANSCRIPT

Implementation Plan
for Minnesota’s Statewide Mercury
Total Maximum Daily Load
October 2009

For more information about the Implementation Plan for Minnesota’s Statewide Mercury Total Maximum Daily Load, contact: Ned Brooks, MPCA, 520 Lafayette Rd. N., Saint Paul, MN 55155-4194. E-mail: [email protected]. Telephone: 651-757-2247.
This is Minnesota Pollution Control Agency publication wq-iw4-01p.
This publication can be made available in other formats, including Braille, large type, computer disk or audiotape, upon request.

Contents
1. Introduction ................................................................................................................ 1
2. Implementation Plan Overview ................................................................................. 2
2.1 Implementation Roles .......................................................................................2
2.2 Sources and Water Bodies Not Included in This Reduction Plan ....................5
2.3 Implementation Financial Assistance ...............................................................5
3. Water Implementation Strategies ............................................................................. 7
3.1 Permitting Strategy ...........................................................................................7
3.2 Dental Clinic Discharges ..................................................................................7
3.3 Implementation for Nonpoint Water Sources ...................................................8 4. Air Implementation Strategies .................................................................................. 9
4.1 Air Emission Sources with MPCA Air Permits ..............................................10
4.2 Specific Facilities/Sources Without MPCA Air Permits ................................14
4.3 Product-related Strategies ...............................................................................15
4.4 Summary of Air Implementation Strategies for Existing Sources ..................17
4.5 Emissions from Potential New or Modified Sources ......................................18
4.6 Out-of-state Sources........................................................................................19
5. Monitoring and Evaluation Plan ............................................................................. 23
5.1 Air Emissions ..................................................................................................23
5.2 Municipal and Industrial Wastewater Discharges ..........................................24
5.3 Environmental Response Indicators ...............................................................24
5.4 Additional Monitoring and Assessment..........................................................26
Appendices
1. Strategy Framework for Implementation of Minnesota’s Statewide Mercury
TMDL
2. Mercury TMDL Implementation Oversight Group Charge
3. Permitting Strategy for Addressing Mercury in Municipal and Industrial
Wastewater Permits
4. MPCA-MDA Memorandum of Understanding
5. Estimated Mercury Emissions in Minnesota for 2005 to 2018
6. Guidelines for New and Modified Mercury Air Emission Sources
7. Monitoring and Assessment Program for Minnesota’s Mercury TMDL
Implementation (MAP-Hg)

1. Introduction
The federal Clean Water Act requires each state to evaluate its water bodies and determine whether they meet water-quality standards. For mercury, these standards define how much mercury can be in the water and in fish. Water bodies that do not meet water-quality standards are added to a list of water bodies referred to as the Impaired Waters List. Minnesota’s 2004 Impaired Waters List included 820 lakes and 419 river segments that were considered impaired for mercury, usually due to fish contamination. Eating fish contaminated with mercury can damage the central nervous system. Children and fetuses, whose nervous systems are still developing, are especially vulnerable. To address impaired waters, states are required to evaluate the sources of pollution, the reduction in the pollutant needed to meet water-quality standards, and allowable levels of future pollution. This evaluation, typically done for each water body or watershed, is called a Total Maximum Daily Load, or TMDL. Because the source of essentially all mercury to Minnesota waters is the atmosphere, the Minnesota Pollution Control Agency (MPCA) prepared a statewide mercury TMDL. This TMDL was approved by the U.S. Environmental Protection Agency (EPA) in March 2007. To meet water-quality standards, the TMDL determined that human-caused, air-deposited mercury would need to be reduced by 93% from 1990 levels. Applying this to air emission sources in the state established a 789-pounds-per-year air emission goal. The TMDL also established a cap on wastewater discharges in the state of 24 pounds per year (lb/yr). For more information on sources of loading and estimated load reductions needed to reduce impairments, refer to Minnesota’s Statewide Mercury TMDL at www.pca.state.mn.us/water/tmdl/tmdl-mercuryplan.html. Once a TMDL is approved by the EPA, states are responsible for implementing measures to achieve the goals established in the TMDL. This document is the plan for achieving the goals of Minnesota’s Statewide Mercury TMDL. This implementation plan consists of strategies to ensure that water discharges remain below 24 lb/yr and to reduce air emissions to below 789 lb/yr. To develop the key elements of the implementation plan, the MPCA called on stakeholders to recommend source-specific reduction targets, strategies to meet the targets, and interim and final time frames for achieving reductions. Two groups of stakeholders provided input. The main stakeholder group, the Strategy Work Group, consisted of 17 members who met once or twice a month for 12 months, ending in June 2008. A larger Partners Group of approximately 75 stakeholders met twice to review and comment on the Strategy Work Group’s recommendations. The stakeholders presented recommendations in their report, Strategy Framework for Implementing Minnesota’s
Statewide Mercury TMDL (referred to as the Strategy Framework). The Strategy
Framework is included as Appendix 1.

2
2. Implementation Plan Overview
This document is the Mercury TMDL Implementation Plan. It details the strategies the MPCA will employ to meet the air and water goals established in Minnesota’s Statewide TMDL for mercury. This section provides an overview of the MPCA’s approach to implementation; discusses the implementation roles and responsibilities; and lists key implementation milestones between now and 2025, the target date for final implementation. Later sections describe the implementation plan strategies in detail. This plan references mercury release goals established in the TMDL. The TMDL implementation planning phase also identified interim and final targets for specific emission source categories. In this plan, the terms “goal” and “target” have specific meanings. The MPCA is using these terms to reference interim and final mercury release levels. If the interim and final mercury release levels are not met, the plan provides for additional measures that source categories will be required to take to assure that the required TMDL reductions are made.
2.1 Implementation Roles
While the MPCA is the primary entity responsible for implementing strategies to meet the goals of the TMDL study, the agency will work closely with a stakeholder Implementation Oversight Group and Minnesota entities that release mercury to the environment.
MPCA Role and Approach
To ensure that the goals of the TMDL are met, the MPCA will employ its full range of program capabilities and authorities. Sections 3 and 4 of this implementation plan describe the specific strategies and tools that the MPCA will use to achieve the water and air goals in the TMDL. These include rule-making, permitting, compliance and enforcement, monitoring, inventory development, pollution prevention, education, outreach, and collaboration on voluntary reductions. The best available information was used to develop this implementation plan, and the MPCA fully expects that successful implementation of the stakeholder-identified strategies will result in meeting the established targets. Nevertheless, uncertainty warrants an adaptive approach to implementation. By setting source-category-specific interim targets and periodic evaluation benchmarks, the plan incorporates opportunities to evaluate progress and, if necessary, to intervene and modify strategies to ensure that reduction goals are met and release targets are not exceeded. Table 1 is a timeline of key implementation milestones, established checkpoints, and possible intervention dates. In addition to effecting the implementation strategies, if reviews of monitoring data and studies provide new information that would change any of the assumptions used to establish the TMDL or that would change the allocation, the MPCA will revise the TMDL and, if appropriate, develop water-body-specific TMDL strategies.

3
Table 1. Mercury TMDL Implementation Milestones
YearMilestones
(Major implementation progress and state of knowledge review dates are in bold-face type.)
2009 • First annual meeting of Ongoing Oversight Group Monitoring, reporting and reduction planning rule are published by end of year.
2010 • MPCA Triennial Mercury Inventory for 2008 (pre-rule reporting) Improved mass balance, emissions estimates from crematory, petroleum, recyclers, smelters, dental, product manufacturing
2011
• Reduction plans due (proposed) for industrial boilers, petroleum refineries, smelters and sewage sludge incineration.
• First year of emission tracking under proposed rule
2012 • First year of emission reporting under proposed rule
• Reduction plans due in 2011 incorporated into permits
2013
• MPCA Triennial Mercury Inventory for 2011 (first version with required reporting)
• Review to evaluate New and Expanding Source Policy, 2011 emission inventory and
reduction targets. Review progress of un-permitted air point sources.
2014 • Enact requirements, if need, to compel reductions by unpermitted air point sources.
• Mercury Reduction Act of 2006 final implementation target date
2015 • Black Dog Units 3 and 4, Hoot Lake Units 2 and 3 reduction plans are due.
2016
• MPCA Triennial Mercury Inventory for 2014
• Taconite/ferrous mining reductions plans are due.
• Major Reduction Progress Review in advance of 2018 goals
2017 • Enact requirements, if needed, to ensure that 2018 goals are met.
2018
• Final goal for petroleum refining, industrial/institutional/commercial boilers, sewage sludge incineration, product recyclers and miscellaneous products sources
• Interim goal for smelters, crematories, product manufacturing
2019 • MPCA Triennial Mercury Inventory for 2017
• Major Reduction Progress Review of 2018 Goals
2020 • Austin Northeast Unit 1, Laskin Units 1 and 2 reduction plans are due.
2022 • MPCA Triennial Mercury Inventory for 2020
• Major Reduction Progress Review in advance of 2025 goals
2023 • Implement measures, if needed, to ensure that 2025 goals are met.
2024 • Implement measures, if needed, to ensure that 2025 goals are met.
2025
• Final goal for taconite/ferrous mining, smelters, crematories, utilities and product manufacturing
• MPCA Triennial Mercury Inventory for 2023
• Major Review of reduction progress
2026 • 2025 emission reports are due.
• Preliminary review/evaluation of 2025 emissions and goals
2028 • MPCA Triennial Mercury Inventory for 2026
• Final Progress Review to determine whether 2025 goal has been met

4
Implementation Oversight Group
Pursuant to stakeholder recommendations, the MPCA has convened an Implementation Oversight Group to assist the agency with the adaptive approach to TMDL implementation. This group, made up of one or two representatives from each key stakeholder constituency, will serve in an advisory capacity to the MPCA. These stakeholders will meet to review and evaluate progress toward achieving the goals of the Statewide Mercury TMDL and to determine whether additional measures are needed to meet these goals. During the first five years of implementation, the MPCA plans to convene this group at least once a year, most likely each fall. After 2013, meeting frequency will be determined in consultation with stakeholders and based on implementation progress. At a minimum, meetings will be held every three years, coinciding with the major review dates shown in Table 1.
Specific tasks of the Oversight Group are:
• Review and evaluate progress on sector benchmarks and interim goals described in the individual air emissions and water discharge strategies.
• Gauge effectiveness of strategy implementation, including overall implementation of strategy framework.
• Determine the need for actions to ensure that source category goals are met.
• Provide input to the MPCA on the need to modify the implementation plan, based on the evaluation of progress.
• Review changes to the air emissions inventory.
• Review the implementation of offsets employed to accommodate new and/or expanded sources of air emissions.
• Review guidelines for new and/or expanded sources of air emissions and progress towards goals in light of new permitted sources.
• Review the latest scientific information that could affect implementation of the TMDL.
• Review Other Recommended Actions.
• Review MPCA’s evaluation of the effectiveness of the TMDL.
An organizational meeting of the Implementation Oversight Group was held in April 2009. The objectives of this group and original membership are included in Appendix 2, Mercury TMDL Implementation Oversight Group Charge.
Minnesota Release Sources
Specific facilities or entities responsible for air and water releases of mercury also play an important role in implementing this plan. This includes improved measurement and reporting of releases, investigating reduction potential, and developing and implementing water minimization or air reduction plans. For sources in some sectors, it also means working with other release sources within their source category to collaborate on

5
research, ensure that interim and final emission reduction goals are met, and that water discharge limits are not exceeded.
2.2 Sources and Water Bodies Not Included in This Reduction Plan
Out-of-state Sources
This implementation plan does not attempt to reduce emissions from natural sources, man-made (anthropogenic) emissions outside the state, or re-emission of anthropogenic deposition. While these sources clearly contribute the majority of mercury that contaminates fish in Minnesota, the MPCA cannot reasonably expect to reduce these sources. As described in section 4, the MPCA will make efforts to reduce total emissions through its work with other states and in particular the EPA. The EPA has the ability to enact requirements to reduce mercury emissions in the United States and, with other federal agencies, is involved in efforts to reduce mercury releases worldwide.
Water Bodies Not Included in the Statewide TMDL
This implementation plan addresses the water bodies included in the Statewide Mercury TMDL. Strategies identified in this document will benefit all mercury-impaired waters in the state. However, not all mercury-impaired waters in Minnesota are covered by the Statewide Mercury TMDL.
To be included in the Statewide Mercury TMDL, the MPCA must show that water bodies will meet water-quality standards after the mercury-reduction goals are achieved. For mercury-contaminated fish, this means that concentrations would be calculated to be below the statewide fish-tissue criterion of 0.2 milligrams per kilogram (mg/kg) of mercury per kilogram. Water bodies that are not expected to meet this criterion after implementation remain on the impaired waters list. Currently, 998 impaired waters are covered by the TMDL (671 lakes and 327 river reaches) and 298 (204 lakes and 94 river reaches) are not covered by the TMDL and remain on the 2008 list for mercury.
For water bodies remaining on the list, the MPCA could not demonstrate that the statewide criterion would be reached, either because existing levels are too high or because of a lack of data. The MPCA is increasing monitoring on many of these lakes to gather more data. With more data the MPCA may be able to include additional lakes in the TMDL. Other lakes may not be added to the statewide TMDL, in which case an individual TMDL may be required. Even if the TMDL implementation does not reduce fish contamination in all waters to below 0.2 mg/kg, all waters will experience reductions in mercury loading and fish will be less contaminated as a result of the TMDL.
2.3 Implementation Financial Assistance
Funding for activities contained in this plan and implemented by public sector entities may be available from the State of Minnesota. Elements of the plan that may be eligible for funding and potential cost estimates per project include:
• development and implementation of mercury minimization plans for wastewater-treatment plants described in Section 3.1 ($10,000-$75,000);

6
• government-led outreach, prevention and collection activities targeting homeowners and small businesses to properly manage existing mercury products and avoid future releases as described in Section 4.3 ($5,000 to $200,000); and
• other government activities to reduce releases of mercury associated with products.
Public sector entities interested in learning more about financial assistance should contact Ned Brooks, the MPCA’s mercury coordinator (phone 651-757-2247, e-mail [email protected]).

7
3. Water Implementation Strategies
Minnesota’s Statewide Mercury TMDL established an annual allowable load of mercury from point-source water discharges in the state of 11 kg, or 24 lb, per year. While releases in 1990 were three times this level, by 2004 discharges had been reduced to about 7 kg, or 15 lb, mostly due to reduction activities at the state’s two largest municipal wastewater-treatment plants. In addition to specific mercury-reduction efforts, increased use of the Bio-P process to meet phosphorus effluent limits at municipal treatment plants in the state is expected to further decrease mercury discharges. Industrial facilities in the state account for less than 2 lb of mercury water releases per year. The MPCA sought stakeholder recommendations on strategies to ensure that facilities in the state remain below the annual allowable load and to guide permitting of new and expanding wastewater discharges.
3.1 Permitting Strategy
Since current point-source water discharges in the state are below the 24 lb annual allowable load established in the TMDL (by approximately 9 lb/yr), the TMDL allows for some growth due to new facilities or expansions at existing facilities. Stakeholders recommended a strategy for distributing the unallocated load to new and expanding facilities. Provided facilities are implementing a mercury-minimization plan and monitoring effluent and meeting effluent limits, allocations are made by the MPCA on a first-come, first-served basis through permit issuance. In addition, stakeholders recommended that all permitted municipal wastewater-treatment facilities with design flow of 0.2 million gallons per day or more be required to implement a mercury minimization plan. The intent of this requirement is to reduce mercury in municipal plant influent. The MPCA revised its water permitting strategy to include stakeholder recommendations. The MPCA fact sheet describing this strategy, Permitting Strategy for Addressing
Mercury in Municipal and Industrial Permits is included as Appendix 3. (See www.pca.state.mn.us/publications/wq-wwprm1-16.pdf on the MPCA Web site for the most recent version of this fact sheet.) The fact sheet describes how the MPCA will address mercury during the permitting process and ensure that facilities in the state remain below the annual allowable load.
3.2 Dental Clinic Discharges
Dental clinics are major contributors of mercury to municipal wastewater-treatment plants due to the presence of mercury in amalgam fillings. Dental clinics are typically included by municipal wastewater-treatment plants in mercury-minimization planning described above.

8
Extensive work at the state’s two largest wastewater-treatment plants has been successful in reducing releases from clinics. Metropolitan Council Environmental Services (MCES), operator of the largest plant, developed a voluntary program with the Minnesota Dental Association (MDA) to facilitate installation of amalgam separators, filtration units that remove 99% of mercury solids from dental clinic wastewater. Nearly all dentists in the MCES service area have voluntarily installed amalgam separators. The program also includes best practices for minimizing mercury releases from preparation and handling of mercury-containing dental amalgam. In 2007, the MPCA signed a memorandum of understanding (MOU) with the MDA to expand the voluntary program statewide and included air release goals and prevention strategies. As part of mercury-minimization planning, municipal wastewater facilities in the state are working with dentists to implement the elements of the MOU pertaining to wastewater discharges. The MOU establishes a goal of installing amalgam separators at every dental clinic and adherence to established best practices. A copy of the MPCA-MDA agreement is included as Appendix 4.
3.3 Implementation for Nonpoint Water Sources
Because mercury in runoff is derived from atmospheric deposition, mercury in stormwater is accounted for in the calculation of the atmospheric load. Separate strategies for reducing nonpoint sources are not included in this plan because implementation of the strategies in section 4 to reduce air deposition will ultimately reduce stormwater loading. Any efforts to reduce soil erosion will tend to reduce mercury entering a lake or river from nonpoint water sources. Many of these practices are already employed for control of sediment and nutrient loading and will result in reducing mercury loading to surface waters.

9
4. Air Implementation Strategies
The mercury TMDL established that 99% of the mercury contaminating Minnesota’s surface water is attributed to air deposition, mostly emitted outside of the state. Human-caused deposition is to be reduced by 93% from 1990 levels to meet the TMDL target. Consequently, implementing the TMDL means reducing air emissions from all anthropogenic sources that deposit in Minnesota by 93%. Since some of this mercury originates from sources inside the state, the TMDL established a final emission goal of 789 lb/yr from Minnesota sources. Figure 1 shows sources of mercury deposition to Minnesota as well as sources of emissions in the state. This section describes strategies the MPCA will employ to ensure that mercury emission sources in Minnesota reduce emissions to meet TMDL-established targets by 2025. As described in Section 2, the MPCA intends to use the full range of its program capabilities and authorities to implement the measures necessary to meet the goals contained in Minnesota. With respect to air emissions sources, this includes using its general authority provided by Minnesota Statutes 116.07 Subd. 4a. This section describes planned rule-making to implement reductions, the air permitting authority, compliance measures as well as employing assistance, outreach and collaboration on voluntary reductions for certain sources. The MPCA divides mercury air emissions from man-made sources in the state into three major categories: (1) emissions related to energy production, (2) emissions due to the purposeful use of mercury in products, and (3) emissions incidental to material processing, mostly taconite. For 2005, the MPCA estimates annual mercury releases of 3,314 lb, with 56% of this from energy-related sources, 21% from products, and 22% from taconite processing. The remaining 1% of emissions is due to other sources that do not fit into these three major categories. Within the major categories, the MPCA estimates releases from individual point sources and specific product-related uses, which are classified into 34 subcategories, referred to in this document as “source categories.” For instance, two source categories within the major category of Energy Production are Coal-fired Electric Utilities and Coal-fired Commercial, Institutional and Industrial Boilers. Some source categories within the major category of Purposeful Use of Mercury are Volatilization from solid waste collection and processing, Cremation, and Shredders and smelters that recycle cars and appliances. Minnesota’s mercury emissions inventory, Estimated Mercury Emissions in
Minnesota for 2005 to 2018, lists current and projected emissions from all 34 subcategories, including estimates for many individual sources within each subcategory. This list is included as Appendix 5.

10
Figure 1.
Stakeholders convened by the MPCA to recommend strategies identified emission-reduction goals for a majority of the emission source categories in the state. Interim and final reduction deadlines were also established. The year 2025 is the final deadline to achieve the emission level of 789 lb/yr from all sources in Minnesota. Some source categories have an earlier target of 2018 to meet their final reduction goal. The MPCA, with this implementation plan, has adopted the stakeholder-identified strategies as well as interim and final lb/yr reduction targets for certain source categories. These strategies and targets are summarized in Table 2. The full strategies are contained in the Strategy Framework for Implementing Minnesota’s Statewide Mercury TMDL, included as Appendix 1. Source categories not assigned reduction targets were deemed to be already well controlled (e.g., municipal waste combustion) or emitting minute quantities (e.g., natural gas combustion). For the purpose of implementing the strategies to meet the final emission targets, the MPCA has grouped sources based on their current regulatory status and type, including sources with an MPCA air emission permit, specific facilities that currently are not required to obtain an MPCA air permit, and product-related sources.
4.1 Air Emission Sources with MPCA Air Permits
This plan describes implementation strategies to reduce emissions from six source categories that are required to obtain an MPCA air emission permit:
• Coal-fired Electric Power Generation

11
• Industrial, Institutional and Commercial Boilers (coal- and wood-fired)
• Petroleum Refining (including releases from consumption of petroleum products)
• Electric Arc Furnaces (Secondary Smelters)
• Ferrous Mining and Processing
• Sewage Sludge Incineration For these sources, the MPCA is developing rules that will require the facilities to prepare and submit a plan showing how they will reduce their emissions to meet the reduction targets outlined in the Strategy Framework. The MPCA will incorporate reduction plans in facility permits and make implementation of the plan a condition of the permit. Compliance with the terms of the plan therefore will be accomplished through permit enforcement. The MPCA may also use other enforceable documents, such as compliance agreements or administrative orders, to compel the reductions outlined in the facility’s plan. In January 2009 the MPCA notified potentially affected sources and other stakeholders of its intent to adopt reduction-planning rules. In June 2009 the MPCA published a request for comments on these planned new rules. While the rule-making process will formally establish deadlines, the preliminary notice established January 2011 as the due date for reduction plans required by the rule. This deadline applies to industrial, institutional and commercial boilers; petroleum refineries, an electric arc furnace, and a sewage sludge incinerator that are subject to reductions in the Strategy Framework. Some facilities will have later due dates, as specified in the Strategy Framework:
• Black Dog Units 3 and 4 (plan due date 2015)
• Hoot Lake Units 2 and 3 (plan due date 2015)
• Austin Northeast Unit 1, Laskin Units 1 and 2 (plan due date 2020)
• Ferrous mining and processing facilities will submit reduction plans by 2016. Certain facilities will be exempt from the plan-development requirement because they are subject to other requirements. For example, reduction plans for units at the Sherco, Boswell and Black Dog power plants are specified in the Mercury Reduction Act of 2006. Some facilities, such as industrial boilers, may be affected by pending federal rule-making or other federal requirements prior to their source category deadline. If federal requirements result in reductions consistent with the reductions specified in this plan, then facilities in the source category would not be required to submit plans as stated herein. The rule being developed by the MPCA will specify guidelines for plan submissions. The plans will most likely detail the control technologies, operational changes, or prevention strategies the facility will evaluate to reduce emissions in a manner that will result in the source category meeting its reduction target.

12
Each affected facility is expected to reduce its emissions in proportion to the source category’s reduction target or propose a plan that shows how emissions from the category will not exceed the ultimate target. Acceptable plans may include:
• a plan showing a reduction from a single facility in proportion to the source category goal;
• a joint plan with one or more facilities, showing that the combined emissions from these facilities will reduce in proportion to the source category goal; and
• an agreement with one or more facilities showing that the combined emissions from each of the facilities will reduce in proportion to the source category goal.

13
Table 2. Summary of Mercury Air Emission Reduction Strategies and Targets 2005-2025
Emission Source Categories
Reduction Strategy Summary*
Est. Annual Mercury Emission and Targets (lb)
Source Reduction
2005 2018 2025
Source Categories with MPCA Air Permit
Coal-fired Electric Generation
70-90% reduction at all units greater than 5 lb/yr by 2025, mostly sooner
1,716 294 235 1,481 lb/yr, 86%
Industrial, Institutional, Commercial Boilers
70% reduction at all units emitting more than 2 lb/yr
71 33 33 38 lb/yr, 54%
Wood Combustion at Industrial Boilers
70% reduction at all units emitting more than 2 lb/yr
31 14 14 17 lb/yr, 55%
Petroleum Refining 50% reduction by 2018, improved
mass balance 13 7 7 6 lb/yr, 46%
Petroleum Product Utilization
50% reduction by 2018, improved understanding of fate
27 15 15 12 lb/yr, 44%
Smelters & Shredders That Recycle Cars & Appliances
Reduce emissions to 10 lb by 2025, conduct testing and mass balance at largest facility.
139 20 10 129 lb/yr, 93%
Ferrous Mining/Processing
75% reduction (from 2010 estimates) by 2025, research and reporting
735 841 210 525 lb/yr, 71%
Sewage Sludge Incineration
90% control at sole uncontrolled facility
9 6 6 3 lb/yr, 33%
Specific Facilities/Source Categories Without MPCA Air Permits
Recycling Mercury from Products in Minnesota
Reduce emissions to 8 lb by 2018, conduct mass balance
65 8 8 57 lb/yr, 88%
Mercury Product Manufacturing in Minnesota
Reduce emissions to .3 lb by 2025, quantify current emissions
42 13 0.3 42 lb/yr, 99%
Cremation Reduce emissions to 32 lb by 2025,
improve estimates 80 63 32 48 lb/yr, 60%
Dental Preparations Reduce emissions to 5 lb by 2025,
improve estimate 62 10 5 57 lb/yr, 92%
Product-related Sources
Sale, Use & Disposal of Mercury-containing Products
Various strategies to improve end-of-life management and decrease use
235 88 88 150 lb/yr, 64%
Emissions from Other Sources
Sources not addressed by reduction strategies
89 68 71 1 lb/yr, 20%
Total 3,314 1,464 734 2,580 lb/yr, 78%
* The full strategies are contained in the Strategy Framework for Implementing Minnesota’s Statewide Mercury TMDL, included as Appendix 1. Reduction percentages are from estimated 2018 levels (unless noted) and are listed to explain the basis for the target. The final target is lb/yr, not a percent reduction.

14
Mercury Emissions Reduction Implementation for Ferrous Mining and Processing
The ferrous mining and processing industry, including the six existing taconite producers, Essar Steel, and Mesabi Nugget has set a target of reducing mercury air emissions to 210 lb/yr by 2025 from all plants collectively. This would result in an estimated reduction in mercury emissions of 631 lb/yr. However, plant-ready mercury-reduction technology does not currently exist for use on taconite pellet furnaces. Therefore, achieving the mercury-reduction target will initially focus on research to develop the technology in the near term and installation of mercury-emission-control equipment thereafter. The Strategy Framework presents a schedule for implementing strategies to reduce emissions including conducting research into potential taconite reduction strategies; evaluating findings; conducting short-, medium- and long-term tests; and optimizing and implementing technologies. To oversee this process, the ferrous mining and processing industry will create and maintain a mercury-emissions-reduction research and implementation council. This council will have possible representation from the industry, academia, the Minnesota Department of Natural Resources (DNR), the MPCA, electric utilities, and technical research entities with expertise in metallurgy, material processing, and emissions control. Its mission will be to provide guidance for timely technology development and installation of mercury-emission control technology in the taconite industry. This council is being organized in 2009 and will meet periodically throughout the implementation phase. Progress reports will be provided to the TMDL Implementation Oversight Group described in section 2.1. The ferrous mining and processing industry emission-reduction target is not intended to include new or expanding nonferrous mining and processing facilities. These facilities will be addressed under 4.5 Emissions from Potential New and Modified Sources.
4.2 Specific Facilities/Sources Without MPCA Air Permits
The Strategy Framework includes reduction targets for four types of facilities that are not currently required to obtain MPCA air-emission permits. These include facilities that recycle mercury-containing products, facilities that manufacture mercury-containing products, crematoria, and dental clinics. Since the confidence in emission estimates for these facilities is low, the Strategy Framework also called for improving understanding of emission levels through mass balance and potentially monitoring. During 2009 and 2010, the MPCA will work with these facilities to better quantify emissions and identify best practices for reducing emissions. These facilities will then be expected to implement measures to meet interim and final reduction goals. The MPCA and stakeholders will review progress in meeting goals in 2013 and consider whether additional requirements, including rules or other regulation, are needed to ensure that 2018 reduction targets are met.
Source Category-specific Information and Approaches
Mercury Product Recycling Facilities: Three facilities in Minnesota process mercury-containing products, such as fluorescent lamps, for recycling. The MPCA currently regulates these facilities by means of a hazardous waste Compliance Agreement. The current agreement includes provisions for annual reporting of quantities of material

15
processed and recycled but does not discuss air emissions reporting. The MPCA is revising its approach to regulating these facilities and will incorporate reporting and activities to improve air emission estimates in the future. With improved air emissions estimates, the MPCA will work with these facilities to jointly develop best practices and other strategies to meet the emission-reduction target established in the Strategy Framework. Mercury Product Manufacturing: The MPCA does not currently regulate facilities in the state that manufacture mercury-containing products or components. The largest of the three known facilities currently estimates and reports emissions as part of federally required Toxic Release Inventory Reporting. The MPCA will work with these facilities to better quantify emissions and develop strategies to reduce emissions, including phase-out of mercury use. Crematoria: Approximately 50 crematoria operate in Minnesota under a license from the Minnesota Department of Health. No environmental provisions are associated with licensure or operation of these facilities although the MPCA has air-emission standards relating to smoke and odor (7011.1215 subp. 3). Based on preliminary analysis, the MPCA estimates that six facilities emit half of this sector’s 80 to 100 lb of emissions, based on the higher number of cremations at these facilities. Several of these higher-emitting facilities have agreed to assess emission levels, evaluate reduction strategies, and implement reductions. The MPCA will work with the facilities and the University of Minnesota Mortuary Sciences Department to identify possible reduction strategies, implement these strategies, evaluate progress, and explore further action, if needed. Dental Clinics: Several hundred dental clinics operate in the state, most of which install and remove mercury-containing dental amalgams. In 2005, the MPCA, with low confidence, estimated that these clinics combined release approximately 60 lb of mercury to the air each year. Through its existing MOU with the Minnesota Dental Association (described in section 3.2 and attached as Appendix 4), the MPCA will work with this sector to better quantify emissions and to identify best practices to reduce and ultimately prevent mercury releases.
4.3 Product-related Strategies
Stakeholder recommendations call for continued and enhanced efforts to reduce mercury-containing product releases through a variety of voluntary, educational and regulatory strategies. This includes improved end-of-life product management, product substitution, and product bans. Since the mid-1990s, the MPCA has been actively involved in product-reduction efforts and is considered a leader among state agencies working on this effort. Stakeholder recommendations cite the need for a shared responsibility for reducing mercury releases from products involving product end users, suppliers, retailers, manufacturers, waste-management entities, governments and others involved in the introduction, use, servicing and removal of mercury-containing products. Refer to pages 11-13 of the Strategy Framework in Appendix 1 for more details.

16
Given current resource constraints, the MPCA intends to prioritize the following areas during the next three years: improved compliance with existing product requirements; improved awareness of, and participation in, existing mercury-product collection programs; expanded mercury-product collection programs, extended producer responsibility for mercury-containing lighting; and improved removal of mercury-containing devices from scrap metal prior to shredding and smelting. Improved compliance with existing requirements. Minnesota has a comprehensive set of laws and other requirements that ban the sale of most mercury-containing products and require labeling of, and compel proper end-of-life management for, all products, including manufacturer involvement in the case of thermostats and relays. Over the next three years, resources permitting, the MPCA intends to pursue increased compliance with these requirements through increased outreach, assistance and enforcement. Increased participation in existing mercury-product collection programs. Publicly operated collection programs, retailers and private companies offer management programs for mercury-containing products, especially fluorescent lamps. The MPCA will continue work on several initiatives to improve recycling rates for lamps and other products. For example:
• Electric utilities that promote mercury-containing fluorescent lamps as energy-efficient lighting are required to provide information about the need to recycle lamps. The MPCA is working with utilities to ensure that this information is as user-friendly and comprehensive as possible.
• An extensive network of small hardware stores and a few larger retailers offer lamp recycling, often supported by electric utilities. The MPCA will work to improve public awareness of these programs and participation in them. One notable initiative is a “lamp stakeholder dialogue” coordinated by Great River Energy and the Center for Energy and the Environment (with grant support from the MPCA) that is intended to develop partnerships and funding commitments to increase the availability of convenient and low-cost, or free, recycling opportunities for compact fluorescent lamps (CFLs).
• Household hazardous waste (HHW) programs, operated by counties, serve citizens in all areas of the state, at least on a periodic basis. Most of these programs accept mercury-containing products or refer residents with fluorescent lamps to participate in utility-sponsored programs. The HHW programs are the principal channel for state and local governments to conduct outreach and education to the general public on mercury products, disposal prohibitions, and the availability of HHW and other recycling programs. The MPCA will work with counties to ensure that product disposal is readily available to all urban and rural residents of the state and encourage residents to segregate and properly dispose of mercury products.
• The Mercury-Free Zone (MFZ) Program has established a strong track record working with schools to phase out mercury-containing equipment and chemicals, and to locate areas contaminated by spills through the unique talents of Clancy, the mercury-detecting dog. Laws passed in 2007 require K-12 schools to remove and properly manage all mercury-containing equipment and chemicals by the end of
17
2009. It is expected that these requirements will spur strong interest on the part of many schools that have not yet taken advantage of the MFZ Program and MPCA staff expect to assist schools in removing mercury to comply with the law. Following the successful phase-out of mercury from schools, the program is also well-situated to provide similar assistance to laboratories (e.g., medical, scientific, engineering) and postsecondary educational institutions that may have mercury equipment and spill issues.
• Thermostat and relay recycling through manufacturer-supported programs: State law requires manufacturers of thermostats and relays to take certain responsibilities for managing their products at end of life. Thermostats and relays are generated primarily through the electrical, mechanical, and heating, ventilation and air-conditioning (HVAC) sectors. The MPCA will work with manufacturers and others to develop and conduct sustained outreach to sectors involved in installation, service and removal of these devices, including the sales chain, trade associations, contractors, unions and municipalities. HHW collection of HVAC thermostats will also be publicized further in partnership with HHW programs and others. Following a period of assistance, the MPCA will consider whether enforcement efforts are needed to ensure compliance with manufacturer take-back laws.
Improved removal of mercury-containing devices from scrap. Vehicles, domestic and commercial appliances, various types of industrial equipment, and other sources of secondary metal for smelting may have had mercury-containing devices, such as switches and pressure gauges, built in them. Unless removed, these devices release mercury when they are shredded, heated and melted to recover steel and other metals. The MPCA will work with this sector to develop a manual and training on the identification and removal of mercury devices with the goal of reducing releases. This is directly related to the Strategy Work Group’s recommendations for reducing emissions from shredders and smelters that recycle cars and appliances. Additional activities. Resources permitting, the MPCA may work on additional initiatives, including but not limited to the following examples:
• Mercury in Great Lakes shipping: Work with Lake Superior partners to identify and phase out mercury-containing devices used in the shipping industry.
• Elemental mercury clean sweeps: Identify and carry out elemental mercury clean sweeps for household, dental, educational facility, lab and other sectors. Partners will be identified and recruited.
4.4 Summary of Air Implementation Strategies for Existing Sources
Implementation of the strategies described in this section are expected to reduce annual mercury air emissions in the state from estimated 2005 emissions of 3,314 lb to 734 lb by 2025, a 78% reduction. Figure 2 presents a summary chart showing projected reductions from all sources. Emissions from energy production, largely coal-fired electricity generation, decrease substantially by 2015 due to requirements of 2006 Minnesota legislation affecting the states largest power plants. Other power plants in the state follow suit, resulting in an 86%

18
reduction in this source category by 2025. Product-related sources continue a steady decline due to decreased use and improved capture of retired products. Emissions from material processing are expected to be reduced after 2018, when the findings of ongoing research and testing are applied to sources in the ferrous mining and processing industry.. A 75% reduction from 2010 levels is expected by 2025 from the ferrous mining industry.
Figure 2.
4.5 Emissions from Potential New or Modified Sources
With successful implementation, the actions identified in this plan will reduce emissions from existing sources to less than 789 lb/yr by 2025. Between now and 2025, proposals for increased mercury air emissions from existing sources, as well as from new facilities, will come before the MPCA for consideration. Stakeholders acknowledged that increased emissions are expected, so they developed recommendations to the MPCA on a
Chart of Projected Mercury Emissions 2005-2025Based on Reduction Targets Established
by the Strategy Work Group
1,8581,661
500358 301
695
565
437
304
181
736
841
841
841
211
25
25
25
25
25
0
500
1,000
1,500
2,000
2,500
3,000
3,500
2005 2010 2015 2018 2025
YEAR
Me
rcu
ry (
po
un
ds
)
Difficult to Categorize
Emissions Incidental to Material Processing (mostly mining)
Largely Resulting from the Purposeful Use of Mercury
Incidental to Energy Production
TMDL goal of 789 lb
Hypothetical actual emissions.
Emission may rise temporarily
between goals. Reductions may
occur earlier than target date.

19
process to ensure that these new sources do not jeopardize the state’s ability to reach interim and final emission-reduction goals. To fully develop guidelines, the MPCA convened a subgroup of stakeholders subsequent to the completion of the Strategy Work Group’s recommendations. Together with this subgroup, the MPCA prepared guidance for new or modified existing mercury-emitting facilities and to guide MPCA decisions about allowing new or modified sources. The full guidance is attached as Appendix 6. A summary is provided below. These guidelines state that any new or modified mercury source will:
1. Employ the best mercury control available.
2. Complete environmental review as applicable, including evaluation of local and cumulative impacts per MPCA guidelines.
3. Provide an assessment of whether its added emissions will impede progress toward attaining air emission goals.
4. For new or modified facilities emitting more than 3 lb/yr (after applying best controls) the facility will offset those new emissions by arranging a reduction equal to the new emissions from existing sources in the state beyond those otherwise required in the reduction strategy for the existing sources.
5. If mercury reductions from an existing facility in Minnesota cannot be identified, a new or modified facility may propose alternative mitigation strategies in lieu of in-state air emission reductions.
The MPCA will strictly scrutinize source category and overall reduction targets. Increases due to a new or modified source should not jeopardize the specific source category’s ability to reach its interim and final annual air emission goals or the overall reduction goal. The MPCA intends to implement this policy on a trial basis for three to four years. Following the initial implementation of this guidance, the MPCA, with stakeholder input, will consider changes to these guidelines, including potential adoption of rules covering new and modified sources. An improved air inventory resulting from proposed rules for measurement and reporting (discussed in Section 5) will be prepared that may also affect policy discussions.
4.6 Out-of-state Sources
As noted in the Statewide Mercury TMDL and shown in Figure 1, about 90% of the mercury that is deposited on Minnesota originates as air emissions from sources outside of the state. While some of this mercury comes from naturally occurring sources, the MPCA estimates that the remaining sources of human-caused deposition are about evenly split between sources from within North America (mostly the United States) and the rest

20
of the world. To fully implement the TMDL, these sources too must reduce their contribution to Minnesota deposition by about 93% from 1990 levels. While the responsibility for reducing these out-of-state emissions lies with others and is not the focus of this implementation plan, stakeholder-recommended strategies call for the MPCA to work with other states’ environmental agencies, the EPA, other federal agencies, the Minnesota congressional delegation, and others as appropriate to establish policies to achieve emission reductions from sources in the United States and other countries. The objectives of this work shall be to establish policies and programs that result in significant emission reductions and consistency of policies among states and countries. This goal includes consistent policies among all U.S. states as well as international requirements, and the international transfer of successful technologies and programs.
National Efforts. To promote and support national mercury reductions, the MPCA will:
• Comment on federal proposals that have the potential to reduce national mercury uses and releases;
• Through the governor’s office, work with Minnesota’s congressional delegation to support enactment of legislation to reduce national mercury emissions.
• Collaborate with other states in our region to develop and implement mercury-reduction strategies. The MPCA has long worked with other Great Lakes states, and EPA Region V as well as Canadian counterparts on reducing mercury in the region. Most recently, the MPCA worked with other states in the region on the development of a regional mercury-added products phase-out plan facilitated by the Great Lakes Regional Collaboration and EPA Region 5. With these same partners, the MPCA is currently developing a regional mercury-air-emission reduction strategy.
• Actively participate in state environmental and media association groups seeking to reduce mercury releases, such as the National Governors Association, National Association of Clean Air Agencies, Environmental Council of States, Quicksilver Caucus, Association of State and Territorial Solid Waste Management Officials, Association of State and Interstate Water Pollution Control Agencies, and the National Pollution Prevention Roundtable.
Examples of recent and current involvement with these organizations include:
• National Association of Clean Air Agencies (NACAA): The MPCA participates on the NACAA air toxics committee and provides input to and comments on proposals for standards development. This committee has been very active in national strategy and policy development to reduce mercury emissions. Recently NACAA has addressed national regulations for several large mercury sources, including cement kilns, electric arc furnaces, industrial boilers, and utility boilers.
• Quicksilver Caucus: The Quicksilver Caucus is a coalition of state environmental agencies and state agency associations concerned about mercury. The Quicksilver Caucus is convened by the association of state environmental

21
department heads, the Environmental Council of States (ECOS). MPCA staff actively participates in Quicksilver Caucus activities. These activities include conducting mercury workshops for state agency staff and administrators, policy development with the EPA and other organizations, and program implementation. In a special ECOS effort to minimize releases related to mercury switches in vehicles, MPCA staff represents the states in the National Vehicle Mercury Switch Recovery Program a joint initiative with vehicle manufacturers, salvage yards and scrap processors, steelmaking facilities, and environmental organizations.
• Interstate Mercury Education and Reduction Clearinghouse (IMERC): The MPCA, along with the environmental agencies of 13 other states, is a member of IMERC, a center that collects and manages data on mercury product sales in the United States. Several state laws require manufacturers to report such data, which show a shift to mercury-free alternatives.
International Efforts. According to MPCA estimates, about 40% of human-caused deposition of mercury to Minnesota originates from sources outside of the United States. It is likely that this share will increase as regional sources decline and global emissions remain constant or grow, at least in the short term. The MPCA will continue to seek opportunities to provide input to international decisions and programs that have the potential to reduce these releases. Examples of current and future activities include:
• Lake Superior Binational Program: Since 1991, as called for in the Canada-U.S.
Great Lakes Water Quality Agreement, the Lake Superior Lakewide Management Plan (LaMP) has sought to reduce mercury emissions from the Lake Superior region. Along with Michigan, Wisconsin, Ontario, tribal groups, and the U.S. and Canadian federal governments, the MPCA actively participates in this program. Mercury releases in the Lake Superior basin have reduced by 71% since 1990. The MPCA is currently working with Lake Superior partners on reducing mining as a source of mercury emissions.
• Great Lakes Binational Toxics Strategy: GLBTS is a result of the “Canada-United States Strategy for the Virtual Elimination of Persistent Toxic Substances in the Great Lakes Basin,” signed April 7, 1997. The strategy includes a Mercury Reduction Challenge for each country. Public, private and nongovernment partners work together on a voluntary basis to achieve the reductions. MPCA participates in the GLBTS Mercury Workgroup.
• North American Regional Action Plan for Mercury: The governments of the United States, Canada and Mexico jointly developed a comprehensive regional action plan for reducing mercury in North America. MPCA staff have been involved in implementing this strategy since its development in 1999 and as a member of the North American Mercury Task Force since 2004.
• Quicksilver Caucus (QSC) International Mercury Work Group: MPCA staff actively participate in the QSC’s international work group. This group has provided input to the U.S. State Department and the EPA in advance of international negotiations addressing mercury globally. At a meeting convened by the United Nations Environment Programme (UNEP) in February 2009,

22
environment ministers from around the world agreed to negotiate a treaty on international mercury reductions. UNEP’s Mercury Programme also coordinates mercury-reduction partnerships that seek to build developing countries’ capacity to address mercury, and to transfer technology to reduce releases. The QSC has formed the State Resource Network to offer state assistance to the EPA as the United States engages in this effort. More information on the UNEP’s Mercury Programme can be found at www.chem.unep.ch/mercury.

23
5. Monitoring and Evaluation Plan Over the course of the TMDL implementation period, the MPCA will use mercury-release measures and environmental-response indicators to evaluate the effectiveness of this plan in meeting the goals established in the TMDL. To track progress in reducing and minimizing releases by sources in Minnesota, the MPCA will compile individual facility-reported release data and estimate total releases of mercury to the air and surface water. In addition, the MPCA will track two key environmental response indicators, mercury deposition and fish tissue concentrations, to evaluate progress. Resources permitting, the MPCA will also perform or oversee additional research, monitoring and assessment in support of the mercury TMDL implementation. The MPCA will periodically summarize mercury releases, key environmental response indicators, and the findings of additional research, monitoring and assessment.
5.1 Air Emissions
To track progress in meeting the statewide air emission target of 789 lb/yr, the MPCA will work with sources to estimate facility-specific emissions of mercury to the air. The MPCA will periodically prepare an inventory that quantifies emissions by type and provides a statewide total of estimated emissions. Currently, only two source categories are required to report mercury emissions to the MPCA: incinerators and electrical generating units that emit more than 3 lb/yr. For all other facilities, the MPCA estimates emissions using emission factors based on activity information or fuel consumption data provided by the facilities. To improve the accuracy of the state’s emission inventory and allow for more precise tracking of progress in reaching the TMDL emission target of 789 lb, stakeholders recommended that emission sources take steps to improve estimates and report emissions to the MPCA annually. The MPCA is in the process of adopting rules to require annual reporting from all mercury-emitting facilities in the state starting in 2011, with improved verification of emission factors. The rule-making process will establish source-category-specific emission-reporting guidelines, including methods for determining emissions and frequency of emission factor verification. A minimum reporting threshold will also be considered. Rules are expected to be adopted by the end of 2009 and to first apply to the reporting of emissions for the 2010 calendar year. While reporting is expected annually, the MPCA will publish a comprehensive mercury emissions inventory of estimated statewide emissions every three years, as part of the Air Toxics Inventory. This triennial inventory will include MPCA estimates for facilities that are below any minimum reporting threshold.

24
The next Air Toxics Inventory for Minnesota will be completed in 2010 and will include mercury emission estimates for 2008. The first comprehensive inventory prepared by the MPCA that incorporates facility-reported data required by proposed rule-making will be in 2013, based on 2011 emissions. Subsequent inventories will be prepared every three years. The MPCA will compile annual updates in the interim years, but these updates will not include emissions from facilities that emit less than a minimum reporting threshold to be determined during the rule-making process. The schedule for preparation of comprehensive triennial reports is shown below in Table 3.
Table 3. Schedule for Preparation of Triennial Mercury Emissions Inventory
5.2 Municipal and Industrial Wastewater Discharges
As discussed in section 3, the TMDL established a cap on point-source water discharges in the state (the state’s waste load allocation of 11 kg, or 24.31 lb, per year). Current point-source water discharges in the state, mostly from municipal wastewater-treatment plants, are below that level by approximately 9 lb/yr, thus allowing for some growth. This difference is referred to as the “unallocated load.” A strategy to distribute this unallocated load to new and expanding sources is discussed in section 3.1. To ensure that mercury discharges are not approaching the 24.31-lb annual limit, the MPCA will track increased loading from new and expanding sources. In addition, the MPCA will periodically estimate combined mercury discharges from all water point-source discharges in the state (based on effluent monitoring required for facilities with design flow of 0.2 million or more gallons per day) and compare the total to the waste load allocation. The MPCA will prepare this estimate at least every three years starting in 2010.
5.3 Environmental Response Indicators
The MPCA will use two key response indicators to track environmental mercury in Minnesota: mercury deposition and mercury concentration in fish tissue. Since much of the mercury that contaminates Minnesota originates from outside the state, these indicators are not avenues to evaluate Minnesota’s air and water release strategies
Emission Year Facility Reporting Year MPCA Inventory Published
2008 2009 2010
2011 2012 2013
2014 2015 2016
2017 2018 2019
2020 2021 2022
2023 2024 2025
2026 2027 2028

25
described in this plan, but rather a way to track progress in reducing overall mercury pollution in Minnesota and the ecosystem response of mercury bioaccumulation in fish.
Deposition Monitoring. Since most of the mercury contaminating fish in Minnesota enters watersheds as wet or dry deposition from the atmosphere, a key indicator of progress in reducing fish contamination is the amount of mercury deposited in the state. Wet deposition, the mercury in rain and snow, is relatively easy to measure. The MPCA currently operates five wet-deposition-monitoring sites in Minnesota, part of a North American network. As yet, there is no accepted protocol for the routine measurement of dry deposition of mercury, which is of similar magnitude as wet deposition. Minnesota’s TMDL deposition goal is based on total mercury — wet plus dry. Wet deposition data should be a reliable indicator of progress in reducing total mercury deposition, assuming that wet and dry are correlated. For the baseline year of 1990, the total wet plus dry mercury deposition to the state was estimated as 12.5 micrograms per square meter ( g/m2), based on lake sediment cores. The deposition goal in the TMDL is an annual total mercury deposition of 4.4 g/m2. At that rate, MPCA scientists calculate that concentrations of mercury in key indicator fish species will be reduced to target levels. The MPCA periodically compiles wet deposition data and will track changes over time as an indicator of progress in reducing mercury contamination of fish. At longer intervals, the MPCA will evaluate trends in total mercury deposition through lake sediment cores. Sediment core data have the advantage of quantifying total mercury deposition, but are not suitable for frequent data production because of the significant effort involved and because the sediment matrix naturally averages deposition over a number of years. The MPCA estimates that it would take about two years of work to update the 1990 baseline that was based on sediment cores. It would be desirable to complete such an evaluation as part of the benchmarking to be reported in 2013.
Fish Contaminant Monitoring. The ultimate indicator of effectiveness of the Statewide Mercury TMDL is mercury concentrations in fish in Minnesota lakes and rivers. In partnership with the three other Minnesota state agencies, the Departments of Natural Resources, Health, and Agriculture, the MPCA participates in Minnesota’s Fish Contaminant Monitoring Program. This program routinely monitors fish for mercury and other contaminants. Most of Minnesota’s larger lakes and many smaller lakes, as well as river segments, are assessed.
Data from the Fish Contaminant Monitoring Program are used to determine whether waters in the state are impaired, and the list of impaired waters is submitted to the EPA every two years. During the implementation of the Statewide Mercury TMDL, fish contaminant concentrations will continue to be monitored. With successful implementation, mercury concentrations are expected to drop to a level that would allow for the lake or river to be removed from the list of waters classified as impaired due to

26
mercury contamination, although reductions in fish concentrations may lag behind reductions in atmospheric deposition because of temporary storage of mercury in watershed soils. While the state’s Fish Contaminant Monitoring Program measures mercury in a variety of species, Minnesota’s Statewide Mercury TMDL uses walleye and northern pike as indicator species. The TMDL’s final implementation goal is based on achieving mercury concentrations of 0.2 mg/kg, or parts per million (ppm), in 90% of standard-length specimens. The MPCA will continue to assess long-term trends in these species as an indicator of TMDL progress. A review of updated trends data is planned for 2013.
5.4 Additional Monitoring and Assessment
In addition to tracking air emissions, water discharges, deposition, and fish-tissue concentrations, the MPCA performs additional research, monitoring and assessment in support of the mercury TMDL implementation. Ongoing activities and specific issue investigations are summarized in the Monitoring and Assessment Program for Minnesota’s Mercury TMDL Implementation (MAP-Hg), which is provided as Appendix 7. Goals of the activities described in the MAP-Hg include better understanding the sources of mercury pollution in Minnesota and the conditions that exacerbate fish contamination, including land and water use. Resources permitting, the MPCA will continue ongoing programs and prioritize issues for investigation that aid in assessing effectiveness of this implementation plan. Two issues pertinent to TMDL implementation include the effect of sulfate concentrations and water level fluctuations on methyl mercury formation. Sulfate. Since most mercury methylation is accomplished by bacteria that consume sulfate under anoxic conditions, any human activity that increases sulfate in surface water (especially wetlands and lakes) has the potential to increase fish contamination. Sulfate concentrations can be increased by acid rain, the use and discharge of groundwater, disturbing sulfur-bearing geological deposits, wastewater discharges, and fluctuating water levels. When water levels decline, sulfur compounds stored in sediment and peat are exposed to oxygen in the air and sulfate (SO4) can form, which later readily dissolves when water levels eventually rise. Water Level Fluctuations. As noted above, fluctuations in water level can release sulfate and thereby increase the methylation of mercury. Creation of impoundments, or reservoirs, also has the well-known effect of increasing mercury contamination of fish for several decades, probably through a number of synergistic effects. Creation and operation of a reservoir can not only increase sulfate concentrations, but also inundates soil, which is a major storage site for mercury in the environment, and also terrestrial plant material, which serves as an energy source for the sulfate-reducing bacteria. Mercury methylation is highest when these three ingredients are plentiful: organic matter, mercury and sulfate.

27
Water levels are not only affected by natural variations in weather, but by land use (e.g., development of impervious surfaces or subsurface tiling), stormwater design, impoundment operation, pump-out of mines, and water withdrawals (e.g., for irrigation, cooling and other uses). It is becoming clear that climate change is also affecting water levels by changing the intensity of precipitation — even if overall precipitation is not changing, it appears that more summer precipitation is occurring as larger rain events, interspersed with longer dry periods, the combination of which causes more fluctuation in water levels.

Appendix 1
Strategy Framework for Implementation
of Minnesota’s Statewide Mercury TMDL


STRATEGY FRAMEWORK FOR IMPLEMENTATION
OF MINNESOTA’S STATEWIDE MERCURY TMDL
PREPARED FOR
THE MINNESOTA POLLUTION CONTROL AGENCY
BY THE
MINNESOTA ENVIRONMENTAL INITIATIVE
JULY 7, 2008
CFMS CONTRACT NO. A99751
wq-iw1-19

2
STRATEGY FRAMEWORK FOR IMPLEMENTATION
OF MINNESOTA’S STATEWIDE MERCURY TMDL
CONTENTS
Introduction 2
Strategies to Reduce Air Emissions 6
Strategy for New and Expanding Sources of Air Emissions 20
Strategy to Distribute Unallocated Point-source Waste Load 22
Other Recommended Actions 24
Strategy Framework Implementation 26

3
INTRODUCTION In March 2007, the U.S. Environmental Protection Agency (U.S. EPA) approved Minnesota’s Statewide Mercury Total Maximum Daily Load (TMDL). To achieve the goals of the approved TMDL, the Minnesota Pollution Control Agency (MPCA) is required to develop a detailed implementation plan. Between April 2007 and June 2008, the MPCA contracted with the Minnesota Environmental Initiative (MEI) to convene a stakeholder process to develop specific recommendations for the state’s implementation plan. The result of the stakeholder process is the following Strategy Framework, which includes five major elements:
• Strategies and timelines for reducing air emissions that will meet the air emissions goal of 789 lb per year by 2025.
• Guidelines for water point-source discharges to ensure that total statewide mercury discharges remain below 24.2 lb per year.
• A process for addressing new and expanding sources of air emissions.
• A set of other recommended actions supported by the stakeholder groups.
• Detailed recommendations for implementation of the strategy framework. The work of the stakeholder groups was focused on specific criteria developed by the MPCA. It included the development of strategies for limiting mercury releases to air and water from Minnesota sources, including timetables and sector targets as well as decisions on how to accommodate possible new sources of releases to the state’s environment. Specific elements of the Mercury TMDL Implementation Plan to be developed by the stakeholders included:
1. Recommended strategies and guidelines for water point source discharges to ensure that total statewide mercury discharges remain below 24.2 lb (11 kg), per year including:
• How to address existing sources as well as new and expanding sources. (this is most likely a permitting strategy/guidelines)
• How to allocate future reserve capacity of 8.8 lb (4 kg) among municipal and industrial sectors.
• How to account for chemicals or conditions that impact methylation including sulfate discharges to mercury-impaired waters.
• Mercury minimization plan guidance for municipal wastewater treatment plants (considers adoption of EPA Region V guidance, other state’s guidance or propose alternative).
2. Recommend strategies and timeframes for meeting the TMDL air emission goal of 789 lb annual emissions from Minnesota sources, including:
• Establish air emission sector reduction targets for emissions from energy, taconite and product-related sectors.
• Develop sector-specific strategies to meet the overall and sector goals.

4
• Develop interim and final timeframes for the sector and overall goals.
• Determine how to accommodate potential new sources of air emissions. (Inform development of guidelines/rules that will closely follow this process.)
3. The stakeholder-developed TMDL Implementation elements were required to meet the following criteria:
• Must demonstrate that point source discharge cap of 24.2 lb (11 kg) per year will be met and air emission goal of 789 lb per year will be achieved in a reasonable time frame.
• Demonstrated commitment of a stakeholders to support and implement recommendations.
• Meet Clean Water Act and related federal and state regulations and guidance.
The sector-based strategies developed by the stakeholder groups were based on emissions and discharge data compiled by the MPCA. Specific air emissions data and projected sector-based reductions are summarized in the following table, and are shown in the attached chart.

5
Projected Mercury Emissions After Adoption of Reduction Strategies
Sector/Category
Estimated
2005
Emissions
(lb)
Projected
2018
Emissions
(lb)
Projected
2025
Emissions
(lb)
Incidental to Energy Production
Electric utility- coal 1,716.0 294.0 235.0 Industrial - coal 71.3 33.0 33.0
Volatilization from coal ash 0.0 0.0 0.0 Petroleum refining 12.9 7.4 7.0
Petroleum product utilization 27.1 15.0 15.0 Wood combustion 30.5 14.0 14.0
Biomass other than wood 0.0 2.1 2.1 Natural gas combustion 0.3 0.3 0.3
Subtotal 1,858.1 365.4 306.4
Largely Resulting from the Purposeful Use of Mercury
Proportional to Hg content of Solid Waste
Volatilization: solid waste collection & processing 169.0 69.3 69.3 On-site household waste incineration 40.0 5.0 5.0
Volatilization from spills & land dumping 24.0 12.0 12.0 Landfill volatilization 2.1 1.6 1.6
Volatilization: land application of compost 0.2 0.1 0.1 Proportional to Hg content of Liquid Waste
Volatilization: land application of sludge 1.6 1.0 0.8 Recycling Activities
Smelters and shredders that recycle cars and appliances 138.7 20.0 10.0 Recycling mercury from products within Minnesota 65.0 8.0 8.0
Non-ferrous metal recycling (Al, Pb) 0.9 1.1 1.1 Dental Mercury
Dental preparations 62.4 10.0 5.0 Cremation 80.0 63.0 32.0
Incineration
Municipal solid waste combustion 49.2 38.3 38.3 Sewage sludge incineration 8.5 6.0 6.0 Medical waste incineration 0.4 0.7 0.8
Hazardous waste incineration 0.3 0.3 0.3 Class IV incinerators 0.0 0.0 0.0
Mfg. & Use of Non-dental Mercury-containing Products
Mercury product manufacturing in Minnesota 42.0 13.0 0.3 General laboratory use 10.0 3.6 1.0
Volatilization from dissipative use 0.8 0.5 0.4
Subtotal 695.1 253.5 192.0
Emissions Incidental to Material Processing
Taconite processing 734.8 840.6 210.0 Thermal treatment of soil 0.8 0.8 0.8
Subtotal 735.6 841.4 210.8
Difficult to Categorize
Asphalt manufacturing 4.3 4.3 4.3 Agriculture, food, & kindred products 1.1 1.1 1.1
Mineral products 13.8 13.8 13.8 Miscellaneous industrial processes 0.2 0.2 0.2
Wood, pulp & paper, & publishing products 5.1 5.1 5.1
Subtotal 24.6 24.5 24.6
GRAND TOTAL 3,313.4 1,484.8 733.8

6

7
STRATEGIES TO REDUCE AIR EMISSIONS
Coal-fired Electric Power Generation
Emission Goal: Reduce sector emissions to 235 lb Timeline: Achieved by 2025 Interim Emission Goal: Reduce sector emissions to 294 lb Interim Timeline: Achieved by 2018 Description:
Mercury Reduction Plan Development The following coal-fired electric generating units will file with the MPCA by 2012 a mercury emissions reduction plan that is most likely to result in the removal of at least 90% of the mercury emitted from the each unit or an equivalent reduction by the end of 2014:
Sherco Units 1, 2 and 3
Clay Boswell Units 3 and 4
Allen S. King Unit 1 The following electric generating units are currently involved in voluntary mercury reduction projects that are most likely to result in the removal of at least 70% of the mercury emitted from each unit or an equivalent reduction by the end of 2009:
Taconite Harbor Units 1, 2, and 3
High Bridge Units 5 and 6
Riverside Units 6, 7, and 8 (Because the units at High Bridge and Riverside are being switched to natural gas, thus eliminating the corresponding mercury emissions, the cumulative emission reduction from this group of ten units is just over 90%, despite the fact that the overall emission-reduction goal is 70%.) The following electric generating units will be required to file with the MPCA by 2015 a mercury emissions reduction plan that is most likely to result in the removal of at least 90% of the mercury emitted from the each unit or an equivalent reduction:
Black Dog Units 3 and 4 Emissions from Black Dog Units 3 and 4 will be validated and reported to the MPCA using a method and frequency approved by the MPCA by 2018.

8
The following electric generating units will be required to file with the MPCA by 2015 a mercury emissions reduction plan that is most likely to result in the removal of at least 70% of the mercury emitted from each unit or an equivalent reduction by 2025:
Hoot Lake Units 2 and 3 Emissions from Hoot Lake Units 2 and 3 and Taconite Harbor Units 1, 2 and 3 will be validated and reported to the MPCA using a method and frequency approved by the MPCA. The following electric generating units will be required to file with the MPCA by 2020 a mercury emissions reduction plan that is most likely to achieve the removal of 70% of the mercury emitted or an equivalent reduction by 2025:
Austin Northeast Unit 1
Laskin Units 1 and 2 Emissions from Austin Northeast Unit 1 and Laskin Units 1 and 2 will be validated and reported to the MPCA using a method and frequency approved by the MPCA. De Minimis Units Any electric generating unit within the state of Minnesota that emits less than 5 lb per year of mercury (de minimis threshold) will be excluded from any emission control requirements as long as emissions remain less than 5 lb per year. All electric generating units that emit less than 5 lb per year must:
1. Conduct initial baseline testing using a method approved by the MPCA to verify that the emission rate meets the de minimis threshold.
2. Re-validate emissions testing on a frequency specified by the MPCA.
3. Report to the MPCA annual mercury emissions based on methodology approved by the MPCA.
4. If a change is made that increases mercury emissions above the de minimis threshold, then offsets must be acquired from other sources within the state for the amount of mercury emitted in excess of the de minimis threshold or excess mercury above the de minimis threshold must be removed.
Industr ia l , Commercia l , Inst i tut ional Boi lers
Emission Goal: Reduce sector emissions to 33 lb Timeline: Achieved by 2018 Description:
Follow recommendations of anticipated federal industrial boiler Maximum Achievable Control Technology (MACT) standards, anticipated in approximately 2012. If federal

9
standards do not require at least 70% control, then improve overall particulate matter capture and/or apply activated carbon injection on all electrostatic precipitation or fabric filter industrial, commercial, and institutional coal-fired controlled units where existing mercury emissions are greater than 2 lb per year or emissions control is not at least 70% (utility units excluded). Review federal MACT standards impacts in 2016 to determine if further controls are needed to achieve at least 70% reduction in sector. This strategy assumes industrial coal-fired boilers can be controlled by an additional 70% over 2018 baseline. No control assumed for biomass.
Petroleum Ref ining Emission Goal: Reduce sector emissions to 7 lb Timeline: Achieved by 2018 Description:
Phase I – Data Gathering and Analysis Sources will update and submit mercury mass balance testing for their refineries to the Minnesota Pollution Control Agency by December 31, 2009. The mass balance will be developed using currently accepted sampling and analytical methods. The mass balance will include a discussion in the report of product distribution trends within the state toward the goal of revising initial MPCA inventory assumptions that all unaccounted for mercury is in refinery products or by-products and is released in the state to the air. Sources will review their refinery process every two years after the 2009 update for possible changes that would have the effect of significantly altering the mass balance. Sources will submit each review to the MPCA. If in the future, sources determine that the level of mercury emissions from their refinery is somewhat stable, they will at that time propose a review timeline to the MPCA that better fits the variability of the data (e.g., every five years). Phase II – Adaptive Reduction Strategy Industry proven technology does not currently exist for removing mercury from crude oil or liquid fuels and technology to remove air emissions from the refinery point sources is likely economically infeasible. Therefore, achieving a mercury reduction goal will rely on the use of an adaptive strategy. If sources identify a cost-effective and industry-proven option for reducing mercury from the facility’s air emissions through discoveries made during the mass balance reassessment, sources would implement that option to achieve a goal of 50% facility air emission reduction by 2018. These estimates are subject to change upon completion of the mass balance update.

10
Phase III – Collaborative Strategy Given the concern that industry-proven technology will not be available for mercury reduction in petroleum streams, sector sources propose the possibility of partnership and/or financial collaboration with a more feasible mercury-reducing sector to remove the estimated mercury discussed above. Potential areas for partnership might include funding assistance for education programs in the mercury products sector, control technology research grants, or funding assistance for mercury sampling and analysis in areas where better inventory data are needed. It could also include full or partial funding of a mercury-reduction effort undertaken by another company or the MPCA.
Petroleum Product Ut i l izat ion Emission Goal: Reduce sector emissions to 15 lb Timeline: Achieved by 2018 Description:
Data Gathering and Analysis Sources will update and submit mercury mass balance testing for their refineries to the Minnesota Pollution Control Agency by December 31, 2009. The mass balance will be developed using currently accepted sampling and analytical methods. The mass balance will include a discussion in the report of product distribution trends within the state toward the goal of revising initial MPCA inventory assumptions that all unaccounted for mercury is in refinery products or by-products and is released in the state to the air. Based on improved knowledge, sources will work with the MPCA to develop strategies to reduce any remaining releases.
Wood Combust ion Emission Goal: Reduce sector emissions to 14 lb Timeline: Achieved by 2018 Description:
Follow recommendations of anticipated federal industrial boiler Maximum Achievable Control Technology (MACT) standards, anticipated in approximately 2012. If federal standards do not require at least 70% control, then improve overall particulate matter capture and/or apply activated carbon injection on all electrostatic precipitation or fabric filter industrial/commercial/institutional coal-fired controlled units where existing mercury emissions are greater than 2 lb per year or emissions control is not at least 70%

11
(utility units excluded). Review federal MACT standards impacts in 2016 to determine if further controls are needed to achieve at least 70% reduction in sector. Federal MACT standards for industrial boilers will include wood boilers. This strategy assumes units can be controlled by an additional 70% over 2018 baseline.
Sale , Use & Disposal of Mercury-containing Products Emission Goal: Reduce sector emissions to 88 pounds Timeline: Achieved by 2018 Description:
Reducing mercury releases associated with products in Minnesota is the shared responsibility of product end-users, suppliers, retailers, manufacturers, waste management entities, governments and others involved in the introduction, use, servicing and removal of mercury-containing products, or the products or structures in which they are contained. These parties, their representative groups and others shall work together to implement a variety of strategies to reduce release from spills and improper disposal of mercury contained in products:
• Implement and enforce Minnesota’s existing mercury product laws and regulations to their fullest extent. Possible activities range from outreach to targeted sectors to compliance checks and enforcement actions.
• With the MPCA, coordinate outreach activities, and engage other parties in outreach and education efforts, including but not limited to other units of government, trade associations, product manufacturers and retailers.
• Prohibit the sale of any product containing intentionally added mercury or mercury compounds, with no de minimis amount or concentration, other than dental amalgam, high-intensity discharge lighting, or fluorescent lighting (including flat panel displays). A component or product manufacturer may petition the commissioner for a limited term exemption and must demonstrate that there is no feasible alternative for the specific product and application.
• Manufacturers of mercury-containing lighting and dental amalgam must notify the commissioner of the products and quantity of mercury sold in the state each year.
• For management of end-of-life lighting containing mercury (including flat panel displays), establish an Extended Producer Responsibility program where each party in the value chain has clearly defined roles, responsibilities and accountability. Work with stakeholders to develop program principles and guidelines.

12
• For management of waste dental amalgam, ensure that all dentists placing and removing amalgam install and use advanced amalgam separators. Evaluate and provide incentives to dentists and the general public to reduce the use of dental amalgam in favor of safe non-mercury restorative materials.
• Ensure that all Minnesota households and businesses are knowledgeable about and have convenient low-cost access to mercury waste management programs.
• For products that are already prohibited from sale in Minnesota, phase out remaining uses to the extent possible and replace with non-mercury products. Tools could include information, incentives, requirements, etc.
Targeted products could include:
- Most thermometers
- Barometers, manometers, sphygmomanometers and pyrometers
- Gastrointestinal devices
- Switches and relays
- HVAC thermostats
Targeted sectors could include:
- Great Lakes shipping industry
- Health care
- Laboratories
- Higher education Support Strategies:
• State level: Consider TIP-like program to support outreach and compliance. Support prohibition on burn barrels. Ensure adequate level of funding for activities. Monitoring to track TMDL reduction progress and ensure program effectiveness and accountability.
• Support federal actions to phase out mercury product sale/use and ensure proper long-term management
Examples of Combined/Expanded Product Strategies
1. Improved Fluorescent Lighting Recycling (Compact and Tube Varieties)
Increase recycling rate of fluorescent lighting products through improved and expanded outreach and collection involving government, retailers, wholesalers, manufacturers, utilities and others in the supply chain.

13
2. Elemental Mercury Clean Sweep
Short-term campaign to collect elemental mercury stored in homes, clinics, businesses, universities, etc.
a. Implement intensive outreach and awareness/promotion to target audiences
b. Work with trade associations, household hazardous waste programs, other partners
c. Establish convenient collection opportunities, including mail-in options for certain types of products where this can be done safely
d. Possible incentives/payment for participation
3. Electrical/Mechanical/HVAC/Demolition Sector Outreach
Conduct targeted and sustained outreach to sectors involved in installation, repair and removal of mercury devices.
Product examples: Industrial/boiler controls, thermometers, thermostats, manometers and barometers, other measurement devices, miscellaneous switches, lamps
a. Conduct outreach regarding product bans, management requirements, removal and storage procedures, etc.
b. Continuing education for contractors
c. Outreach through trade associations and unions
d. Involve distributors/wholesalers and manufacturers
e. Include municipalities (street lighting controls)
f. Work with above to facilitate collection and management, possible incentives
g. Enforcement of applicable laws following outreach phase.
4. Increase Compliance with Existing Laws
Outreach to product users, manufactures, retailers and suppliers regarding existing laws and their purpose. Enforcement of existing laws related to mercury where needed. Ensure adequate collection infrastructure. Laws in place that are currently not widely known enforced.
a. Sales prohibition (most products)
b. Take-back requirements for relays and thermostat
c. Labeling (most products)
d. Disposal prohibition in solid waste and wastewater
e. Removal prior to recycling (appliances and auto switches)
f. Utility outreach for lamp recycling
g. School purchase and use prohibition, removal

14
5. Phase Out Mercury Used in Shipping
Work with Lake Superior partners regarding mercury equipment. Identify alternative equipment and cost of replacement. Seek opportunities to install mercury-free equipment during ship building and maintenance.
a. Alternative products
b. Change-out opportunities
c. Need for coordination with industry and other partners
Smelters & Shredders That Recycle Cars & Appl iances Emission Goal: Reduce sector emissions to 10 lb Timeline: Achieved by 2025 Interim Emission Goal: Reduce sector emissions to 20 lb Interim Timeline: Achieved by 2018 Description:
To meet emission goals, smelters and shredders will plan to:
• Achieve 80% removal of mercury switches from automobiles shredded in Minnesota as outlined in anticipated federal Electric Arc Furnace Rule for Steelmaking Facilities.
• Update raw material specifications to include language requiring mercury switch removal to remove mercury from raw material feed.
• Perform education and outreach to suppliers to encourage participation in the National Vehicle Mercury Switch Recovery Program (NVMSRP).
• Audit suppliers’ yards to ensure compliance with specifications, as required under the Electric Arc Furnace rule or the NVMSRP.
• Audit suppliers’ participation in NVMSRP to ensure participation and to achieve 80% switch removal rates.
• Continue to offer bounty program for mercury switch collection to provide a collection point for any supplier not in NVMSP.
• Inspect shredder feed on a regular random interval. Shredders and smelters will also update and monitor mercury emissions, and will complete mass balance emissions testing every 5 years through 2025 to monitor progress toward the sector reduction goal. This strategy only applies to smelters and shredders and not to foundries unless they accept cars and appliances as feedstock.

15
Recycl ing Mercury from Products in Minnesota Emission Goal: Reduce sector emissions to 8 lb Timeline: Achieved by 2018 Description:
The state supports the continued practice of recycling mercury from products used in Minnesota, as these activities are an effective way to keep mercury-containing products out of the solid waste stream, and avoid mercury emissions associated with solid waste collection, handling and processing activities. The following strategies will be used to limit emissions from recycling activities.
• By the end of 2009, each product recycling facility will work with the MPCA to develop a mercury mass balance for the 2008 calendar year. The types of information that the MPCA will request may include:
o Inputs and outputs of materials and estimated mercury concentrations.
o Quantity of mercury recovered and the fate of that mercury.
o Suggestions for improving mercury recycling in Minnesota, regarding collection, shipping, best management practices, and disposition of recovered materials including mercury.
• The mass balance is to be updated every five years, for the calendar years 2008, 2013 and 2018.
• The MPCA should work with stakeholders, including product collection and transport services, to identify appropriate product management, handling and processing procedures.
• By 2018, air releases of mercury from activities related to product recycling, including collection, transportation, handling, processing and recycling, shall be no more than 8 lb per year.
• Mercury recovered from products in Minnesota shall not be sold to parties that are likely to use the mercury in products or processes that have a high likelihood of resulting in environmental release. Refer to the formal recommendation on retiring mercury from products in Minnesota.

16
Dental Preparat ions Emission Goal: Reduce sector emissions to 5 lb Timeline: Achieved by 2025 Interim Emission Goal: Reduce sector emissions to 10 lb Interim Timeline: Achieved by 2018 Description:
Support and promote existing and new initiatives to prevent tooth decay, including initiatives that provide equal access to health and dental care to all Minnesotans. Support education and outreach efforts targeted to dentists and patients on alternatives to dental amalgam. Support the increased use, and efforts to improve the efficacy and safety of these alternative materials. Support the goal of 100% voluntary participation in the Memorandum of Understanding (MOU) between the Minnesota Dental Association (MDA) and the Minnesota Pollution Control Agency (MPCA) for the statewide reduction of mercury from dental practices, which includes installing and maintaining amalgam separators and adherence to established best management practices. Work with MPCA to better understand emissions. Support MDA and MPCA actions and responsibilities as outlined in the MOU. Support initiatives to ensure equal insurance coverage for all restorative materials and preventive treatments, including alternatives to dental amalgam. Recommend that public sector employers provide dental insurance policies that include these provisions. Recommend and support outreach and education to the dental community and the general public on the proper disposal of mercury-filled teeth. If goal of 5 pounds is not on track to be met by 2025, reevaluate the goal, consider further incentives to achieve additional reductions of potential release of mercury from dental sources to the environment, and evaluate the potential benefit of further emission controls at dental clinics in light of technology at that time. Strategy assumes the use of dental amalgams will continue to decline over the next 20 years as indicated in research by Centers for Disease Control. Using the above techniques and accepting the assumptions regarding decreased use and the resulting removal of dental amalgams and an overall reduction in dental fillings due to prevention of tooth decay, mercury emissions from the dental sector are expected to decline to 5 lb by 2025.

17
Cremation Emission Goal: Reduce sector emissions to 32 lb Timeline: Achieved by 2025 Interim Emission Goal: Reduce sector emissions to 63 lb Interim Timeline: Achieved by 2018 Description:
• Study emission rates and develop better understanding of future trends by 2010.
• Study abatement alternatives and emissions-control options between 2008 and 2011. (Abatement options include alkaline hydrolosis, pulling or decoronating teeth.)
• Study social issues of abatement options.
• Implement recommended alternatives to achieve reduction targets.
Sewage Sludge Incinerat ion
Emission Goal: Reduce sector emissions to 6 lb Timeline: Achieved by 2020 Description:
Upgrade emissions control at Metropolitan Council Environmental Service’s (MCES) Seneca Plant through new carbon injection or equivalent technology system by 2020. Install emissions control when incinerators and air pollution control equipment are rehabilitated or replaced in 2020. 2005 emissions at MCES Seneca Plant equaled 6.1 lb; strategy would equate to a reduction of 5.6 lb from Seneca Plant (equal to a 91.8% reduction).

18
Mercury Product Manufacturing in Minnesota Emission Goal: Reduce sector emissions to 0.3 lb Timeline: Achieved by 2025 Interim Emission Goal: Reduce sector emissions to 13 lb Interim Timeline: Achieved by 2018 Description:
Given the potential for the release of mercury intentionally added to products in the manufacturing process, phase out the use of mercury in product manufacturing. The MPCA should work with industries to quantify emissions from manufacturing activities by 2010, and should periodically review manufacturing operations to identify other potential mercury emission sources
Taconite Process ing Emission Goal: Reduce sector emissions to 210 lb Timeline: Achieved by 2025 Interim Goals:
• Complete medium and longer-term testing of identified mercury-reduction technologies on at least one straight-grate furnace and one grate-kiln furnace by 2013.
• Begin the first full-scale installation of mercury emission control equipment on one existing furnace in 2014.
• Based on results of full-scale installation and optimization, provide schedule for implementation at all other existing furnaces by 2016.
Description:
Mercury Emissions Reduction Target The taconite industry is committed to doing its part to reduce mercury contamination in the environment. For example, as part of a voluntary mercury reduction effort conducted by the taconite mines, 2,901 lb of mercury contained in various devices were removed from mine plants from 1990 through September 2005. This initiative is ongoing and devices are continually being removed from service in order to prevent mercury from being inadvertently released to the environment. In addition, to remain competitive all mines continually strive to reduce operating costs by improving the energy efficiency of

19
their taconite-processing operations, and this further reduces mercury and other air emissions. The goal of the Mercury TMDL is to reduce statewide mercury air emissions to 789 lb per year. To assist in achieving this goal, the taconite industry has set a target of 75% reduction of mercury air emissions from the 2010 Minnesota Mercury Emission Inventory taconite emission level of 841 lb per year by 2025 from all plants collectively. This would result in a reduction in mercury emissions of 631 lb per year. However, mercury-reduction technology does not currently exist for use on taconite pellet furnaces. Therefore, achieving the 75% mercury reduction target will incorporate the concept of adaptive management by focusing on research to develop the technology in the near term and installation of mercury emission control equipment thereafter. The technology developed to achieve the target must be technically and economically feasible, it must not impair pellet quality, and it must not cause excessive corrosion to pellet furnaces and associated ducting and emission-control equipment. Criteria for determining economic feasibility will be developed through a collaborative effort by the taconite industry and the MPCA. Research And Installation of Mercury Control Equipment
• DNR mercury researchers will continue their current efforts through 2009 to identify potential mercury reduction technologies for use on pellet furnaces.
• The taconite companies will conduct additional testing by working in concert with the DNR. The goals of these efforts will be to: further explore options during short-term tests, continue development of mercury emission measurement technology, and develop the pool of researchers to be utilized.
• With input from the DNR, medium and longer-term tests of identified technologies will be conducted on at least one straight-grate furnace and one grate-kiln furnace from 2010 through 2013.
• Beginning in 2014, the first full-scale installation of mercury emission control equipment would proceed. This installation would be on one furnace and would consist of the most promising technology developed to date. Operation and probable subsequent modification of the system would then proceed for a period of two years to fully commission and maximize its efficiency. This optimization process is targeted form completion by 2016.
An implementation scheduled will be developed during the two-year optimization process, which will provide the dates and types of equipment that will be installed on the remaining taconite furnaces. The installation of mercury control equipment on all taconite furnaces would be completed by 2025. This includes all 14 applicable pellet furnaces (13 existing furnaces and 1 permitted, new furnace) and one permitted, new technology iron nugget furnace. This schedule assumes contractors and skilled tradespersons are available to install the equipment in light of other major construction projects that may be in progress in the region at the same time.

20
Adaptive Management
• Adaptive management will be used to manage the dynamic research and technology development through continual review and evolution of decisions and plans to meet mercury reduction requirements while maintaining balance in all other factors including product quality, trade-offs against other environmental concerns, and detrimental effects on processing equipment.
• The taconite industry will create and maintain a mercury emissions reduction research and implementation council. This council will have possible representation from the taconite industry, academia, MDNR, MPCA, electric utilities, and technical research entities with expertise in metallurgy, material processing, and emissions control. Its mission will be to provide guidance for timely technology development and installation of mercury emission control technology in the taconite sector. This guidance will include: assistance on research and development of mercury removal technologies, review of research plans, and advice on implementation strategy and timelines. This council will meet on a periodic basis after being organized during 2008. Progress reports will be prepared accordingly.
• An MPCA organized meeting will be held annually to present progress updates and to discuss pertinent aspects of the mercury emission reduction efforts with all interested parties.
Research Scope and Funding
• Research beginning in 2010 will involve longer-term testing of potential mercury reduction technologies. This will involve design and installation of equipment that will be tested for progressively longer periods of time such as 1 month, 3-6 months, and 1-2 years to determine the effectiveness of the technology in association with varying and seasonal operating conditions. Effects on product quality and ore processing equipment will also be assessed.
• Significant funding will be required, likely in the tens of millions of dollars, due to the scale of emission control equipment to be fabricated, installed, and tested, reagent quantities needed, and retention of contractors to conduct the tests. Because taconite plant emissions have some unique characteristics, mercury emission testing equipment must also be developed and in some cases improved. Moreover, contractors must be trained in equipment use in order to ensure that reliable emission data are collected to evaluate the effectiveness of each test.
• Significant funding will be provided by the taconite industry. In addition, funding will be sought from state sources including the following: Iron Ore Cooperative Research (IOCR), Minnesota Minerals Coordinating Committee (MCC), and DNR Environmental Cooperative Research (ECR). Identification of other possible funding sources will also be pursued.

21
STRATEGY FOR NEW AND EXPANDING SOURCES
OF AIR EMISSIONS
With successful implementation, the actions recommended in this plan will reduce mercury air emissions from current levels to below 789 lb per year by the year 2025. Between now and 2025, new mercury air emission sources, as well as expansions at existing sources will come before the MPCA for consideration. There must be a process in place to ensure that these new sources do not jeopardize the state’s ability to reach the 2018 interim goal, or the final TMDL goal by 2025. To this end, the following guidance framework is recommended: After May 1, 2008, new and expanding air emission sources will be allowed provided the following measures are employed to ensure that the new and expanding sources do not result in an eventual exceedance of the TMDL goals.
Assumptions:
• The strategy framework is implemented to reduce existing emission sources to below the 789 lb per year goal by 2025.
• New emission sources permitted as of May 1, 2008, but not yet operational are counted as existing emission sources.
• Existing emission sources and sectors will be assigned a final cap used to achieve the 789 lb goal.
Description:
Proposed new or expanded sources:
1. Required to achieve best control.
2. Must complete environmental review as applicable, including evaluation of local and cumulative impacts.
3. Submit a plan to the MPCA to account for the proposed emission. New sources must first seek permanent offsets with an existing source or sources in Minnesota at a 1:1 ratio. If enough existing sources are not available, new sources must propose a plan to achieve at least a 90% reduction of the proposed emission by 2025, and in addition must secure temporary offsets prior to operation from either:
a. Existing sources in Minnesota at a 1:1 ratio.
b. Out-of-state sources at a ratio greater than 1:1, based on the location of the source.
The plan will include research and reduction targets and timetables.
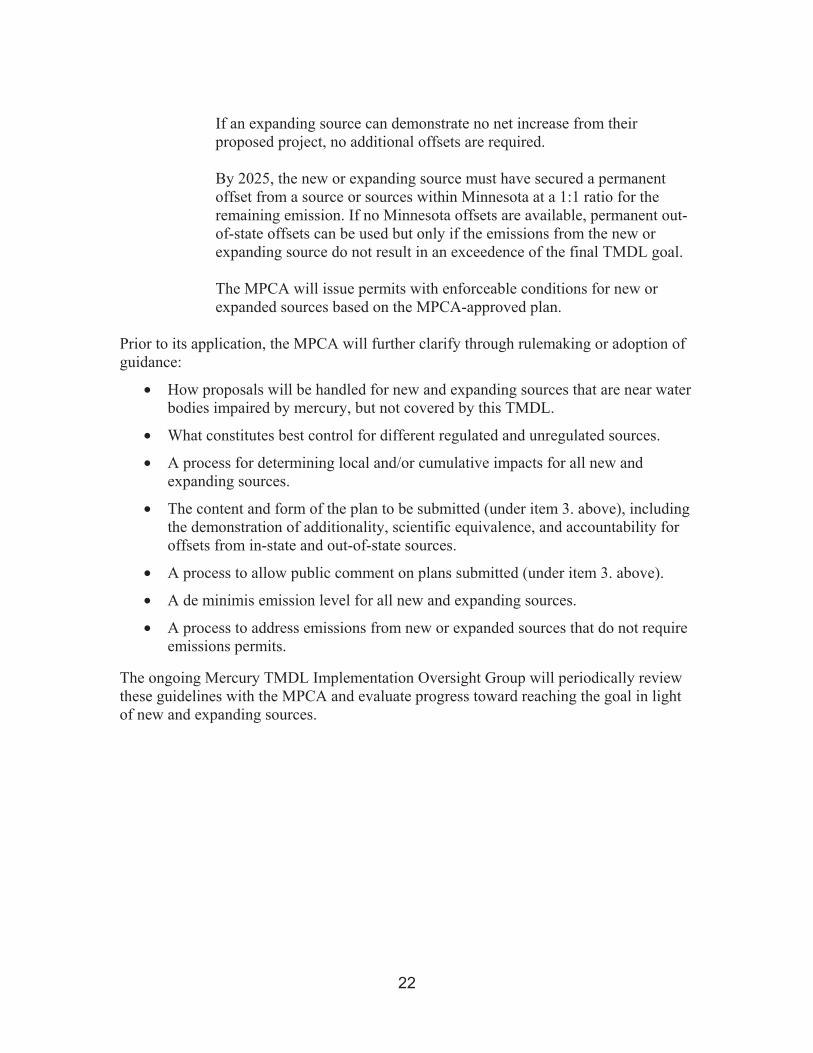
22
If an expanding source can demonstrate no net increase from their proposed project, no additional offsets are required. By 2025, the new or expanding source must have secured a permanent offset from a source or sources within Minnesota at a 1:1 ratio for the remaining emission. If no Minnesota offsets are available, permanent out-of-state offsets can be used but only if the emissions from the new or expanding source do not result in an exceedence of the final TMDL goal. The MPCA will issue permits with enforceable conditions for new or expanded sources based on the MPCA-approved plan.
Prior to its application, the MPCA will further clarify through rulemaking or adoption of guidance:
• How proposals will be handled for new and expanding sources that are near water bodies impaired by mercury, but not covered by this TMDL.
• What constitutes best control for different regulated and unregulated sources.
• A process for determining local and/or cumulative impacts for all new and expanding sources.
• The content and form of the plan to be submitted (under item 3. above), including the demonstration of additionality, scientific equivalence, and accountability for offsets from in-state and out-of-state sources.
• A process to allow public comment on plans submitted (under item 3. above).
• A de minimis emission level for all new and expanding sources.
• A process to address emissions from new or expanded sources that do not require emissions permits.
The ongoing Mercury TMDL Implementation Oversight Group will periodically review these guidelines with the MPCA and evaluate progress toward reaching the goal in light of new and expanding sources.

23
STRATEGY TO DISTRIBUTE
UNALLOCATED POINT-SOURCE WASTE LOAD The Mercury TMDL Implementation Plan should specify a process for the distribution of unallocated mercury loading available from the waste load allocation to permit holders that propose to discharge from new or expanding facilities to a water body that is impaired for mercury and is on the Clean Water Act 303(d) list. This strategy identifies criteria for distribution of unallocated mercury loading capacity but is not intended to specifically define all mercury requirements in accordance with state and federal laws. The mercury TMDL states that statewide, all point sources of mercury may discharge a total of 11 kilograms (kg) per year or 24.31 pounds (lb) per year (4 kg per year or 8.84 lb per year in the northeast region and 7 kg per year or 15.47 lb per year in the southwest region). Criteria for Distribution of Unallocated Mercury Loading Capacity:
1. The facility must be implementing a mercury minimization plan.
2. If the facility has a design capacity greater than 200,000 gallons per day, it must be conducting effluent monitoring.
3. The facility must be meeting either its interim mercury effluent limitation or final water quality based effluent limitation, derived from the water column water quality standard of 1.3 nanograms per liter (ng/l) (northeast region) or 6.9 ng/l (southwest region).
4. If an effluent limitation is not needed because the facility does not pose a reasonable potential to cause or contribute to a water quality standard violation, it is still eligible to be allocated load if it meets criteria 1) and 2) above.
Recommendation for distributing unallocated load: First come first served, with no restriction on amount of additional loading capacity utilized. Allocations are made by the MPCA through permit issuance, in accordance with the Mercury TMDL Implementation Plan. Once the load is completely allocated, new loads must be offset. Justification: The criteria above are the best use of the state’s resources given the impact of all point source direct discharges to mercury impairment in the environment. As stated on page 43 of the TMDL document, the total mercury allocation for all point sources (municipal and industrial wastewater treatment plants and permitted industrial and municipal stormwater) is less than 1% of the total allocation for all sources and is therefore de
minimis. As such, per the U.S. Environmental Protection Agency TMDL approval letter

24
(p. 15), the permitting authority must evaluate whether the point source discharge will
cause or contribute to a localized exceedance of the water quality standard. Additionally, there is more than adequate reserve capacity available for new or expanded point sources. Simple calculations show that currently only 4.88 kg per year in the southwest region and 2.48 kg per year in the northeast region are being or will be utilized by point source discharges. This means that 2.12 kg per year and 1.52 kg per year are available in the southwest and northeast regions, respectively. The calculation is based on the following assumptions:
1. All wastewater treatment plants will discharge at an average of 5 ng/l at their design flow.
2. All other discharges are at their current levels. However, new regulations will have an added benefit of reducing mercury levels in new or expanded municipal wastewater treatment plant discharges. The phosphorus rule will be put into effect on May 1, 2008. New or expanded municipal wastewater treatment plants that discharge more than 1,800 lb per year of phosphorus will be required to comply with a 1 milligram per liter (mg/l) phosphorus effluent limitation. As pointed out in the TMDL document, it can be conservatively assumed that most facilities will probably have an average mercury discharge of 3.65 nanograms per liter (ng/l) or less as a result of this phosphorus requirement. Implementation of this rule will allow the discharge of an additional 726 million gallons per day compared to the 1,052 million gallons per day currently allocated through the National Pollutant Discharge Elimination System, since mercury effluent values will decline from an average of 5 ng/l to 3.65 ng/l. An additional 179 million gallons per day could be discharged if the pulp and paper industries discharged 5 ng/l mercury versus the 13 ng/l noted in the TMDL document. These two actions would nearly double the current discharge capacity from 1,052 million gallons per day to 1,957 million gallons per day. Should the phosphorus requirement be applied to all municipal wastewater treatment plants, the cost to install phosphorus treatment for the purpose of removing mercury is significant. If all municipal wastewater treatment plants met a 1 mg/l effluent limitation, an additional 1.5 pounds of mercury would be removed and this load would become available as a result of this additional treatment. However, this would result in a very conservative cost estimate of $8.95 million per pound of mercury removed based on a total allocated flow rate of 1,052 million gallons, an estimated $1 per gallon to upgrade the plant, and a 20-year life cycle. This figure does not include the increased annual operations and maintenance costs.

25
OTHER RECOMMENDED ACTIONS
Retiring Mercury from Products in Minnesota Mercury recovered from products in Minnesota should be retired rather than allowing its use within the US or export for use elsewhere in the world. “Retired” means long term storage or sequestration of elemental mercury recovered from products, at a site or sites within the US. This would assure that recovered mercury in excess to US domestic needs would not be reintroduced to the market or used in locales or applications where it is not controlled and is released to the environment. The MPCA should investigate the feasibility of and the financial and legal mechanisms for contracting for the interim storage of mercury recovered from products in Minnesota, and report on its findings. The MPCA should evaluate options for:
a. Mercury recovered from the public sector under the state’s mercury waste management contracts, and
b. Mercury recovered from private sector waste generators in Minnesota by companies located either within or outside of the state.
The purchase of recovered mercury will need to be addressed.
Watershed Management
Scientific studies indicate that manipulation of surface water levels and some land uses may result in increased concentrations of methyl mercury in water and fish. Although the vast majority of the waters in the state are not subject to water level manipulation practices, the potential effects on mercury concentrations in those water bodies that are subject to these practices should be addressed as part of the TMDL implementation process.
• The issue needs more analysis and on-going consideration by federal, state and local units of government whose work includes watershed management and management or regulation of water resources in the state.
• Federal, state, and local agencies should participate in research efforts to better understand and quantify the potential effects of watershed and stormwater management on mercury methylation and mercury contamination of fish.
• Scientific literature addressing this concern should be reviewed and a summary should be incorporated into the Mercury TMDL Implementation Plan and other programs as appropriate.
• Develop an agenda and timeline for additional research if needed.

26
Support for Regional, National and International
Mercury-reduction Policies and Initiatives Because the TMDL identifies that 90% of the mercury comes from sources outside of the state, it is recommended that the MPCA work with other states’ environmental agencies, the US EPA, the Minnesota congressional delegation and others as appropriate to establish policies and initiatives to achieve emission reductions from sources in the U.S. and other countries to meet Minnesota’s Mercury TMDL targets for deposition. The objectives of this work shall be to establish policies and programs that result in significant emission reductions and consistency of policies among states and countries. These objectives can be achieved through technology and program transfer, after identifying model efforts globally. Initiatives with these objectives should be considered for MPCA support and involvement:
• Reduce or eliminate releases of mercury through pollution control or the use of alternative products and processes.
• Reduce or eliminate the intentional use of mercury in products and processes. This could include bans on the manufacture or sale of products with mercury.
• Maximize the proper end of life management of mercury products currently in use through outreach, readily accessible collection infrastructure and regulation.
• Eliminate the sale and export of mercury recovered from products and processes for uses that have a high likelihood of resulting in an environmental release.
The MPCA should seek ways to achieve the above outcomes by working with a variety of individuals, organizations and programs including the following:
• Minnesota’s representatives to the U.S. Congress
• Other states in the region, e.g., the states in US EPA Region V, the Great Lakes states and the Province of Ontario, and through regional forums such as the Great Lakes Regional Collaboration.
• National environmental, health, and media associations such as NGA, ECOS, ASTHO, NACAA, ASIWPCA, and ASTSWMO
• Offices and Regions within U.S. EPA
• Great Lakes Tribes, Canadian Tribes, the EPA's American Indian Environmental Office, and the Native American Fish and Wildlife Society.
• International forums and organizations, such as the Great Lakes Binational Toxics Reduction Strategy, North American Commission for Environmental Cooperation, the biennial International Mercury Conference, the United Nations Environment Programme, and others as appropriate.

27
STRATEGY FRAMEWORK IMPLEMENTATION The following elements are meant to serve as guidelines and overarching practices to complement implementation of the air emissions and water strategies developed to meet the goals of the Mercury TMDL. These elements include the following:
• Incorporation of the Strategy Framework into the State’s Mercury TMDL Implementation Plan
• Implementation Schedule and Tools
• Monitoring and Reporting of Air Emissions
• Adjustments to the Mercury Air Emission Source Inventory
• Establishment of an Implementation Oversight Group
Incorporation of the Strategy Framework
into the State’s Mercury TMDL Implementation Plan This Strategy Framework includes strategies for limiting mercury releases to air and water from Minnesota sources, including sector targets and interim timetables as well as decisions on how to accommodate possible new sources of releases to the state’s environment. It is the intention that these recommendations be incorporated into the Mercury TMDL Implementation Plan for Minnesota, developed by the MPCA.
Implementation Schedule and Tools The MPCA should use the full range of its authority and program capabilities to ensure that the goals of the TMDL are met, including the implementation of the water discharge strategy, and the achievement of interim and final air emission reduction targets. These implementation tools include, but are not limited to the following:
• Compliance and Enforcement
• Permitting
• Administrative Orders
• Rule-making
• Education and Outreach
• Program Development and Implementation
The final air emissions goal of 789 lb will be reached by 2025 with interim and final sector goals as described in specific strategies. The MPCA will monitor both air emissions and water discharges and will compare this information to the TMDL goals. This information should be reviewed by the Mercury TMDL Implementation Oversight Group (described below). The MPCA should make

28
adjustments to the implementation plan as necessary to ensure that the goals laid out in the Strategy Framework are met.
Monitoring and Reporting of Air Emissions Objectives:
• Accurately quantify, to the extent possible, emissions from all sources that are likely significant in Minnesota.
• Track progress in reducing individual facility and sector emissions.
• Provide input to MPCA and the ongoing TMDL implementation oversight group to consider new or modified strategies and sector implementation intervention.
• Establish reporting schedule that coincides with triennial inventory development
• Facilitate and track new source off-sets Strategy:
Starting in 2009, all facilities in the state that emit mercury above a de minimis level established by the MPCA shall provide an annual report to the MPCA that quantifies mercury emissions and describes progress in reducing releases.
Strategy Specifics:
Report Content
Annual reports are expected to be brief summaries of a facility’s progress in reducing mercury emissions and other reduction activities such as research. In some instances sectors may report as a group. Reports shall include an estimate of total mercury air emissions for the calendar year and are due by April 1 of the following year. The MPCA will provide guidance on report content. Schedule to Verify Emission Factors
Facilities and sectors will be required to verify the basis for their estimate at varying time intervals depending on the type of facility as determined the MPCA, at least every five years. The basis for determining emissions includes: emission factors based on facility-specific monitoring, a facility mass balance or generic emission factors. The MPCA will consider de minimis thresholds for emission factor verification. Poorly Quantified Sources
For emission sources in Minnesota that are poorly quantified, testing and analysis or a rigorous mass balance shall be conducted by 2010 to better quantify emissions. Other Information Requested
To ensure that captured mercury is not re-released, (inside or outside the state) it is important to track the fate of mercury that is captured by pollution control equipment, recovered from product recycling, contained in by-products or otherwise diverted. For

29
some facilities, other information is also requested that will allow the MPCA to track progress in reducing mercury usage, disposal and emission in Minnesota. Annual reports from facilities producing the following types of materials shall also provide information on mercury concentration and throughput: sewage sludge, sewage sludge incinerator ash, waste combustor ash, smelter flue dust, recovered mercury and petroleum products. Report Distribution and Synthesis
The MPCA will post facility reports on the MPCA web site. At least every three years, the MPCA will prepare and publish synthesis reports. Synthesis reports will evaluate progress at meeting the TMDL targets including emission reductions and research goals. While not a measure of Implementation Plan effectiveness, the agency will continue to work with other state agencies to monitor mercury in fish and report on trends.
Adjustments to the Mercury Air Emission Source Inventory It is expected that, as further research is done to better understand both known and potentially unknown air emission sources, there will be periodic changes to the air emission source inventory quantified by the MPCA. Changes resulting from policies, including the Next Generation Energy Act and implementation of strategies recommended as part of the Minnesota Climate Change Advisory Group, should be tracked and evaluated for their effect on mercury emissions in the state. The MPCA should track all emissions and inventory changes, and provide this information to the group charged with overseeing progress on the Mercury TMDL Implementation Oversight Group (described below).
Establishment of Mercury TMDL Implementation Oversight Group It is recommended that an oversight group be established to review and evaluate progress toward achieving the goals of the Mercury TMDL Implementation Plan and to determine if additional measures are needed to meet these goals. The group is advisory to the MPCA. The following describes the constitution and function of the group. Membership: A group of stakeholders made up of representatives from key stakeholder groups. Each stakeholder group would recommend a member to represent their interest. At a minimum, stakeholder groups might include: environmental advocacy groups, electric power generation, mining/taconite processing, wastewater treatment plant/local government, tribes, state government and environmental justice advocates. Meeting frequency: Annually from 2009 to 2025.

30
Specific tasks:
• Review and evaluate progress on sector benchmarks and interim goals described in the individual air emissions and water discharge strategies.
• Gauge effectiveness of strategy implementation, including overall implementation of strategy framework.
• Determine the need for actions to ensure that sector goals are met.
• Provide input to the MPCA on the need to modify the implementation plan, based on the evaluation of progress.
• Review changes to the air emissions inventory.
• Review the implementation of offsets employed to accommodate new and/or expanded sources of air emissions.
• Review guidelines for new and/or expanded sources of air emissions and progress towards goals in light of new permitted sources.
• Review the latest scientific information that could affect implementation of the TMDL.
• Review Other Recommended Actions.
• Review MPCA’s evaluation of the effectiveness of the TMDL. MPCA Role:
The MPCA will convene and staff the group and provide neutral facilitation (through a contractor if needed). Relationship to Other Groups:
• Mining Research and Implementation Group. The group described in the taconite processing strategy would report to this oversight group.
• Steering Committee. The MPCA and the oversight group may choose to establish a steering committee to assist the MPCA with planning of oversight group meetings and follow-up.
• Other Technical Advisory Group. In addition to the mining sector group, additional groups may be formed as necessary to consider technical and implementation issues related to other sectors.

31
Transparency:
The MPCA provides for equal access to information by all sectors and the public. This shall be accomplished by the following, at a minimum:
• Publicly announcing the meetings in MPCA publications, including Minnesota Environment magazine, the MPCA web site and the MPCA’s MPCA Send list serve.
• Seek the involvement of a steering committee to plan meetings.
• Arrange for third party facilitation, if needed.
• Publish all progress reports, meeting agendas and summaries on the MPCA web site.
• Prepare a periodic evaluation of progress in meeting the TMDL goals and other activities at least every three years.


Appendix 2
Mercury TMDL
Implementation Oversight Group Charge


Mercury TMDL Implementation Oversight Group Charge 3/26/09
In 2008, stakeholders recommended that an oversight group be established to review and
evaluate progress toward achieving the goals of the Mercury TMDL and to determine if
additional measures are needed to meet these goals. The group is formed to provide advice
to the MPCA on implementing the mercury TMDL. The following describes the make-up
and function of the group and is based on stakeholder recommendations.
Membership:
The group is made up of representatives from key stakeholder groups. Each stakeholder
group recommends a member to represent their interest. The MPCA has invited the
following stakeholder groups to designate a representative to the oversight group:
environmental advocacy groups (2 representatives), electric power generation,
mining/taconite processing (2 representatives), industry at large, wastewater treatment
plant/local government, tribes, public land manager, and environmental justice advocates.
These groups have identified the following representatives as of 3/16/09:
Nancy Lange, Izaak Walton League
Kris Sigford, Minnesota Center for Environmental Advocacy
Boise Jones, Environmental Justice Advocates of Minnesota
Tim Tuominen, Western Lake Superior Sanitary District
Nancy Schuldt, Fond du Lac Reservation
Trent Wickman, U.S. Forest Service
Tim Hagley, Minnesota Power
Dave Skolasinski, Cliffs Natural Resources
Chrissy Bartovich, U.S. Steel
Mike Robertson, Minnesota Chamber of Commerce
Meeting frequency:
This group will meet annually from 2009 – 2025. The MPCA expects to convene this group
in the fall of each year, allowing time for monitoring information, emission estimates and
reporting from the previous year to be gathered and analyzed. In the early stages of
implementation and leading up to sector deadlines in 2018 and 2025, the MPCA may wish to
convene meetings of this group more often.
Specific tasks of the Oversight Group:
• Review and evaluate progress on sector benchmarks and interim goals described in
the individual air emissions and water discharge strategies.
• Gauge effectiveness of strategy implementation, including overall implementation of
strategy framework.
• Determine the need for actions to ensure that sector goals are met.
• Provide input to the MPCA on the need to modify the implementation plan, based on
the evaluation of progress.
• Review changes to the air emissions inventory.
• Review the implementation of offsets employed to accommodate new and/or
expanded sources of air emissions.

• Review guidelines for new and/or expanded sources of air emissions and progress
towards goals in light of new permitted sources.
• Review the latest scientific information that could affect implementation of the
TMDL.
• Review Other Recommended Actions.
• Review MPCA’s evaluation of the effectiveness of the TMDL.
MPCA Role:
The MPCA will designate a representative to the group, convene and staff the group and
provide neutral facilitation (through a contractor if needed). MPCA’s primary participants
will be:
• David Thornton, Assistant Commissioner, will serve as MPCA’s main representative
to the Ongoing Oversight Group
• Frank Kohlash, Air Manager, will serve as David’s alternate and is the manager in
charge of air policy for mercury and implementing the air reduction strategies.
• Marvin Hora, Water Manager, responsible for implementing water reduction
strategies.
• Ned Brooks, Mercury Coordinator, will convene and staff the group, oversee
implementation and coordinate involvement of other MPCA staff.
Relationship to Other Groups:
• Mining Research and Implementation Group. The group described in the taconite
processing strategy would report to this oversight group.
• Steering Committee. The MPCA and the oversight group may choose to establish a
steering committee to assist the MPCA with planning of oversight group meetings
and follow-up.
• Other Technical Advisory Group. In addition to the mining sector group, additional
groups may be formed as necessary to consider technical and implementation issues
related to other sectors.
Transparency:
The MPCA will provide for equal access to information by all sectors and the public. This
shall be accomplished by the following, at a minimum:
• Publicly announce the meetings in MPCA publications, such as the MPCA web site
and the MPCA’s MPCA Send list serve.
• Seek the involvement of a steering committee to plan meetings.
• Arrange for third party facilitation, if needed.
• Publish all progress reports, meeting agendas and summaries on the MPCA web site.
• Prepare a periodic evaluation of progress in meeting the TMDL goals and other
activities at least every three years.

Appendix 3
Permitting Strategy for Addressing Mercury in
Municipal and Industrial Wastewater Permits


Permitting Strategy for Addressing Mercury in Municipal and Industrial Wastewater Permits
Minnesota Pollution Control Agency • 520 Lafayette Rd. N., St. Paul, MN 55155-4194 • www.pca.state.mn.us
651-296-6300 • 800-657-3864 • TTY 651-282-5332 or 800-657-3864 • Available in alternative formats
Water Quality/Wastewater Permitting #1.16 • March 2009
he purpose of this document is to
describe the Minnesota Pollution
Control Agency (MPCA) strategy
for addressing mercury in municipal and
industrial wastewater permits. The
statewide mercury Total Maximum Daily
Load (TMDL) was approved by the U.S.
Environmental Protection Agency (EPA)
on March 27, 2007. The 2008 TMDL
implementation plan incorporated the
MPCA interim permitting strategy, plus
described how the MPCA would monitor
mercury reduction and available reserve
capacity.
The MPCA’s key consideration in
developing a strategy for TMDL
implementation is to ensure that National
Pollutant Discharge Elimination
System/State Disposal System
(NPDES/SDS) permits are:
• consistent with overall Waste Load
Allocations (WLAs) for the northeast
and southwest regions of the state;
• affirm that wastewater point source
discharges are insignificant on local
and regional levels; and
• avoid creation of mercury
concentrations in fish or water that is
obviously (1) higher than other
concentrations in the area and (2)
caused by a local source.
The strategy will be used to issue new and
reissue existing NPDES/SDS wastewater
permits. Although this is a statewide
TMDL, all waters of the state are not listed
in the TMDL. Areas of the state impaired
for mercury and not included in the
statewide TMDL are listed in the
spreadsheet available on the MPCA Web
site at http://www.pca.state.mn.us/
publications/wq-iw1-03.xls. The attached
map (Attachment B) highlights waters that
are and are not included in the statewide
TMDL. The guidance in this fact sheet
applies to all areas of the state; however,
permitted facilities discharging to waters
not covered by the TMDL may have
different requirements and timelines
specific to their situation.
It is important to note that the MPCA will
only consider variance requests based
solely on the infeasibility of technology to
remove total mercury if pilot or bench
scale testing verifies the infeasibility.
Several technologies, such as sand filters,
membrane filtration and adsorbents have
shown promise or are effective in removing
mercury.
New or existing wastewater permits to be
issued or reissued to municipal and/or
industrial facilities will, at a minimum,
include the requirements listed on the
following pages. Additional requirements
may be added. Exceptions to this strategy
will be determined on a case-by-case basis
via discussion between standards staff,
permit writers and their supervisors.
T
wq-wwprm1-16

Permitting Strategy for Addressing Mercury in Municipal and Industrial Wastewater Permits • wq-wwprm1-16 • March 2009
Page 2
Existing municipal facilities
Major municipal facilities and municipal minor facilities becoming municipal major facilities – average wet weather design flow >1.0 million gallons per day (mgd)
Existing municipal major facilities with no reasonable
potential to exceed the applicable mercury standard:
• Will not be assigned an interim or a final mercury
limit.
• Will be assigned quarterly influent and effluent
mercury monitoring throughout the five-year permit
cycle.
• Will be required to submit new or updated Mercury
Minimization Plans (MMP) to MPCA within 180
days of permit reissuance/issuance. See Attachment
A for MMP permit requirements.
• Lake Superior Basin only: will be required to submit
annual MMP updates per Minn. R. 7052.0250, subp.
4.
Existing municipal major facilities with reasonable
potential to exceed the applicable mercury standard:
• Will be assigned an interim effluent mercury limit
applicable at permit issuance and influent and
effluent monitoring throughout the five-year permit
cycle. This concentration limit will be determined
using existing discharge data.
• Will be assigned a final effluent mercury limit
applicable at the end of five-year permit cycle.
• Will be required to submit new or updated MMPs to
the MPCA within 180 days of permit
reissuance/issuance. See Attachment A for MMP
permit requirements.
• Lake Superior Basin only: will be required to submit
annual MMP updates per Minn. R. 7052.0250, subp.
4.
Municipal minor facilities – average wet weather design flow 0.2 – 1.0 mgd
• Will not be assigned an interim or a final mercury
limit unless specific circumstances apply.
• Will be required to monitor twice per year for
influent and effluent mercury throughout the five-
year permit cycle in order to establish a baseline and
to aid in the TMDL implementation process.
• Will be required to submit new or updated MMPs to
the MPCA 180 days prior to permit expiration. See
attachment A for MMP permit requirements.
• Lake Superior Basin only: will be required to submit
annual MMP updates per Minn. R. 7052.0250,
subp. 4.
Municipal minor facilities – average wet weather design flow <0.2 mgd
• No requirements will apply unless specific
circumstances warrant. For those municipal minor
facilities that may have requirements, the
requirements will be determined on a case-by-case
basis and may include MMPs, monitoring, and
interim and final total mercury limits.
Existing industrial facilities
The strategy is to focus on activities and sectors with the
potential to add or release mercury. Sectors likely to be
subject to requirements include: metallic mining,
refineries, peat mining, and power plants.
Industrial facilities not in the Lake Superior Basin
• Requirements and/or monitoring/limits will be
determined on a case-by-case basis via discussion
between standards staff, permit writers and their
supervisors.
• MMP requirements and/or monitoring/limits are
dependent on specific sector or permittee.
Industrial facilities in the Lake Superior Basin
• Must comply with the requirements of Minn. R.
7052 and the Great Lakes Initiative. These
requirements may include a final total mercury
concentration limit of 1.3 ng/L (or equivalent) by
end of the five-year permit cycle if reasonable
potential exists.
• Required to submit new or updated MMPs to the
MPCA within 180 days of permit
reissuance/issuance (see attachment A) and annual
MMP updates per Minn. R. 7052.0250, subp. 4.

Permitting Strategy for Addressing Mercury in Municipal and Industrial Wastewater Permits • wq-wwprm1-16 • March 2009
Page 3
New or expanding facilities (all)
• Limits and monitoring will be determined on a case-
by-case basis based on reasonable potential and
nondegradation requirements.
• Interim mercury concentration limits may be
applicable at permit issuance.
• Final mercury limits based on a nondegradation
review may be applicable at start of operation.
• If no limit applies, will be assigned quarterly
influent and effluent mercury monitoring throughout
the five-year permit cycle.
• Will be required to submit new or updated MMP to
MPCA within 180 days of permit
reissuance/issuance. See attachment A for MMP
permit requirements.
• Lake Superior Basin only: will be required to submit
annual MMP updates per Minn. R. 7052.0250,
subp. 4.
Concentration only limits
“Reasonable Potential” is a procedure specified by EPA
regulation that compares preliminary water quality-based
effluent limits for a pollutant with effluent monitoring
data to determine the need for an effluent limitation.
Federal regulations at 40 CFR 122.44(d)(1) require that
pollutants be evaluated for the potential to exceed water
quality standards using acceptable technical procedures,
and accounting for variability in the effluent. MPCA
staff evaluates reasonable potential based on
concentration-based limits. Because of this, all total
mercury monitoring and limits are expressed as
concentration values for those facilities located outside
the Lake Superior Basin. Minn. R. 7052.0220, Item G,
requires mass limits in addition to concentration limits
for facilities located in the Lake Superior Basin.
Nondegradation requirements
Construction of a new facility or increasing flow above
0.2 mgd at an existing facility may trigger
nondegradation. An expanding facility that sustains
current mercury concentrations can lead to increased
mercury loading. Municipal and some industrial
effluents contain mercury which is primarily associated
with total suspended solids (TSS) in secondary effluents.
An expanding facility must demonstrate to the MPCA
that TSS loadings are not expected to increase because
of an expansion. Absent that demonstration, an
expanding facility is required to complete a
nondegradation demonstration to evaluate additional
treatment, socio-economic impacts, and the effects of the
proposed discharge on the receiving water (see Minn. R.
7050, Subp. 4). The facility must also submit a MMP.
Alternately, a freeze on TSS loadings (annual basis)
could serve the same purpose. A third choice would be
to accept a mass freeze for mercury.
Reserve capacity
The TMDL states that as long as actual loads are less
than those specified in regional WLAs, new and
expanding discharges may be permitted. The
implementation plan recommends that MPCA permit
new/expanding discharges that may include mercury as
long as sufficient WLA remains. The MPCA will review
loads on an annual basis, compare them to the WLAs,
and calculate the NPDES/SDS permittee contribution on
a watershed level. If the sum of the permittee mercury
contribution reaches the WLA, the MPCA may need to
reevaluate discharges from a specific watershed to see if
WLAs can be traded or reduced by another permittee.
If you have questions regarding this strategy or its
implementation, you may contact the MPCA at
651-296-6300 or toll free at 800-657-3864.

Permitting Strategy for Addressing Mercury in Municipal and Industrial Wastewater Permits • wq-wwprm1-16 • March 2009
Page 4
Attachment A: Mercury Minimization Plan (MMP) requirements
Mercury is present in all municipal and many industrial wastewater discharges. It is a powerful neurotoxin that affects
human health and the environment. A naturally-occurring element, mercury does not breakdown into less-harmful
substances over time. Instead, mercury released into the environment accumulates in fish and animal tissues, a process
known as bioaccumulation. Widespread mercury contamination has prompted the Minnesota Department of Health to
issue fish consumption advisories throughout the state. Most of Minnesota's impaired waters are contaminated by
mercury and other bioaccumulative toxins. The MPCA is carefully evaluating all mercury discharges in the state.
You are required to complete and submit a Mercury Pollutant Minimization Plan (MMP) to MPCA as detailed in this
section. If you have previously submitted an MMP, you must update it and submit the updated version to the MPCA. The
purpose of the MMP is to evaluate collection and treatment systems to determine possible sources of mercury as well as
potential mercury reduction options. Guidelines for developing a MMP are detailed in this section.
The specific discharge limits for mercury assigned to your facility are detailed in the limits and monitoring section of your
permit. Information gained through the MMP process can be used to reduce mercury concentrations to achieve the
specified discharge limit. If your facility is currently achieving this limit, the information gained through the MMP can be
used to further reduce mercury in your discharge. As part of its mercury control strategy, you should consider selecting
activities based on the potential of those activities to reduce mercury loadings to the wastewater treatment facility.
At a minimum, the MMP must include the following:
• A summary of mercury influent and effluent concentrations and biosolids monitoring data using the most recent five
years of monitoring data, if available.
• Identification of existing and potential sources of mercury concentrations and/or loading to the facility. As appropriate
for your facility, you should consider residential, institutional, municipal, and commercial sources (such as dental
clinics, hospitals, medical clinics, nursing homes, schools, and industries with potential for mercury contributions).
You should also consider other influent mercury sources, such as stormwater inputs, ground water (inflow and
infiltration) inputs, and waste streams or sewer tributaries to the wastewater treatment facility.
• An evaluation of past and present wastewater treatment facility operations to determine those operating procedures
that maximize mercury removal.
• A summary of any mercury reduction activities implemented during the last five years.
• A plan to implement mercury management and reduction measures during the next five years.
Annual report submittal (required in Lake Superior Basin permits only, if MMP is required)
If your facility’s discharge is located in the Lake Superior basin, you must submit an annual update of the MMP to the
MPCA Water Quality Submittals Center, for each year following MPCA approval of the MMP. The annual report must
include, but is not limited to:
• All minimization program monitoring results for the year.
• A list of potential sources of mercury.
• A summary of all actions taken to meet the effluent limit for mercury.
• Any updates of the control strategy.
All mercury monitoring collected during the previous year should be included with the annual report. This includes
tracking of source reduction activities; influent, effluent and biosolids data; and data collected from potential sources.

Permitting Strategy for Addressing Mercury in Municipal and Industrial Wastewater Permits • wq-wwprm1-16 • March 2009
Page 5
Attachment B: 2008 lakes and rivers with mercury impairments
Only “needs TMDL” are labeled


Appendix 4
MPCA-MDA Memorandum of Understanding


Appendix 5
Estimated Mercury Emissions in Minnesota
for 2005 to 2018


1
Estimated Mercury Emissions in Minnesota for 2005 to 2018
Not Including Reductions Expected
from the 2007-2008 Mercury TMDL Stakeholder Process
April 22, 2008
Introduction
This document contains estimates of mercury emissions to the atmosphere from human activity
within Minnesota provide baseline information for the deliberations of the group of stakeholders
that are working toward the implementation of the goals of Minnesota’s mercury TMDLa. A
primary goal of the TMDL is to ultimately reduce Minnesota’s anthropogenic mercury emissions
to a total of 789 pounds (lb.) per year, an ambitious goal considering this document estimates
2005 emissions to have been about 3,300 lb. The TMDL requires that the state design an
implementation plan that will result in the 75% reduction in emissions, from 3,300 to 789 lb.
Specifically, the Mercury TMDL Stakeholder Processb has the mission to identify mercury
reduction strategies and to develop recommendations for the state's implementation plan.
The purpose of this document is to provide estimates of what mercury emissions would be if
none of the new mercury reduction strategies that result from the TMDL stakeholder process
are implemented. There are existing initiativesc and social trends that will result in reduced total
emissions, but projected reductions are not nearly sufficient to reach the TMDL emission goal.
For instance, initiatives in the electric utility sector are projected to reduce those emissions by
76%, but no such initiatives yet exist for most other activities that emit mercury, some of which,
without intervention, may increase emissions in proportion to economic activity or because of
social trends. New and expanded point-source air emissions are only included in the estimates if
they have received a permit from the Minnesota Pollution Control Agency (MPCA), but as a
result of normal economic activity there will be additional proposed air emissions.
This document estimates that, in the absence of new mercury reduction strategies, mercury
emissions will decline by about 40% by 2018, to about 2,000 lb., with negligible reason to
decline further after 2018. The MPCA is asking stakeholders to identify reduction strategies that
can decrease projected emissions by a at least a further 60% — from the 2018 projection of
about 2,000 lb. to the goal of 789, or lower. To facilitate economic change and growth, the
stakeholders are also asked to recommend strategies that will accommodate new emissions
without exceeding the statewide goal.
a Statewide Mercury Total Maximum Daily Load (TMDL) Pollutant Reduction Plan.
http://proteus.pca.state.mn.us/water/tmdl/tmdl-mercuryplan.html b Mercury Total Maximum Daily Load Stakeholder Process. http://www.mn-ei.org/projects/mercury.html c Mercury. http://www.pca.state.mn.us/air/mercury.html
wq-iw1-21

wq-iw1-21 April 22, 2008 2
Table 1 Estimated mercury emissions (pounds) from human activity in Minnesota for the years 2005, 2010 and 2018
Mercury Emission Inventory for Minnesota (lb/year) Updated by MPCA staff April 22, 2008
estimated projected projected Likely change in
note Confidence 2005 2010 2018 same-facility
Categories emissions emissions emissions emissions by 2018
Incidental to Energy Production
Coal -- Electric Utility 1 high 1716.3 1041.0 410.3 specific reductions
Coal -- Commercial, Institutional, & Industrial 2 medium 71.3 77.0 86.0 up 15% plus 4 lb Heron Lake
Volatilization from coal ash 3 very low 0.0 may become significant
Petroleum Refining 4 medium 12.9 13.6 14.8 up 15%
Petroleum Product Utilization 5 very low 27.1 28.7 31.2 up 15%
Wood Combustion 6 medium 30.5 32.3 35.1 up 15%
Biomass other than wood 7 medium 0.0 2.1 2.1
Natural Gas Combustion 8 medium 0.3 0.3 0.3 up 15%
Subtotal: Incidental with energy production 1858.4 1195.0 579.9
% of total state emissions 56% 46% 30%
Largely Resulting from the Purposeful Use of Mercury
Proportional to Hg content of Solid Waste
Volatilization: solid waste collection & processing 9 very low 169.0 152.8 126.8 down 25%
On-site household waste incineration 10 very low 40.0 36.2 30.0 down 25%
Volatilization from spills and land dumping 11 very low 24.0 21.7 18.0 down 25%
Landfill volatilization 12 very low 2.1 1.9 1.6 down 25%
Volatilization: land application of compost 13 low 0.2 0.2 0.2 down 25%
Proportional to Hg content of Liquid Waste
Volatilization: land application of sludge 14 low 1.6 1.3 0.8 down 50%
Recycling Activities
Shredders & smelters that recycle cars and appliances 15 low 138.7 24.1 11.4 80% removal of fewer switches
Recycling mercury from products within MN 16 very low 65.0 71.3 81.3 up 25%
Non-Ferrous metal recycling (Al, Pb, ) 17 low 0.9 1.0 1.1 up 25%
Dental Mercury
Dental Preparations 18 very low 62.4 56.4 20.1 down due to less use, traps
Cremation 19 low 80.0 105.0 126.7 increased deaths & % cremated
Incineration
Municipal solid waste combustion 20 high 49.2 38.3 38.3 reductions at 2 facilities
Sewage Sludge Incineration 21 high 8.5 8.9 11.9 Up 13%; new Buffalo facility 2 lb
Medical waste incineration 22 high 0.4 0.6 0.8 up 100%
Hazardous waste incineration 23 high 0.3 0.3 0.3 none
Class IV incinerators 24 high 0.0 0.0 0.0 none
Mfg & Use of Non-dental Mercury-containing Products
Mercury product manufacturing in Minnesota 25 low 42.0 38.0 31.5 down 25%
General Laboratory Use 26 very low 10.0 6.5 1.0 down 90%
Volatilization from dissipative use 27 low 0.8 0.6 0.4 down 50%
Subtotal: Associated with purposeful use of mercury 695.1 564.9 502.0
% of total state emissions 21% 22% 26%
Emissions Incidental to Material Processing
Taconite Processing 28 high 734.8 840.6 840.6 several new facilities
(2005: includes 19.0 from dust + 6.6 lb from fuel) (Keewatin controlled 28% in 2005)
Thermal treatment of soil 29 low 0.8 0.8 0.8
Subtotal: Emissions incidental to material processing 735.6 841.4 841.4
% of total state emissions 22% 32% 43%
Difficult to Categorize (is the Hg from fuel or materials?)
Asphalt Manufacturing 30 low 4.3 4.3 4.3 Unclear what trend is
Agriculture, Food, & Kindred Products 31 low 1.1 1.1 1.1 Unclear what trend is
Mineral Products 32 low 13.8 13.8 13.8 Unclear what trend is
Miscellaneous Industrial Processes 33 low 0.2 0.2 0.2 Unclear what trend is
Wood, Pulp & Paper, & Publishing Products 34 low 5.1 5.1 5.1 Unclear what trend is
Subtotal: Emissions difficult to categorize 24.6 24.6 24.6
% of total state emissions 1% 1% 1%
GRAND TOTAL= 3,314 2,626 1,948
Abbreviations: NA = Not Applicable; NQ = Not Quantified;
Confidence intervals: High +/- 10%; Medium +/- 25%; Low +/- 50%; Very Low +/- 100% or more.

wq-iw1-21 April 22, 2008 3
Notes to Table 1, estimated mercury emissions in Minnesota, 2005-2018.
Emissions Incidental to Energy Production
1. Coal — Electric Utility
Based on data submitted by electric utilities; projections are based on reduction goals and the
U.S. Environmental Protection Agency’s (U.S. EPA) Integrated Planning Model (IPM)
projections for unit utilization.
Table 2 Mercury emissions from coal-burning electric utilities
Owner Plant name Unit ID Capacity
(MW)
Total Hg
emissions
2005 (lb)
Total Hg
emissions
2010 (lb)
Total Hg
emissions
2018 (lb)
Laurentian Energy
Authority
All Virginia &
Hibbing units All units
12.8 8.0 8.0
Municipal Austin Northeast NEPP 29 8.3 10.9 11.8
Municipal Springfield 4 4 0.0 0.0 0.0
Municipal Willmar 1 3 0.0 1.0 1.0
Municipal Willmar 3 19 3.7 6.5 6.5
Cleveland Cliffs Silver Bay Power BLR1 36 1.3 0.7 0.7
Cleveland Cliffs Silver Bay Power BLR2 69 1.7 1.3 1.3
Minnesota Power Clay Boswell 1 69 3.0 3.1 3.3
Minnesota Power Clay Boswell 2 69 3.0 3.4 3.6
Minnesota Power Clay Boswell 3 350 90.0 9.9 9.9
Minnesota Power Clay Boswell 4 426 184.0 13.5 14.3
Minnesota Power Syl Laskin 1 55 21.0 12.5 12.5
Minnesota Power Syl Laskin 2 55 0.0 12.6 12.6
Minnesota Power Hibbard 3 3.0 3.0 3.0
Minnesota Power Hibbard 4 3.0 3.0 3.0
Minnesota Power Taconite Harbor
Energy Center 1
65 22.0 2.4 2.4
Minnesota Power Taconite Harbor
Energy Center 2
67 17.9 2.0 2.0
Minnesota Power Taconite Harbor
Energy Center 3
68 17.0 2.0 2.0
Ottertail Hoot Lake 1 8 0.0 0.0 0.0
Ottertail Hoot Lake 2 62 39.4 17.3 18.3
Ottertail Hoot Lake 3 84 0.0 23.8 25.2
Rochester Silver Lake 1, 2, 3, 4 110 3.9 6.0 6.0
Xcel Allen S King 1 571 60.6 8.8 8.8
Xcel Black Dog 3 120 32.2 57.8 57.8
Xcel Black Dog 4 186 65.1 80.8 80.8
Xcel High Bridge 5 23.1 0.0 0.0
Xcel High Bridge 6 36.6 0.0 0.0
Xcel Minnesota Valley 4 50 0.0 0.0 0.0
Xcel Riverside 8 60.2 0.0 0.0
Xcel Riverside 6/7 45.5 0.0 0.0
Xcel Sherburne County 1 762 333.7 352.5 35.2
Xcel Sherburne County 2 752 314.0 356.0 35.6
Xcel/SMMPA Sherburne County 3 936 310.3 42.0 44.5
Total 1716.3 1041.0 410.3

wq-iw1-21 April 22, 2008 4
Table 3 This electrical generating project has the potential to emit mercury, has been proposed, but has not yet received a permit (and is not included in the emission calculations):
Project Type Start-up date Lb/yr Status
Mesaba Energy EGU 2010 54 Environmental Impact
Statement
2. Coal — Commercial, Institutional and Industrial
Future emissions from non-electric utility coal combustion are projected to grow by 15% by
2018, as a result of normal economic growth in Minnesota.
Table 4 Mercury emissions from coal combustors that are not electric utilities
Facility Unit
2005 mercury emissions
(lb/yr)
Southern Minnesota Beet Sugar Coop Boiler No. 1 8.70
University of MN - SE Plant Boiler No. 5 8.50
American Crystal Sugar - E Grand Forks Boiler No. 1 7.92
American Crystal Sugar - E Grand Forks Boiler No. 2 7.82
ADM - Mankato Boiler No. 5 6.08
Verso Paper Co - Sartell Mill Bros Boiler 5.93
Verso Paper Co - Sartell Mill B & W Boiler 3.59
American Crystal Sugar - Crookston Boiler #1 2.84
American Crystal Sugar - Crookston Boiler #2 2.84
American Crystal Sugar - Moorhead Boiler #1, North 2.69
American Crystal Sugar - Moorhead Boiler #2, Center 2.36
American Crystal Sugar - Moorhead Boiler #3, South 2.31
ADM Corn Processing - Marshall Coal Boiler #1 2.16
ADM Corn Processing - Marshall Coal Boiler #2 2.16
American Crystal Sugar - Crookston Boiler #3 1.59
District Energy St Paul Inc-Hans O'Nyman Boiler 2 1.03
District Energy St Paul Inc-Hans O'Nyman Boiler 3 0.78
Order of St Benedict/St John's Abbey Boiler #4 0.72
Order of St Benedict/St John's Abbey Boiler #1 0.30
University of Minnesota - Crookston Boiler 4 0.25
Order of St Benedict/St John's Abbey Boiler #2 0.24
University of MN - Twin Cities SG201 0.16
Duluth Steam Cooperative Association Boiler 1 0.09
Wausau Paper Printing & Writing LLC Boiler 4 0.08
Wausau Paper Printing & Writing LLC Boiler 3 0.08
Duluth Steam Cooperative Association Boiler 2 0.06
Duluth Steam Cooperative Association Boiler 4 0.06
Wausau Paper Printing & Writing LLC Boiler 2 0.02
Total 71.35

wq-iw1-21 April 22, 2008 5
The following new facility is expected to contribute mercury emissions by 2010, but is not yet
up and running (and is included in emission calculations):
Table 5
Facility Unit Potential mercury emissions (lb)
Heron Lake (ethanol plant) Boiler 4
The following electrical generating project that has the potential to emit mercury has been
proposed but has not yet received a permit (and is not included in the emission calculations):
Table 6
Project Type Start-up date Lb/yr Status
Agassiz Energy Industrial Boiler - Ethanol 2010 4 EIS
3. Volatilization from Coal Ash
Although emissions from coal ash are thought to be virtually zero in 2005, this category is
included because changes in pollution control equipment and the utilization of coal ash may
make this a significant category. In 2005 coal combustion constitutes the majority of mercury
emissions in Minnesota, at least partly because very little of the mercury contained in coal is
retained by pollution control equipment. Major consumers of coal in Minnesota have committed
to controlling mercury emissions, an effort that has the potential to greatly increase the mercury
content of coal ash. There also has been a great deal of interest in the beneficial utilization of
coal ash in a variety of ways, including soil stabilization for building construction, paved and
unpaved roads, as flowable fill, as a raw material for livestock pads, and as an agricultural
amendment. It is unclear whether mercury-enriched coal ash will be used in a way that allows
for the volatilization of the mercury from the utilized ash, and, if so, what the rate of release
would be. The MPCA has worked with Dr. Mae Gustin of the University of Nevada to predict
mercury volatilization rates from coal ash. Most current coal ash contains very little mercury, so
additional work will be needed to assess volatilization potential if there are proposals to utilize
coal ash that is enriched in mercury.
4. Petroleum Refining
The mercury content of crude oil is poorly known, so estimates of emissions have low
confidence. Minnesota has two refineries: Flint Hills Resources (formerly Koch Petroleum
Group) Pine Bend Refinery and Marathon Petroleum’s St. Paul Park Refinery. Flint Hills
Resources has conducted two mass balance studies of the mercury flow through its facility, and
its most recent study (2004) concluded that inputs of crude oil were 42.5 lb., emissions at the
facility 9.6 lb., and products contained 15.9 lb., of which 10 lb. is associated with sulfur, which
is sold as a commodity. Because virtually all of the sulfur is exported from Minnesota, none of
the mercury in the sulfur is assumed to be emitted in Minnesota. An additional 15.7 lb. could
not be accounted for in Flint Hills Resources’ mass balance, which, until clarifying information
is obtained, are assumed in this analysis to have been emitted at the facility. For the 2005 TRI
report, Flint Hills reported mercury emissions of 9.6 lb. from its Pine Bend facility. For the 2005
TRI report, Marathon Petroleum reported 3.3 lb. mercury emissions at its facility. If one scales
the inputs to Marathon to Flint Hills, one would predict inputs of 11.0 lb. to Marathon, and that
5.5 lb. mercury might be in the products from Marathon.

wq-iw1-21 April 22, 2008 6
The Flint Hills Refinery refines a much greater quantity of crude oil than the Marathon facility.
In 2007, Flint Hills Resources’ Pine Bend refinery in Minnesota completed a project that
increased its crude oil processing capacity by about 19%, from 270,000 to 320,000 barrels per
day. The refinery primarily refines Canadian crude oil, which it processes into petroleum
products such as gasoline, diesel, propane and butaned. Marathon’s facility has a capacity of
70,000 barrels per day. Crude oil from Canada and the United States is processed at the refinery
into gasoline, diesel, fuel oil, jet fuel, kerosene, propane and asphalt.e
Future emissions from this sector are projected to be proportional to change in capacity, which in
2007 increased 15% from 340,000 to 390,000 barrels per day.
5. Petroleum Product Utilization
From the calculations presented in note 4 (above), non-sulfur products, including mercury
missing from the mass balance, produced by Flint Hills Resources may contain as much as 21.6
lb. mercury, and products produced by Marathon Petroleum may contain 5.5 lb., a total of 27.1
lb. mercury. These estimates are quite uncertain, and it is not clear where these products are
consumed and if all the mercury contained in products is emitted to the atmosphere. For the
purposes of this state-wide mercury emission inventory, it is assumed that all the mercury that
may be in products is emitted in the state. A more detailed estimate of mercury emissions from
petroleum products would require data on all imports and exports of petroleum products from the
state, the mercury content of those products, and the fate of that mercury upon use of the
product, including fuels and sulfur. Such data are not available, so the simple analysis presented
here will be use. Future emissions from this sector are projected to grow by 15% by 2018 from
2005, in parallel to Minnesota’s increase in refining capacity.
d http://www.fhr.com/refining/minnesota.aspx ehttp://www.marathon.com/Global_Operations/Refining_Marketing_and_Transportation/Refining/St_Paul_Park_Minnesota/

wq-iw1-21 April 22, 2008 7
6. Wood Combustion
Table 7
Facility Unit Unit size
mmBtu/hr Lb Hg
Sappi Cloquet LLC Power Boiler #9 430 5.0
District Energy St. Paul Inc. - Hans O'Nyman Boiler 7 563 9.6
Sappi Cloquet LLC Power Boiler #7 300 7.0
Boise White Paper LLC - Intl Falls Boiler #2 2.9
Norbord Minnesota Wellons Burner 1.1
Blandin Paper/Rapids Energy Center Boiler #6 270 0.7
Blandin Paper/Rapids Energy Center Boiler #5 270 0.7
Georgia-Pacific - Duluth Hardboard Boiler 4 52 0.4
ISD 146 - Barnesville High School Wood/Bark Waste 0.3
Norbord Minnesota Konus Burner 2 0.2
Norbord Minnesota Konus Burner 1 0.2
Foldcraft Co Primary Boiler 0.2
Georgia-Pacific - Duluth Hardboard Boiler 5 17 0.2
Boise White Paper LLC - Intl Falls Boiler #2 0.2
Potlatch Forest Products Corp Lumbermill Steam Boiler 0.1
St Gabriel's Hospital Wood/Bark Waste 0.1
Alltrista Consumer Products Co. Boiler 1 0.1
Alltrista Consumer Products Co. Boiler 2 0.1
Alltrista Consumer Products Co. Boiler 3 0.1
Alltrista Consumer Products Co. Boiler 4 0.1
23 other smaller facilities 1.1
Total 30.5
7. Biomass Other Than Wood
New facilities that combust biomass other than wood are beginning to be constructed in
Minnesota. Fibrominn, which combusts turkey litter waste is operational. Koda Energy
received an air emission permit from the MPCA in August 2007 and is under construction. Koda
Energy will build a 308.18 MMBtu/hr combined heat and power biomass boiler to produce on
average, 120,000 lb./hour of steam for process heat at Rahr Malting and 17.8 MW of electricity.
Koda Energy will burn oat hulls and other biomass byproducts from the RAHR facility.
Table 8
Project Type Startup
date Estimated lb Hg/yr
Status Hg emission range
in TSD for Air Permit
Fibrominn EGU 2007 0.1 Operational
Koda Energy EGU & steam 2010 2 Under construction 1.8 to 8.1
Total 2.1

wq-iw1-21 April 22, 2008 8
8. Natural Gas Combustion
This estimate is based on an emission factor of 0.0008 lb. mercury/trillion Btu (Electric Power
Research Institute. Mercury in the Environment - A Research Update. TR-107695. Palo Alto,
December 1996). Future emissions from natural gas consumption are projected to grow by 15%
by 2018, but due to the extremely low emission factor, total projected emissions will remain at
0.3 lb./year.
Emissions Largely Resulting from the Purposeful Use of Mercury
Proportional to Hg Content of Solid Waste.
9. Volatilization: Solid Waste Collection and Processing
This estimate is based on the assumption that 5% of the mercury in solid waste is volatilized
during collection, transportation and mechanical processing. This estimate includes municipal
solid waste (MSW) that is landfilled, incinerated and composted, but does not include Problem
Materials Not Recycled (PMNR; washing machines, oil filters, tires, etc.), waste that is recycled
(newspaper, glass, cans), demolition, medical waste incineration, MSW compost or backyard
burn barrels. Emissions from steel-recycling facilities is calculated separately (see note 15).
Future emissions from solid waste volatilization are projected to decrease by 25% by 2018
because of decreased availability and disposal of mercury-containing products.
Table 9
Fate of Municipal Solid Waste 1990 1995 2000 2005
Recycling 1,381,690 1,766,528 2,267,952 2,490,000
MSW Compost 30,000 67,997 21,092 20,000
Resource Recovery (combustion) 1,379,329 1,228,830 1,240,000
Landfill 800,000 1,145,067 1,909,152 2,120,000
Problem Materials Not Recycled 110,868 110,841 120,000
On-site Disposal 110,000 95,226 96,064 80,000
TOTAL (tons) 4,565,015 5,633,932 6,250,000
Mercury Content (ppm) (calculated from incinerators) 3.66 0.97 0.62 0.5
Total landfilled, combusted, composted (tons) 2,200,000 2,592,393 3,159,074 3,380,000
Mercury content (lb) of Solid Waste (excluding recycling,
PMNR)
16,104 5,029 3,917 3,380
Volatilization during handling and transport (lb) (5% of
landfill, combustion, composting)
805 251 196 169
Emissions from on-site combustion, also known as "Burn
Barrel emissions" assuming 50% is emitted.
403 92 60 40
Volatilized during landfilling, assuming 0.1% is emitted 5.9 2.2 2.4 2.1
Volatilized during and composting, assuming 1% is emitted 2.2 1.3 0.3 0.2
From MPCA SCORE reports:
www.pca.state.mn.us/publications/reports/lrp-p2s-3sy07.pdf
Report on 2005 SCORE Programs
A summary of waste management in Minnesota (December 2006)

wq-iw1-21 April 22, 2008 9
10. On-site Household Waste Incineration
It is thought that a significant quantity of solid waste produced by households in Minnesota is
not introduced into any organized collection system, but rather is burned on site. This practice
could be a significant source of mercury emissions, given that there is no pollution-control
equipment and that we know from testing at large municipal solid waste incinerators that
household waste contains mercury. Much of household waste is paper, cardboard, and plastic,
materials that have a mercury concentration that is much lower than the calculated average for
waste. Therefore, the average mercury concentration must be maintained by the occasional
introduction of high-mercury items, such as older batteries, broken thermometers, fluorescent
lamps, thermostats, etc. In rural areas, on-site disposal often takes the form of an outdoor “burn
barrel.” In urban and suburban areas, older houses and apartments were often designed with a
basement incinerator, although the use of these incinerators has undoubtedly decreased since
regulation in the early 1970s. The MPCA estimates the quantity of waste not collected in
Minnesota, which is thought to be burned on site, commonly in burn barrels. The following
table outlines available data on the production and fate of MSW in Minnesota, and estimates
mercury emissions. These figures imply that about 2% of MSW is burned on site. This may be
an underestimate, given that at least two studies have shown much higher rates of on-site
incineration. Zenith Research Group (1997) found that 11% of residents in the Duluth area
affirmed that they use a burn barrel. A 2000 Zenith study of Minnesota residents in the Duluth
area found that 18% of residents surveyed admitted to the practice (Zenith Research Group.
2000. Increased Awareness. Prepared for Western Lake Superior Sanitary District.). Future
emissions from burn barrels are projected to decrease by 25% by 2018 because of educational
initiatives, a decrease that could be accelerated if additional incentives are provided.
Table 10
1990 1995 2000 2005
Emissions from on-site combustion, "Burn Barrel
emissions" assuming 50% is emitted. 403 92 60 40
(See Table in Note 8 for calculations)
11. Volatilization from Spills and Land Dumping
The MPCA estimates that large quantities of mercury are in use in Minnesota, and that a portion that is
removed from service each year (8%) is spilled, and that 5% of the mercury that is spilled volatilizes:
Table 11
Year Hg in use (lb) Hg removed from use (lb) Spilled (%) Hg volatilized (lb)
1990 190,000 13,667 8.0 54.7
1995 160,000 12,000 8.0 48.0
2000 130,000 12,000 8.0 48.0
2005 70,000 6,000 8.0 24.0
It may appear unlikely that such large amounts of mercury are being removed from use, yet these
estimates are supported by mercury content of the solid waste stream, as quantified by stack tests
at solid waste incinerators. Based on stack tests, the solid waste stream contained at least 16,000
lb. of mercury in 1990, 5,000 lb. in 1995, and 4,000 lb. in 2000. Although it is likely that more
mercury was properly disposed of after 1990, it also seems likely that as long as mercury is in
use, it will be accidentally spilled and volatilized.

wq-iw1-21 April 22, 2008 10
12. Landfill Volatilization
0.1% of mercury in landfilled municipal solid waste (MSW) is assumed to volatilize to the air
per year based on studies of MSW emissions in Florida by S. E. Lindberg and J. L. Price.
(Lindberg, S. E.; Price, J. L. Airborne emissions of mercury from municipal landfill operations:
a short-term measurement study in Florida. J. Air & Waste Manage. Assoc. 1999, 49, 520–532.)
See table in Note 9 for calculations.
13. Volatilization: Land Application of Compost
See table in Note 9 for calculations.
Proportional to Hg Content of Liquid Waste
14. Volatilization: Land Application of Sludge
After correcting for the water content, about 50,000 dry tons of sewage sludge are land applied
in Minnesota each year. This estimate assumes that 1% of the mercury applied to the surface of
the land volatilizes within a year, but does not attempt to calculate any carryover from previous
years. The mercury content of the sludge has been declining over time. Sludge averaged 3.6
ppm of mercury in 1990, 1.8 ppm in 1995, 1.4 ppm in 2000, and 0.7 ppm in 2005. Future
emissions from land-applied sludge are projected to decrease by 50% by 2018 because of
continued efforts to reduce mercury discharge to sanitary sewers, especially by dentists.
Recycling Activities
15. Shredders and Smelters That Recycle Cars and Appliances
Mercury is released by the recycling of cars and major appliances because of the presence of
mercury switches in some of these products. There are several shredding facilities in Minnesota
that process vehicle and appliance scrap, including Gerdau Ameristeel, Schwartzman Co. and
Bay Side Recycling Corp. Emissions from shredders have only been characterized at one
Minnesota facility (Gerdau Ameristeel, 10 lb./year) and further study is needed to identify all
facilities and characterize their practices. In 2007 Gerdau processed the equivalent of 64% of the
vehicles retired in Minnesota.
There is one electric arc furnace (EAF) mini-mill in Minnesota that melts steel from recycled
cars and appliances, Gerdau Ameristeel, formerly North Star Steel. In the national TRI, Gerdau
Ameristeel reported emissions of 255.3 lb. for 2005, which the MPCA believes overestimates
true emissions because (a) it was based on a 1999 stack test when vehicles contained 15% more
mercury switches and (b) the stack test was extrapolated to the total number of hours the bag
houses were running rather than the hours that melts of scrap metal occurred — the bag house
fans were left on when mercury was not being volatilized. Adjusting for just the hours that the
melting was occurring, total facility emissions for 2005 are now estimated to have been 138.7
lb., including 10 lb. from the shredder. While 138.7 may be a 15% overestimate (21 lb.) for
Gerdau facility alone because it is based on the 1999 stack test, 138.7 may be a fair 2005
estimate for Minnesota as a whole when including emissions from other shredders, and so that
number is used as a statewide estimate.
Data from the National Vehicle Mercury Switch Recovery Program (NVMSRP) project a 59%
decline in the quantity of mercury switches in the autos that are retired in Minnesota from 2005
to 2018, and 89% decline from 2005 to 2025 (Figure 1).

wq-iw1-21 April 22, 2008 11
A 59% decline in mercury switches alone would imply that state-wide emissions would be 56.9
lb. in 2018 and 15.3 lb. in 2025. However, the recent Electric Arc Furnace NESHAP Area
Source Rule for mercury, which includes the National Vehicle Mercury Switch Recovery
Program (NVMSRP) goal of 80% removal of switches from vehicles prior to shredding, means
that statewide emissions are projected to be 24.1 lb. in 2010, 11.4 lb. in 2018 and 3.1 lb. in 2025
(Table 13).
Future emissions are projected to decline from a combination of (1) reduced mercury in auto
scrap due to the NVMSRP and, and (2) a parallel reduction in the number of switches in other
scrap because the use of switches in appliances, such as washing machines, gas ovens, freezers
and residential boilers, was halted. The NVMSRP effort is scheduled to end on a national basis
after 2017, when 90% of the switches originally installed in vehicles are projected to have
retired. Figure 1 shows the estimated amount of mercury in vehicles available for recovery in
Minnesota, the estimated amount contained in Gerdau Ameristeel’s annual input, and the effect
of 80% recovery under the NVSMRP.
Figure 1 Modeled calculations of the mass of mercury available for recovery from vehicles
retired each year in Minnesota and contained in vehicle scrap inputs to Gerdau
Ameristeel. The source of the data is NVMSRP Measurement Subcommittee, assuming that
Gerdau Ameristeel receives 64% of vehicles retired in Minnesota. Data, supporting information
and references are available at www.elvsolutions.org/model.html. Switch retirement forecasts are
based on several sources, including Polk vehicle registration data, vehicle population and
retirement studies and models from the Federal Reserve Bank, the Department of Energy, the
Society of Automotive Engineers, and the Michigan Mercury Switch Study.
0
25
50
75
100
125
150
175
200
225
250
275
300
1995 2000 2005 2010 2015 2020 2025 2030 2035
pounds m
erc
ury
lb Hg in cars scrapped in Minnesota
lb Hg potentially received by Gerdau
Ameristeel in car hulks
lb Hg potentially received by Gerdau
Ameristeel if 80% switch removal goal
is achieved

wq-iw1-21 April 22, 2008 12
Table 12
Year Lb Hg in cars scrapped in Minnesota
Lb Hg potentially received by
Gerdau Ameristeel in car hulks
Lb Hg potentially received by
Gerdau Ameristeel if 80% switch
removal goal is achieved
Statewide Hg emissions (lb)
reflecting switch decline and 80%
removal after 2008
2000 278.3 178.1
2005 180.1 115.2 138.7
2010 156.6 100.2 20.0 24.1
2018 74.2 47.5 9.5 11.4
2025 19.8 12.7 2.5 3.1
16. Recycling Mercury from Products Within Minnesota
It is difficult to estimate the emissions associated with recycling mercury in Minnesota because it
is unclear what the emission factor is for recycling mercury. This estimate was made in the late
1990s by Brian Golob, who at the time was employed by one of the three mercury recycling
companies in Minnesota. Future emissions from mercury recycling are projected to increase by
25% by 2018 because of increasingly aggressive efforts to remove mercury from use and recycle
it.
17. Non-ferrous Metal Recycling (Al, Pb)
These emissions are calculated by the MPCA air emission inventory staff:
0.55 Industrial Processes Secondary Metal Production Aluminum Burning/Drying
0.36 Industrial Processes Secondary Metal Production Lead Blast Furnace (Cupola)
0.91 Total
Dental Mercury
18. Dental Preparations
Dentists have used mercury amalgam for over 150 years in the United States. Mercury
amalgams typically contain between 42 and 50% mercury. The mercury employed in the
amalgam has a variety of pathways to the atmosphere, including direct volatilization during
preparation in the dental office, from the patient’s mouth, after removal in the dental office,
during transit in wastewater pipes, from sewage sludge, from crematoriums, and a variety of
more subtle pathways. In this estimate, the MPCA includes direct volatilization from the dental
office, from the consumer, and during transit in wastewater pipes, but excludes all other
pathways, which are included in other emission categories. The MPCA based the estimates on
information in the report Substance Flow Analysis of Mercury in Products (August 2001,
www.pca.state.mn.us/air/mercury-mn.html#publications). However, the MPCA reduced
volatilization during transit from 10 to 5%, although no data on the subject are presently
available. 2005 projections are based on data from Cain et al. 2007, using the MPCA
assumptions that transit loss is 5% and that otherwise Minnesota can be estimated as 2% of
national figures.

wq-iw1-21 April 22, 2008 13
Table 13
1990 1995 2000 2005 2018
Dental office (lb) 46.2 46.2 46.2 31.8 15.9
Customer breathing (lb) 11 12.1 13.2 6.4 3.2
Transit loss (lb) 46.2 40.7 35.2 24.2 1.0
Total Emissions (lb) 103.4 99 94.6 62.4 20.1
19. Crematories
Cremation can release significant quantities of mercury because of the mercury amalgam that is
present as dental fillings, and cremation probably releases all of this mercury to the atmosphere. The
MPCA estimates for this source are based on calculations presented in Substance Flow Analysis of
Mercury in Products (August 2001, www.pca.state.mn.us/air/mercury-mn.html#publications), which
calculates that an average of 2.63 grams of mercury are emitted per cremation. Cremations are
expected to significantly increase in the future and the number of mercury fillings in people’s teeth
will decline after about 2025 due to better dental care (Fig. 2). Therefore emissions to the
atmosphere are projected to increase until about 2025 before declining (Fig. 3).
Figure 2
Figure 3
0
10
20
30
40
50
60
70
2005 2010 2015 2020 2025 2030 2035 2040 2045 2050 2055 2060
YEAR
Perc
en
t C
rem
ate
d i
n M
N
0
0.5
1
1.5
2
2.5
3
Assu
med
gra
ms H
g p
er
Cre
mati
on
Percent Cremated
Grams per Cremation
0
20
40
60
80
100
120
140
160
2005 2010 2015 2020 2025 2030 2035 2040 2045 2050 2055 2060
YEAR
Hg
em
itte
d
in M
N (
lb)
�
0
20,000
40,000
60,000
80,000
100,000N
o.
Death
s i
n M
N
Deaths in Minnesota
Mercury Emitted from Crematoria

wq-iw1-21 April 22, 2008 14
Table 14
Year
MN Hg cremation emissions
(lb)
% Cremated
in MN
Deaths in MN
Assumed g Hg per cremation
Change in Hg from 2005
(Brown et al. 2002)
2005 83 38 38,200 2.63
2010 105 46 39,400 2.63
2015 118 50 40,800 2.63
2020 133 54 42,800 2.63
2025 151 57 45,400 2.63
2030 134 60 49,200 2.08 -21%
2035 113 62 57,000 1.45 -30%
2040 81 64 64,800 0.89 -39%
2045 52 64 71,000 0.52 -42%
2050 31 64 75,000 0.29 -44%
2055 17 64 76,400 0.16 -46%
2060 9 64 76,000 0.08 -48%
Notes:
Brown, L. J., Wall, T. P., and Lazar, V. 2002. Trends in caries among adults 18 to 45 years old. J. American Dental Assoc.
133:827-834
Bold numbers are from literature, others are interpolated.
CANA (Crematoria Association of North America) predicts that the national cremation rate will reach 64% in 2040, which
may be an underestimate for Minnesota, which in the past has exceeded national rates by about 7%.

wq-iw1-21 April 22, 2008 15
Incineration
20. Municipal Solid Waste Combustion
The mercury emissions in the following table are based on stack tests submitted to the MPCA
Table 15
Facility Unit Lb emitted
Mayo Waste Management Facility Pathological Waste Incinerator 0.033
Xcel Energy - Key City/Wilmarth Boiler #1 (with CE 001 scrubber and CE 002
baghous 1.814
Xcel Energy - Key City/Wilmarth Boiler #2 (with CE 003 scrubber and CE 004
baghous 1.826
Pope/Douglas Solid Waste Management MSW Incinerator Unit 1 0.216
Pope/Douglas Solid Waste Management MSW Incinerator Unit 2 0.132
Xcel Energy - Red Wing Generating Plant Boiler 1 5.310
Xcel Energy - Red Wing Generating Plant Boiler 2 5.060
Red Wing Solid Waste Boiler Facility Left and Right Incinerator and Common Auxiliary
Bu 1.336
Covanta Hennepin Energy Resource Co LP MSW Incinerator 5.360
Covanta Hennepin Energy Resource Co LP MSW Incinerator 4.471
Enviro-Chem Inc - Plant 1 Recovering Metals 0.010
Enviro-Chem Inc - Plant 1 Recovering Metals 0.010
Enviro-Chem Inc - Plant 1 Recovering Metals 0.010
Enviro-Chem Inc - Plant 1 Recovering Metals 0.010
Olmsted Waste-to-Energy Facility Municipal Waste Combustor Unit #1 1.785
Olmsted Waste-to-Energy Facility Municipal Waste Combustor Unit #1 0.000
Olmsted Waste-to-Energy Facility Municipal Waste Combustor Unit #2 0.524
Olmsted Waste-to-Energy Facility Municipal Waste Combustor Unit #2 0.000
Perham Resource Recovery Facility South MSW Incinerator 10.590
Fergus Falls Resource Recovery Facility MSW Incinerator 1 2.522
Fergus Falls Resource Recovery Facility MSW Incinerator 2 0.853
Polk Cnty Solid Waste Resource Recovery Incinerator 1 2.262
Polk Cnty Solid Waste Resource Recovery Incinerator 2 1.184
Polk Cnty Solid Waste Resource Recovery Dump Stack for Incinerator 1 0.004
Polk Cnty Solid Waste Resource Recovery Dump Stack for Incinerator 2 0.004
Great River Energy - Elk River Unit 1 Boiler 0.460
Great River Energy - Elk River Unit 2 Boiler 0.460
Great River Energy - Elk River Unit 3 Boiler 0.723
Verso Paper Co - Sartell Mill B & W Boiler 2.302
Total 49.239
Perham experienced a malfunction of pollution control equipment in 2005, which allowed an
unusual amount of mercury to be emitted. Projections after 2005 assume that Perham emits 2.0
lb./year.
The Olmsted facility has a permit to expand, and construction is underway in 2008. The
Olmsted expansion is expected to increase mercury emissions at the facility by approximately
1.0 lb./year.
21. Sewage Sludge Incineration
Sewage sludge contains mercury from a variety of wastewater sources. There are two sludge

wq-iw1-21 April 22, 2008 16
incinerators in Minnesota, the Metropolitan Plant, and the Seneca Plant. Based on data provided
by the Metropolitan Council, the MPCA estimates that 247 lb. of mercury were emitted in 1990,
160 lb. in 1995, 112 lb. in 2000, and only 8.5 lb. in 2005. In late 2004 a new incinerator with
about 97% mercury-control efficiency began operation at the Metropolitan plant (as calculated
by Balogh and Nollet, 2007, Sci Total Environ. Mercury mass balance at a wastewater treatment
plant employing sludge incineration with offgas mercury control.) In September 2007 the
Buffalo Wastewater Treatment Plant (Buffalo, Minn.) received an amended permit to construct a
sewage sludge incinerator that will control mercury emissions with activated carbon. It is
unknown what actual emissions of mercury will be from this new facility. The Air Quality
Permit limits mercury emissions to 4 lb./year, but emissions are likely to be much lower. For the
purpose of projecting emissions, 2 lb./year are assumed at startup in 2008. To account for
increased loading and emissions due to population growth, increases of 1% per year are
projected.
Table 16.
Facility 1990 1995 2000 2005 2010 2018
Metropolitan Plant 212 136 95 2.4 2.5 2.7
Seneca Plant 35 24 17 6.1 6.4 6.9
Buffalo Plant 2.0 2.2
Total emitted (lb) 247 160 112 8.5 11.0 11.8
21. Medical Waste Incineration
Emission data are based on stack tests submitted to the MPCA, as summarized in the following
table.
Table 17
1990 1995 2000 2005
Facility Lb Hg
emitted
Lb Hg
emitted
Lb
Hg/ton
Tons
burned
Lb Hg
emitted
Tons
burned
Lb Hg
emitted
Mayo Foundation, Rochester 115 1 7.71E-05 5,292 0.40 5,300 0.4
Medical Safety Systems, Cannon
Falls 33 25 3.10E-03 1,851 5.70 0 0.0
Small Class IV incinerators at
hospitals (about 80 in 1990, 20
in 1995, 6 for part of 2000)
368 10 2.10E-04 200 0.04 0 0.0
Total mercury emitted 516 36 6.14 0.4
Notes:
After 1990, the Mayo Foundation Incinerator was replaced with a new facility that controls mercury emissions
with activated carbon injection.
The Medical Safety Systems facility in Cannon Falls closed permanently in August 2000.
Most hospital (Class IV) incinerators were required to close by February 2000 due to federal regulations; those
still operating in 2000 are listed below:
Table 18
Date operation ceased Hospital
January 2000 Fairmont Community Hospital
February 2000 Worthington Regional Hospital
February 2000 St. Cloud Hospital
June 2000 Lakewood Health Center, Baudette
October 2000 NW Medical Center, Thief River Falls
November 2000 Northcountry Regional Hospital, Bemidji

wq-iw1-21 April 22, 2008 17
23. Hazardous Waste Incineration
Minnesota has only one hazardous waste incinerator, 3M Chemolite. Based on data submissions
from that facility, MPCA estimates annual mercury emissions of 5 lb. per year. 3M did not
submit any data recently, and 5 lb. may be an overestimate.
23. Class IV Incinerators
Small incinerators were once commonly used at grocery stores and other small businesses to
incinerate waste, largely cardboard. All of these small incinerators, of which there were about
1,000 in 1990, closed by January 1996 because of new state regulations to reduce particulate
emissions. It is assumed that they mostly burned cardboard with mercury at 0.2 ppm. The
MPCA estimates that Class IV incinerators burned about 138,000 tons in 1990 and 70,000 tons
in 1995.
Manufacturing & Use of Non-dental Mercury-containing Products
25. Mercury Product Manufacturing in Minnesota
Mercury is released from product manufacturing processes. According to the IMERC database
of mercury product manufacturers, there are three mercury product manufacturing facilities
located in Minnesota. These include Anchor Scientific, Long Lake; Electro-Sensors, Inc.,
Minnetonka; and SJE Rhombus, Detroit Lakes. SJE Rhombus is the only facility that has filed a
TRI report for mercury. This mercury-switch manufacturing facility calculates that in 2005 it
emitted 42 lb. mercury (TRI report). Because of progressive bans on the sale of mercury
switches in states, now totaling about 15 states including Minnesota, SJE Rhombus projects a
decline in the manufacture of mercury switches. MPCA conservatively projects a decline in
emissions of 25% by 2018. The other two facilities have not filed TRI reports for mercury
releases. Further information is needed.
In addition to these three companies, there is a neon lamp industry in the state, a product line that
utilizes mercury. FMS Corporation (FMSneon.com, Minneapolis) manufactures a wide variety
of neon sign components for national and international distribution, and in addition there are a
number of small businesses engaged in neon lamp manufacturing for artistic and commercial
applications. Use and emissions of mercury in this sector have not been studied and warrant
further investigation.
26. General Laboratory Use
Chemical laboratories have traditionally used mercury for a variety of uses, including physical
measurements and chemical analyses. The EPA Mercury Report to Congress (1997) estimated
that in 1995, 2,200 lb. of mercury were volatilized from laboratories nationally. Given that
Minnesota represents 2% of all economic activity nationally, the MPCA estimates that 44 lb. of
mercury were emitted in 1990 and 1995, that this source declined to 22 lb. by 2000, 10 lb. by
2005, and 5 lb. by 2018. The decline is projected to occur as a result of continued education.
27. Volatilization from Dissipative Use
“Dissipative use” is the consumption of mercury in products that are meant to be used and
absorbed into the environment, such as fungicides and preservatives. The largest use of mercury
in this category was mercuric compounds used as a preservative in latex paints, a practice that
was discontinued in 1992. Mercury was legally used in some cosmetics as a preservative (up to
65 ppm) until a Minnesota law banned the sale in January 2008.

wq-iw1-21 April 22, 2008 18
Emissions Incidental to Material Processing
28. Taconite Processing
In Minnesota, the iron in taconite ore is concentrated and marble-size pellets are baked, or
indurated, for ease of handling before they are shipped for smelting outside of the state.
Induration volatilizes virtually all of the mercury that is present in the concentrate. For this
volatilization estimate, emission factors (lb. per million long ton) are calculated from Jiang et al.,
2000 (“Mercury Emissions from Induration of Taconite Concentrate Pellets – Stack Testing
Results from Facilities in Minnesota.” A presentation at the U.S. Environmental Protection
Agency conference, Assessing and Managing Mercury from Historic and Current Mining
Activities, San Francisco, Calif., November 28-30, 2000.).
Table 19
Facility 2005 2010 2018
Northshore Mining Co - Silver Bay 7.3 7.3 7.3
US Steel Corp - Minntac 185.3 185.3 185.3
United Taconite LLC - Thunderbird Mine 1.1 1.1 1.1
Northshore Mining Co - Babbitt 0.1 0.1 0.1
Hibbing Taconite Co 227.1 227.1 227.1
Ispat Inland Steel Mining - Minorca 33.4 33.4 33.4
US Steel - Keewatin Taconite 146.9 105.8 105.8
United Taconite LLC - Fairlane Plant 133.6 133.6 133.6
Minnesota Steel Industries (MSI) 0.0 77.0 77.0
Mesabi Nugget 0.0 70.0 70.0
Total 734.8 840.6 840.6
Note: Keewatin Taconite had pollution-control equipment installed in Oct 2005, which reduces Hg emissions by
28% after 2005
The following mining projects that have the potential to emit mercury have been proposed but
have not yet received a permit (and are not included in the emission calculations):
Table 20
Project Type Start-up date Potential Hg
emissions (lb) Status
Polymet Mining 2012 8 Env. Review
Keetac expansion Mining 2013 est. 49 est. Announced
Mesabi Nugget II Mining ? ? Announced
29. Thermal Treatment of Soil
An average of 5,000 tons of surface soil are heated annually in Minnesota to remove organic
contaminants as a method of soil remediation. A concentration of 0.08 ppm of mercury is
assumed in the soil, and it is assumed that all of the mercury in the soil is emitted to the
atmosphere, releasing about 0.8 lb.

wq-iw1-21 April 22, 2008 19
Difficult to Categorize (Is the mercury from fuel or materials?)
These four subcategories, totaling about 25 lb., are new to the mercury emission inventory,
appearing as output from the MPCA’s air toxics emission inventory. MPCA staff will
investigate these categories to determine if emissions are mostly associated with energy
consumption or material processing. With that knowledge, it may be appropriate to reassign the
emissions to one of the three major categories above, resulting from Energy, Purposeful Use, or
Material Processing. In addition, it may be possible to project time trends.
30. Asphalt Manufacturing
This category was responsible for the emission of 4.3 lb. of mercury in 2005, based on U.S.
Environmental Protection Agency (U.S. EPA) emission factors from plants that prepare hot
asphalt. In the plants tested by the U.S. EPA, it is not clear whether the mercury originated in
the raw materials or the fuel that was used to heat the materials. With further investigation, it
should be possible to assign these emissions to either of two major categories in this mercury
emission inventory, Incidental to Energy Production or Emissions Incidental to Material
Processing.
31. Agriculture, Food and Kindred Products
This category was responsible for the emission of 1.1 lb. of mercury in 2005, based on U.S. EPA
fugitive emission factors for activities classified under SCC code 30288801, which is usually
applied to facilities that handle grain. With further investigation, it should be possible to assign
these emissions to either of two major categories in this mercury emission inventory, Incidental
to Energy Production or Emissions Incidental to Material Processing.
32. Mineral Products
This category was responsible for the emission of 13.8 lb. of mercury in 2005, based on U.S.
EPA emission factors for activities classified under SCC codes 30588801 (fugitive dust
emissions, 10.0 lb.), 30501049 (wind erosion, 2.41 lb.), and 30500311 (firing of bricks, 1.42 lb.).
With further investigation, it should be possible to assign these emissions to either of two major
categories in this mercury emission inventory, Incidental to Energy Production or Emissions
Incidental to Material Processing.
33. Miscellaneous Industrial Processes
This category was responsible for the emission of 0.2 lb. of mercury in 2005, based on U.S.
EPA emission factors for activities classified under SCC code 39999999, for miscellaneous
industrial processes.
34. Wood, Pulp and Paper, and Publishing Products
This category was responsible for the emission of 5.1 lb. of mercury in 2005, based on U.S.
EPA emission factors for activities classified under SCC code 30700104 (emissions from Boise
Cascade recovery furnace, 3.6 lb.), SCC code 30701010 (Oriented strandboard rotary dryer, 1.1
lb.), and SCC code 30700106 (Lime Kiln, 0.4 lb.). With further investigation, it should be
possible to assign these emissions to either of two major categories in this mercury emission
inventory, Incidental to Energy Production or Emissions Incidental to Material Processing.


Appendix 6
GUIDELINES FOR NEW AND MODIFIED
MERCURY AIR EMISSION SOURCES

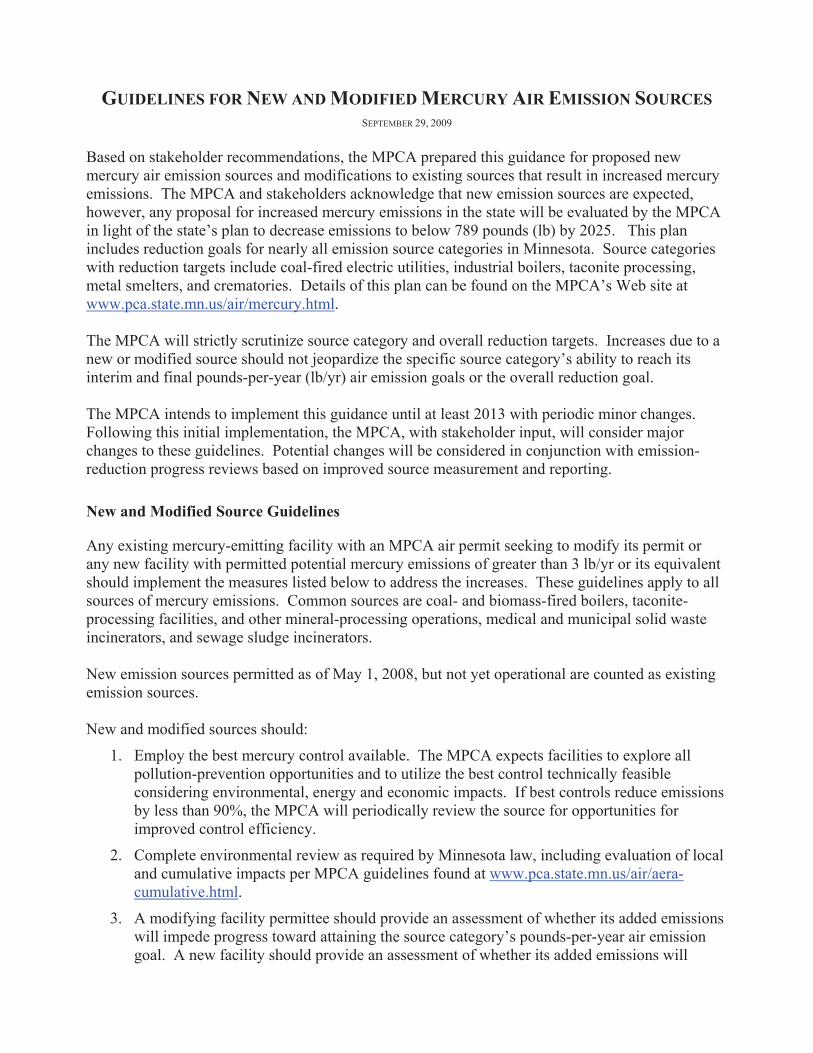
GUIDELINES FOR NEW AND MODIFIED MERCURY AIR EMISSION SOURCES
SEPTEMBER 29, 2009
Based on stakeholder recommendations, the MPCA prepared this guidance for proposed new
mercury air emission sources and modifications to existing sources that result in increased mercury
emissions. The MPCA and stakeholders acknowledge that new emission sources are expected,
however, any proposal for increased mercury emissions in the state will be evaluated by the MPCA
in light of the state’s plan to decrease emissions to below 789 pounds (lb) by 2025. This plan
includes reduction goals for nearly all emission source categories in Minnesota. Source categories
with reduction targets include coal-fired electric utilities, industrial boilers, taconite processing,
metal smelters, and crematories. Details of this plan can be found on the MPCA’s Web site at
www.pca.state.mn.us/air/mercury.html.
The MPCA will strictly scrutinize source category and overall reduction targets. Increases due to a
new or modified source should not jeopardize the specific source category’s ability to reach its
interim and final pounds-per-year (lb/yr) air emission goals or the overall reduction goal.
The MPCA intends to implement this guidance until at least 2013 with periodic minor changes.
Following this initial implementation, the MPCA, with stakeholder input, will consider major
changes to these guidelines. Potential changes will be considered in conjunction with emission-
reduction progress reviews based on improved source measurement and reporting.
New and Modified Source Guidelines
Any existing mercury-emitting facility with an MPCA air permit seeking to modify its permit or
any new facility with permitted potential mercury emissions of greater than 3 lb/yr or its equivalent
should implement the measures listed below to address the increases. These guidelines apply to all
sources of mercury emissions. Common sources are coal- and biomass-fired boilers, taconite-
processing facilities, and other mineral-processing operations, medical and municipal solid waste
incinerators, and sewage sludge incinerators.
New emission sources permitted as of May 1, 2008, but not yet operational are counted as existing
emission sources.
New and modified sources should:
1. Employ the best mercury control available. The MPCA expects facilities to explore all
pollution-prevention opportunities and to utilize the best control technically feasible
considering environmental, energy and economic impacts. If best controls reduce emissions
by less than 90%, the MPCA will periodically review the source for opportunities for
improved control efficiency.
2. Complete environmental review as required by Minnesota law, including evaluation of local
and cumulative impacts per MPCA guidelines found at www.pca.state.mn.us/air/aera-
cumulative.html.
3. A modifying facility permittee should provide an assessment of whether its added emissions
will impede progress toward attaining the source category’s pounds-per-year air emission
goal. A new facility should provide an assessment of whether its added emissions will

impede progress in attaining the source category goal, if applicable, or the statewide goal if
the new source is not in an existing source category.
4. If actual emissions from a new or modified facility are greater than 3 lb/yr, the facility
permittee is expected to arrange for a reduction from existing Minnesota sources equal to the
new actual emissions. The MPCA will refer to these as “equivalent reductions” if they are
beyond those otherwise required in the state’s mercury emission reduction plan for existing
sources. Equivalent reductions can also be accomplished by reducing emissions ahead of
the schedule established in the state’s Implementation Plan.
5. If equivalent mercury reductions from another facility in Minnesota cannot be identified, a
new or modified facility permittee may propose alternative mitigation strategies in lieu of an
equivalent in-state air emission reduction. The MPCA views this approach as a last resort
after all other equivalent reduction possibilities have been fully explored. Alternative
mitigation strategies should demonstrate an environmental benefit related to mercury and
should be consistent with the objectives of the TMDL. Alternative mitigation strategies may
include air emission reductions from sources located outside of the state.
6. During permitting, the new or modified facility permittee should submit a plan to the MPCA
describing the facility’s specific plan for reductions described in 1 through 5 above. Plan
guidance and instructions are on the MPCA Web site at
www.pca.state.mn.us/air/permits/forms.html#9.
Implementation and Evaluation
The MPCA will issue permits with enforceable conditions for new or modified sources based on the
facility’s plan. Public comment on the plan may be sought during the environmental review process
and/or during permitting. The MPCA may also use other enforceable documents, such as
compliance agreements or administrative orders, to achieve the reductions outlined in the facility’s
plan. Facilities should be able to provide the agency with assurance that equivalent reductions can
be secured for the entire potential to emit, if greater than 3 lb, even if expected actual emissions are
below 3 lb.
New and modified facilities not required to obtain an MPCA air emissions permit will be handled
on a case-by-case basis applying a similar approach to 1 through 6 above. The MPCA will consider
if additional requirements are needed for unpermitted sources after emissions are reported to the
MPCA and published in 2013.
At least every three years, coinciding with preparation of the MPCA air toxics inventory and
improved mercury reporting based on pending rule-making, the MPCA, with stakeholder input, will
review progress in meeting source category reduction targets and the overall target. If sufficient
progress is not made, the MPCA will implement measures to achieve reductions and will consider
adjusting these guidelines or establishing rules to specify additional requirements for new and
expanding facilities. A major review of this policy will occur in 2013 at the latest.

Appendix 7
Monitoring and Assessment Program
for Minnesota’s
Mercury TMDL Implementation (MAP-Hg)


Mo
nit
ori
ng
an
d A
ss
es
sm
en
t P
rog
ram
fo
r M
inn
es
ota
’s M
erc
ury
TM
DL
Im
ple
me
nta
tio
n
(MA
P-H
g;
MP
CA
, D
ec
em
be
r 1
8,
20
08
)
So
urc
es o
f M
erc
ury
A
tmo
sp
heri
c P
roces
se
s
Wate
r an
d L
an
d U
se
Me
rcu
ry B
ioa
va
ila
bil
ity
an
d F
oo
d W
eb
E
nvir
on
men
tal
Re
vie
w
an
d R
isk A
ss
ess
men
t
Issue
Imp
lem
enti
ng
red
uct
ion
stra
tegie
s an
d t
rack
ing
pro
gre
ss
in a
chie
vin
g t
he
TM
DL
emis
sio
n g
oa
l o
f 7
89
lb
requir
es a
ccura
te d
ata
from
ever
y s
ecto
r an
d r
eali
stic
red
uct
ion
tec
hn
olo
gie
s.
Imp
lem
enti
ng
red
uct
ion
stra
tegie
s an
d t
rack
ing
pro
gre
ss i
n a
chie
vin
g t
he
TM
DL
em
issi
on
go
al
of
78
9
lb r
equir
es a
ccu
rate
dat
a fr
om
ever
y s
ecto
r an
d r
eali
stic
red
uct
ion
tec
hn
olo
gie
s.
The
MP
CA
nee
ds
to a
sses
s w
ater
s
agai
nst
Min
nes
ota
’s m
ercu
ry W
Q
stan
dard
, an
d t
o u
nd
erst
and w
hic
h
lan
d u
se a
cti
vit
ies
con
trib
ute
to
exce
eden
ces.
O
nly
met
hy
lmerc
ury
bio
accu
mula
tes,
so m
ethy
lmer
cury
co
nce
ntr
atio
n
dat
a ar
e val
uab
le d
esp
ite
ther
e
bei
ng
no W
Q s
tan
dar
d f
or
this
form
.
Mer
cury
would
not
be
a p
rob
lem
if
it
did
n’t
hav
e an
extr
aord
inary
bio
acc
um
ula
tion
fa
cto
r in
fis
h.
Mo
nit
ori
ng
fis
h a
nd
the
aqu
atic
fo
od
chai
n i
s es
sen
tial
fo
r en
vir
on
men
tal
pro
tect
ion
an
d u
nd
erst
and
ing w
hic
h
con
dit
ion
s ex
acer
bat
e fi
sh c
on
tam
inat
ion
.
Alm
ost
ev
ery
new
or
expan
din
g
pro
ject
wit
h m
ercu
ry r
elea
ses
has
the
pote
nti
al t
o e
xac
erbat
e m
ercu
ry
con
tam
inat
ion
of
fish
by
in
crea
sin
g
load
ing o
f m
ercu
ry,
sulf
ate,
org
anic
mat
ter,
(o
r ev
en c
ob
alt)
, o
r by
incr
easi
ng
wat
er l
evel
flu
ctu
atio
n.
Th
e M
PC
A h
as
a r
esp
on
sib
ilit
y t
o
min
imiz
e ac
tiv
itie
s th
at c
on
trib
ute
to f
ish
co
nta
min
atio
n.
Ongoing Program
Fac
ilit
y m
onit
ori
ng w
ith
mer
cury
mo
nit
ori
ng
tra
iler
(sh
ared
wit
h M
ich
. &
‘W
is.)
.
Refi
ne
an
d u
pd
ate
st
atew
ide
mer
cury
em
issi
on
dat
a. W
ork
wit
h s
ecto
rs t
hat
nee
d t
o b
ette
r q
uan
tify
th
eir
emis
sio
ns
of
mer
cury
(e.
g.,
oil
ref
inin
g,
recy
cler
s,
crem
ato
ria)
Su
pp
ort
oth
er M
PC
A
pro
gra
ms
that
red
uce
sou
rces
of
mer
cury
an
d
edu
cate
cit
izen
s (e
.g.,
sch
oo
ls,
haz
ard
ou
s w
aste
,
spil
ls).
Fiv
e p
reci
pit
atio
n s
ites
,
incl
ud
ing n
ew u
rban
sit
e in
Bla
ine
(Jan
. 2
008
).
Set
up
MP
CA
’s t
ota
l
mer
cury
vap
or
monit
or
at
Bla
ine
site
.
Riv
er m
on
ito
rin
g t
hro
ug
h
Mil
esto
nes
(ea
ch r
iver
3 t
imes
per
yea
r: s
pri
ng, su
mm
er,
fall
)
Riv
er m
on
ito
rin
g t
hro
ug
h
Am
bie
nt
Toxic
s P
rogra
m
(Mat
t
Lin
do
n)
Monit
ori
ng o
f M
PC
A
bio
mo
nit
ore
d w
etla
nd
s
Sen
tin
el L
akes
: S
LIC
E
(Su
stai
nin
g L
akes
in
Ch
angin
g
En
vir
on
men
ts)
in 2
00
9,
bo
th
epil
imn
etic
an
d h
yp
oli
mn
etic
sam
ple
s (f
ish
coll
ecte
d 2
00
7)
Ongoin
g f
ish c
oll
ecti
on t
hro
ugh D
NR
Ex
pan
ded
co
llec
tio
n b
ecau
se o
f C
lean
Wat
er L
egac
y f
un
din
g
On
go
ing
fis
h c
oll
ecti
on
th
rou
gh
MP
CA
bio
monit
ori
ng s
taff
fro
m l
akes
& r
iver
s re
mo
ved
fro
m i
mp
aire
d w
ater
s
list
Supp
ort
for
risk
ass
essm
ents
of
new
pro
ject
s; s
upp
ort
for
Min
nes
ota
Mer
cury
Ris
k
Est
imat
ion M
od
el (
MM
RE
M)

S
ou
rces o
f M
erc
ury
A
tmo
sp
heri
c P
roces
se
s
Wate
r an
d L
an
d U
se
Me
rcu
ry B
ioa
va
ila
bil
ity
an
d F
oo
d W
eb
E
nvir
on
men
tal
Re
vie
w
an
d R
isk A
ss
ess
men
t Issue Investigations
How
much
mer
cury
is
rele
ased
by
crem
ato
ria
; how
can
th
is b
e re
du
ced?
How
much
mer
cury
is
rele
ased
du
rin
g t
he
han
dli
ng,
tran
spo
rtin
g a
nd r
ecy
clin
g o
f
lam
ps
and
oth
er m
ercu
ry-
add
ed p
rod
uct
s; h
ow
can
th
is
be
red
uce
d?
Lak
e se
dim
ent
core
anal
ysi
s in
sup
po
rt o
f
Gre
at L
akes
Sta
tes
mer
cury
dat
a sy
nth
esis
Mea
sure
rea
ctiv
e gas
eous
mer
cury
(R
GM
) in
ru
ral
Min
n.
for
MM
RE
M –
equ
ipm
ent
nee
ded
.
New
tota
l H
g d
epo
siti
on
esti
mat
e via
lak
e se
dim
ent
core
s —
nee
d t
o
com
mis
sion s
tud
y.
Ass
ess
spat
ial
tren
ds
in
dry
dep
osi
tio
n o
f m
ercu
ry,
wh
ich
can
be
of
sim
ilar
mag
nit
ud
e to
mer
cury
in
pre
cipit
atio
n.
Sm
all
Str
eam
s: C
urr
ent
Co
ntr
act
endin
g J
un
e 2
00
9:
Str
eam
s ac
ross
Min
n.
(U o
f M
-
Mar
tin
Tsu
i)
One-
tim
e si
ngle
sam
ple
s fr
om
EP
A n
atio
nal
lak
e su
rvey
,
Nat
ion
al L
ake
Ass
essm
ent
Pro
gra
m (
NL
AP
) (d
one;
Hg d
ata
sum
mar
ized
:
ww
w.p
ca.s
tate
.mn
.us/
pub
lica
tion
s/w
q-n
lap
1-0
2.p
df)
Sto
rmw
ater
co
nst
ruct
ed
wet
lan
ds
eval
uat
ion
(d
on
e:
ww
w.p
ca.s
tate
.mn.u
s/p
ub
liat
ions
/td
r-g
1-0
5.p
df)
Res
erv
oir
flu
ctu
atio
n –
no
rther
n
Min
nes
ota
(M
PC
A h
as
con
trac
ted i
n r
ecen
t y
ears
wit
h
UM
D -
Sore
nse
n)
Wat
er l
evel
flu
ctu
atio
n e
ffec
ts
RE
: b
oth
cli
mat
e ch
ange
and
rese
rvo
ir o
per
atio
n (
e.g.,
VN
P &
SL
RP
)
Opp
ort
unit
y:
bac
kw
ater
of
St.
Cro
ix R
iver
, sy
ner
gy
wit
h U
SG
S
nit
rogen
cy
clin
g s
tudy
Rep
ort
on f
ish t
ren
ds
(co
mp
lete
d 2
00
8).
Re-
eval
uat
e fi
sh-H
g i
mp
airm
ents
fo
r 2
01
0
imp
aire
d w
ater
s li
st
Bio
psy
sam
ple
pil
ot
pro
ject
(co
mp
aris
on
of
bio
psy
sam
ple
s w
ith f
ilet
sam
ple
s)
Gre
at L
akes
Mer
cury
Dat
abas
e an
d a
seri
es o
f p
aper
s th
at f
oll
ow
fro
m i
ts
com
pil
atio
n
Min
nes
ota
Pow
er i
nv
esti
gat
ion
in
to
rese
rvoir
oper
atio
n o
n S
t. L
ouis
Riv
er
(co
ntr
act
wit
h U
niv
. o
f T
oro
nto
)
Sel
eniu
m a
nal
ysi
s o
n e
xis
tin
g f
ish
sam
ple
s (t
o e
val
uat
e m
ercu
ry:s
elen
ium
rati
os)
Eff
ects
of
wat
er l
evel
flu
ctuat
ion
on
mer
cury
bio
avai
labil
ity
An
aly
sis
of
SL
ICE
fis
h-H
g a
nd
wat
er
qu
alit
y d
ata
An
aly
sis
of
stat
ewid
e fi
sh-H
g v
s. w
ater
qu
alit
y d
ata,
lan
d u
se, w
etla
nd
pre
val
ence
,
wet
lan
d t
yp
e
Hg
bio
avai
labil
ity
in s
trea
ms
(e.g
., f
ate
of
Hg
ass
oci
ated
wit
h T
SS
an
d D
OC
)
Infl
uen
ce o
f w
ater
qual
ity
on H
g
bio
avai
labil
ity
(re
lati
on
ship
bet
wee
n
chan
ge
in t
rop
hic
sta
tus
and f
ish
-Hg
)
In
fluen
ce o
f la
nd
scap
e ch
ang
es o
n H
g
bio
avai
labil
ity
(e.
g.,
min
ing,
log
gin
g,
fire
,
chan
ge
in w
etla
nd
s)
Stu
die
s th
at i
den
tify
lim
itin
g
con
centr
atio
ns
of
the
thre
e es
sen
tial
ing
red
ien
ts f
or
mer
cury
met
hy
lati
on
:
sulf
ate,
org
anic
car
bo
n,
and i
no
rgan
ic
mer
cury
Tim
e se
nsi
tive
op
po
rtu
nit
y:
Monit
or
reco
ver
y a
fter
fin
al
add
itio
n (
occ
urr
ed f
all
20
08
) (O
n-
go
ing
ex
per
imen
t si
nce
20
01at
Mar
cell
Ex
per
imen
tal
Fo
rest
).
Most
im
port
ant:
Monit
or
pore
wat
er i
n S
6 w
etla
nd
, an
d c
om
par
e
S6 v
s. S
2.
Su
lfat
e st
imu
lati
on o
f m
ercu
ry
met
hy
lati
on (
and e
nh
ance
d
sed
imen
t p
ho
spho
rus
rele
ase)
Su
lfat
e ad
dit
ion
to
wet
lan
d;
con
trac
t en
din
g J
un
e 2
00
9:
Mar
cell
(S
cien
ce M
use
um
of
Min
nes
ota
)
Su
lfat
e fr
om
tac
on
ite
tail
ing
s an
d
pit
s
Sam
pli
ng
no
rth
of
iro
n r
ang
e
(Rai
ny
Riv
er b
asin
) to
eval
uat
e
dis
char
ges
fro
m t
aili
ng
s b
asin
s
Co
ntr
oll
ed e
xp
erim
ents
to
qu
anti
fy e
ffec
ts o
f su
lfat
e o
n
mer
cury
an
d p
hosp
hat
e (l
ab a
nd
/or
fiel
d)
Mo
nit
or
Em
bar
rass
lak
e ch
ain
afte
r su
lfat
e lo
ad d
ecli
nes
Su
lfat
e fr
om
gro
un
dw
ater
usa
ge,
dis
char
ge
to s
urf
ace
wat
er
Dev
elop
Min
nes
ota
mo
del
that
wo
uld
rev
eal
loca
lly
ele
vat
ed
no
nat
mo
sph
eric
so
urc
es o
f
mer
cury
(e.
g.,
dis
char
ge
or
con
tam
inat
ed s
edim
ent
Sulf
ate
load
ing
; co
ntr
act
end
ing
Jun
e 2
00
9:
Tac
on
ite
sulf
ate
— S
t.
Lo
uis
Riv
er (
DN
R-B
ern
dt)
Item
s m
ark
ed w
ith
the
sym
bo
l a
re b
ein
g c
arri
ed o
ut.
Item
s m
ark
ed w
ith
the
sym
bo
l c
urr
entl
y l
ack
suff
icie
nt
sup
po
rt t
o b
e as
sure
d o
f im
ple
men
tati
on.

Directives for Monitoring and Assessment Program
for Minnesota’s Mercury TMDL Implementation (MAP-Hg)
1. MPCA 2008 Strategic Plan
(See www.pca.state.mn.us/publications/reports/strategicplan.html.)
Goal A.3 Minnesota reduces its contribution to regional, national and global air pollution.
Objective A3a) Reduce mercury emissions from Minnesota air sources to meet TMDL air
emission target of 789 lbs/year. Track concentrations of mercury in fish tissue to better
understand how changes in state, national and international mercury emissions affect fish
mercury concentrations.
Goal W.2 Assess the chemical, physical and biological integrity of Minnesota’s lakes, streams
and wetlands to identify if designated uses are being met, and provide information on the
condition of waters.
Objective W2a) By December 31, 2017, sample and assess Minnesota’s 81 major watersheds
to determine if they meet designated aquatic life, recreation and consumption beneficial uses,
and to identify pollutant load trends.
Goal W.3 Protect and improve the chemical, physical and biological integrity of Minnesota’s
lakes, streams and wetlands.
Objective W3g) Restore impaired waters to meet designated uses.
2. Minnesota Statewide Mercury Total Maximum Daily Load, March 27, 2007
(See www.pca.state.mn.us/publications/wq-iw4-01b.pdf.)
10 Monitoring & Research Plan
Monitoring to detect environmental change to changing atmospheric mercury deposition will follow the
recommendations of Mason et al. (2004). Monitoring options that are being considered include the following:
• Fish contaminant monitoring of previously sampled lakes and rivers (this is ongoing)
• Sentinel lakes: 4-5 lakes around each of the MDN sites in Minnesota; monitor air, water, & fish tissue
(biopsy)
• Lake sediment cores and recalculation of mercury deposition for representative lakes
• NPDES upstream/downstream monitoring for traditional wasteload allocation studies
• Continued air monitoring for wet deposition; new monitoring stations required for dry deposition and
urban areas
The MPCA and its research partners in Minnesota are studying factors affecting mercury contamination of
fish. Widely cited Minnesota research in the 1990s analyzed lake sediment cores to estimate historical
mercury deposition and its sources. Current work is focused on understanding the local factors, such as land
cover effects and food chain structure, which might explain the observed variability in mercury
bioaccumulation among lakes. Another research project in the state is testing the effect of increased sulfate
deposition on mercury methylation in a wetland (Jeremiason et al. 2003). The outcomes of these studies will
help refine the implementation of the mercury TMDLs.

3. Mercury TMDL Response to Comments
(See www.pca.state.mn.us/publications/wq-iw4-01k.pdf.)
[J] Contamination of land; [AC] Proportionality principle challenged; [AE] Re-release from
sediments; [AJ] Stormwater issues
The proportionality principle is described in Section 5.2 of the draft Mercury TMDL. The agency
has adopted the principle as a tenet of the TMDL because it is the best available science on the
relationship between atmospheric deposition and mercury bioaccumulation in fish. We are not aware
of any published studies that contradict the proportionality principle and the commenters have not
provided any additional information to contradict it. There were several comments related to the
proportionality principle that challenged the draft Mercury TMDL’s focus on atmospheric deposition
mercury reductions as the way to achieve the target mercury concentration in fish and the
commenters proposed other issues that should be addressed as part of the TMDL.
The issues include water management, contamination of land, re-release from sediments, and
stormwater. These inter-related issues are not included in the TMDL because they are not mercury
sources for TMDL allocation; rather they are processes that influence the fate and transport of
mercury and for that reason they will be addressed in the TMDL implementation. They should not be
included as sources of mercury that need to be reduced as part of the allocation process.
An analogy would be phosphorus that originated from a wastewater treatment plant and was then
absorbed by algae. When the algae die, the phosphorus is released. It would be inappropriate to
claim that algae are the ‘source’ of phosphorus; they are just way stations as the phosphorus moves
downstream. That said, the Agency is aware that these areas can be intermediary sources and should
be an important part of implementation planning. Erosion management and stormwater quality must
be considerations for implementation planning.
4. Strategy Framework for Implementation of Minnesota’s Statewide Mercury TMDL, July 7, 2008
(See www.pca.state.mn.us/air/mercury-reductionplan.html.)
Monitoring and Reporting
An accurate understanding of emission sources in the state is needed to verify reduction strategies,
track individual facility emissions and report overall progress in meeting emission reduction goals.
Watershed Management
Scientific studies indicate that manipulation of surface water levels and some land uses may result in
increased concentrations of methyl mercury in water and fish. Although the vast majority of the
waters in the state are not subject to water level manipulation practices, the potential effects on
mercury concentrations in those water bodies that are subject to these practices should be addressed
as part of the TMDL implementation process.
• The issue needs more analysis and on-going consideration by federal, state and local units of
government whose work includes watershed management and management or regulation of
water resources in the state.

• Federal, state, and local agencies should participate in research efforts to better understand
and quantify the potential effects of watershed and stormwater management on mercury
methylation and mercury contamination of fish.
• Scientific literature addressing this concern should be reviewed and a summary should be
incorporated into the Mercury TMDL Implementation Plan and other programs as
appropriate.
• Develop an agenda and timeline for additional research if needed.
5. U.S. EPA Approval Letter of Minnesota’s Statewide Mercury TMDL, March 27, 2007
(See www.pca.state.mn.us/publications/tmdl-mercury-att1.pdf.)
Monitoring Plan to Track TMDL Effectiveness
U.S. EPA’s 1991 document, Guidance for Water Quality-Based Decisions: The TMDL Process (U.S.
EPA 440/4-91-001) recommends a monitoring plan to track the effectiveness of a TMDL.
The TMDL recognizes the need for monitoring and further study of factors affecting mercury
contamination of fish tissue. On page 42 of the TMDL Report, the State identifies five monitoring
options that will be considered by the State. The TMDL Report also identifies two areas of current
study related to better understanding the impacts of local factors on mercury contamination. U.S.
EPA encourages the State to include more specific discussion of future monitoring efforts in the
State’s implementation plan for these TMDLs. If future monitoring efforts and the results of current
studies provide new information that would change any assumptions used to establish these TMDLs,
or which would change the allocations in these TMDLS, the State should take measures to revise the
TMDLs as soon as possible or if more appropriate, develop water body specific TMDLs.
Assessment: U.S. EPA finds the Mercury TMDLs submitted by the State of Minnesota adequately
describes recommendations for future monitoring to track the effectiveness of the TMDLs, although
U.S. EPA is not approving any recommendations for monitoring contained in this TMDL Report or
any other aspect of Minnesota’s monitoring program through this decision.
[Note: U.S. EPA refers to “these TMDLs” because there are officially two mercury TMDLs in the Statewide
Mercury TMDL report: NE and SW regional TMDLs]
6. MPCA Strategy to Address Indirect Effects of Elevated Sulfate on Methylmercury
Production and Phosphorous Availability, October 2006
(See http://intranet.pca.state.mn.us/programs/wqpermits/npdes-s04-strategy.doc.)
Although there is evidence that elevated sulfate loading can increase methylmercury production and
phosphorus mobilization, it is premature to develop specific sulfate concentration limits or other
regulatory responses based on these effects. The deleterious effects of sulfate may be restricted to
certain areas of the state, certain background sulfate concentrations, or other environmental
controlling factors. These factors will be explored in a multi-year data collection effort combined
with ongoing data analysis. It is anticipated that sensitive areas of the state will be identified and
appropriate controls on sulfate discharges will be developed if necessary. The primary focus of the
strategy is to pursue research to further understand impacts from sulfate on methylmercury

production and phosphorus mobilization and to use the research to guide the future need for
additional requirements or controls in environmental review and NPDES permits. This strategy was
approved by the MPCA Risk Managers on August 28, 2006 and by the MPCA WQ Policy Forum on
October 19, 2006.