implementation of total quality management to improve the
TRANSCRIPT
European Scientific Journal April 2016 /SPECIAL/ edition ISSN: 1857 – 7881 (Print) e - ISSN 1857- 7431
146
Implementation Of Total Quality Management To Improve The Poultry Feed Manufacturing Processes
Salloom A. Al-Juboori Faculty of Engineering, Muta'h University, Al- Karak, Jordan
Abstract This work is aimed to apply the basic concepts of Total quality Management (TQM) on process improvement of feed mill plant and to show the practical benefits of implementation of these concepts to improve the feed quality of poultry feed manufacturing processes, which suffers from low quality feed in a poultry enterprise as a field study. A special focus is made on the use of the basic quality tools to improve the production process by increasing Pellet Durability Index (PDI), where the 10 days durability index of the product has been monitored and analyzed using cause-effect-diagram and control-charts techniques. The analysis shows clearly that the feed producers can be effectively improved their production processes, when the grinding was changed from 6 mm and 8 mm sieves to 3 mm and 4 mm sieves with a moisture of 12%, the improvement was about 13 to 14%.While when the moisture is raised from 12% to 17%, the PDI% has increased to about 6 to 8%. Consequently, these improvements will save money, materials and make their processes sustainable with high quality.
Keywords: Pellet, TQM tools, PDI, Feed Particles size, Moisture Abbreviations
PDI = Pellet Durability Index, TQM= Total Quality Management, PDCA= Plan, Do, Check and Act, SPC= Statistical Process Control, UCL= Upper control limit LCL= Lower control limit USL= Upper specification limit LSL= Lower specification limit Problem Analysis
There are three main factors which have a great impact on the feed process [1, 2 and 3], these are:

European Scientific Journal April 2016 /SPECIAL/ edition ISSN: 1857 – 7881 (Print) e - ISSN 1857- 7431
147
(a) Pellet In the Feed mill plant (the field study of this work), the production consists
of five main work stages: the Receiving, grinding, mixing, pellet and warehouse. The factory produces different type of poultry feed (Starter, Grower and Finisher). Pellet process represents the heart of the manufacturing process. Pellet can be generally defined as an extrusion type thermoplastic moulding operation in which the finely reduced particles of the feed ration are formed into a compact, easily handled, pellet. It is thermoplastic in nature because the proteins and sugars of most feed ingredients become plastic when heated and diluted with moisture. The moulding portion of the operation occurs when this heated, moistened feed is forced into a die, where it is moulded into shape and held together for a short time. It then exits as an extruded product. Pressure for both moulding and extrusion comes from pellet mill rolls which force the feed through the holes. There are many financial advantages of the pellet feed product, which are: * The combination of moisture, heat and pressure acting on natural starches in feed Ingredients produce a degree of gelatinization. This enhances the binding qualities of The starch-containing ingredients resulting in better pellet quality. This improved feed Conversion advantage is particularly evident in the Poultry Industry. * Pellet feed prevents selective feeding on favoured ingredients in a formulation. Since all Ingredients have been moulded together; the animal must eat a balanced formulation, Minimizing waste and improving feed conversion. * Pellet prevents segregation of ingredients in handling or transit. With medicated feeds And concentrates, this avoids disproportionate concentrations of micro-ingredients and Resultant ill effects. * Pellet has been shown to reduce moulds in feed, again increasing feed conversion. * Pellet increases bulk density, particularly on alfalfa, beet pulp and gluten feeds. For instance, the alfalfa pellet, the bulk density can be increased by a ratio of 2 to 1. Densification, of course, is depending on product characteristics being pellet. In baggy, the product of the sugar is an extraction process will get a densification from 8 to 32 pounds per cubic foot. The advantages in storage and shipping are self-evident: higher pay loads and reduced Bin requirements. * Round, densities pellets have much better handling characteristics, which is simplify bulk handling. Often it would be impractical to handle ingredients in bins if they were not a Pellet. There are also instances where extremely free flowing ingredients will be flood out of bins. Pellet produces a form which can be easily controlled.
European Scientific Journal April 2016 /SPECIAL/ edition ISSN: 1857 – 7881 (Print) e - ISSN 1857- 7431
148
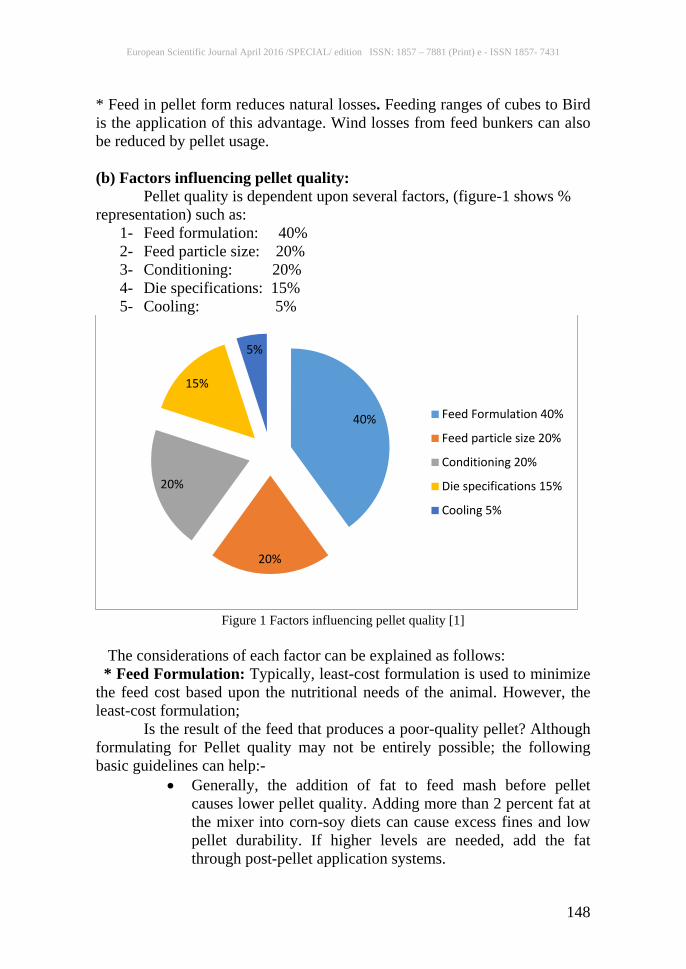
* Feed in pellet form reduces natural losses. Feeding ranges of cubes to Bird is the application of this advantage. Wind losses from feed bunkers can also be reduced by pellet usage. (b) Factors influencing pellet quality: Pellet quality is dependent upon several factors, (figure-1 shows % representation) such as:
1- Feed formulation: 40% 2- Feed particle size: 20% 3- Conditioning: 20% 4- Die specifications: 15% 5- Cooling: 5%
Figure 1 Factors influencing pellet quality [1]
The considerations of each factor can be explained as follows: * Feed Formulation: Typically, least-cost formulation is used to minimize the feed cost based upon the nutritional needs of the animal. However, the least-cost formulation;
Is the result of the feed that produces a poor-quality pellet? Although formulating for Pellet quality may not be entirely possible; the following basic guidelines can help:-
• Generally, the addition of fat to feed mash before pellet causes lower pellet quality. Adding more than 2 percent fat at the mixer into corn-soy diets can cause excess fines and low pellet durability. If higher levels are needed, add the fat through post-pellet application systems.
40%
20%
20%
15%
5%
Feed Formulation 40%
Feed particle size 20%
Conditioning 20%
Die specifications 15%
Cooling 5%
European Scientific Journal April 2016 /SPECIAL/ edition ISSN: 1857 – 7881 (Print) e - ISSN 1857- 7431
149
• Increasing protein and fibber contents in feed tends to improve pellet quality
• Certain feed ingredients contain “natural” binding properties that help to improve pellet quality. Examples include wheat, barley, canola, whey and blood plasma.
* Feed particles size: Generally, smaller mash particle size will enhances the pellet quality since the material has a larger surface area that allows heat and moisture from steam to more quickly and thoroughly penetrates the particle. Smaller particles also have more surface area to adhere and bind to other particles in the pellet. However, the cost of grinding to obtain smaller particle sizes needs to be weighed against the benefits of improved pellet quality. The range of the optimal particle size for corn-soy poultry dies from a cost-benefit stand point may be in of 650 to 700 micron range. * Conditioning: The conditioning process influences the pellet quality are more than die specifications. In contrast, thicker dies that lower production rates often are used in an attempt to improve pellet quality. The some guidelines of conditioning to be considered are:-
• Generally, increasing the conditioner retention time improves pellet quality. The longer retention time improves heat and moisture absorption in feed. Lengthen the retention times of an existing conditioner by adjusting pick angles or reducing the conditioner shaft speed.
• Steam pressure does not influence pellet quality. The thermodynamic properties of low- and high-pressure steam are very similar. To optimize energy costs, maintain steam pressures only high enough to provide the steam quantity necessary to reach desired conditioning temperatures and for adequate condensation removal/return.
• Typically, steam cannot provide more than 6 percent moisture to feed during the conditioning process. Each percent of moisture added to feed through steam raises the mash temperature about 23 F0.
• Steam quality – the percentage of steam in the vapour phase – is important to pellet durability and production rates. Research has shown that conditioning feed with 70 to 80 percent steam quality optimizes pellet durability. High-quality steam has more energy to raise mash temperature than lower-quality steam that contains condensation. Steam quality determines the maximum mash temperature that can be reached during conditioning because of moisture limits.
European Scientific Journal April 2016 /SPECIAL/ edition ISSN: 1857 – 7881 (Print) e - ISSN 1857- 7431
150
*Pellet Die Material and Specifications: Understanding the terminology used to describe dies is important when choosing die specifications. Die working area is defined as the area between the two inside die grooves. This working area increases as die width and diameter increase. Die working area is important because different feeds and ingredients require specific amounts of time in the die hole (die retention time) to be able to bind together to form a pellet. Larger die working areas provide more retention time to form pellets, reduce power consumption per ton of feed pellet and improve production efficiencies. * cooling: Poor cooling reduces pellet durability. Proper pellet cooling depends upon adequate airflow and cooler retention time. Poor pellet cooling in vertical and horizontal coolers often is attributable to airflow restrictions caused by plugged cooler screens, trays or air inlets. Product build-up in cooler ductwork also can cause problems in all types of coolers. Increasing feed bed depth can increase retention time in horizontal coolers. Typically, if greater retention time is needed, adding additional height to cooler walls or horizontal sections is done to increase the cooler’s surface area.
(a) Pellet Durability Index (PDI %) Test: Continuous monitoring and measurement of pellet and cube quality by the pellet mill operator will help assure that a more consistent quality product is produced and shipped from the manufacturing plant. This test is used to measure pellet and cube quality as will be described below with the results logged and compared on the daily production record. Tests can be performed on each daily production run and comparisons between like runs can be made to help establish and determine minimum standard of quality. Changes in ingredients, formulations, equipment, or production methods can then be tested and compared to the minimum standards that are established for that particular finished pellet product. As improvements are made in pellet quality, as measured by higher PDI %, then the minimum quality standards can be increased along with increased customer satisfaction with the finished product.
(b) Implementation of Quality Tools: In this section, a review of the basic concepts of process improvement is made followed by a brief description of the seven basic quality tools. A discussion of the published technical literature on the use of these tools for the improvement of the construction processes is then presented [4,5,6,7,8,9,10,11,14,16,and 17]. * Basic Concepts of Continuous Process Improvement: A fundamental
question is always raised in front of business leaders "Do we really need to improve our processes? Edwards Deming [12], in his book "out of the crisis" published in 1986; answered this question in his famous chain reaction shown in figure 2. The benefits from quality and process improvements to all types of organizations are including the construction business:-

European Scientific Journal April 2016 /SPECIAL/ edition ISSN: 1857 – 7881 (Print) e - ISSN 1857- 7431
151
Costs decrease
because of less reworks, fewer mistakes, fewer
delays, nags, better use of machine time and materials
Improve Quality
Productivity
Improve
Capture the market with
better quality and lower price
Stay in business
Provide
Jobs and more
jobs
Figure 2 Deming’s chain reaction [16]
# How to ensure Continuous process improvement? The most common process of continuous improvement is the PDCA Cycle, which was first developed by Walter Shewhart in the 1931 [20], and promoted effectively from the 1950s by quality guru Dr Edwards Deming [sited in7], as a strategy to achieve breakthrough improvements in processes. The four steps in the cycle which is also known as the Deming Wheel are as shown on figure 3.
Figure 3 The Deming’s Wheel (PDCA Cycle) [7]
Seven phases have been identified by quality scholars to implement the PDCA cycle in the improvement process of an organization: Phase 1 - Identify the Opportunity for improvement
European Scientific Journal April 2016 /SPECIAL/ edition ISSN: 1857 – 7881 (Print) e - ISSN 1857- 7431
152
Phase 2 - Analyze the Current Process Phase 3 - Develop Optimal Solutions Phase 4 - Implement Changes Phase 5 - Study the Results Phase 6 - Standardize the Solution
Phase 7- Plan for the Future # The Seven basic Quality Tools: Once the quality improvement process is understood, the addition of quality tools can make the process proceed in a systematic manner. Many quality tools are available for quality professionals for this purpose. Many organizations use total quality management (TQM) tools to identify, analyze and assess qualitative and quantitative data that are relevant to their processes [7, 11, 12, and 15]. These tools can be generally classified to three major categories namely the basic seven quality tools, the seven new tools for management and Planning and other tools. The seven basic quality tools are simple tools that can be used by any professional to ease the quality improvement process. These are: flowcharts, check sheets, Pareto diagram, cause and effect diagram, histogram, scatter diagram, and control charts. These tools were originally developed by Kaoru Ishikawa [14], one of the pioneers of the Japanese quality movement. Ishikawa's original list did not include flowcharts; instead, it had graphs as one of the tools. These seven basic tools have been considered a part of Statistical Process Control (SPC), a quality management system that uses a set of tools to analyze, control, manage, and improve process quality. But not all seven tools are quantitative, let alone statistical. The flowchart is simply a visual description of a process. A cause-and-effect diagram is a brainstorming/based problem/solving procedure. Check sheets and Pareto diagrams are simply commonsense tools. Histogram, scatter diagram, and control charts are the only statistical tools in the list. Quality Pioneer Ishikawa believed that 95% of quality-related problems in any organization can be solved with these basic tools. This statement has been proven by many organizations and researchers as it will be shown later. The key to their success in problem-solving and process improvement initiatives are their simplicity, ease of use and their graphical nature. The tools were originally meant to make process analysis less complicated for the average factory worker in Japan, but now they constitute standard analytical tools to analyze quality problems and develop and identify optimum solutions and standardise them. They can easily be taught to any member of the organization. These tools have been widely used in manufacturing and services organizations embracing process/improvement initiatives within the Total Quality Management (TQM) and Six Sigma approaches or the excellence models.
European Scientific Journal April 2016 /SPECIAL/ edition ISSN: 1857 – 7881 (Print) e - ISSN 1857- 7431
153
A brief description of these tools will be discussed as follows:- * Flow-chart: A graphical display of the process steps in proper sequence. A flowchart shows all process steps under analysis by the quality improvement team, identify critical process points for control, suggest areas for further improvement, and help, explain and solve problems. When to use: When a team is working on process improvement, it is first necessary for all members of the team to have a common understanding of the process. Flowcharts are also a necessary stage in the introduction of ISO 9000. How to use: Having the correct team is essential when drawing a flowchart. It is necessary to involve all those who are concerned with the process .There are a simple procedure to follow when drawing a flowchart: 1- Brainstorm all the individual activities that make up the process. 2 -List the activities in the order in which they are done. 3 -Using wallpaper or some other large sheets of paper, then draw out the activities in schematic form. 4 - Ask each member of the group in turn whether any of the activities have been missed out and whether he or she agrees with the process as drawn. Then make changes if necessary. 5 -Test the flowchart by taking an example and 'walking it through' the flowchart.
Benefits: Often processes in organizations are not designed, but have evolved over time. Flowcharting allows processes to be challenged, and gaps, duplications and dead ends identified. It therefore leads to process simplification. * Check-sheet: It is a structured, prepared form for collecting and analyzing data. Also it is and a generic tool can be adapted for a wide variety of purposes. When to use: Can be either during problem definition when you are collecting data to find out what is happening, or when you have implemented a solution and you are collecting data to monitor the new situation. How to use: There are five simple steps to draw a check sheet diagram: 1 - Collecting the data to be drawn. 2 - Design the check sheet. 3- Test the check sheet using someone who has not been involved in the design. Let him or her to use the check sheet without assistance. If necessary, it is possible modify the check sheet.
European Scientific Journal April 2016 /SPECIAL/ edition ISSN: 1857 – 7881 (Print) e - ISSN 1857- 7431
154
4 - Design a master check sheet: If more than one person has to be involved in data collection. You will need to bring together all the data collected. The way to do this is to use a master check sheet. 5 - Collect the data. Benefits: By establishing the facts about the incidence of failure, a team can plan to identify the causes of failure and look for ways of removing them. Actions are taken on the basis of evidence, not feeling. Check sheets are an excellent way of involving people in quality improvement. They give a simple method of data collection that can be easily understood and applied in a wide range of areas. * Pareto-chart: To separate the most important causes of a problem from the many trivial. Also, to identify the most important problems for a team to work on Pareto analysis was first used by Wilfred Pareto [sited in 11], an Italian economist. When to use: When a team is analysing data relating to a problem to decide which are the most important factors to be tackled first to have the most impact on the problem. How to use: Pareto analysis is sometimes called the 80/20 rules. This means that 80 per cent of the problems are caused by 20 per cent of the activities and it is this important 20 per cent that should be concentrated on. There are six simple steps involved: 1- List the activities or causes in a table and count the number of times each occurs. 2 - Place these in descending order of magnitude in the table. 3 - Calculate the total for the whole list. 4 -Calculate the percentage of the total that each cause represents. 5 - Draw a Pareto diagram with the vertical axis is showing the percentage and the horizontal axis the activity or cause. The cumulative curve will show the percentage of the cumulative for all causes. 6 -Interpret the results. Benefits: When working in teams it can be difficult to reach agreement when people with different opinions want to follow different courses of action. Pareto analysis brings the facts to the attention of all members of the team to aid decision-making. * Histogram: The most commonly used graph for showing frequency distributions, or how often each different value in a set of data occurs. When to use: At the early stages of problem-solving when a team is trying to find out what is happening. How to use: There are four simple steps involved: 1- Collect the data using a check sheet.

European Scientific Journal April 2016 /SPECIAL/ edition ISSN: 1857 – 7881 (Print) e - ISSN 1857- 7431
155
2- Use the vertical axis to display the number of times each value occurs. 3- Use the horizontal axis to display the values. 4- Interpret the histogram. Different patterns of histogram suggest that the problem being studied has particular characteristics. Patterns reveal when two or more things are being mixed; for example, different ways of processing claims. They also show when data are being censored; for example, when someone is failing to record certain data items. They can also indicate when there is time dependence in the data; for example, when something can take a very long time but when it is impossible to take a short time. Benefits: Assumptions of normality made about data need to be checked before data can be analysed using statistics that depend upon normality. Histograms are a simple visual way of viewing data that highlights non-normal situations. When these are identified, the data can, if necessary, be analysed further. The picture will show the useful advice for the teams trying to establish facts about what is happening. *Cause-and-effect diagram: Also called Ishikawa or fishbone chart [14], which identifies many possible causes for an effect or problem and sorts ideas into a useful categories. When to use: When a team is trying to find potential solutions to a problem and is looking for the root- cause. How to use: There are four steps to constructing a cause and effect diagram. 1- Brainstorm all possible causes of the problem or effect selected for analysis. 2- Classify the major causes under the headings: - Which are materials, methods, machinery, and the manpower? 3- Draw a cause and effect diagram. 4 -Write the effects on the diagram under the classifications chosen. Benefits: When a problem or effect is being analysed, it can be tempting to look for a temporary solution or quick fix that does not solve the problem at all but simply 'gets round' it. Cause and effect analysis allows the problem to be considered fully and all options considered. It also points to possible areas for data collection. * Scatter diagram: It is Graph pairs of numerical data, one variable on each axis, to look for a relationship between process variables.

European Scientific Journal April 2016 /SPECIAL/ edition ISSN: 1857 – 7881 (Print) e - ISSN 1857- 7431
156
When to use: Scatter diagrams are used when a group is trying to test whether a relationship exists between two items - often a cause and effect. How to use: There are four simple stages to draw a scatter diagram: 1- Collect data about the causes and effects. 2- Draw the cause on the horizontal axis. 3- Draw the effect on the vertical axis. 4 -Draw the scatter diagram. Benefits: Scatter diagrams help to bring the facts to bear when discussing the problems and they help to reduce the amount of 'gut feeling' involved within problem. Also they can solve the word of caution. Just because there appears to be a relationship it does not mean that one thing causes another. The relationship might is be fortuitous or through a third unknowns, variable, if a relationship appears to have been found, proof must be sought * Control charts: They are used to identify when the number of defects in a sample of constant size is changing over time. When to use: When monitoring a process to detect changes or, when a change has been made. To process inputs and to find output whether the number of defects or problems is also changed. C- Charts are used when the sample size is constant, or does not vary by more than 25 percent of the average sample size. How to use: There are six simple steps involved:- 1- Collect data showing the number of problems or defects over time. Draw up a table showing the number of defects for each lot number. The number of defects is called "C". The total number of lots is called" M”. 2 -Plot the data from the table onto the C-control chart. The successive lot numbers are shown on the horizontal axis. While the number of defects or problems are shown as C on the vertical axis 3 -Calculate the centre line C-bar. This is calculated as the sum of all the Cs divided by the sum of all the Ns and, it can be written as;
C- Bar = ∑Cs / ∑ Ns 4- Calculate the control limits which are ± 3 about the central line. They are calculated as:-
Upper control limit (UCL) = (C –bar) + 3 √(C- bar) Lower control limit (LCL) = (C –bar) - 3 √(C- bar)
If the lower control limit is less than zero it is taken to be zero. 5- Draw the central line and the control limits on the control chart. 6- Interpret the results.

European Scientific Journal April 2016 /SPECIAL/ edition ISSN: 1857 – 7881 (Print) e - ISSN 1857- 7431
157
Benefits: It can be difficult to separate out random variation (often called common cause or non-assignable variation) from real variation caused by changes to the process. C-Charts give a way to do this for the number of defects or problems with a sample size that is constant. Applications of the Basic Quality Tools in the Feed Manufacturing plant (The present work case study):- As it was mentioned earlier, according to Professor Ishikawa 95% [14] of quality related problems in any organization can be resolved using the seven basic quality tools. Professor Nangana [sited in 4] named these tools as "The Magnificent Seven". These important statements can be proven from the amount and the quality of research papers and articles published by quality professionals and researchers in manufacturing and services. Feed manufacturing organizations are no exception to this flaw, they can greatly improve their processes and solve real problems in the field which hamper their efficiency and lead to customer and client dissatisfaction as shown from recent studies. Recent interest has been shown on the use of control charts to monitor and improve production processes. Poultry organizations worldwide and of course in the Feed manufacturers can continuously improve their processes to meet ISO 9001 requirements and achieve breakthrough improvements and business excellence by a systematic use of the basic quality tools together with the deployment of quality awards standards. The benefits gained by these business organizations fit well with the Deming quality chain reaction discussed in the previous section; just to recall these are: product quality improvement, costs decrease, productivity improvement, defect rate reduction, customer satisfaction and increased profits; all these benefits are obvious targets and even more, reasons for the existence of Poultry field business owners and organizations.
Research Methodology: Feed mill plant has been taken as a case study; this factory is applying a quality inspection system in addition it has ISO 9001since 2003. The study conducted among 10 days with 10 samples (Grower and Finisher Feed) each day, the factory has an old record for the previous pellet process parameters and PDI results, and the losses that are observed in the production process. So the study has focused on using quality tools is relentlessly work on eliminating waste in pellet processes by concentrating on particles size and moisture parameters. The main stages of the present study as follows:
European Scientific Journal April 2016 /SPECIAL/ edition ISSN: 1857 – 7881 (Print) e - ISSN 1857- 7431
158
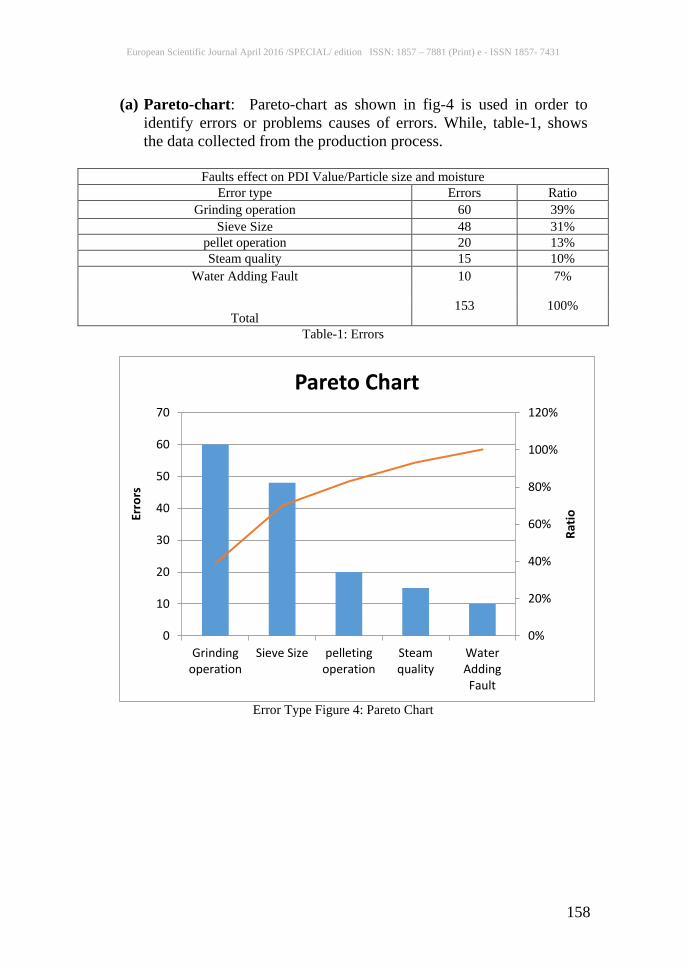
(a) Pareto-chart: Pareto-chart as shown in fig-4 is used in order to identify errors or problems causes of errors. While, table-1, shows the data collected from the production process.
Faults effect on PDI Value/Particle size and moisture Error type Errors Ratio
Grinding operation 60 39% Sieve Size 48 31%
pellet operation 20 13% Steam quality 15 10%
Water Adding Fault 10 7%
153 100% Total Table-1: Errors
Error Type Figure 4: Pareto Chart
0%
20%
40%
60%
80%
100%
120%
0
10
20
30
40
50
60
70
Grindingoperation
Sieve Size pelletingoperation
Steamquality
WaterAddingFault
Ratio
Erro
rs
Pareto Chart
European Scientific Journal April 2016 /SPECIAL/ edition ISSN: 1857 – 7881 (Print) e - ISSN 1857- 7431
159
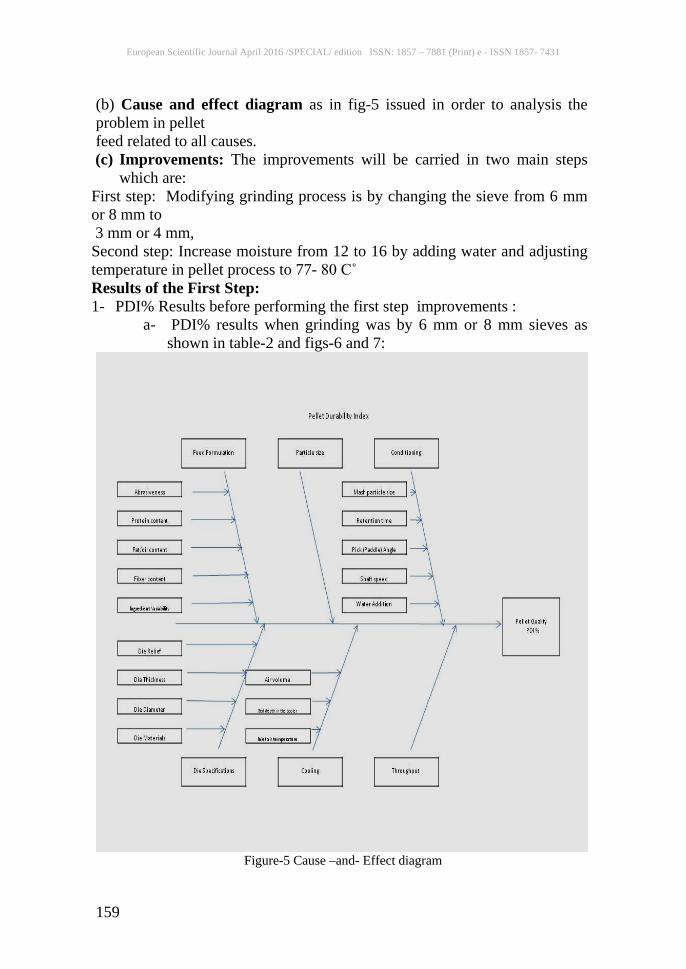
(b) Cause and effect diagram as in fig-5 issued in order to analysis the problem in pellet feed related to all causes. (c) Improvements: The improvements will be carried in two main steps
which are: First step: Modifying grinding process is by changing the sieve from 6 mm or 8 mm to 3 mm or 4 mm, Second step: Increase moisture from 12 to 16 by adding water and adjusting temperature in pellet process to 77- 80 C˚ Results of the First Step: 1- PDI% Results before performing the first step improvements :
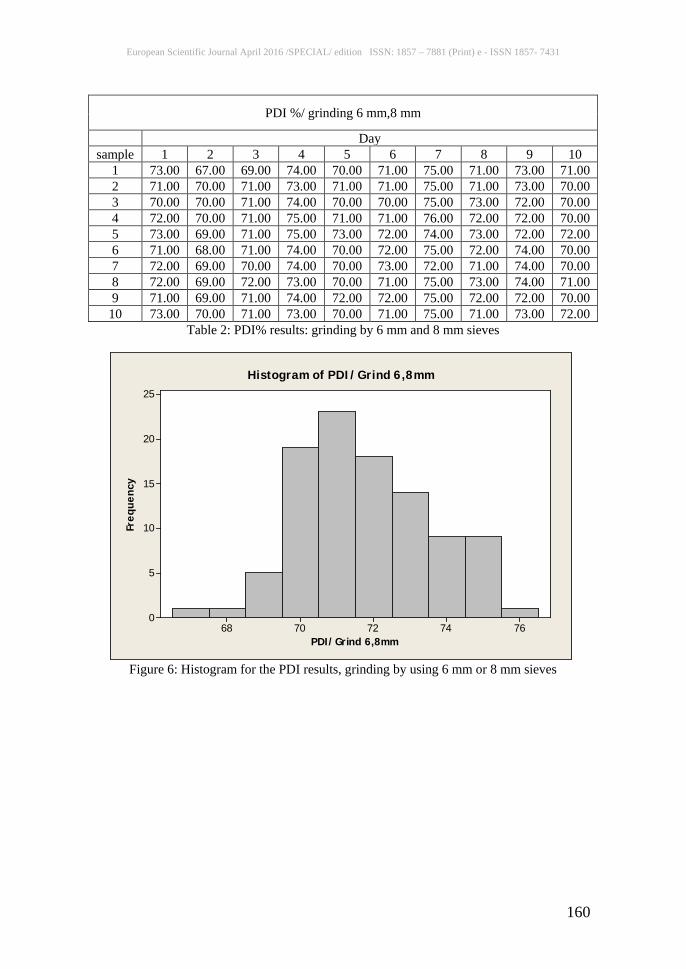
a- PDI% results when grinding was by 6 mm or 8 mm sieves as shown in table-2 and figs-6 and 7:
Figure-5 Cause –and- Effect diagram
European Scientific Journal April 2016 /SPECIAL/ edition ISSN: 1857 – 7881 (Print) e - ISSN 1857- 7431
160
PDI %/ grinding 6 mm,8 mm
Day sample 1 2 3 4 5 6 7 8 9 10
1 73.00 67.00 69.00 74.00 70.00 71.00 75.00 71.00 73.00 71.00 2 71.00 70.00 71.00 73.00 71.00 71.00 75.00 71.00 73.00 70.00 3 70.00 70.00 71.00 74.00 70.00 70.00 75.00 73.00 72.00 70.00 4 72.00 70.00 71.00 75.00 71.00 71.00 76.00 72.00 72.00 70.00 5 73.00 69.00 71.00 75.00 73.00 72.00 74.00 73.00 72.00 72.00 6 71.00 68.00 71.00 74.00 70.00 72.00 75.00 72.00 74.00 70.00 7 72.00 69.00 70.00 74.00 70.00 73.00 72.00 71.00 74.00 70.00 8 72.00 69.00 72.00 73.00 70.00 71.00 75.00 73.00 74.00 71.00 9 71.00 69.00 71.00 74.00 72.00 72.00 75.00 72.00 72.00 70.00
10 73.00 70.00 71.00 73.00 70.00 71.00 75.00 71.00 73.00 72.00 Table 2: PDI% results: grinding by 6 mm and 8 mm sieves
Figure 6: Histogram for the PDI results, grinding by using 6 mm or 8 mm sieves
7674727068
25
20
15
10
5
0
PDI/Grind 6,8mm
Freq
uenc
y
Histogram of PDI/Grind 6,8mm
European Scientific Journal April 2016 /SPECIAL/ edition ISSN: 1857 – 7881 (Print) e - ISSN 1857- 7431
161
Lot Numbers
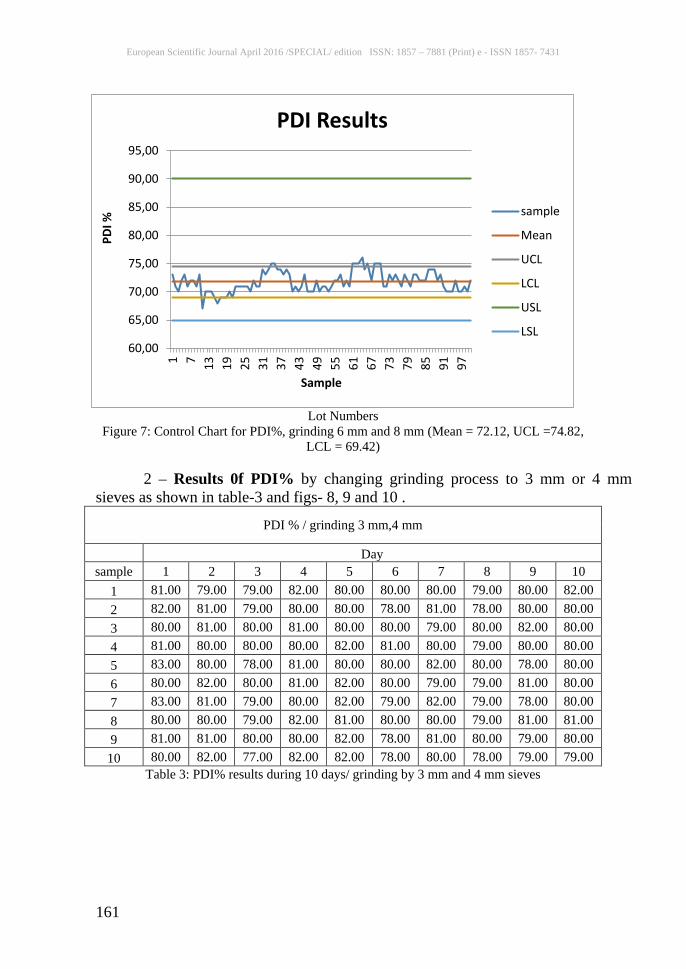
Figure 7: Control Chart for PDI%, grinding 6 mm and 8 mm (Mean = 72.12, UCL =74.82, LCL = 69.42)
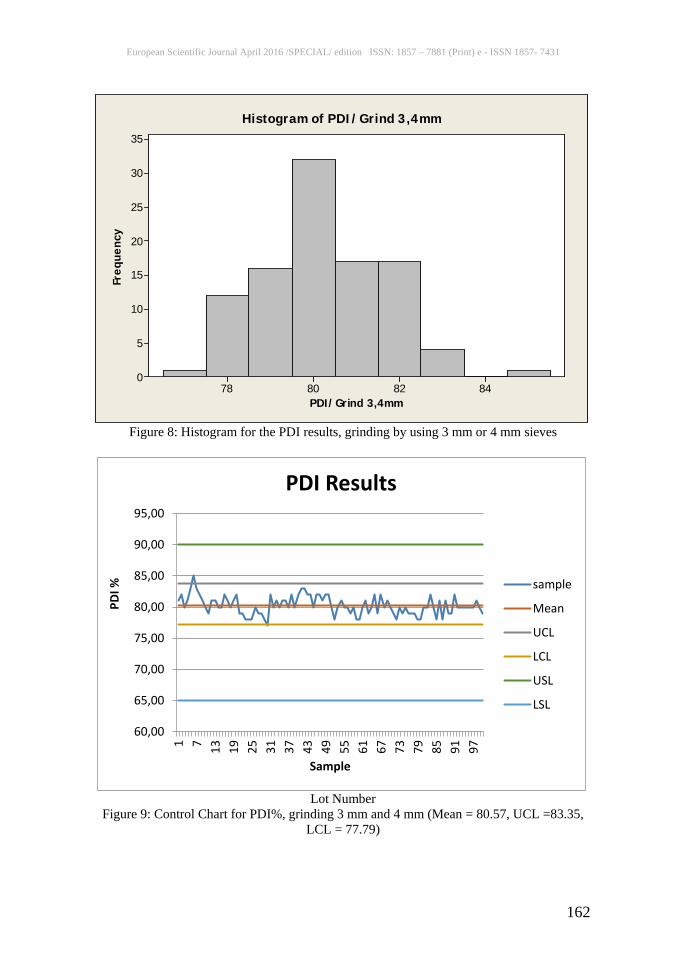
2 – Results 0f PDI% by changing grinding process to 3 mm or 4 mm sieves as shown in table-3 and figs- 8, 9 and 10 .
PDI % / grinding 3 mm,4 mm
Day sample 1 2 3 4 5 6 7 8 9 10
1 81.00 79.00 79.00 82.00 80.00 80.00 80.00 79.00 80.00 82.00 2 82.00 81.00 79.00 80.00 80.00 78.00 81.00 78.00 80.00 80.00 3 80.00 81.00 80.00 81.00 80.00 80.00 79.00 80.00 82.00 80.00 4 81.00 80.00 80.00 80.00 82.00 81.00 80.00 79.00 80.00 80.00 5 83.00 80.00 78.00 81.00 80.00 80.00 82.00 80.00 78.00 80.00 6 80.00 82.00 80.00 81.00 82.00 80.00 79.00 79.00 81.00 80.00 7 83.00 81.00 79.00 80.00 82.00 79.00 82.00 79.00 78.00 80.00 8 80.00 80.00 79.00 82.00 81.00 80.00 80.00 79.00 81.00 81.00 9 81.00 81.00 80.00 80.00 82.00 78.00 81.00 80.00 79.00 80.00
10 80.00 82.00 77.00 82.00 82.00 78.00 80.00 78.00 79.00 79.00 Table 3: PDI% results during 10 days/ grinding by 3 mm and 4 mm sieves
60,00
65,00
70,00
75,00
80,00
85,00
90,00
95,00
1 7 13 19 25 31 37 43 49 55 61 67 73 79 85 91 97
PDI %
Sample
PDI Results
sample
Mean
UCL
LCL
USL
LSL
European Scientific Journal April 2016 /SPECIAL/ edition ISSN: 1857 – 7881 (Print) e - ISSN 1857- 7431
162
Figure 8: Histogram for the PDI results, grinding by using 3 mm or 4 mm sieves
Lot Number
Figure 9: Control Chart for PDI%, grinding 3 mm and 4 mm (Mean = 80.57, UCL =83.35, LCL = 77.79)
84828078
35
30
25
20
15
10
5
0
PDI/Grind 3,4mm
Freq
uenc
yHistogram of PDI/Grind 3,4mm
60,00
65,00
70,00
75,00
80,00
85,00
90,00
95,00
1 7 13 19 25 31 37 43 49 55 61 67 73 79 85 91 97
PDI %
Sample
PDI Results
sample
Mean
UCL
LCL
USL
LSL

European Scientific Journal April 2016 /SPECIAL/ edition ISSN: 1857 – 7881 (Print) e - ISSN 1857- 7431
163
Figure 10: improvement Chart for PDI%, before and after grinding by 3mm and 4
mm ( = after, = before) Second step: Modifying the Moisture value in order to reach following targets:
1- Target 17-18% moisture. 2- Target 180-200 Fo temperature 3- 1% moisture increase per 20-25 Fo temperature a- The Results when the conditioning temperature was 158-162 F˚ and
moisture 12% as shown in table-4 and figs-11 and 12.
PDI % / Temperature 158-162 F˚ ,Moisture 12%
Day sample 1 2 3 4 5 6 7 8 9 10
1 81.00 79.00 79.00 82.00 82.00 80.00 80.00 79.00 80.00 75.00 2 82.00 81.00 78.00 79.00 83.00 78.00 81.00 78.00 80.00 80.00 3 80.00 81.00 78.00 81.00 82.00 80.00 79.00 80.00 82.00 80.00 4 81.00 80.00 78.00 80.00 82.00 81.00 80.00 79.00 80.00 80.00 5 83.00 79.00 78.00 81.00 80.00 79.00 82.00 80.00 78.00 80.00 6 80.00 81.00 80.00 81.00 82.00 80.00 79.00 79.00 81.00 80.00 7 83.00 80.00 79.00 80.00 82.00 79.00 82.00 79.00 78.00 80.00 8 82.00 80.00 79.00 82.00 81.00 80.00 80.00 79.00 81.00 81.00 9 81.00 80.00 78.00 80.00 82.00 78.00 81.00 78.00 79.00 80.00
10 80.00 84.00 77.00 82.00 82.00 78.00 80.00 78.00 79.00 79.00 Table 4 PDI% results during 10 days/ grinding by 3mm and 4mm sieves and moisture 12%
60,00
70,00
80,00
90,00
1 2 3 4 5 6 7 8 9 10
Day
PDI %
PDI Results before and after improvement
European Scientific Journal April 2016 /SPECIAL/ edition ISSN: 1857 – 7881 (Print) e - ISSN 1857- 7431
164
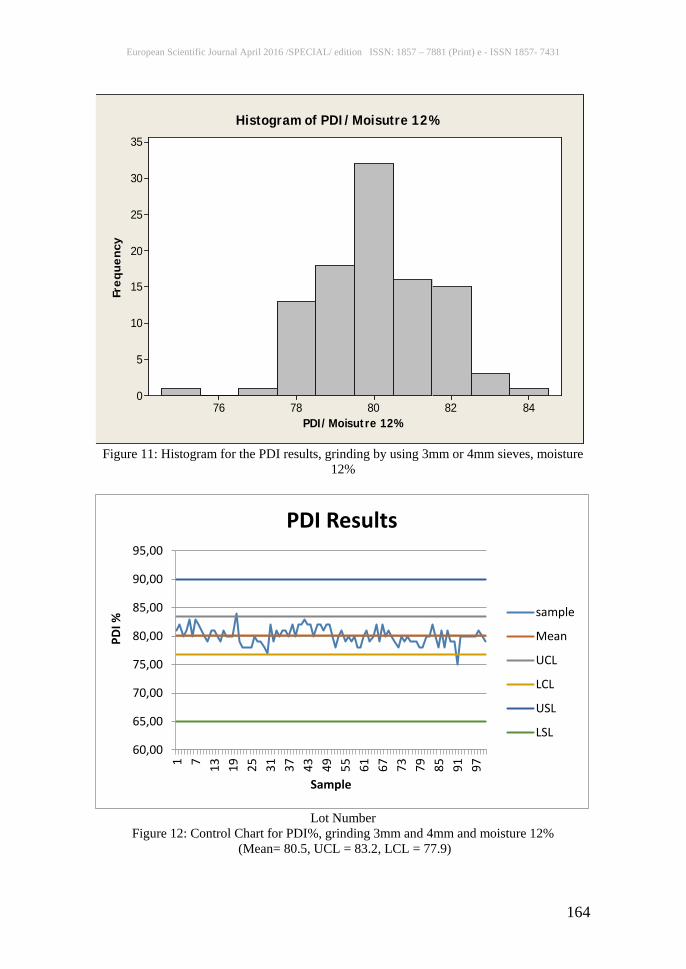
Figure 11: Histogram for the PDI results, grinding by using 3mm or 4mm sieves, moisture
12%
Lot Number
Figure 12: Control Chart for PDI%, grinding 3mm and 4mm and moisture 12% (Mean= 80.5, UCL = 83.2, LCL = 77.9)
8482807876
35
30
25
20
15
10
5
0
PDI/Moisutre 12%
Freq
uenc
yHistogram of PDI/Moisutre 12%
60,00
65,00
70,00
75,00
80,00
85,00
90,00
95,00
1 7 13 19 25 31 37 43 49 55 61 67 73 79 85 91 97
PDI %
Sample
PDI Results
sample
Mean
UCL
LCL
USL
LSL
European Scientific Journal April 2016 /SPECIAL/ edition ISSN: 1857 – 7881 (Print) e - ISSN 1857- 7431
165
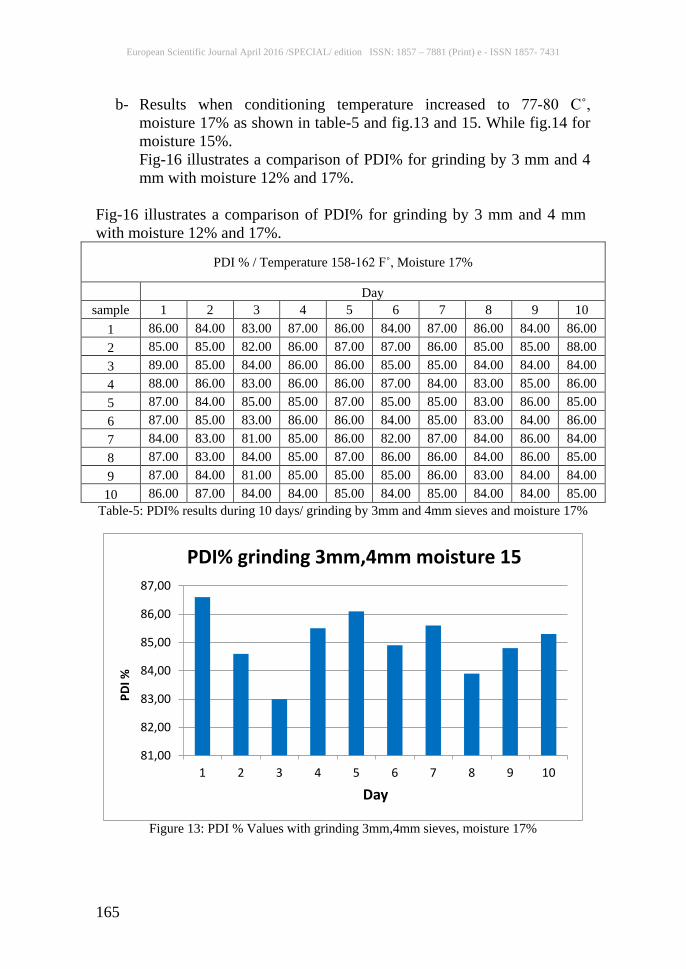
b- Results when conditioning temperature increased to 77-80 C˚, moisture 17% as shown in table-5 and fig.13 and 15. While fig.14 for moisture 15%. Fig-16 illustrates a comparison of PDI% for grinding by 3 mm and 4 mm with moisture 12% and 17%.
Fig-16 illustrates a comparison of PDI% for grinding by 3 mm and 4 mm with moisture 12% and 17%.
PDI % / Temperature 158-162 F˚, Moisture 17%
Day sample 1 2 3 4 5 6 7 8 9 10
1 86.00 84.00 83.00 87.00 86.00 84.00 87.00 86.00 84.00 86.00 2 85.00 85.00 82.00 86.00 87.00 87.00 86.00 85.00 85.00 88.00 3 89.00 85.00 84.00 86.00 86.00 85.00 85.00 84.00 84.00 84.00 4 88.00 86.00 83.00 86.00 86.00 87.00 84.00 83.00 85.00 86.00 5 87.00 84.00 85.00 85.00 87.00 85.00 85.00 83.00 86.00 85.00 6 87.00 85.00 83.00 86.00 86.00 84.00 85.00 83.00 84.00 86.00 7 84.00 83.00 81.00 85.00 86.00 82.00 87.00 84.00 86.00 84.00 8 87.00 83.00 84.00 85.00 87.00 86.00 86.00 84.00 86.00 85.00 9 87.00 84.00 81.00 85.00 85.00 85.00 86.00 83.00 84.00 84.00
10 86.00 87.00 84.00 84.00 85.00 84.00 85.00 84.00 84.00 85.00 Table-5: PDI% results during 10 days/ grinding by 3mm and 4mm sieves and moisture 17%
Figure 13: PDI % Values with grinding 3mm,4mm sieves, moisture 17%
81,00
82,00
83,00
84,00
85,00
86,00
87,00
1 2 3 4 5 6 7 8 9 10
PDI %
Day
PDI% grinding 3mm,4mm moisture 15
European Scientific Journal April 2016 /SPECIAL/ edition ISSN: 1857 – 7881 (Print) e - ISSN 1857- 7431
166
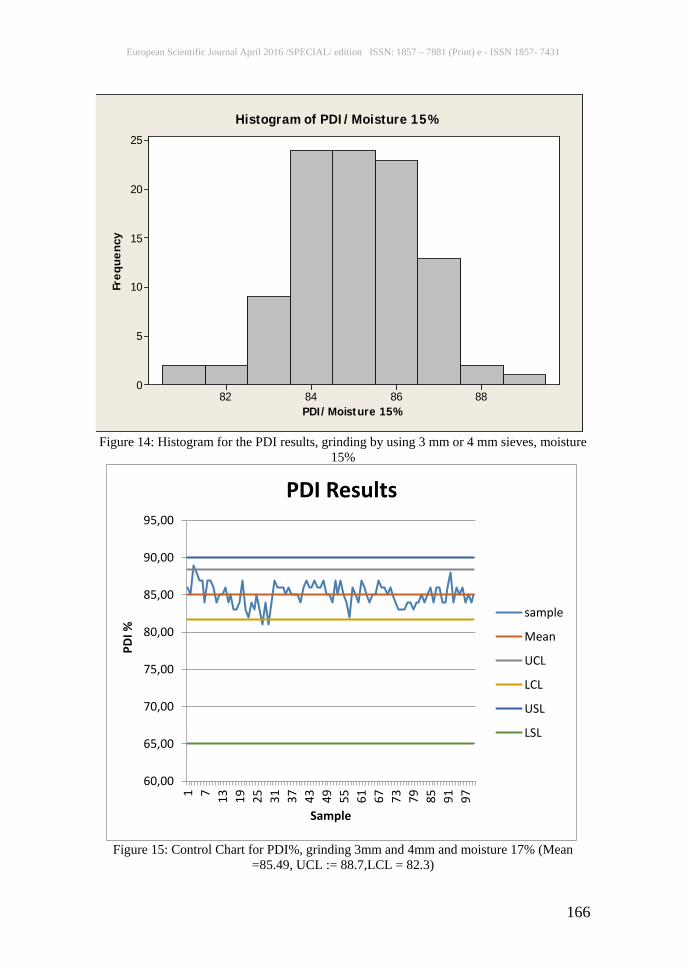
Figure 14: Histogram for the PDI results, grinding by using 3 mm or 4 mm sieves, moisture
15%
Figure 15: Control Chart for PDI%, grinding 3mm and 4mm and moisture 17% (Mean
=85.49, UCL := 88.7,LCL = 82.3)
88868482
25
20
15
10
5
0
PDI/Moisture 15%
Freq
uenc
yHistogram of PDI/Moisture 15%
60,00
65,00
70,00
75,00
80,00
85,00
90,00
95,00
1 7 13 19 25 31 37 43 49 55 61 67 73 79 85 91 97
PDI %
Sample
PDI Results
sample
Mean
UCL
LCL
USL
LSL
European Scientific Journal April 2016 /SPECIAL/ edition ISSN: 1857 – 7881 (Print) e - ISSN 1857- 7431
167
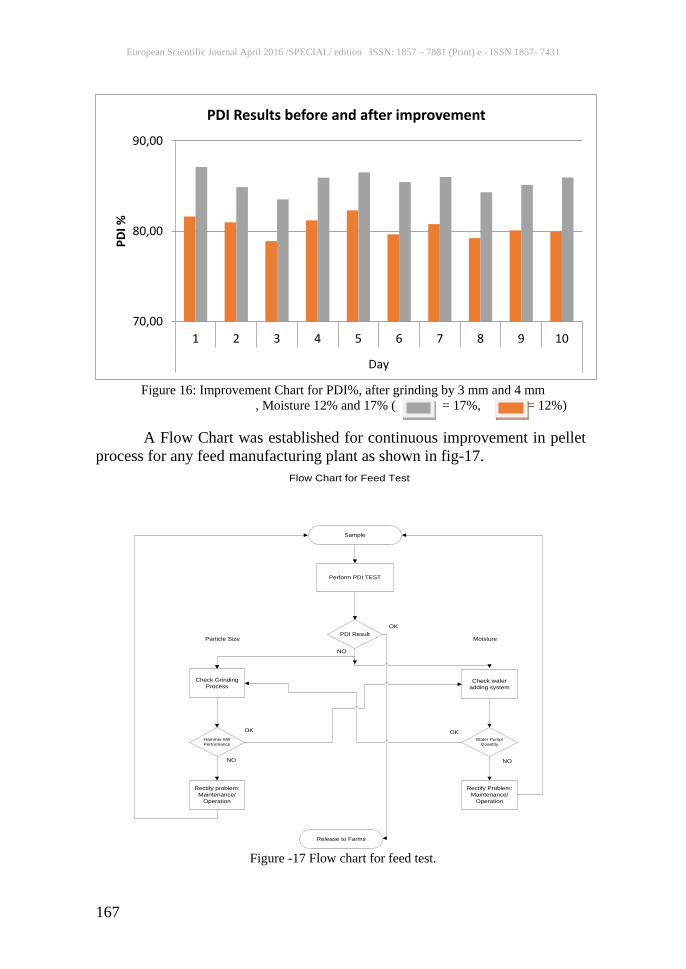
Figure 16: Improvement Chart for PDI%, after grinding by 3 mm and 4 mm
, Moisture 12% and 17% ( = 17%, = 12%)
A Flow Chart was established for continuous improvement in pellet process for any feed manufacturing plant as shown in fig-17.
Sample
Perform PDI TEST
PDI Result
Check water adding system
Check Grinding Process
NO
Hammer Mill Performance
OK
NO
Water Pump/Quantity
OK
NO
Rectify Problem: Maintenance/
Operation
Rectify problem: Maintenance/
Operation
OK
Release to Farms
Flow Chart for Feed Test
Particle Size Moisture
Figure -17 Flow chart for feed test.
70,00
80,00
90,00
1 2 3 4 5 6 7 8 9 10
Day
PDI %
PDI Results before and after improvement
European Scientific Journal April 2016 /SPECIAL/ edition ISSN: 1857 – 7881 (Print) e - ISSN 1857- 7431
168
Discussion of the Results: The present work shows how organizations can use the basic quality
tools to improve their processes and saving materials and money. A case study on a local Feed Mill Company was studied. It was shown that with the use of the basic quality tools in general, and the Statistical Process Control (SPC) tools will give a great opportunity for feed manufacturing company to monitor, control and improve their processes in order to achieve breakthrough improvements and business results. Feed producers can monitor the feed produced on a daily, weekly, or monthly basis. This would ensure that the quality of feed delivered to the customer complies with the specifications of the feed standard (ISO 9001). It worth is to be stressed here that the control-charts in particular and the seven basic quality tools in general had demonstrated a great capacity to improvement the manufacturing and services industries across the globe and the Poultry industry in specific, which is the present work case study. There are basically five reasons behind this, which are:
- The seven basic quality tools are proven techniques for improving productivity;
- They are effective in defects and errors prevention; - They prevent unnecessary process adjustments; - They provide diagnostic information; and - They provide information about process capability to meet customer
requirements. The results of the implementation of the above tools to the present work case study have shown the following improvements:
- The PDI% statistical elements due to the grinding size improvements from 4 mm and 8 sieves to 3 mm and 6 mm sieves, which are: The mean value, UCL and LCL have improved from 72.12, 74.82, and 69.42 before the improvement process(table-2 and figures- 6, 7) to 80.57, 83.35 and 77.79 after improvement process(table-4 and figures- 8, 9), respectively, with keeping the moisture unchanged ( i.e. without improvements, which is below 12% ). Figure-10 shows the comparison of PDI% before and after improvements. This figure illustrates that the improvement of PDI% is about 13-14 %.
- While the PDI% statistical elements due to the moisture improvements from 12% to 17% ,the elements of PDI% have improved from , mean= 80.5, UCL= 83.2 and LCL= 77.9 (table- 4 and figures-11, 12 ) to 85.49, 88.7 and 82.3 table-5 and figs-13 and 15 respectively. Figure-14 shows when the moisture is raised to 15%; also there is an improvement in PDI but less than moisture 17%.The results of the comparison of moisture 12% and 17% with grinding size 3mm and 4mm for both are shown in figure-16. This figure
European Scientific Journal April 2016 /SPECIAL/ edition ISSN: 1857 – 7881 (Print) e - ISSN 1857- 7431
169
shows clearly that the improvement is about 6-8% of PDI. This improvement is considered very valuable and profitable in feed manufacturing. Conclusion: From this field study results, it is clear to conclude that the well planned and updated scientific data-base for continuous training of employees from top management to technical staff, and systematic implementation of the quality tools in production processes, together with a strong commitment of leadership to continuous improvement, are the key success factors for any industry organizations to stay in business and the achievement of customer satisfaction and business excellence. It is the author's conviction that ISO 9001 certification procedure associated with the systematic implementation of the quality tools would be an excellent approach for quality improvement in the Feed industry. References: Charles Stark, Peter Ferret, “Conditioning, Pellet and cooling”. Agriculture and Life Sciences Faculty, NC state university- Thomas S Winowiski, lingo Tech “Pellet Quality in Animal Feeds”, USA, INC, ASA. David A. Fairfield,” Pellet for profit”, National Grain and Feed Association Volume54, Number13. Go pal K... Kanji, Mike Asher,” 100 Methods for Total Quality Management”, Sage publications , 1996. NVR Naidu, KM Babul, G Rajendra,” Total Quality Management “, New Age Inter national Publishers Pyzdek T. Quality Engineering Handbook, Second Edition, Marcel Dekker, Inc., New York 2003. Dahlgaard J Kristiansen K., and Kanji G.", Fundamentals of Total Quality Management". Taylor & Francis, 2002 Asian Productivity Organization (1984) Quality Control Circles at Work, Tokyo, Japan. Burr, T., in Readings in Total Quality Management (ed. H. Costing), the Dryden Press, Harcourt Brace College Publishers, New York, USA Dahlgaard J Kristiansen K., and Kanji G (1990) “A comparative study of quality control Methods and principles in Japan, Korea and Denmark” Journal of Total Quality Management 1(1), 115–132 Dahlgaard J Kristiansen K., and Kanji G (1994). The Quality Journey— A Journey Without An End, Advances in Total Quality Management, Total Quality Management, Carafe Publishing Company, London Deming, W.E. (1986) Out of the Crisis, MIT, USA.

European Scientific Journal April 2016 /SPECIAL/ edition ISSN: 1857 – 7881 (Print) e - ISSN 1857- 7431
170
Fukude R. (1983) Managerial Engineering, Productivity Inc., Stanford, USA. Ishikawa, K. (1985) "what is Total Quality Control?—The Japanese Way, Prentice Hall, Englewood Cliffs, USA. Japanese Union of Scientists and Engineers (1970) QC Circle Kory— “General Principles of The (QC) Circle” Tokyo, Japan. Kanji, G.K. and Asher, M. 100 Methods for Total Quality Management, SAGE, London. Robert Bosch (1994). “Elementary Quality Assurance Tools, Robert Bosch, Denmark". Stewart, W.A. (1931) Economic Control of Quality and Manufactured Products, D. van Nester and & Inc., New York USA. Al-Herdsman M. "The effect of applying total quality management to improve construction Projects “MSc Dissertation, Muta’h University (2015) Al-Bashabshen M.”Effect application of Lean manufacturing on leading industrial company” As a case study. MSc Dissertation, Muta’h University (2015) Al-A'azemy F. "The impact of applying the total quality management and Kaizen methods on Maintenance of electricity generation plants in ministry of electricity and water" MSc Dissertation, Muta’h University (2015)