implementation of the mechanistic-empirical pavement ... · this respect, the mepdg is currently...
TRANSCRIPT

MPC Report No. 10-225A
Implementation of the Mechanistic-Empirical Pavement Design Guide (MEPDG)
George Dzotepe Khaled Ksaibati
September 2010

IMPLEMENTATION OF THE MECHANISTIC–EMPIRICALPAVEMENT DESIGN GUIDE (MEPDG)
Prepared By
George Abraham Dzotepe Graduate Research Assistant
Department of Civil and Architectural Engineering University of Wyoming, 1000 E University Avenue, Dept. 3295
Laramie, WY 82071 [email protected] Tel: 307-766-6230
and
Dr. Khaled Ksaibati, Ph.D., P.E Director
Wyoming Technology Transfer Center [email protected]
Phone: 800-231-2815
September 2010

Acknowledgements The authors wish to thank Scott Koch, graduate student of the Civil and Architectural Engineering Department at the University of Wyoming, who undertook the preliminary research studies on the MEPDG and developed an extensive literature review on the subject.
Disclaimer The contents of this report reflect the work of the authors, who are responsible for the facts and the accuracy of the information presented. This document is disseminated under the sponsorship of the Mountain-Plains Consortium in the interest of information exchange. The U.S. Government assumes no liability for the contents or use thereof.
North Dakota State University does not discriminate on the basis of race, color, national origin, religion, sex, disability, age, Vietnam Era Veteran's status, sexual orientation, marital status, or public assistance status. Direct inquiries to the Vice President of Equity, Diversity, and Global Outreach, 205 Old Main, (701) 231-7708.

ABSTRACT Current pavement design methodology based on the AASHTO Design Guide uses an empirical approach based on the results of the AASHTO Road Test conducted in 1958. But limitations of the current guide led AAHSTO to publish the new Mechanistic Empirical Pavement Design Guide (MEPDG), which combines mechanistic and empirical methodology by using calculations of pavement responses, such as stress, strains, and deformations (mechanistic) using site specific inputs from climate, material, and traffic properties. As a new design guide and with large data inputs required, there are bound to be challenges. In this respect, the MEPDG is currently undergoing many changes with further research being conducted at the national, regional, and local levels into various aspects of the guide, especially in the areas of materials, climate, and traffic characteristics. It is hoped that the findings from various research studies will facilitate the implementaion of the MEPDG within national, regional, and local transporation agencies and professionals. Consequently, a North-West States’ MEPDG User Group meeting was held in Oregon on March 9–10 to discuss the region’s implementation plans and progress, related technical issues, and the future direction of the MEPDG. This report summarizes the findings from the meeting and seeks to outline the research needs necessary to facilitate the implementation of the MEPDG in the North-West region.


TABLE OF CONTENTS 1. INTRODUCTION ................................................................................................................................ 1
1.1 Background ...................................................................................................................................... 1 1.2 Problem Statement and Objectives .................................................................................................. 3 1.3 Report Organization ......................................................................................................................... 3
2. LITERATURE REVIEW .................................................................................................................... 5
2.1 Background ...................................................................................................................................... 5 2.2 Design Process ................................................................................................................................. 5 2.3 Calibration ....................................................................................................................................... 6 2.4 Traffic .............................................................................................................................................. 6
2.4.1 Hierarchal Approach ................................................................................................................. 7 2.4.2 Traffic Elements ........................................................................................................................ 8
2.5 Climate/Environment and EICM ................................................................................................... 10 2.6 Materials ........................................................................................................................................ 11
2.6.1 Resilient Modulus and Unbound Layers ................................................................................. 11 2.6.2 Hierarchal Approach ............................................................................................................... 12 2.6.3 Material Inputs ........................................................................................................................ 13
2.7 Challenges and Opportunities ........................................................................................................ 13 2.8 Section Summary ........................................................................................................................... 13
3. REGIONAL IMPLEMENTATION OF MEPDG ........................................................................... 15
3.1 Background .................................................................................................................................... 15 3.2 User Group Meeting Summary ...................................................................................................... 15
3.2.1 National Implementation of MEPDG ...................................................................................... 15 3.2.2 Regional Implementation of MEPDG ..................................................................................... 16 3.2.3 Ongoing Research ................................................................................................................... 19 3.2.4 Future Direction of MEPDG ................................................................................................... 20
3.3 Section Summary ........................................................................................................................... 21
4. CHALLENGES AND LIMITATIONS TO MEPDG IMPLEMENTATION .............................. 23
4.1 Background .................................................................................................................................... 23 4.2 Section Summary ........................................................................................................................... 24
5. IDENTIFYING RESEARCH NEEDS ............................................................................................. 25
5.1 Background .................................................................................................................................... 25 5.2 National Research Needs ............................................................................................................... 25
5.2.1 NCHRP 9-30A – Calibration of Rutting Models for HMA Structural and Mix Design ......... 25 5.2.2 NCHRP 1-41 – Reflection Cracking of HMA Overlays ......................................................... 26 5.2.3 NCHRP 1-42A – Top-Down Cracking of HMA ..................................................................... 26 5.2.4 NCHRP 9-44A – Application of the Endurance Limit for HMA mixes ................................. 27 5.2.5 Rehabilitation of Flexible and Rigid Pavements ..................................................................... 27 5.2.6 Coefficient of Thermal Expansion .......................................................................................... 28 5.2.7 Effect of Geogrids and Geotextiles ......................................................................................... 28

5.3 Regional Research Needs .............................................................................................................. 28 5.3.1 Traffic Data Characteristics ..................................................................................................... 29 5.3.2 Climatic/Environment Factors ................................................................................................ 29 5.3.3 Materials Characterization ...................................................................................................... 30 5.3.4 Pavement Performance ............................................................................................................ 30 5.3.5 Calibration and Validation ...................................................................................................... 30
5.4 Section Summary ........................................................................................................................... 31
6. CONCLUSIONS AND RECOMMENDATIONS ........................................................................... 33
6.1 Conclusions .................................................................................................................................... 33 6.2 Recommendations .......................................................................................................................... 33
REFERENCES .......................................................................................................................................... 35
APPENDIX A - MEPDG SURVEY QUESTIONNAIRE ...................................................................... 39
APPENDIX B – USER GROUP MEETING PRESENTATIONS ....................................................... 45

LIST OF TABLES
Table 2.1 FWHA System of Vehicle Classification (Source: www.fhwa.dot.gov) ..................................... 9
Table 2.2 Major Material Input Considerations (Wang et al., 2007) ......................................................... 14
Table 3.1 SDOT Implementation Term Plans ........................................................................................... 18
LIST OF FIGURES
Figure 1.1 M-E Design Process (Wagner) ................................................................................................... 2


1
1. INTRODUCTION 1.1 Background
In the past, pavement design was performed on an experience only basis. Today, most states use an empirical approach in pavement design. The empirical methodology is the statistical modeling of pavement performance. The future direction of the design guide is aimed at using a mechanistic–empirical approach. This methodology uses calculations of pavement responses such as stresses, strains, and deformations (mechanistic) and then adjusts accordingly based on performance models (empirical). The ultimate goal is to have pavement designed on a mechanistic approach only (AASHTO). The empirical design of pavements resulted from the AASHTO road test in 1958. The design parameters created by AASHTO from the road test included pavement serviceability, supporting value of the sub-grade, quantity of the predicted traffic, quality of the construction materials, and climate. Design equations were based on the conditions at the AASHTO road test site in which multiple surfacing sections were tested with loaded trucks. By 1972, the AASHTO guide for pavement design was published. The design guide was rationally based on the experience of the pavement engineers and their knowledge of how to avoid structural failures (AASHTO). But the AASHTO guide had limitations because it was based on the AASHTO road test, which only included one climate, one sub-grade, two years’ duration, limited cross sections and 1950s materials, traffic volumes, specifications and construction methods. Due to these limitations a dilemma of how to project beyond the AASHTO road test limits came about (AASHTO). The AASHTO Guide was updated in 1986 and 1993, but in the mid 1990s AASHTO undertook research for a new guide to pavement design. A 2003 survey showed that three DOTs used the 1972 design guide, two used the 1986 guide, 26 used the 1993 guide, and 17 used their own agency’s design guide or a combination of the AASHTO and agency’s guides (Wagner). The critical items for the new design guide were identified as mechanistic, empirically calibrated, allow for user calibration, include existing theory and models, create software and provide a rational engineering approach. This became the mechanistic–empirical approach to pavement design and known as the NCHRP 1-37A project (AASHTO). Figure 1.1 shows the mechanistic–empirical design process in a basic flow chart.

2
Figure 1.1 M–E Design Process (Wagner)
The mechanistic–empirical design process contains more than 100 total inputs with 35 or more for flexible pavement and 25 or more for Portland Cement Concrete (PCC). This can be compared with the 1993 AASHTO guide, which contains five inputs for flexible pavement and 10 inputs for rigid pavements (AASHTO). The mechanical–empirical inputs come from climate, material, and traffic properties. Material factors come from modulus values and thermal properties of the specific materials. Climate factors are based on site specific climate considerations. The mechanistic–empirical design process uses 800 or more weather sites to narrow these factors to the specific site, while the AASHTO guide uses extrapolation from the road test site in Ottawa, Illinois. Traffic inputs will come from local data collected and will be the number of axles by type and weight. ESAL’s will no longer be used. With the Mechanistic–Empirical Pavement Design Guide (MEPDG), it is anticipated that a more reliable design will be created and there will no longer be a dependence on extrapolation of empirical relationships. It will also allow for calibration nationally, or regionally or to local performance data for materials, climate, and traffic (Wagner). But the mechanistic–empirical design process is not yet an approved AASHTO design guide. With so many inputs and factors, it is expected that problems will arise. These problems stem from the lack of ability to collect the desired inputs and the lack of research. It is in these critical inputs in which the desired performance models are created; for example, the Integrated Climatic Model (ICM) for climate factors uses temperature and moisture inputs to run the model. For the mechanistic–empirical performance models of pavement materials, inputs come from modulus values, thermal properties and strength properties (AASHTO). In this regard, more time and equipment are needed by the DOTs to collect the necessary data to create the required inputs. Also calibration and sensitivity efforts are an ongoing process. By consulting with the DOTs in the northwestern states, the specific problems occurring in each state could be identified. These problems will then be summarized with the goal of determining the necessary equipment and/or research that is needed. In addition, where necessary, recommendations will be made for needed regional research. It is through these recommendations that the facilitation of the implementation of the MEPDG throughout the MPC region will be performed in order to fulfill the goal of complete implementation of the mechanistic–empirical pavement design process.

3
1.2 Problem Statement and Objectives At the Mountain-Plains Consortium (MPC) Pavement Research Workshop in Denver, Colorado in March 2008, a roadmap for future pavement related research studies was laid out. During the workshop, it was concluded that the top priority for the region will be the implementation of the Mechanistic–Empirical Pavement Design Guide (MEPDG). The represented agencies at the workshop included WYDOT, CDOT, SDDOT, NDDOT, SDLTAP, SDSU, FHWA, Colorado State University, North Dakota State University, South Dakota State University, University of Utah, and University of Wyoming. It was determined that there were currently some issues regarding the smooth implementation of the new MEPDG. A follow-up to this meeting was a North-West User Group Meeting held at Oregon State University in Corvallis on March 9-10, 2009 to discuss participating states’ implementation plans and progress, technical issues related to the MEPDG and other related issues with the MEPDG. The attending states included Alaska, Idaho, Montana, North Dakota, Oregon, South Dakota, Washington, and Wyoming. It is in this respect that the main objective of this study is to address the necessary means needed to facilitate the implementation of the MEPDG for the northwestern states. The study will seek to obtain information from the DOTs throughout the MPC Region, process the gathered data and provide an approach to help with the implementation of the MEPDG. 1.3 Report Organization A comprehensive literature review focusing on the performance of the MEPDG is summarized in Section 2 of this report. Section 3 focuses on the national as well as the regional implementation of the MEPDG and includes a summary of the findings of the user group meeting. Section 4 summarizes the main challenges likely to be faced in the implementation of the MEPDG and Section 5 outlines any future research needs. Finally, summary conclusions and recommendations for the way forward in MEPDG implementation are presented in Section 6.

4

5
2. LITERATURE REVIEW 2.1 Background In the past, empirical design methods were the only available pavement design choices. The limitations of the empirical methods resulted in some pavements meeting design requirements and others not meeting their design requirements. The mechanistic–empirical design approach provides for more information about the development of pavement distresses during the design life of the pavement to be obtained. From this information, pavement engineers can decide on when and how to go about the maintenance of pavements while still meeting the requirements of its users(Petry, Han and Ge 2007). The MEPDG provides significant benefits over the 1993 AASHTO Pavement Design Guide. These benefits allow for achieving cost effective new and rehabilitated pavement designs. The MEPDG utilizes a user friendly software interface that uses an integrated analysis approach to predict pavement behavior over time. The MEPDG software accounts for the interaction among traffic, climate, and materials used in the pavement structure. The ultimate goal of an accurately predicted long run evaluation of the pavement and determination of the subsequent pavement design can be achieved by using the MEPDG(Rabab'ah and Liang 2007). The MEPDG is also a significant improvement in pavement performance prediction methodology. The MEPDG is mechanistic because the model uses stresses, strains, and deformations in the pavement that have been calculated from real-world pavement response models to predict its performance. It is also empirical because the pavement performance predicted from lab developed performance models are adjusted according to observed performance in the field in order to reflect the differences between the predicted and actual field performance. The performance models used are calibrated using limited national databases. As a result, it is necessary for these models to be calibrated locally by taking into account local materials, traffic, and environmental conditions (Muthadi and Kim 2007). A well calibrated prediction model can result in reliable pavement designs and enable precise maintenance plans for agencies (Kang and Adams 2007). The concept of mechanistic–empirical design is to employ the fundamental pavement responses under repeated traffic loadings. These calculations consist of stresses, strains, and deflections in a pavement structure. Pavement responses are related to distresses in the field as well as performance using existing empirical relationships. The design process starts with a trial design, and, through many iterations, ends with predicted distresses that meet requirements based on the desired level of statistical reliability as defined by the user(Daniel and Chehab 2007). The MEPDG is not at the point where this goal is achieved seamlessly and its implementation is an ongoing endeavor. 2.2 Design Process The design process of a pavement either new or reconstructed requires an iterative approach with control in the hands of the pavement engineer. The designer must select and perform a design and determine if it meets the performance demands created by the user. The process can be outlined in the following steps:
i. Create the trial design for the specified location based on traffic, climate, and material conditions. ii. Define the pavement layer arrangement, hot mix asphalt (HMA), and other material properties.
iii. Establish the necessary criteria for acceptable performance at the end of the design period (acceptable levels of the different cracking types, rutting, International Roughness Index [IRI], etc.)
iv. Select the desired level of reliability for each of the performance criteria. v. Process inputs to gather monthly data for traffic, material, and climate inputs needed in the design
evaluations of the entire design life.

6
vi. Compute the structural responses (stress, strain, etc.) using the finite element or layered elastic analysis program for each damage calculation throughout the design period.
vii. Calculate the accumulated damages at each month for the entire design life. viii. Predict vital distress, like cracking and rutting, on a month-by-month basis of the design period
using the calibrated mechanistic–empirical performance models provided in the MEPDG. ix. Predict the smoothness as a function of the initial IRI, distresses over time, and site factors at the
end of each month. x. Evaluate the expected performance of the trial design at the given reliability level for adequacy.
xi. If trial design does not meet the performance criteria, modify the design and repeat steps 5 to 10 until the criteria are met.
The definition of reliability within the MEPDG is the reliability of the design, and it is the probability that the performance of the pavement predicted for that particular design will be satisfactory over the time period under consideration (Khazanovich, Wojtkiewicz and Velasquez 2007). In other words, the performance indicators such as cracking and rutting will not exceed the design criteria established over the design analysis period. As with any process to create a design and analyze the given design, there are many sources of variation that can occur in the prediction, such as:
i. Traffic loading estimation errors
ii. Climate fluctuation that the EICM (Enhanced Integrated Climate Model) may miss iii. Variation in layer thickness, material property and subgrade characteristics throughout the project iv. Differences in the designed and actually built materials and other layer properties v. Limitations and errors in the prediction models
vi. Measurement errors vii. Human errors that may occur along the way (Khazanovich, Wojtkiewicz and Velasquez 2007).
2.3 Calibration Calibration, as defined in the MEPDG, means to reduce the total error between the measured and predicted distresses by varying the appropriate model coefficients(Muthadi and Kim 2007). In general, there are three important steps involved in the process of calibrating the MEPDG to local materials and conditions. The first step is to perform verification runs on pavement sections using the calibration factors from the national calibration effort under the NCHRP 1-37A project. Step two involves calibrating the model coefficients to eliminate bias and reduce standard error between the predicted and measured distresses. Once this is accomplished and the standard error is within the acceptable level set by the user, the third step is performed. Validation, the third step, is used to check if the models are reasonable for performance predictions. The validation process determines if the factors are adequate and appropriate for the construction, materials, climate, traffic and other conditions that may be encountered within the system. This is done by selecting a number of independent pavement sections that were not used in the local calibration effort and testing those(Muthadi and Kim 2007). 2.4 Traffic The MEPDG traffic criteria were developed around axle load spectra. It is through axle load spectra that the unique traffic loadings of a given site are characterized. By means of these loading characteristics, pavement responses and resulting damages can be computed. Full axle load spectra traffic inputs are used for estimating the magnitude, configuration and frequency of traffic loads (Wang, et al. 2007). The benefit of load distributions is that they provide a more direct and rational approach for the analysis and design of pavement structures. The approach estimates the effects of actual traffic on pavement response and distress. Until complete use of mechanistic–empirical design methods are fully implemented, it is

7
anticipated that the use of equivalent single-axle loads (ESALs) will continue to be applied by pavement engineers in pavement design and rehabilitation for some time(Haider, Harichandran and Dwaikat 2007). The problem occurs in the transition between solely utilizing ESALs to only using axle load spectra. A possible solution is characterizing axle load spectra as a bimodal (two distinct peaks) mixture distribution and using its parameters to approximate ESALs. Dr. Haider and his colleagues have observed that axle load spectra can be reasonably described as a mix of two normal distributions. By developing closed-form solutions to estimate the parameters of the mixed distribution, traffic levels in terms of ESALs can then be estimated from the axle load spectra from a specific site(Haider, Harichandran and Dwaikat 2007). It is in the linkage between ESALs (empirical) and axle load spectra (mechanistic) in which the implementation of the MEPDG is being moved along. Type, weight, and number of axles are the criteria in which axle loads need to be estimated. The data gathered to follow the criteria should be site specific; if that is not possible, site related, regional, or agency-wide traffic data need to be substituted. The MEPDG software includes default axle load spectra and other traffic parameters if no other sources of traffic data can be obtained. To fully benefit from the MEPDG it is important to characterize pavement traffic loads using detailed traffic data including axle load spectra. This traffic data should be specific to the project area, and if that is not possible, default data will have to be used.
Generally, there is noticeable difference between the default traffic inputs included in the MEPDG and the regional traffic data collected in terms of axle load spectra. Volume and type of trucks along with axle load spectra are the main influences for predicting pavement performance. There are also main input factors that do not have significant influence on pavement performance predictions, such as axle spacing and hourly volume adjustment factors (Swan, et al. 2007). The software used in the MEPDG looks at each axle load individually then estimates the stresses and strains imposed on the pavement structure by each axle load. The stresses and strains are related to pavement damage and the damage is then accumulated. Finally, a report of the total damage caused by all axle loads is created. Throughout the process, the calculations take into account the climatic conditions of the pavement structure; the temperature of the asphalt concrete layers and the moisture content of the unbound material layers and subgrade. The calculations performed make up the mechanistic side of the guide, whereas the relation of the stresses and strains to pavement damage is the empirical part(Swan, et al. 2007). The data that are required to run the traffic analysis in the MEPDG are Average Annual Daily Truck Traffic (AADTT) data, vehicle classification, axle load distribution, and number of axles per truck. When weigh-in-motion (WIM) sites are close to the project site, these data can be used in a Level 1 analysis(Muthadi and Kim 2007).
2.4.1 Hierarchal Approach Based on the different pavement needs and the availability of traffic input data, the MEPDG accommodates three levels of input data that are progressively more reliable and accurate. The quality of the data in terms of reliability and accuracy, not detail makes up the difference in the hierarchal input levels. In other words, the same amount and type of data are used in every level, but level selection is based on the quality of the data. The hierarchal input levels are as follows:
i. Level 1 – The input data are gathered from direct and project-specific measurements. This level represents the greatest knowledge of the input parameters for the specific job. In particular, the input data are site-specific truck volumes for individual truck types and the axle load spectra is project site specific.
ii. Level 2 – The input data come from regional data, such as measured regional values that encompass the project but are not site specific. For traffic data, estimated classified truck volumes are used. These estimations come from volumes gathered on sections with similar traffic characteristics to those of the current project.
iii. Level 3 – These data are based on best estimation data or default values. These data are based on global or agency-wide default values, such as the median value from a group of similar projects.

8
For example, this data may come from an agency published look-up table of averages for classified truck volumes.
It is recommended by the MEPDG to use the best available data regardless of the overall input level. That is, it is possible for Level 1 inputs to be classified truck volumes, Level 2 data to be axle configuration, and Level 3 inputs to be axle load. This is solely based on the quality of each individual piece of data and where it fits best in the hierarchal scheme(Swan, et al. 2007). 2.4.2 Traffic Elements Traffic input data in the MEPDG are entered for the base year. The base year is the year the pavement is expected to open to traffic. Within the MEPDG software, there is a provision for future growth in truck volumes after the base year. Throughout the analysis of traffic data in the MEPDG there are many elements used. These elements are as follows:
i. Truck Volume and Highway Parameters. Truck volume is calculated by multiplying the Average Annual Daily Traffic (AADT) volume by the percentage of heavy trucks of FHWA class 4 or higher. The result is AADTT or Average Annual Daily Truck Traffic, but site specific AADTT data are usually available through an agency.
ii. Monthly Traffic Volume Adjustment Factors. These factors are used to distribute the AADTT volume a year’s time. Once the monthly traffic volume adjustment factors have been created, they are assumed to be the same for the design life. Monthly traffic volume adjustment factors are used if there is significant monthly variation in truck volumes that affect pavement performance. This variation is most likely due to seasonal traffic, such as in summer or winter.
iii. Vehicle Classification Distribution. The MEPDG uses the FHWA scheme of classifying heavy vehicles as shown in Table 2.1. Ten different vehicle classes are used (classes 4 to 13). The subsequent three light vehicle classes (classes 1 to 3, motorcycle, passenger car, and pickup) are not used in the MEPDG.

9
Table 2.1 FWHA System of Vehicle Classification (Source: www.fhwa.dot.gov) Vehicle Class Vehicle Type Description
4 Buses All vehicles manufactured as traditional passenger-carrying buses with two axles and six tires or three or more axles. This category includes only traditional buses (including school buses) functioning as passenger-carrying vehicles. Modified buses should be considered to be a truck and should be appropriately classified.
5 Two-Axle, Six-Tire, Single-Unit Trucks
All vehicles on a single frame including trucks, camping and recreational vehicles, motor homes, etc., with two axles and dual rear wheels.
6 Three-Axle Single-Unit Trucks
All vehicles on a single frame including trucks, camping and recreational vehicles, motor homes, etc., with three axles.
7 Four or More Axle Single-Unit Trucks
All trucks on a single frame with four or more axles.
8 Four or Fewer Axle Single-Trailer Trucks
All vehicles with four or fewer axles consisting of two units, one of which is a tractor or straight truck power unit.
9 Five-Axle Single-Trailer Trucks
All five-axle vehicles consisting of two units, one of which is a tractor or straight truck power unit.
10 Six or More Axle Single-Trailer Trucks
All vehicles with six or more axles consisting of two units, one of which is a tractor or straight truck power unit.
11 Five or fewer Axle Multi-Trailer Trucks
All vehicles with five or fewer axles consisting of three or more units, one of which is a tractor or straight truck power unit.
12 Six-Axle Multi-Trailer Trucks
All six-axle vehicles consisting of three or more units, one of which is a tractor or straight truck power unit.
13 Seven or More Axle Multi-Trailer Trucks
All vehicles with seven or more axles consisting of three or more units, one of which is a tractor or straight truck power unit.
iv. Hourly Traffic Volume Adjustment Factors. Hourly traffic adjustment factors are expressed as
a percentage of the AADT volumes during each hour of the day. These factors apply to all vehicle classes and are constant throughout the design life of the pavement system. These factors can be adjusted and customized by the user, but virtually no effect on the predicted pavement performance is seen with the current version of the MEPDG software.
v. Axle Load Distribution Factors. The distribution of the number of axles by load range is the definition of axle load spectra. An axle load spectrum distribution is referred to as axle load distribution factors in the MEPDG. The MEPDG software allows the user to enter a different set of axle load distribution factors for each vehicle class and each month.
vi. Traffic Growth Factors. Anticipation of truck volume growth after a road has opened is expressed in traffic growth factors. These factors are applied to individual vehicle classes. Axle load distributions are assumed to beconstant with time and no growth factors are applied to them. The MEPDG also had no provision for reduction in truck volume.

10
vii. Number of Axles per Truck. For each class, the number of axles per truck by axle type is required. The axle type is single, tandem, tridem, and quad. The number of axles per truck has a significant influence on the predicted pavement performance.
viii. Lateral Traffic Wander. Lateral traffic wander is defined as a lateral distribution of truck tire imprints across the pavement. Traffic wander plays an important role in the prediction of distresses associated with rutting. Default values for traffic wander are recommended unless quality data are available on a regional or local basis. Traffic wander data may be hard to gather and quantify so default values are highly recommended.
ix. Axle Configuration. The MEPDG software allows the user to enter two types of axle spacing. The first is axle spacing within the axle group, and it is defined as the average spacing between individual axles within the axle group (for example, the average spacing for all tridem axles for all vehicle types). Separate entries for tandem, tridem and quad axles are required. The second possibility is axle spacing between major axle groups. This is defined as the spacing between the steering axle and the first subsequent axle. Axle spacing between the major axle groups is required for short, medium, and long trucks. Axle configuration has a marginal effect on pavement performance predicted by the MEPDG, and is at the discretion of the user to pick default values or use measured values.
Within the MEPDG there are several traffic input factors that may not have significant influence on predicted pavement performance. As a result, sensitivity to these elements should be further investigated to gain a better understanding of their impact on predicted pavement performance(Swan, et al. 2007).
2.5 Climate/Environment and EICM
The MEPDG fully considers the influences of the climate and surrounding environment on pavement performance. This is achieved through a climatic modeling tool called the Enhanced Integrated Climate Model (EICM). The EICM requires two major types of input. Groundwater table depth is one input that is manually entered into the EICM. Weather related information, the second type of input, is primarily obtained from weather stations close to the project. The five weather related parameters used in the EICM include sunshine, rainfall, wind speed, air temperature, and relative humidity. These figures are collected on an hourly basis from the designated weather stations (Wang, et al. 2007). The data collected in the United States may come from the National Climatic Data Center (NCDC), National Oceanic and Atmospheric Association (NOAA) or other reliable sources. The EICM is a one-dimensional coupled heat and moisture flow model initially developed by the FHWA and adapted for use in the MEPDG. The purpose of the EICM is to predict and simulate the behavioral and characteristic changes in pavement and unbound materials related to environmental conditions over the service life of the pavement system (NCHRP 2008).
Climate and the surrounding environment (weather) play an important role in pavement performance. It can exert significant influences on the pavement structure, especially where seasonal changes are large. Changes in temperature, precipitation, and frost depth can drastically affect pavement performance. The MEPDG requires these inputs to be locally calibrated. As a result, these climate conditions are needed to be observed and correlated to pavement performance. One climatic factor that greatly influences pavement material properties is moisture. Moisture can affect properties such as stiffness and strength and therefore needs to be examined. In the MEPDG, a drainable base layer is to be included in the design. Water that has entered the pavement through this layer must be removed. The layer needs to maintain optimal thickness and structural capacity while having optimal permeability(Rabab'ah and Liang 2007).

11
The effectiveness of permeable bases in actual service is an ongoing process and more field monitoring, evaluation, and research is needed to satisfy the needs of the MEPDG.
In pavement design, the MEPDG requires the dynamic modulus for asphalt mixtures and the resilient modulus for unbound materials. Unsurprisingly, these properties are dependent upon changes, seasonal or otherwise, in temperature and moisture content. The MEPDG considers these changes in the pavement structure and subgrade over the design life of the pavement. This is achieved through the use of EICM. The model predicts temperature and moisture variations in the pavement structure throughout the seasons and adjusts material properties according to each particular environmental condition(Rabab'ah and Liang 2007). The user has two options within the EICM for adjusting the resilient modulus for each design period. In the first option, the user can provide the resilient modulus for each design period. The second option is to provide the resilient modulus for the optimum moisture content. When choosing the second option, the EICM in the MEPDG software would predict the seasonal variation of the moisture content in any unbound layers(Rabab'ah and Liang 2007).
2.6 Materials The MEPDG requires the use of material properties of the pavement layers to create a mechanistic analysis of the pavement responses. The parameters used in the MEPDG greatly outnumber those used by the 1993 AASHTO guide. In fact, the 1993 AASHTO guide material property factors only included structural layer coefficients, layer drainage coefficients, and the subgrade resilient modulus. It has been found that these parameters are insufficient to portray the complex material behaviors that occur in pavement structures. Some of these complex behaviors include stress dependent stiffness in unbound materials along with time and temperature dependent responses of asphalt mixes (Rabab'ah and Liang 2007). With the implementation of the MEPDG underway, it is important to understand the performance of pavement materials under differing conditions. Better and more accurate simulations of different pavement distress levels can be achieved when a complete spectrum of a material’s performance under altering conditions are entered into the design method(Petry, Han and Ge 2007). 2.6.1 Resilient Modulus and Unbound Layers One material characteristic used in the MEPDG is the resilient modulus, which provides a way for evaluating dynamic response and fatigue behavior of a pavement under vehicle loading. This material property and the test methods to obtain it have become an accepted standard approach for pavement engineers. The results of resilient modulus testing along with other properties of the materials are used to calibrate the design parameters used in the MEPDG (Petry, Han and Ge 2007). The resilient modulus of unbound materials is not a constant stiffness property. Rather, it is highly dependent on factors like state of stress, soil structures, and water content(Rabab'ah and Liang 2007). Generally, a soil with the same dry density that has higher water content yields a lower resilient modulus. One of the considerations found within the broad range MEPDG in the materials section is the characterization of unbound materials. Unbound materials consist of base, subbase(s) and subgrade. All play a vital role in a pavement system and the base layer is where the unbound materials start. The base layer is placed immediately under the surface course and above the subbase(s). The base layer is designed to distribute the load from the pavement course to the underlying subbase(s) and subgrade layers. In order to prevent failure in the layers below and handle the stresses in the base itself, the base layer thickness and quality must be sufficient. Proper characterization of the materials used in the base layer and subsequent layers used in pavement design is a very important task. By means of the MEPDG, these material properties can be adequately characterized(Hill, Yohannes and Khazanovich 2007).

12
2.6.2 Hierarchal Approach The MEPDG uses various models to estimate pavement performances from material properties that are measured or predicted. Depending on the available information and the desired reliability, different levels of analysis are available in the MEPDG’s hierarchal approach. The MEPDG hierarchal levels are based on design and analysis options and classified into three levels. The levels are based on accuracy, reliability, state-of-knowledge, and available data. Level 3 is the lowest level of the hierarchy. Level 3 uses predicted material properties and have the lowest degree of reliability. Level 1 is on top of the hierarchy and uses lab or field measured values for material properties resulting in the highest extent of reliability in the design and analysis of a pavement(Daniel and Chehab 2007). The MEPDG also uses a hierarchal approach to characterize materials. The resilient modulus at optimum moisture content is a desired property found by the MEPDG. The MEPDG hierarchy consists of three levels with different inputs based on the data available to the user. The overall objective of the three levels is to calculate or estimate the resilient modulus depending on what data has been collected.
A Level 1 input requires the use of lab testing of the resilient modulus as an input. If no resilient modulus lab test data are available, the MEPDG will calculate the resilient modulus using other properties in a Level 2 approach. These properties generally are the California Bearing Ratio (CBR) and/or the Dynamic Cone Penetrometer indexes obtained through standard AASHTO or NCHRP testing methods. Finally, the Level 3 analysis will estimate the resilient modulus at optimum water content based on the material classification(Hill, Yohannes and Khazanovich 2007). The three levels in the hierarchal approach are expounded on in the following list:
i. Level 1 input requires the highest quality of data. The data are collected from direct testing of the actual material. The desired data for Level 1 designs are the resilient modulus values of base, subbase, subgrade, and bedrock, which are determined from direct testing. The recommended test to obtain the resilient modulus is through the repeated triaxial test. The standard testing procedure can be followed by using the NCHRP 1-28 A method or the AASHTO T307 method(Rabab'ah and Liang 2007).
ii. Level 2 designs are used when direct lab test results are not available but other test results are. Although lab test results for the resilient modulus are the preferable source of data, the resilient modulus can be obtained using correlations. These correlations may be between the resilient modulus and physical properties of the material, such as dry unit weight, Atterberg limits, and specific gravity or between resilient modulus and strength properties such as the CBR, DCP, or unconfined compressive strength. All of the physical and strength properties can be obtained by following standard NCHRP or AASHTO procedures(Rabab'ah and Liang 2007). As with any correlations, having them locally calibrated is desired.
iii. Level 3 design is typically used for lower volume roads because it uses the lowest level of data accuracy. In this level, the resilient modulus for the optimum moisture content of the material is estimated based on the classification of the material. The ICM then adjusts the resilient modulus for the seasonal effects of the climate(Rabab'ah and Liang 2007).
Along with the hierarchal approach, the MEPDG recommends the use of available correlation relationships when using inputs to calculate or estimate the resilient modulus. It is highly encouraged that locally calibrated models be developed to make these calibrations more site-specific. This is where one of the problems is found. It is time consuming and expensive to develop locally calibrated correlation models. Whether it be lack of equipment, lack of manpower, or lack of money, locally calibrated models are hard to create. The other problem involves figuring out how to create these models. The answer is to create a unified model for tests of unbound materials. More time, money and research are being applied to

13
achieving this goal, and a unified approach to creating locally calibrated correlation models is underway(Hill, Yohannes and Khazanovich 2007).
2.6.3 Material Inputs All of the inputs required for the material side of the MEPDG are extensive and better shown in tabular form. Kelvin Wang and his colleagues have created a tabular summary of the material inputs that can be seen in Table 2.2 (Wang, et al. 2007). 2.7 Challenges and Opportunities With the ongoing efforts of trying to adapt the MEPDG, there are many challenges and opportunities that have arisen in the implementation of the MEPDG. One of the major challenges is the participation or “buy-in” of agencies to eventually make the MEPDG a tool for routine, day-to-day production work. This includes the agency as a whole to accept and embrace the change brought about by the MEPDG; and also the staff including, but not limited to, administrators, regional offices, designers, engineers, material specialists, etc. Following the buy-in by agencies, comes an effective implementation plan. This includes responsibilities, timelines, and gathering and allocating resources, such as people, equipment, training, etc. Also involved in an effective implementation plan are the calibration tasks and schedule to allow for more localized use of the MEPDG. Another challenge in the implementation of the MEPDG is developing the criteria to warrant implementation. This may include objectively based performance indicators (rutting, cracking, etc.), a committee to oversee and steer the use of the MEPDG, an audit process, and update and improvement assessments(Haas, et al. 2007). Finally, the development of database support is a lofty challenge but a necessary step towards the calibration and implementation of the MEPDG(Wang, et al. 2007). The above mentioned challenges are important to the implementation of the MEPDG; but are still overlooked as the biggest challenge and opportunity facing many agencies are calibration and validation. There is a need for actual calibration and validation models for all aspects of the MEPDG. Calibration or adjustment factors for the IRI and distresses (rutting, cracking, etc.) are needed. Databases of local and regional material and subgrade properties along with climatic or environmental conditions are necessary. Moreover, guidelines for the calibration and validation procedures are going to be needed. Finally, data collection is a must for the calibration effort. This includes traffic data (axle load spectra, volume variations, lane distribution, etc.) and climate and moisture data for the EICM. With these challenges come opportunities, mainly the opportunity to create a new level of advance pavement design that is based on the best science and engineering available. In other words, designing and constructing the most cost effective, longest lasting roadways that are of the highest level of reliability(Haas, et al. 2007). 2.8 Section Summary It can be seen that the MEPDG provides a powerful tool for pavement performance predictions. By taking into account elements from traffic, climate, and material data, a more extensive and complete view of pavement performance is created. Also, through the use of the EICM, needed environmental adjustments are made to the predictions. Furthermore, the hierarchal approach allows the MEPDG to be somewhat customizable based on the available data and the desired needs of the user. Due to the extensive nature of the MEPDG, there are definite challenges and opportunities that arise. By overcoming these challenges, the implementation of the MEPDG is being moved along and used in the accepting agencies throughout the United States and Canada.

14
Tab
le 2
.2 M
ajor
Mat
eria
l Inp
ut C
onsi
dera
tions
(Wan
g et
al.
2007
) M
ater
ials
Cat
egor
y M
ater
ial I
nput
s Req
uire
d
Mat
eria
ls in
puts
req
uire
d fo
r cr
itica
l re
spon
se c
ompu
tatio
ns
Add
ition
al m
ater
ials
inpu
ts r
equi
red
for
dist
ress
/tran
sfer
func
tions
A
dditi
onal
mat
eria
ls in
puts
req
uire
d fo
r cl
imat
ic m
odel
ing
Hot
-Mix
Asp
halt
Mat
eria
ls
(th
is co
vers
surfa
ce, b
inde
r, b
ase
and
subb
ase
cour
ses)
• Tim
e-te
mpe
ratu
re d
epen
dent
dyn
amic
m
odul
us (E
*) o
f HM
A m
ixtu
re.
• P
oiss
on's
ratio
.
• Ten
sile
stre
ngth
, cre
ep c
ompl
ianc
e,
coef
ficie
nt o
f the
rmal
exp
ansi
on
• Sur
face
shor
twav
e ab
sorp
tivity
(onl
y re
quire
d fo
r sur
face
cou
rse)
, the
rmal
co
nduc
tivity
, and
hea
t cap
acity
of H
MA
.
• Asp
halt
bind
er v
isco
sity
(stif
fnes
s)
char
acte
rizat
ion
to a
ccou
nt fo
r agi
ng.
PCC
Mat
eria
ls (t
his c
over
s sur
face
la
yer o
nly)
• S
tatic
mod
ulus
of e
last
icity
(E) a
djus
ted
with
tim
e.
• P
oiss
on's
Rat
io
• U
nit W
eigh
t
• Coe
ffici
ent o
f the
rmal
exp
ansi
on
• Mod
ulus
of r
uptu
re, s
plit
tens
ile st
reng
th,
com
pres
sive
stre
ngth
, cem
ent t
ype,
cem
ent
cont
ent,
wat
er-to
-cem
ent (
w/c
) rat
io,
ultim
ate
shrin
kage
, am
ount
of r
ever
sibl
e sh
rinka
ge.
• Sur
face
shor
twav
e ab
sorp
tivity
, the
rmal
co
nduc
tivity
, and
hea
t cap
acity
of P
CC
.
Che
mic
ally
Sta
biliz
ed M
ater
ials
(th
is c
over
s lea
n co
ncre
te, c
emen
t tre
ated
, soi
l cem
ent,
lime-
cem
ent-
fly a
sh, l
ime-
fly a
sh, a
nd li
me
stab
ilize
d la
yers
)
• Ela
stic
mod
ulus
(E) f
or h
igh
qual
ity le
an
conc
rete
, cem
ent t
reat
ed m
ater
ial,
soil
cem
ent,
and
lime-
cem
ent-f
ly a
sh.
• Res
ilien
t mod
ulus
(Mr)
for l
ime
stab
ilize
d so
il.
• P
oiss
on's
Rat
io.
• U
nit w
eigh
t.
• Min
imum
resi
lient
mod
ulus
(use
d in
fle
xibl
e de
sign
), m
odul
us o
f rup
ture
(use
d in
flex
ible
des
ign)
, bas
e er
odib
ility
(for
rig
id d
esig
n).
• The
rmal
con
duct
ivity
and
hea
t cap
acity
of
PCC
.
Unb
ound
Bas
e/ S
ubba
se a
nd
Subg
rade
Mat
eria
ls • S
easo
nally
adj
uste
d re
silie
nt m
odul
us
(Mr)
.
• P
oiss
on's
Rat
io.
• U
nit w
eigh
t.
• C
oeffi
cien
t of l
ater
al p
ress
ure.
• Gra
datio
n pa
ram
eter
s and
bas
e er
odib
ility
(fo
r rig
id d
esig
n).
• Pla
stic
ity in
dex,
gra
datio
n pa
ram
eter
s, ef
fect
ive
grai
n si
zes,
spec
ific
grav
ity,
satu
rate
d hy
drau
lic c
ondu
ctiv
ity, o
ptim
um
moi
stur
e co
nten
ts, p
aram
eter
s to
defin
e th
e so
il w
ater
cha
ract
eris
tic c
urve
.
Rec
ycle
d C
oncr
ete
Mat
eria
ls -
Frac
ture
d PC
C S
labs
• R
esili
ent M
odul
us (M
r).
• P
oiss
on's
Rat
io.
•Bas
e er
odib
ility
(for
rigi
d de
sign
). • T
herm
al c
ondu
ctiv
ity a
nd h
eat c
apac
ity.
Rec
ycle
d ho
t asp
halt
mix
(ce
ntra
l pl
ant p
roce
ssed
) Tr
eate
d sa
me
as h
ot-m
ix a
spha
lt su
rface
cou
rse.
Rec
ycle
d co
ld a
spha
lt m
ix (c
entra
l pl
ant o
r on-
grad
e)
Trea
ted
sam
e as
hot
-mix
asp
halt
surfa
ce c
ours
e.
Col
d re
cycl
ed a
spha
lt pa
vem
ent
(use
d as
agg
rega
te)
Trea
ted
sam
e as
gra
nula
r mat
eria
ls w
ith n
o m
oist
ure
sens
itivi
ty
Bed
rock
• E
last
ic m
odul
us (E
)
• P
oiss
on's
Rat
io.
• Uni
t wei
ght.
Non
e.
Non
e.

15
3. REGIONAL IMPLEMENTATION OF MEPDG 3.1 Background To help gather the necessary information and data on the MEPDG in the MPC region, it was intended that survey questionnaires be sent to all DOTs in the region to solicit their views on the MEPDG for which the results would be analyzed. However, just as the survey was to be undertaken, a user group meeting was organized by the various DOTs in the region to present their views and implementation plans on the MEPDG. It was decided to attend the meeting and record proceedings and findings and analyze the results. A copy of the survey questionnaire and the presentations of the representatives of the DOTs who attended the meeting are included in Appendix A and B respectively of this report. The summary of the findings of the MEPDG user group meeting is presented in the subsequent sections. 3.2 User Group Meeting Summary On March 9-10, 2009, a North-West states MEPDG User Group Meeting was held at Oregon State University in Corvallis, Oregon. The objective of the meeting was to look at the participating states’ implementation plans and progress, technical issues related to the MEPDG and the future direction of the MEPDG. The attending states included Alaska, Idaho, Montana, North Dakota, Oregon, South Dakota, Washington, and Wyoming. At least one representative from each state’s department of transportation was present at the meeting. In order for others to attend the meeting, a teleconference network was set up in Cheyenne for both days of the meeting. Day one consisted of two sessions, with the first session involving a general overview and national update along with state-specific implementation plans and progress. The second session involved general technical issues presented by the states. Day two also contained two sessions. Session three involved more specific technical issues. The meeting was concluded with the fourth session that focused on the future direction of the MEPDG. Each DOT representative gave a presentation about their own implementation plans and progress so far on the MEPDG. A summary of these presentations are outlined below. Copies of the full versions are included in Appendix B. 3.2.1 National Implementation of MEPDG Harold Von Quintus of Applied Research Associates (ARA) delivered a presentation during session one of the meeting, which focused on the MEPDG at the national level. The presentation provided a national update regarding the MEPDG, the new version of DARWin M-E, discussed implementation plans of the MEPDG, and presented some key steps to the implementation and views on future updates. According to Von Quintus, the DARWin M-E version 2.0 was initiated in February 2009 and is an 18-month process that involves 19 states participating in a pooled fund effort along with the FHWA and one Canadian province. Further mentions of the changes that will be made to specific areas when the DARwin 2.0 is released include:
i. Computation Methodology ii. Appearance – changes in data input screens
iii. Distress transfer function and/or distress mechanism It was added that even though these changes are proposed, AASHTO will be the one to decide what final changes will be made and that any significant changes will probably require a re-ballot. Ongoing studies associated with version 2.0 of DARWin-ME were also outlined. These studies include:
i. NCHRP 9-30A – Calibration of Rutting Models for HMA Structural and Mix Design ii. NCHRP 9-41 – Reflection Cracking of HMA Overlays

16
iii. NCHRP 9-42 – Top-Down Cracking of HMA iv. NCHRP 9-38, 9-44, 9-44A – Application of the Endurance Limit for HMA mixes
The presentation outlined implementation of the MEPDG as an integration into the day-to-day design practice as well as the validation and calibration of distress transfer functions to local conditions, materials, and policies. Attendees were informed that a questionnaire was sent to all states asking if the respective agency has an implementation plan of the MEPDG. Agencies in 23 states replied, indicating either having completed an implementation plan, being in the process, or being initiated in the near future. At the national level of the implementation of the MEPDG, four critical elements have been identified as key steps to a successful implementation program. These include:
i. A champion to lead the implementation effort and program ii. Communication
iii. Training iv. Adequate funding
It was further mentioned that the following five items will be needed for the integration of the MEPDG in practice activities:
i. Set up implementation committee and communications plan ii. Confirm default input values and set up input libraries (traffic and material inputs)
iii. Complete concurrent designs with the MEPDG iv. Verify reasonableness of final designs v. Begin training in the use of MEPDG software
At the meeting it was learned that training may be one of the major issues in the implementation of the MEPDG since at the moment there are currently many unknowns associated with the MEPDG. It was revealed that currently there are two National Highway Institute (NHI) training courses, which are:
i. NHI Course 131064 – Introduction to M-E Pavement Design ii. NHI Course 131109 – Analysis of New and Rehabilitated Pavement Performance with MEPDG
Software Von Quintus’ presentation concluded with a plan for future national updates. The main point was to plan for updates and improvements since the system is not perfect but can still be used. In order to plan for future updates, it was suggested to maintain a calibration-validation database along with input libraries; monitor the test sections and input parameters, update the database, and verify local calibration or agency-specific factors for future MEPDG versions. Currently, there is a calibration-validation database being developed under NCHRP Project 9-30 and enhanced under NCHRP 9-30A. This will provide features to store and manage data for calibrating M-E based methods at the national level. 3.2.2 Regional Implementation of MEPDG Of the eight states represented at the user group meeting, Montana is the only state that has completed its implementation program. The rest are either in the process or will initiate their implementation plan in the near future. At the user group meeting, session one focused on the implementation plans of the attending states even though not all states had a solid enough plan to present at the meeting. The implementation plans of Washington, Oregon, South Dakota, and Wyoming were presented and will be discussed. Washington DOT Implementation of MEPDG
The Washington Department of Transportation (WSDOT) uses the 1993 AASHTO Guide for Design of Pavement Structures as its current design tool. WSDOT is making many efforts on the MEPDG, including data preparation and calibration-validation. Areas of data preparation include traffic, material

17
properties, and pavement performance. They have both concrete pavement and flexible pavement sites laid for calibration-validation efforts. WSDOT released some major findings in their process of getting ready to implement the MEPDG in their agency. These major findings are:
i. MEPDG is an advanced tool for pavement design and evaluation ii. Calibration is required prior to implementation
iii. The concrete pavement calibration results need to be adjusted before use iv. The distress models for new flexible pavement have been calibrated to WSDOT conditions,
except the IRI model v. The calibration, along with implementation, is a contual process
vi. Local agencies need to balance the input data accuracy and costs vii. WSDOT will continue to monitor future works related to MEPDG
WSDOT has also created some future works, which include refining the calibration results for doweled JPCP slabs and Superpave, testing and calibrating rehab models for HMA overlay on HMA, and HMA overlay on PCCP; and preparing specific designs on high traffic loads, weak soil support, and mountain passes. Part of WSDOT’s implementation plan is to develop a user guide, prepare sample files for typical designs, and train pavement designers. Oregon DOT Implementation of MEPDG The Oregon Department of Transportation (ODOT) plans to have full implementation of the MEPDG by 2012. They are working closely with Oregon State University (OSU) researchers to help with the implementation process. Research was completed by OSU pertaining to back calculation software, and it was recommended that EVERCALC be utilized for this process. OSU also performed research on AC Dynamic Modulus and Axle Load Spectra. OSU is still researching traffic lane instrumentation. OSU also has ongoing research for perpetual pavement instrumentation as well as M-E pavement design inputs. For pavement instrumentation, research is being performed on I-5 and US-97. Design input research includes material characterization, climate data, and calibration. Future research that will be conducted by OSU includes:
i. HMA density ii. Open graded HMA
iii. Recycled Asphalt Pavement (RAP) mixtures iv. Recycled Asphalt Shingle (RAS) mixtures v. Asphalt Mixture Performance Tester (AMPT) pool fund study
From all the research performed by OSU, ODOT plans to have staff use the MEPDG for pavement design on some interstate projects. They plan to use interim guidance for the use of the MEPDG with their own pavement design guide until full implementation. During this time, individual agreements with the contractors will be made to decide what guide will be utilized and how it will be used. South Dakota DOT Implementation of MEPDG The South Dakota Department of Transportation (SDDOT) started their implementation process in 2005 with a research project called SD2005-01. The objective of the project was to identify the requirements and resources that will be needed for SDDOT to implement the MEPDG and develop a plan. These objectives were met by means of:
i. Conducting sensitivity analysis ii. Recommending input levels
iii. Determine resource requirements iv. Identify calibration requirements v. Developing an implementation plan

18
SDDOT’s current implementation plan is a result of the previous research. There are three main aspects of the current plan. First, create an MEPDG Implementation team called the SDDOT Transportation Implementation Group (SDDOT TIG). This will contain 12 SDDOT representatives, one FHWA representative, and two industry representatives. The industry representatives are from the South Dakota Concrete Pavement Association and the Dakota Asphalt Pavement Association. The second aspect is the development of a communication plan. This has been completed by SDDOT. The third aspect involves MEPDG training. This was completed in the fall of 2008. SDDOT wants to review and appraise the MEPDG software relative to its performance for South Dakota soils, materials, climate, traffic, and other considerations. This will be accomplished through the following active research projects:
i. SD2008-10 with Lance Roberts from the South Dakota School of Mines and Technology to determine resilient modulus and dynamic modulus values for soils and asphalt mixes typically used in South Dakota
ii. M-E/PDG design, validation testing, and monitoring through the Asphalt Research Consortium (ARC) with Peter Sebaaly from the University of Nevada Reno
iii. SD2008-03 with Sebaaly to evaluate Warm Mix in South Dakota iv. Evaluate coefficient of thermal expansion in SDDOT’s concrete lab and develop a database based
on SDDOT’s concrete mixes SDDOT has created a short-term, mid-term, and long-term implementation plan. In these stages, they hope to move towards full implementation after the next four years. Table 3.1 displays these termed plans and the associated goals. Table 3.1 SDOT Implementation Term Plans Short-Term (1-3 years)
• Review inputs’ significance using MEPDG Version 1.0 • Assess training needs and begin training • Begin database compilation using non-project specific data • Review recommendations for model calibration
Mid-Term (2-4 years)
• Conduct preliminary calibration of models • Acquire new equipment as needs define • Train personnel in new testing requirements • Begin using MEPDG alongside existing pavement design procedure • Develop MEPDG documentation and guidelines • Calibrate and validate models • Determine any further data collection needs
Long-Term (> 4 years)
• Move towards full implementation of MEPDG • Develop a design catalog for standard designs
Wyoming DOT Implementation of MEPDG The Wyoming Department of Transportation (WYDOT) wants a program that is implementable in a reasonable amount of time. Pavement design is housed within the materials program in WYDOT and is centralized. This results in good communications among the pavement engineers who are also the materials engineers. As a result of the program being centralized, there is a small staff which means training and implementation should be fairly easy. However, because of the small staff, difficulties arise in calibration and input development. That is, the centralized operation doesn’t have district advice from the various regions in the state. WYDOT feels the MEPDG would be utilized well for the state’s high volume roads, such as I-80, but the 1993 AASHTO guide is adequate for other roads. This led to the desire to implement the MEPDG because the 1993 AASHTO guide kept adding pavement thickness to I-

19
80. WYDOT started an implementation plan in 2006 but it primarily focused on the materials side of the MEPDG and went onto the “back burner.” It was found that this plan was too aggressive at the time. WYDOT has created new implementation goals. These goals include finding a good funding source and starting a program that will be usable and implementable by 2011. WYDOT wants to use existing information wherever possible and reduce the level of inputs. WYDOT has begun working with Applied Research Associates (ARA) to get the experience desired to run the program. WYDOT wants to utilize ARA because they are also working with neighboring states that have a more aggressive implementation plan. WYDOT narrowed things down to focus on primary design and rehab alternatives. They plan to utilize existing sites for calibration and focus on level 2 and level 3 inputs. One goal is to create a Wyoming specific design manual that focuses on the inputs. Eventually, WYDOT wants to implement it for all pavement designs. WYDOT is in more of a rehabilitation mode rather than new construction mode; for example, most projects in Wyoming involve widening and/or overlays. This is a weaker area in the guide, but it is where WYDOT wants to focus. WYDOT faces challenges with climate data, traffic inputs, and materials inputs. For climate inputs, there are not enough existing weather stations, so interpolation will have to suffice. WYDOT has good count and classification data for the traffic inputs, but there is a limited number (only 9) of weigh in motion (WIM) sites in the state. The result is limited WIM coverage because most of them are on high traffic routes, such as I-80 and I-25. In the materials area, correlation of the R-Value to MR and back-calculations from FWD will pose a challenge. Furthermore, the properties of existing HMA layers are insufficient and there are not a lot of existing data for concrete inputs. Finally, the challenges with calibration-validation involve few granular base sites, no Superpave mixture sites, and no dowelled PCCP sites. 3.2.3 Ongoing Research Throughout the North-West states involved in the user group meeting, there is a lot of ongoing research to move the implementation of the MEPDG forward. This research has focused primarily on three main areas in the MEPDG: traffic, climate, and materials. Also, calibration and validation of the model specific to the agency is an area of research. Traffic The majority of research in this area is being performed by OSU and is focused on Axle Load Spectra, which is a valuable dataset that can be used for traffic inputs within the MEPDG. OSU recently completed research on WIM sites throughout Oregon. They are currently working on traffic lane instrumentation. WSDOT is also performing research on the traffic data collection effort, focusing on traffic data preparation, Axle Load Spectra development, and sensitivity analysis. The main objective of both WSDOT and OSU is how to best collect traffic data for use in the MEPDG. Climate Research in Illinois is being conducted on the effects of climate change on rigid pavements in that state. Five regions in Illinois host research tools for climate effects, and give a large range of coverage with varying types of climates. A preliminary conclusion is that climate effects may change the slab thickness by 1.5 inches. Illinois is also researching temperature curling in their rigid pavements. The Idaho Department of Transportation and the University of Idaho have been researching the environmental variation effects in the MEPDG design. They are developing seasonal shift factors for various regions and trying to implement these shift functions into the M-E design process to predict the accumulated seasonal damage. From this research, they are developing a software package called WINFLEX that is M-E overlay design software for Idaho.

20
Materials There is a great amount of research being performed on the materials side of the MEPDG. These research projects are being performed by a majority of the states and include:
i. ODOT & OSU - How to run pavement rehabilitation using FWD back calculations. The current recommendation of this research is to utilize EVERCALC as the software program for back calculations.
ii. ODOT – How to model composite pavements. This research is focusing on the MEPDG modeling of composite pavements such as HMA overlays on top of CRCP, JPCP, or Rubblized PCC.
iii. SDDOT - SD2008-10 determine resilient modulus and dynamic modulus values for soils and asphalt mixes typically used in South Dakota
iv. SDDOT - M-E/PDG design, validation testing, and monitoring through the Asphalt Research Consortium (ARC) with Peter Sebaaly from the University of Nevada Reno
v. SDDOT - SD2008-03 with Peter Sebaaly from the University of Nevada Reno to evaluate warm mix in South Dakota
vi. SDDOT - Evaluate coefficient of thermal expansion in SDDOT’s concrete lab and develop a data base based on SDDOT’s concrete mixes
vii. Jon Epps – Characterizing asphalt mixtures with RAP. This research studies the influence of RAP on MEPDG models
viii. Alaska DOT –How to characterize non-standard materials ix. Alaska DOT – How to characterize soils and unbound materials x. Harold Von Quintus of ARA – How to characterize wearing surfaces such as SMA, OGFC, and
rubber modified surfaces. Calibration-Validation Oregon DOT, OSU, and Washington DOT are currently working on how to calibrate and validate performance curves within the MEPDG. 3.2.4 Future Direction of MEPDG Session four of the meeting focused on the future direction of the MEPDG. This was an open forum type of discussion where challenges and barriers were discussed and established. The group decided that the following are the challenges and barriers associated with the MEPDG:
i. Cost of the software through AASHTO Darwin M-E is a big issue for the participating states. The states may be able to afford the software but consultants, cities, and counties may not be able to purchase it.
ii. Acquiring field performance data to calibrate, e.g., top-down or bottom-up AC fatigue cracking identification.
iii. Lack of a design catalog and the creation of a design catalog iv. Communicating to industry about MEPDG and future changes v. Posting or Web hosting discussions and presentations from other regions
vi. Sharing calibration information from other states in the region

21
It was also evident at the user group meeting that Washington and Oregon are the furthest along with evaluating the MEPDG, and so these agencies were deemed the regional experts for the North-West region. These agencies will therefore be the leaders of the implementation process for the region and will be the ones to turn to for guidance. Furthermore, the group discussed the limitations they have found with the MEPDG. This was also an open discussion where the following limitations were voiced:
i. Studded tire / mechanical wear and IRI prediction for PCC (WSDOT) ii. Longitudinal cracking prediction on concrete pavement (WSDOT)
iii. Field definition of top-down and bottom-up fatigue cracking iv. Rehabilitation and back calculation v. Use of geotextiles (Wyoming)
vi. Low volume roads vii. Aggregate base rutting is too high, which forces more AC (Idaho)
viii. Thermal cracking model prediction (SDDOT) ix. Non-standard materials (FDR, foamed asphalt, RAP, OGFC) x. Thin AC surfacing and predicted distresses
Finally, the group discussed the need for MEPDG regional pooled fund studies and future meetings. The following ideas were developed by the user group:
i. Asphalt Research Consortium (ARC) study from the University of Nevada-Reno to monitor and test Superpave mixtures and MEPDG flexible structures
ii. Regional material and performance database iii. MEPDG forum to share and discuss technical issues in the northwest region. This will be more
useful than a training class on operating software. Face-to-face meeting was useful, but Webinar helps meet larger audience. Host Webinar meetings at FHWA division office.
This concluded the North-West states user group meeting related to the implementation of the MEPDG. 3.3 Section Summary This section outlined the regional as well as the national implementation of the MEPDG. The section focused on the presentations delivered by the various DOTs in the North-West states for the implementation plans of the MEPDG that attended the user group meeting in Oregon. The section also outlined areas in which more research was needed and also the future direction of the MEPDG.

22

23
4. CHALLENGES AND LIMITATIONS TO MEPDG IMPLEMENTATION
4.1 Background With the ongoing efforts of trying to adapt the MEPDG, there are many challenges and opportunities that have arisen in the implementation of the MEPDG. One of the major challenges is the participation or “buy-in” of the agencies to eventually make the MEPDG a tool for routine, day-to-day production work. This includes the agency as a whole to accept and embrace the change brought about by the MEPDG, and also the staff, including, but not limited to, administrators, regional offices, designers, engineers, material specialists, etc. Following the buy-in by agencies come effective implementation plans. These include responsibilities, timelines and gathering and allocating resources, such as people, equipment, training, etc. Also involved in an effective implementation plan are the calibration tasks and schedule to allow for more localized use of the MEPDG. Another challenge in the implementation of the MEPDG is developing the criteria to warrant implementation. This may include objectively based performance indicators (rutting, cracking, etc.), a committee to oversee and steer the use of the MEPDG, an audit process and update and improvement assessments(Haas, et al. 2007). Finally, the development of database support is a lofty challenge but a necessary step towards the calibration and implementation of the MEPDG(Wang, et al. 2007). The above named challenges are important to the implementation of the MEPDG; but overlooked as the biggest challenge and opportunity facing many agencies are calibration and validation. There is a need for actual calibration and validation models for all aspects of the MEPDG. Calibration or adjustment factors for the IRI and distresses (rutting, cracking, etc.) are needed. Two key aspects are critical to a successful rutting model calibration: data and method. Regarding data, existing in-field information only provides total rut depth, which could not meet the requirement of permanent deformation in each structural layer by the MEPDG. Concerning the method, existing work either fails to address calibration factors from a holistic perspective by only focusing on individual sections separately or ignores variability inherent in those factors. In this study, layer-wise permanent deformation from instrumented pavement under accelerated pavement testing serves to accommodate the models calibration. A systematic calibration procedure is established, which globally optimizes all available information across all test sections. Through simulation and numerical optimization, optimal calibration shift factors for three typical flexible pavement materials, asphalt mixture, unbound granular base, and fine grain soil are obtained as 0.60, 0.49, and 0.84, respectively (Hong and Chen 2008). This implies that the uncalibrated MEPDG is biased toward over prediction of rut depth. It is further suggested that a more rational result for each calibrated factor is to introduce an appropriate distribution to characterize its uncaptured variability (Hong and Chen 2008). Databases of local and regional material and subgrade properties, along with climatic or environmental conditions, are necessary. Moreover, guidelines for the calibration and validation procedures are going to be needed. Finally, data collection is a must for the calibration effort. This includes traffic data (axle load spectra, volume variations, lane distribution, etc.) and climate and moisture data for the EICM. With these challenges come opportunities, mainly the opportunity to create a new level of advance pavement design that is based on the best science and engineering available. In other words, designing and constructing the most cost effective, longest lasting roadways that are of the highest level of reliability(Haas, et al. 2007).

24
Also at the North-West MEPDG User Group meeting held at OSU, the group concluded that the following are the challenges associated with the MEPDG:
i. Cost of the software through AASHTO Darwin M-E is a big issue for the participating states. The states may be able to afford the software but consultants, cities, and counties may not be able to purchase it.
ii. Acquiring field performance data to calibrate, e.g., top-down or bottom-up AC fatigue cracking identification.
iii. Lack of and the creation of a design catalog iv. Communicating to industry about MEPDG and future changes v. Posting or Web hosting discussions and presentations from other regions
vi. Sharing calibration information from other states in the region The user group also came up with the following limitations associated with the MEPDG:
i. Studded tire / mechanical eear and IRI prediction for PCC (WSDOT) ii. Longitudinal cracking prediction on concrete pavement (WSDOT)
iii. Field definition of top-down and bottom-up fatigue cracking iv. Rehabilitation and back calculation v. Use of geotextiles (Wyoming)
vi. Low volume roads vii. Aggregate base rutting is too high, which forces more AC (Idaho)
viii. Thermal cracking model prediction (SDDOT) ix. Non-standard materials (FDR, foamed asphalt, RAP, OGFC) x. Thin AC surfacing and predicted distresses
4.2 Section Summary This section described the challenges to the MEPDG implementation in the MPC region. Among the challenges identified at the MEPDG user group meeting included cost of the software through AASHTO, acquiring field performance data to calibrate, lack of and the creation of a design catalog, communicating to Industry about MEPDG and future changes, posting or Web hosting discussions and presentations from other regions, and sharing calibration information from other states in the region. It was also determined that training may be one of the major issues in the implementation of the MEPDG. There are a lot of unknowns associated with the MEPDG.

25
5. IDENTIFYING RESEARCH NEEDS 5.1 Background It is obvious that the future adoption of the MEPDG will have considerable effects on data collection, material testing, and pavement design procedures. The mechanistic–empirical procedures upon which the guide is based will require greater quantity and quality of input data in the following four major categories: traffic, material characterization, environmental variables, and historical pavement performance (pavement response and distress) (Schwartz 2007). Input data requirements for the MEPDG are much more extensive than for the current AASHTO Design Guide procedure. Although some of the data for the MEPDG are similar to that for the AASHTO guide (e.g., annual average daily truck traffic, vehicle class distributions, subgrade resilient modulus, concrete modulus of rupture and modulus), much is significantly different; more detailed input information may be required (e.g., axle load distributions by axle type, asphalt concrete dynamic modulus, thermo-hydraulic properties for unbound materials, etc.). Due to the extensive data requirement for the MEPDG, there is currently extensive ongoing research into different areas of the guide in order to facilitate the implementation of the MEPDG in the North-West states’ DOTs. Most DOTs in the region are currently concentrating their research efforts in the areas of traffic, climate, materials, and pavement response and distress models (pavement performance). Calibration and validation of the MEPDG to local conditions, which are agency specific, are also areas most of the agencies are studying. Research studies being undertaken at the national level are mostly associated with the prediction models of the MEPDG and with version 2.0 of DARWin-ME. These include NCHRP 9-30A – Calibration of Rutting Models for HMA Structural and Mix Design, NCHRP 9-41 – Reflection Cracking of HMA Overlays, and NCHRP 9-42 – Top-Down Cracking of HMA and NCHRP 9-44A – Application of the Endurance Limit for HMA mixes. This report classifies the MEPDG research needs in to national and regional categories, and are detailed in the following sections. 5.2 National Research Needs Current national research focuses on the predictive models and other areas of the MEPDG, and are associated with version 2.0 of DARwin-ME. The predictive models being studied related to Hot Mix Asphalt (HMA) mixes. Some of these studies are currently ongoing, and it is envisaged that when completed will address various aspects of the guide and help facilitate its implementation. The research being undertaken as part of the predictive models of the MEPDG would still have to be calibrated and validated to local conditions specific to an agency, since the calibration and validation efforts are a continuous process. Research areas are discussed in detail in the following sections. 5.2.1 NCHRP 9-30A – Calibration of Rutting Models for HMA Structural
and Mix Design This research study is currently ongoing and seeks to recommend revisions to the current HMA rutting prediction model in the MEPDG and software developed in NCHRP Project 1-37A. The research is being undertaken by ARA Inc. When completed, the company will submit its recommendation to NCHRP Project 1-40 panel and the AASHTO Joint Task Force on Pavements for consideration. According to ARA Inc., the recommended revisions will be based on the calibration and validation of distress models with measured materials properties and performance data from existing fields and other full-scale pavement sections that incorporate modified as well as unmodified asphalt binders. It is intended that this research will enhance the accuracy of the distress prediction model in the MEPDG and offer an acceptable correlation between the levels of permanent deformation observed in the field and the levels predicted with the HMA distress models used in the structural and mix design. Also according to the

26
company, this study will be building on the product of NCHRP Project 9-30. The results from these measured materials properties will then be used to calibrate and validate the HMA rutting distress model in the MEPDG to further improve its goodness-of-fit and overall accuracy. The ARA indicates that consideration will also be given to calibration and validation of other promising models of HMA rutting distress (Quintus and Harrigan 2005). 5.2.2 NCHRP 1-41 – Reflection Cracking of HMA Overlays Even though preliminary models for predicting the extent and severity of reflection cracking in HMA overlays have been developed, only limited research has been performed to evaluate and validate these models. Research is therefore needed to address the issues of reflection cracking and develop mechanistic-based models for use in the MEPDG for the analysis and design of HMA overlays. In this respect, the Texas A&M Research Foundation is currently undertaking a study called Reflection Cracking of Hot-Mix Asphalt Overlays. The purpose of the study is to identify and develop mechanistic-based models for predicting reflection cracking in HMA overlays of flexible and rigid pavements and associated computational software for use in mechanistic–empiricalprocedures for overlay design and analysis. Studies show that reflection cracking is one of the primary forms of distress in HMA overlays of flexible and rigid pavements. Not only does the penetration of water and foreign debris into these cracks accelerate the deterioration of the overlay and the underlying pavement, but it also affects ride quality, consequently reducing service life. Research indicates that the basic mechanism that causes reflection cracking is strain concentration in the overlay due to movement in the existing pavement near joints and cracks. This movement may be induced by bending or shear action resulting from traffic loads or temperature changes and is influenced by traffic volume and characteristics, daily and seasonal temperature variations, and other factors (e.g., pavement structure and condition, HMA mixture properties, and the degree of load transfer at joints and cracks). The research is intended to help account for the effects of reflection cracking on pavement performance, thus improving the analysis and design of HMA overlays of flexible and rigid pavements (Lytton and Hanna 2005). 5.2.3 NCHRP 1-42A – Top-Down Cracking of HMA Studies have determined that load-related HMA fatigue cracks do not always initiate at the bottom of the HMA layer and propagate to the top, but can also be initiated at the surface of the pavement and propagate downward through the HMA layer. These studies have determined that environmental conditions, tire-pavement interaction, mixture characteristics, pavement structure, and construction practices are among the factors that influence the occurrence of these cracks. Hypotheses regarding the top-down cracking mechanisms have been suggested; test methods for evaluating HMA mixture susceptibility to cracking have been proposed; and preliminary models for predicting crack initiation and propagation have been developed. However, only limited research has been performed to evaluate and validate these hypotheses, test methods, and models. Thus, research is needed to evaluate these hypotheses and develop models for predicting initiation and propagation of top-down cracking in HMA layers. This research, currently being undertaken by the University of Florida is a follow up from NCHRP Project 1-42, which was completed in 2005 and provided further review of some of the issues related to top-down cracking. The project identified mechanisms that govern initiation and propagation of top-down cracking, laboratory tests of HMA mixtures for determining susceptibility to top-down cracking, significant factors associated with the occurrence of top-down cracking, and models for predicting the initiation and propagation of top-down cracking in HMA layers. The report further indicated that additional research was needed to address the issues associated with top-down cracking and to develop mechanistic-based models for use in mechanistic–empirical procedures for design and analysis of new and rehabilitated flexible pavements. It was in this regard that the NCHRP Project 1-42A was initiated. But a recent Transportation Research Board report indicates that the follow-up to research NCHRP Project 1-42A has just been completed with a revised report due last February. The purpose of the

27
NCHRP Project 1-42A was to identify and develop mechanistic-based models for predicting top-down cracking in HMA layers for use in the MEPDG for design and analysis of new and rehabilitated flexible pavements (Reynaldo and Hanna 2006). 5.2.4 NCHRP 9-44A – Application of the Endurance Limit for HMA mixes Performance data from well-constructed flexible pavements with a thick HMA structure, some of which have been in service for more than 40 years, show that bottom-up fatigue cracking does not occur in these pavements. This field experience suggests that an endurance limit, which is the level of strain below which fatigue damage does not occur for any number of load repetitions, is a valid concept for HMA mixtures; its quantification could aid in the efficient design of long-life flexible pavements with a significantly reduced life cycle cost (National Center for Asphalt Technology - NCAT). But reports suggest that no strain level in an asphalt layer below which fatigue damage does not occur, known as the endurance limit, has been established for HMA pavements. Defining an endurance limit for HMA mixtures will result in more efficient structural design of pavements for mixtures of different characteristics. Pavement design approaches, such as the 1993 AASHTO pavement design guide and the Mechanistic–Empirical Pavement Design Guide developed in NCHRP Projects 1-37A and 1-40, do not recognize endurance limits for HMA pavements. This is because research into the fatigue of HMA mixtures has been limited. According to a report released by the TRB, in order to conduct research into this area of HMA pavements, studies were conducted in three parts with the first part, NCHRP Project 9-38, initiated in 2004 and completed in December 2009 with the final report due to be published in early 2010. This part was conducted by the National Center for Asphalt Technology at Auburn University. NCHRP Project 9-38 was conducted to establish the existence of an endurance limit for HMA mixes. This was followed by the second part, NCHRP Project 9-44, initiated in 2007 and completed in 2009 by Advanced Asphalt Technologies, LLC. Having already undertaken NCHRP 9-38, the purpose of this research was to prepare research plans to validate the existence of an endurance limit for HMA mixes in pavements through an analysis of laboratory and field data, determine the difference between the endurance limits for HMA mixes measured in the laboratory and the field, and identify and recommend methodologies for incorporating an endurance limit in HMA mixes for the mechanistic–empirical pavement design. Currently the only active part of this three-part research NCHRP Project 9-44A, is being undertaken by Arizona State University and due to be completed in 2012. The purpose of the third research study in the series on endurance limits for HMA pavements is to undertake laboratory investigation to identify the mixture and pavement layer design features related to an endurance limit for bottom-initiated fatigue cracking of HMA and develop a systematic procedure for incorporating this endurance limit into the MEPDG and other selected pavement design methods. It is intended that the implementation of a fully characterized and validated endurance limit in the mechanistic–empirical pavement design guide (MEPDG) software will enhance the ability to prepare long-life HMA pavement designs that achieve a balance between practical layer thickness and desired fatigue performance. It is also suggested by those undertaking the research that a future Project 9-44B is anticipated to conduct field validation of the endurance limit algorithm and further revise the algorithm as determined by the results of the field validation (Witczak and Harrigan 2009). 5.2.5 Rehabilitation of Flexible and Rigid Pavements Another area that appears to have a national research focus is the recommendations on the rehabilitation of both flexible and rigid pavements. From all indications this appears to be the weakest part of the recently developed MEPDG. The guide seems to have focused mainly on the issue of new flexible and rigid pavement design rather than techniques for selecting the optimal pavement rehabilitation. This is a challenge as most DOTs are now frequently more interested in selecting the optimal rehabilitation technique for existing roadway pavements than designing new ones. A study is therefore proposed to update the rehabilitation recommendations in the MEPDG and to provide DOTs with state of the art

28
approaches for both pavement forensic investigations and strategy selection guidelines. The proposed study will provide DOTs with guidelines on how to conduct failure investigations based on the existing pavement distress and type (Claros 2007). 5.2.6 Coefficient of Thermal Expansion The coefficient of thermal expansion of concrete is another area with a national research focus. Several studies in the past few years have identified the coefficient of thermal expansion (CTE) as one of the most significant inputs or classified as an extremely sensitive input in the MEPDG for designing rigid pavements. The CTE can affect the performance of concrete pavement and its service life. CTE tends to affect the curling and axial stresses and, as a result, affects the performance and serviceability of the pavement structure and also has influence on early age cracking, fatigue cracking, faulting, and joint spalling from CTE. Values of CTE tend to depend on the concrete composition, age, and moisture state and can vary extensively among aggregates due to mineralogical differences. Even the same aggregate type can present different CTEs as a result of the differences in the mineralogical content (Elfino, et al. 2009). Recent studies by the FHWA have identified an error in the method used to measure the CTE of concrete. The report indicates that both LTPP and non-LTPP rigid pavement projects were used to calibrate the rigid pavement models for the MEPDG (LTPP accounted for over 85% of the sections used in the calibration). Therefore, all of the CTE results reported in the LTPP database need to be adjusted. This data were used to nationally calibrate the models in the MEPDG, and due to the magnitude of the adjustment required, the models need to be recalibrated to avoid improper designs due to the use of lower CTE values with models based on the higher CTE values. If the models are not recalibrated, the pavement thickness may be underestimated (NCHRP Report 20-7 2009). 5.2.7 Effect of Geogrids and Geotextiles Studies have shown that properly installed geosynthetics can generate considerable cost savings and improved performance of aggregate base courses used in highway pavement construction. The use of geosynthetics can produce significant economic benefits, such as the reduction in required thickness of the pavement structure for a given level of performance, with reductions as great as 11 inches being reported in some cases. Other advantages of using geosynthetics in pavement construction include the ability to extend pavement service life without increasing pavement thickness and without sacrificing performance. Reports suggest that while many agencies are currently using geosynthetics, there is a significant lack of understanding of the fundamental properties of these materials, thereby forcing designers to rely on conservative estimates when considering the contribution of geosynthetics in the performance of the pavement structure. It is imperative that a deeper understanding of the interactions between geosynthetics and aggregate base courses is needed, as well as a more fundamental method and guidelines for incorporating the properties of geosynthetics into existing pavement design practices, such the new MEPDG (AASHTO Joint Technical Committee on Pavements 2009). 5.3 Regional Research Needs Inasmuch as further research and study are needed and being undertaken on the MEPDG at the national level, state DOTs seeking to implement the MEPDG have also identified various areas in which further research is needed to help facilitate the regional implementation of the MEPDG. At the North-West user group meeting, held at Oregon State University March 9-10, 2009, it was evident that additional research into the MEPDG was necessary. It is against this background that almost all the states in the North-West region are undertaking further research into the MEPDG. The areas that most DOTs are focusing on are traffic, climate, materials, and pavement response and distress. Calibration and validation of the MEPDG

29
to local conditions also needs to be undertaken on a continual basis. These research areas are outlined in the subsequent paragraphs. 5.3.1 Traffic Data Characteristics Traffic characteristics are one of the major inputs of the MEPDG and are expected to require significant attention. The current AASHTO Pavement Design Guide requires traffic data in ESALs as a major design input. The MEPDG traffic criteria have been developed around axle load spectra, which are a valuable dataset that can be used for traffic inputs within the MEPDG. It is through axle load spectra that the unique traffic loadings of a given site are characterized. By means of these loading characteristics, pavement responses and resulting damages can be computed. Full axle load spectra are used for estimating the magnitude, configuration, and frequency of traffic loads (Wang, et al. 2007). The benefit of load distributions is that they provide a more direct and rational approach for the analysis and design of pavement structures. The approach estimates the effects of actual traffic on pavement response and distress. Currently in the North-West Region, the Oregon Department of Transportation (ODOT) in collaboration with Oregon State University, is concentrating their research efforts mostly in the area of the axle load spectra before going on to other areas. Consequently, OSU recently completed research on Weigh in Motion (WIM) sites throughout Oregon and is now working on traffic lane instrumentation. The other area of traffic characteristics is traffic data collection, which is being undertaken by the Washington State Department of Transportation (WSDOT). As part of the research, WSDOT is working on traffic data preparation, axle load spectra development, and sensitivity analysis. The underlying objective for both WSDOT and OSU in undertaking this research is how best to collect realistic traffic data for use in the MEPDG. Data sources may include site-specific data from Average Vehicle Counts (AVC) and WIM stations and default data from the FHWA LTPP program and the MEPDG software. The traffic data should contain the following elements if possible: truck volume and highway parameters, monthly traffic volume adjustment factors, vehicle classification distribution, hourly traffic volume adjustment factors, axle load distribution factors, traffic growth factors, number of axles per truck, lateral traffic wander, and the axle configuration. 5.3.2 Climatic/Environment Factors Climate and the surrounding environment (weather) play an important role in pavement performance and thus have a major impact on the pavement’s long-term performance. It can exert significant influences on the pavement structure, especially where seasonal changes are large. These factors include precipitation, temperature, and free-thaw cycles together. Changes in temperature, precipitation, and frost depth can drastically affect pavement performance. The behavior of layers in the pavement system is affected by climatic factors (Johanneck and Khazanoch 2009), and the MEPDG requires these inputs to be locally calibrated. As a result, these climate conditions need to be observed and correlated to pavement performance. One climatic factor that greatly influences pavement material properties is moisture, which can affect properties such as stiffness and strength and therefore needs to be examined. A preliminary conclusion, deduced from research conducted in Illinois on the effects of climate change on rigid pavements in that state, indicates that this may change slab thickness by 1.5 inches. The Idaho Department of Transportation and the University of Idaho have also been researching the environmental variation effects in the MEPDG design. They are developing seasonal shift factors for various regions and are trying to implement these shift functions into the MEPDG process to predict the accumulated seasonal damage. From this research, they are developing a software package called WINFLEX, a mechanistic–empirical overlay design software for Idaho.

30
5.3.3 Materials Characterization Material characterization for the mechanistic–empirical design procedure is significantly more fundamental and extensive than in the current empirically-based AASHTO Design Guide. The MEPDG requires the use of material properties of the pavement layers to create a mechanistic analysis of the pavement responses. It is therefore imperative that databases or libraries of typical material property inputs must be developed. Due to the extensive nature of the material inputs, a great deal of current research is being performed on pavement materials characterization of the MEPDG. One study focuses on how to run pavement rehabilitation using FWD back calculations. The ODOT and OSU are undertaking this study for which their current recommendation for this research is to utilize EVERCALC as the software program for back calculations. ODOT is researching MEPDG modeling of composite pavements such as HMA overlays on top of CRCP, JPCP, or rubblized PCC. Other future research that OSU/ODOT plans to undertake includes HMA density, open graded HMA, Recycled Asphalt Pavement (RAP) mixtures, Recycled Asphalt Shingle (RAS) mixtures and Asphalt Mixture Performance Tester (AMPT) pool fund study. The South Dakota Department of Transportation, on the other hand, is currently undertaking research on how to determine resilient modulus and dynamic modulus values for soils and asphalt mixes typically used in South Dakota. Also in collaboration with Peter Sebaaly from the University of Nevada Reno, SDDOT is undertaking validation testing and monitoring through the Asphalt Research Consortium (ARC). SDDOT is also seeking to evaluate coefficient of thermal expansion and develop a database based on the DOT’s concrete mixes. In addition to this, they are seeking to evaluate warm mixes as applied to the MEPDG. Other areas of research into pavement materials being undertaken include characterization of asphalt mixtures with RAP to observe the influence of RAP on MEPDG models and how to characterize wearing surfaces such as SMA, OGFC, and rubber modified surfaces. The Alaska DOT is also currently studying how to characterize non-standard materials, soils, and unbound materials. 5.3.4 Pavement Performance Pavement performance data are required for local calibration and validation of the MEPDG procedure and are mainly associated with pavement distresses. These include fatigue cracking (alligator and longitudinal), rutting and roughness. An accurate record of historical pavement performance, which in most cases is within an agency’s PMS, is therefore a necessity. The MEPDG does not provide a design thickness but it uses mechanistic–empiricalnumerical models to analyze input data for traffic, climate, material, and proposed structure and then estimates the damage accumulation over the service life of the pavement. The pavement performance predictions within the MEPDG are made in terms of the distresses, which are often evaluated to determine rehabilitation and reconstruction needs in HMA pavements (Hoegh, et al. 2009). 5.3.5 Calibration and Validation Currently, the MEPDG includes empirical distress models that have been calibrated using a national database. Most of the data used for the national calibration were obtained from the Long Term Pavement Performance (LTPP). It is therefore necessary that calibration of the MEPDG models be undertaken using local pavement condition data (Souliman, et al. 2009). In order to successfully calibrate and validate the MEPDG procedure to local conditions, pavement performance data are required. The process involves the replacement of the of the national calibration coefficients in the empirical distress prediction models with values more suited to local conditions. The calibration process usually requires the selection and identification of a set of experimental pavement sections; MEPDG inputs, such as traffic, environment, and material properties, can be well quantified and for which a history of pavement performance data, such as rutting, fatigue cracking, and roughness, are available. All of the above mentioned pavement

31
distresses need to be calibrated to local conditions. Studies have shown that local calibration of the MEPDG procedures can be very beneficial in improving pavement performance predictions for local conditions. A well calibrated prediction model results in a reliable pavement design and enables precise maintenance plans for state highway agencies. The process, however, requires a significant amount of effort to perform (Schwartz 2007). 5.4 Section Summary This section described the areas in which further research is needed, both on the national and regional level in order to successfully implement the MEPDG. The main areas of research that most DOTs are focusing on in the region are the traffic, materials, and climate inputs and pavement performance distress models. These model inputs are required in order for the MEPDG distress models to reliably predict the pavement performance. These areas of research are also needed in order to successfully calibrate and validate the MEPDG to local pavement conditions. It is by calibrating and validating the MEPDG to local pavements conditions that reliable predictions of the pavement can be obtained.

32

33
6. CONCLUSIONS AND RECOMMENDATIONS 6.1 Conclusions Ongoing research suggests that with the Mechanistic Empirical Pavement Design Guide (MEPDG), it is anticipated that a more reliable design will be created (Wagner), which provides significant potential benefits over the 1993 AASHTO guide in achieving cost-effective pavement designs and rehabilitation strategies (Coree, et al. 2005). A very important aspect of the MEPDG is its user-oriented computational software program, which uses an integrated approach for predicting pavement condition over the design life by accounting for the interaction of traffic, climate, and pavement structure, and also allows for evaluating design variability and reliability. The software will also serve as a forensic tool for analyzing the condition of existing pavements and pinpointing deficiencies in past designs (Coree, et al. 2005). The MEPDG will allow pavement engineers and designers to make better informed decisions and take cost effective advantage of new materials and features. The adoption of the MEPDG will significantly improve pavement material testing, design procedures, and, most importantly, data collection (Schwartz 2007). The design guide will also allow for calibration to national, regional, or local performance data for materials, climate, and traffic (Wagner), thereby allowing agencies the greatest possible flexibility for applying and calibrating the design procedures to their local conditions (Schwartz 2007). Despite the significant benefits associated with the implementation of the MEPDG, its extensive data requirements from traffic, material, and climate inputs, however, pose some challenges. A number of further research areas have also been identified for the MEPDG at the national, regional, and local levels which, when successfully completed, will facilitate its implementation. It was therefore the objective of this study report to identify further research needs which are considered very important and necessary to facilitate the implementation of the MEPDG. Consequently, at the North-West States MEPDG User Group Meeting held March 9-10 in Oregon, the main national research areas of the MEPDG identified included: NCHRP 9-30A – Calibration of Rutting Models for HMA Structural and Mix Design, NCHRP 9-41 – Reflection Cracking of HMA Overlays, NCHRP 9-42 – Top-Down Cracking of HMA, and NCHRP 9-38, 9-44, 9-44A – Application of the Endurance Limit for HMA mixes. Most of these research efforts are being undertaken under the National Cooperative Highway Research Program (NCHRP). Other research areas also being undertaken at the national level include the recommendation on the rehabilitation of both flexible and rigid pavements, the coefficient of thermal expansion, and the effects of geogrids and geotextiles, which can generate considerable cost savings in highway pavement construction. Further research areas at the regional level are concentrating on traffic, material and climate characteristics, and pavement performance. At the local level, the main area of research deals with the calibration of the MEPDG models to local conditions. National and regional research studies and calibration efforts being undertaken by most DOTs in the North-West region are discussed in detail in Sections 4 and 5. 6.2 Recommendations Four critical elements have been identified as the key steps to a successful implementation of the MEPDG (North-West States User Group Meeting). These include:
i. A champion to lead the implementation effort and program ii. Communication
iii. Training iv. Adequate funding
It is recommended that agencies seeking to implememnt the MEPDG should seriuosly consider these critical elements as well as monitor the progress of the above mentioned ongoing further researches

34
(North-West States User Group Meeting). Other activities also noted and recommended that were considered necessary for an effective integration of the MEPDG in practice included:
i. Setting of up implementation committee and communications plan ii. Confirmation of default input values and set up input libraries (traffic and material inputs)
iii. Completion of concurrent designs with the MEPDG iv. Verification of reasonableness of final designs v. Training in the use of MEPDG software
Of particular importance to the application of the MEPDG to local conditions was the calibration and validation of the guide, which is a continuous process. To assist in overcoming these challenges, it was recommended that agencies should:
i. Plan for and monitor future works related to updates and improvements of the MEPDG on a continuous basis
ii. Maintain a calibration-validation database along with input libraries iii. Periodically monitor test sections, input parameters, and update the database iv. Verify local calibration or agency specific factors for future MEPDG versions
The current calibration-validation database being developed under NCHRP Project 9-30 and being enhanced under NCHRP 9-30A provides features to store and manage data for calibrating mechanistic–empirical based methods at the national level (North-West States User Group Meeting). At the user group meeting, it also became evident that training may be one of the current major issues in the facilitation of the MEPDG. For this, two National Highway Institute (NHI) training courses are currently available in the MEPDG, and it is recommended that agencies assist and encourage not only their pavement designers but other personnel from the areas of traffic, materials, and Pavement Management Systems (PMS) to attend these courses (North-West States User Group Meeting). These courses include:
i. NHI Course 131064 – Introduction to Mechanistic Empirical Pavement Design ii. NHI Course 131109 – Analysis of New and Rehabilitated Pavement Performance with MEPDG
Software. It is anticipated that the MEPDG will continue to be updated with new research areas being developed, and that it will take a considerable amount of time before it becomes an accepted design guide; hence, extremely important that agencies plan and monitor future works related to updates and improvements of the MEPDG on a continual basis. It is by so doing that agencies can effectively calibrate and validate the MEPDG to suit their local conditions.

35
REFERENCES AASHTO. “M-E Design: Implementation of a Mechanistic-Empirical Pavement Design.” Washington,
DC: AASHTO. Claros, German (2007). “Updating the Rehabilitation Recommendations in the MEPDG.” Transportation
Research Board, Washington DC. Coree, B. (2005). “Implementing the M-E Pavement Design Guide in Iowa.” Iowa State University,
Department of Civil, Construction and Environmental Engineering. Ames, IA: Center for Transportation Reserch and Education.
Coree, Brian, Halil Ceylan, and Dale Harrington (2005). “Implementing the Mechanistic-Empirical
Pavement Design Guide: Implementation Plan.” Center for Transportation Research and Education, Iowa State University.
Daniel, J.S. and G.R. Chehab (2007). “Use of RAP Mixtures in the Mechanistic Empirical Pavement
Design Guide.” Department of Civil Engineering, University of New Hampshire and Department of Civil and Environmental Engineering, The Pennsylvania State University, Durham, NH and University Park, PA: Transportation Research Board 87th Annual Meeting 2008 Washington DC.
Haas, R., S. Tighe, G. Dore, and D. Hein (2007). “Mechanistic-Empirical Pavement Design: Evolution and Future Challenges.” 2007 Annual Transportation Association of Canada Conference. Saskatoon, Saskatchewan, 2007.
Haider, S.W., R.S. Harichandran, and M.B. Dwaikat (2007). “Estimating Bimodal Distribution Parameters And Traffic Levels From Axle Load Spectra.” Department of Civil and Environmental Engineering, Michigan State University, East Lansing, MI: Transportation Research Board 87th Annual Meeting 2008 Washington DC.
Hill, K., Y. Bereket, and L. Khazanovich (2007). “Toward A Unified Mechanistic Approach For Modeling Tests Of Unbound Materials.” Department of Civil Engineering, University of Minnesota, Minneapolis, MN: Transportation Research Board 87th Annual Meeting 2008 Washington DC.
Hoegh, K., L. Khazanovich, and M. Jensen (2009). “Local Calibration of MEPDG Rutting Model for MN Road Test Sections.” Submitted for presentation and publication at the 89th Annual Meeting of the Transportation Research Board, 2010.
Johanneck, L. and L. Khazanovich (2009). “A Comprehensive Evaluation of the Effect of Climate in
MEPDG Predictions.” Submitted for presentation and publication at the 89th Annual Meeting of the Transportation Research Board, 2010.
Kang, M. and T.M. Adams (2007). “Local Calibration of the Fatigue Cracking Model in the Mechanistic-
Empirical Pavement Design Guide.” Department of Civil and Environmental Engineering, University of Wisconsin, Madison, Madison, WI: Transportation Research Board 87th Annual Meeting 2008 Washington DC.
Katicha, S., G.W. Flintsch, A. Loulizi, and L. Wang (2007). “Conversion of Testing Frequency to Loading Time Applied to the Mechanistic-Empirical Pavement Design Guide.” Department of Civil and Environmental Engineering, Virginia Tech, Blacksburg, VA: Transportation Research Board 87th Annual Meeting 2008 Washington DC.

36
Khazanovich, L., S.F. Wojtkiewicz, and R. Velasquez (2007). “MEPDG-RED: A Framework for Reliability Analysis With The Mechanistic-Empirical Pavement Design Procedure.” Department of Civil Engineering, University of Minnesota, Minneapolis, MN: Transportation Research Board 87th Annual Meeting 2008 Washington DC.
Lytton, R.L. and A.N. Hanna (2005). “Models for Predicting Reflection Cracking of Hot-Mix Asphalt Overlays.” Texas A&M Research Foundation. Transportation Research Board, Washington DC.
Mehta, Y.A., R.W. Sauber, J. Owad, and J. Krause (2007). “Lessons Learned During Implementation of
Mechanistic-Empirical Pavement Design Guide.” Department of Civil and Environmental Engineering, Rowan University, Glassboro, NJ: Transportation Research Board 87th Annual Meeting 2008 Washington DC.
Muthadi, N.R., and Y.R. Kim (2007). ”Local Calibration Of The MEPDG For Flexible Pavement Design.” Department of Civil, Construction, and Environmental Engineering, North Carolina State University, Raleigh, NC: Transportation Research Board 87th Annual Meeting 2008 Washington DC.
NCHRP (2008). “NCHRP Report 602: Calibration and Validation of the Enhanced Integrated Climatic Model for Pavement Design.” Washington DC: Transportation Research Board of the National Academies.
Petry, T.M., Y.-P. Han, and L. Ge (2007). “Determination of Subgrade Soil Field Moisture Conditions Using Soil Suction.” Departmentd of Civil, Architectural and Environmental Engineering, University of Missouri - Rolla, Rolla, MO: Transportation Research Board 87th Annual Meeting 2008 Washington DC.
Quintus, H.V. and Edward T. Harrigan (2005). “Calibration of Rutting Models for HMA Structural and Mix Design,” Applied Research Associates. Transportation Research Board, Washington DC.
Rabab'ah, S. and R.Y. Liang (2007). “Evaluation Of Mechanistic Empirical Design Approach Over Permeable Base Materials.” Gannett Fleming, Inc., Audubon, PA: Transportation Research Board 87th Annual Meeting 2008 Washington DC.
Reynaldo, R. and Amir N. Hanna (2006). “Models for Predicting Top-Down Cracking of Hot-Mix Asphalt Layers,” University of Florida. Transportation Research Board, Washington, DC.
Souliman, Mena, M. Manlouk, M. El-Basyouny, and C.E. Zapata (2009). “Calibration of the AASHTO
MEPDG for Flexible Pavement for Arizona Conditions.” Submitted for presentation and publication at the 89th Annual Meeting of the Transportation Research Board, 2010.
Swan, D., R. Tardif, J.J. Hajek, and D.K. Hein (2007). “Development of Regional Traffic Data for the M-
E Pavement Design Guide.” Applied Research Associated, Inc., Toronto, ON: Transportation Research Board 87th Annual Meeting 2008 Washington DC.
Wagner, Chris. “MEPDG: Where Are We Now?” Louisiana Transportation Engineering Conference. Baton Rouge, LA: FHWA - Resource Center, Feb. 12, 2007.
Wang, K.C., Q. Li, K.D. Hall, V. Nguyen, W. Gong, and Z. Hou (2007). “Database Support for the New Mechanistic-Empirical Pavement Design Guide (MEPDG).” Department of Civil Engineering, University of Arkansas, Fayetteville, AR: Transportation Research Board 87th Annual Meeting 2008 Washington DC.

37
Witczak, M.W. and E.T. Harrigan (2009). “Validating an Endurance Limit for HMA Pavements: Laboratory Experiment and Algorithm Development,” Arizona State University. Transportation Research Board, Washington DC.

38

39
APPENDIX A - MEPDG SURVEY QUESTIONNAIRE

40
MEPDG Survey Questionnaire
This survey is performed as part of an informational study conducted by the Wyoming T2/LTAP Center. The objective of this survey is to collect information from the
MPC Region DOTs about the implementation of the Mechanistic–empiricalPavement Design Guide (MEPDG). Such information will help in the facilitation of the implementation of the MEPDG in the Region. A secondary objective of this survey is to identify where research is needed to further the use of the MEPDG. The survey consists of 4 parts. Part One: General Information, Part Two: Climate/Environment, Part Three: Traffic and Part Four: Materials.
Please answer all questions as clearly as possible. Your input is very important to us and we appreciate your answers and suggestions. If you have any questions please contact Dr. Khaled Ksaibati at the Wyoming T2 /LTAP Center (1-800-231-2815).
Name and address of person completing this survey: ____________________________________________ ____________________________________________ ____________________________________________ Tel No.__________________________________ Fax No.____________________________ Email: __________________________________ Date: ______________________________ PAR T ONE : G E NE R AL I NF OR M AT I ON (brief overall descriptions, more specific questions in following sections) 1. Does your DOT currently use the MEPDG?
Yes No (If no, please explain why the MEPDG is not being used and return this survey in the
enclosed envelope)
_________________________________________________________________ _________________________________________________________________ _________________________________________________________________
2. Please identify who is responsible for the implementation of the MEPDG in your state.
_________________________________________________________________ _________________________________________________________________ _________________________________________________________________

41
3. In g eneral, ho w far a long do y ou feel y our j urisdiction i s i n implementing t he MEPDG? (Estimated percent and brief description)
_________________________________________________________________ _________________________________________________________________ _________________________________________________________________ _________________________________________________________________
PAR T T W O: C L I M AT E /E NV I R ONM E NT 1. Are you having trouble with the climate section in the MEPDG?
Yes No (skip to Part Three)
2. Are your troubles in the climate section of the MEPDG coming from the Integrated Climatic Model (ICM) or collecting the necessary data for inputs? ICM (go to question # 3) Collecting Data (go to question # 4) Neither (please explain) _________________________________________________________________ _________________________________________________________________ _________________________________________________________________
3. In where are your problems occurring in the ICM?
Software problems Data Input problems Calibration Other
Please Explain: _________________________________________________________________ _________________________________________________________________ _________________________________________________________________
4. In where are your problems occurring for collecting climate data?
Weather Stations Temperature Moisture Content Ground Water Table Other
Please Describe The Problems: _________________________________________________________________ _________________________________________________________________ _________________________________________________________________ _________________________________________________________________

42
5. Do you feel the ICM correctly calibrates to your climate using local inputs?
Yes No
Please explain _________________________________________________________________ _________________________________________________________________ _________________________________________________________________
6. Based on the data being collected, what level of inputs are you using for the climate section? Level 1 Data (most reliable and accurate) Level 2 Data Level 3 data (least reliable) Default Data or Other Please explain _________________________________________________________________ _________________________________________________________________ _________________________________________________________________
PAR T T H R E E : T R AF F I C 7. Are you having troubles with the Traffic section in the MEPDG?
Yes No (skip to Part Four)
8. Are your troubles in the Traffic section of the MEPDG coming from the software or collecting the necessary data for inputs? Software (go to question # 9) Collecting Data (go to question # 10) Neither (please explain) _________________________________________________________________ _________________________________________________________________ _________________________________________________________________
9. In where are your problems occurring in the software? Data Input problems Calibration Other
Please explain _________________________________________________________________ _________________________________________________________________ _________________________________________________________________

43
10. In where are your problems occurring for collecting traffic data?
Weigh-In-Motion collection Traffic Counters Axle Loads Axle Configuration Proximity to project site Other
Please Describe The Problems: ________________________________________________________________ ________________________________________________________________ ________________________________________________________________ ________________________________________________________________
_________________________________________________________________
11. What type of axle distribution are you using and what problems are occurring, if any?
Axle Load Spectra ESAL’s Please Describe The Problems: _________________________________________________________________ _________________________________________________________________ _________________________________________________________________ ________________________________________________________________
________________________________________________________________
12. Based on the data being collected, what level of inputs are you using for the traffic section? Level 1 Data (most reliable and accurate) Level 2 Data Level 3 data (least reliable) Default Data or Other Please explain _________________________________________________________________ _________________________________________________________________
_________________________________________________________________
PAR T F OUR : M AT E R I AL S 13. Are you having trouble with the Materials section in the MEPDG?
Yes No (skip to End)

44
14. Are y our troubles i n t he Ma terials se ction o f the ME PDG c oming from the software o r collecting the necessary data for inputs? Software (go to question # 15) Collecting Data (go to question # 16) Neither (please explain) _________________________________________________________________ _________________________________________________________________ _________________________________________________________________
15. In where are your problems occurring in the software? Data Input problems Calibration Other
Please explain _________________________________________________________________ _________________________________________________________________ _________________________________________________________________
16. In where are your problems occurring for collecting material data?
Laboratory testing Lack of necessary equipment Lack of research Resources (human, time, etc.) In Sutu testing Other
Please Describe The Problems: _________________________________________________________________ _________________________________________________________________ _________________________________________________________________ _________________________________________________________________
17. Based on the data being collected, what level of inputs are you using for the materials section?
Level 1 Data (most reliable and accurate, Lab data) Level 2 Data (Interpolating from other data, i.e. CBR, DCP) Level 3 data (least reliable, based on material properties/classification) Default Data or Other Please explain _________________________________________________________________ _________________________________________________________________ _________________________________________________________________
Thank you for taking your time to answer these questions. The information you provided is essential to our project.

45
APPENDIX B. USER GROUP MEETING PRESENTATION

MEPDG Implementation Plan
-WSDOT
March, 2009
2
Background
! WSDOT’s current design tool
" The 1993 AASHTO Guide for Design of Pavement
Structures
! WSDOT’s efforts on MEPDG
3
WSDOT’s Efforts
! Data Preparation
"Traffic
"Materials properties
"Pavement performance data
! Calibration and validation
"New concrete pavements in 2005 (version 0.6)
"New flexible pavements in 2008 (version 1.0)
4
Major Findings
! MEPDG is an advanced tool for pavement
design and evaluation.
! Calibration is required prior to implementation.
! The concrete pavement calibration results need
to be adjusted before use.
! The distress models for new flexible pavement
have been calibrated to WSDOT conditions,
except the IRI model.
5
Major Findings (cont.)
! The calibration is a continual process along
with implementation.
! Local agencies need to balance the input data
accuracy and costs.
! WSDOT will continue to monitor future works
related to MEPDG.
6
Future Works
! Expecting MEPDG upgrades
" Version 2.0 from AASHTO
" Software bugs
! Refining the calibration results.
" Doweled JPCP slabs
" Superpave
! Testing and calibrating the rehabilitation models
" HMA overlay on HMA
" HMA overlay on PCCP
1 of 92

7
Future Works (cont.)
! Preparing special designs on
" High traffic loads
" Weak soil support
" Mountain passes
8
Implementation Plan
! Updating AASHTO design table (current).
"Performance based
"MEPDG outputs
! Developing a user guide.
! Preparing sample files for typical designs.
! Training pavement designers.
9
Updated AASHTO Design Table
Note: Has not been finalized yet.
ESALs
(50 yesrs) MR=10,000psi MR=20,000psi
HMA CSBC HMA CSBC PCC Slab PCC slab
1,000,000 5 8 5 2 6.7 6.1
5,000,000 6.5 9.5 6.5 3 9.1 8.6
10,000,000 7.5 10 7.5 3.5 10.4 10
25,000,000 9 11 9 3.5 11.6 11.2
50,000,000 10.5 12.5 10.5 4 12.6 12.3
!100,000,000 11.5 14 11.5 4 13.1 12.7
MR=10,000 psi MR=20,000 psi
Layer Thicknesses (inches)
2 of 92

Session 1Session 1——General OverviewGeneral Overview
MEPDG National UpdateMEPDG National Update
Northwest MEPDG User GroupNorthwest MEPDG User Group
Corvallis, ORCorvallis, OR
March 9, 2009March 9, 2009
Harold L. Von Quintus, P.E.
2
Expanding the Realm of Possibility
OutlineOutline
1. Version 2.0—DARWin M-E
2. Implementation—Defined
3. Key Elements or Steps of an Implementation Plan
4. Plan for Future Updates
3
Expanding the Realm of Possibility
Version 2.0Version 2.0——DARWinDARWin MM--EE
1. Initiated in February 2009.
2. 18-month duration.
3. 19 States participating in pool fund effort.
4
Expanding the Realm of Possibility
Version 2.0Version 2.0——DARWinDARWin MM--EE
Participating AgenciesParticipating Agencies
! FHWA
! Alberta, Canada
5
Expanding the Realm of Possibility
Version 2.0Version 2.0——DARWinDARWin MM--EE
What’s going to change?
1. Computation methodology.
2. Appearance—changes in data input screens.
3. Distress transfer functions and/or distress mechanism.
AASHTO will decide what changes will be made; significant change will probably require re-
ballot.
6
Expanding the Realm of Possibility
Version 2.0Version 2.0——DARWinDARWin MM--EE
How will the changes affect use of and calibration of version 1.0 transfer functions?
1. Appearance change in input screens, reduced run times—probably no affect.
2. If transfer function changes—validation & recalibration may be needed.
MEPDG Manual of Practice will be updated by contractors recommending changes to transfer functions.
3 of 92

7
Expanding the Realm of Possibility
Version 2.0Version 2.0——DARWinDARWin MM--EE
On-Going Studies:
1. NCHRP 9-30A – Calibration of Rutting
Models for HMA Structural and Mix Design.
2. NCHRP 9-42 – Top-Down Cracking of HMA.
3. NCHRP 9-41 – Reflection Cracking of HMA
Overlays.
4. NCHRP 9-38, 9-44, 9-44A – Application of
the Endurance Limit for HMA Mixes.
8
Expanding the Realm of Possibility
OutlineOutline
1. Version 2.0—DARWin M-E
2. Implementation—Defined
3. Key Steps of an Implementation Plan
4. Plan for Future Updates
9
Expanding the Realm of Possibility
ImplementationImplementation——DefinedDefined
What does implementation mean?
1. Integration into day-to-day design practice.
2. Validation-Calibration of distress transfer functions to local conditions, materials, & policies.
10
Expanding the Realm of Possibility
Summary of FHWA QuestionnaireSummary of FHWA Questionnaire
0
20
40
60
80
100
Yes < 0.5 0.5 to 1.0 1.0 to 5.0 > 5.0
Range of Cost for Implementation Plan, $M
Pe
rce
nt
of
To
tal
Re
sp
on
din
g (
52
)
Does Agency Have Implementation Plan?
11
Expanding the Realm of Possibility
Implementation Programs Around Implementation Programs Around
the Countrythe Country
!!
!!
!!
!!
!!
!!
!!
!!
!!
!!
12
Expanding the Realm of Possibility
Selected Implementation Selected Implementation
Programs Around the CountryPrograms Around the Country
Completed Programs:
" Missouri
" Montana" Ohio
" Wisconsin
Programs, In-Process
" Arizona
" Mississippi
" Texas
" Utah
Programs to be initiated
in near future:
" Colorado
" FHWA – Federal Lands
" Wyoming
4 of 92

13
Expanding the Realm of Possibility
YesNoLTPP &
Test SecExt.YesYes>0.5MT
FormalYesLTPPLimitedLimitedNo<0.5WY
YesYesLTPPYesLimitedNo<0.5OH
Yes
Formal
Limit
Formal
Limit
Formal
Yes
TrainProgr.
No
Yes
Yes
Yes
Yes
Yes
Yes
Comp.Design
LTPP
LTPP
LTPP
LTPP & PMS
LTPP & PMS
LTPP & PMS
LTPP
DataSource
State
Ext.YesExt.>1.0CO
LimitedLimitedNo<0.5WS
FutureYesExt.>0.5UT
LimitedLimitedYes<0.5TX
Ext.YesExt.>2.0MS
Ext.YesYes<1.0MO
YesYesExt.0.5-1.0AZ
Cal.Effort
InputLibraries
TestingProgr.
Out-Source,
$M
14
Expanding the Realm of Possibility
Local Calibration Local Calibration –– Number of SitesNumber of Sites
HMA-40+LTPPWyoming
HMA – 100+
PCC – 30+LTPP & PMS SectionsMississippi
LimitedLTPP & Non-LTPPUtah
HMA – 40+
PCC – 0 LTPP & Special Test
SectionsMontana
HMA – 50+
PCC – 30+LTPP & PMS SectionsMissouri
NumberNumberType of SitesType of SitesAgencyAgency
15
Expanding the Realm of Possibility
OutlineOutline
1. Version 2.0—DARWin M-E
2. Implementation—Defined
3. Key Steps of an Implementation Plan
4. Plan for Future Updates
16
Expanding the Realm of Possibility
Key Steps of an Implementation Key Steps of an Implementation
ProgramProgram
Critical Elements:
1. A champion to lead the implementation effort and program.
2. Communications
3. Training
4. Adequate funding
17
Expanding the Realm of Possibility
Key Steps of an Key Steps of an
Implementation ProgramImplementation Program
Integration into practice activities.1. Set up implementation committee &
communications plan
2. Confirm default input values and set up input libraries (traffic & material inputs)
3. Complete concurrent designs with the MEPDG
4. Verify reasonableness of final designs
5. Training in use of MEPDG software
18
Expanding the Realm of Possibility
CommunicationsCommunications
MaterialsMaterials
DESIGNDESIGN
Planning,Planning,
TrafficTraffic
PavPav’’tt..
ManagementManagement
ConstructionConstruction
ResearchResearch GeotechnicalGeotechnical
Need toknow what d
ata is
needed and how is that
data obtained &used?
5 of 92

19
Expanding the Realm of Possibility
TrainingTraining
How do I get this How do I get this
input level 1 or 2 input level 1 or 2
for design?for design?
A Major Issue A Major Issue –– TheThe
Unknowns!!Unknowns!!## Determination of properties Determination of properties
& other inputs.& other inputs.
## Factors affecting properties Factors affecting properties
needed for design!!!!needed for design!!!!
•• Source of MaterialsSource of Materials
•• ContractorContractor
•• Construction EquipmentConstruction Equipment
20
Expanding the Realm of Possibility
NHI Training CoursesNHI Training Courses
" NHI Course 131064, Introduction to M-E Pavement Design
" NHI Course 131109, Analysis of New & Rehabilitated Pavement Performance with MEPDG Software
21
Expanding the Realm of Possibility
Preparing an Implementation PlanPreparing an Implementation Plan
Local Verification, Calibration, Local Verification, Calibration, Validation of Transfer Functions:Validation of Transfer Functions:
How close is close enough?How close is close enough?
A difficult & costly issue to A difficult & costly issue to resolve!resolve!
22
Expanding the Realm of Possibility
“Typical Agency Values” “State/Regional Cal. Values”
Transfer Function (Statistical or
Empirical Model)
23
Expanding the Realm of Possibility
Preparing a CalibrationPreparing a Calibration--ValidationValidation
PlanPlan
Critical Elements:
1.1. Adequate sample sizeAdequate sample size
2.2. Forensic investigation of sitesForensic investigation of sites
3.3. Analyses of performance dataAnalyses of performance data
4.4. Quantify error componentsQuantify error components
24
Expanding the Realm of Possibility
How Close is Close Enough?How Close is Close Enough?
0
20
40
60
80
100
120
140
5 10 15 20 25 30
Standard Error
Re
se
arc
h/C
ali
bra
tio
n
Co
sts
! " ! "
! " ! " ! "222
22
PureInputFitofLack
tMeasuremenTotal
###
##
$$$
%
&&
Quantify total error to answer this question!Quantify total error to answer this question!
60
80
100
120
140
160
180
5 10 15 20 25 30
Standard Error
Co
nstr
ucti
on
Co
sts
Impact of Reliability
Lack-of-fit& Input
Pure & measurement
6 of 92

25
Expanding the Realm of Possibility
Quantify Error ComponentsQuantify Error Components
0.000
0.050
0.100
0.150
0.200
0.250
0.300
0.350
0.400
0 2 4 6 8 10 12 14
Pavement Age, years
Measu
red
Ru
t D
ep
th, in
.
19-0101
19-0102
19-0103
19-0104
19-0105
19-0106
0.0
200.0
400.0
600.0
800.0
1000.0
1200.0
1400.0
0 1 2 3 4 5 6 7 8 9
Pavement Age, years
Tra
ns
ve
rse
Cra
ck
ing
, ft
./m
i.
08-0506
08-0504
08-0505
08-0507
08-0502
08-0509
08-0503
08-0508
26
Expanding the Realm of Possibility
Quantify Error ComponentsQuantify Error Components
0
5
10
15
20
0 1 2 3 4 5 6 7 8 9 10
Age, years
To
tal
Fa
tig
ue
Cra
ck
ing
, %
FDAC-S-4Measured Values
Predicted; C2=1.0(Global Value)
Predicted; C2=2.0
0
2
4
6
8
10
12
0 2 4 6 8 10 12 14 16 18
Age, years
To
tal
Fati
gu
e C
rackin
g,
%
FDAC-C-3
Measured Values
Predicted; C2=1.0
(Global Value)
Predicted; C2=5.0
MeasurementError
Lack-of-FitError
27
Expanding the Realm of Possibility
Quantify Error ComponentsQuantify Error Components
0.00
10.00
20.00
30.00
40.00
50.00
60.00
70.00
0 2 4 6 8 10 12 14 16
Age, years
To
tal
Fati
gu
e C
rackin
g,
%
19-0101
19-0102
19-0103
19-0104
19-0105
19-0106
Loss of bond between HMA layersLoss of bond between HMA layers
Stripping of HMA MixturesStripping of HMA Mixtures
Extensive cracking within one year; anomaly?
28
Expanding the Realm of Possibility
Quantify Error ComponentsQuantify Error Components
0
0.2
0.4
0.6
0.8
1
1.2
0 1 2 3 4 5 6 7 8
Pavement Age, years
Me
as
ure
d R
ut
De
pth
, in
.
20-0101
20-0102
20-0103
20-0104
20-0105
20-0106
Is this an outlier, anomaly or Is this an outlier, anomaly or error?error?
Construction problems & weather delays.Construction problems & weather delays.
Weak unbound layers.Weak unbound layers.
29
Expanding the Realm of Possibility
Local Validation/Calibration Guide; Local Validation/Calibration Guide;
NCHRP Project 1NCHRP Project 1--40B40B
Manual of Practice for Calibration:$ Mathematical models – assumed to be correct.
$ Pavement response models
$ Climatic model – ICM
$ HMA aging & PCC strength-gain model
$ Statistical or empirical models (transfer functions) may result in bias.$ Revision of model coefficient values to remove bias.
30
Expanding the Realm of Possibility
OutlineOutline
1. Version 2.0—DARWin M-E
2. Implementation—Defined
3. Key Steps of an Implementation Plan
4. Plan for Future Updates
7 of 92

31
Expanding the Realm of Possibility
Should we wait until its Should we wait until its PERFECTPERFECT??
" If we wait until there are no more changes, we will never use itwe will never use it.
" If we wait for perfection, it will be it will be
impractical and cost will restrict its useimpractical and cost will restrict its use.
There is NONO perfectprocedure & it will never be perfect! SO, plan for updates & improvements
32
Expanding the Realm of Possibility
Planning for Future UpdatesPlanning for Future Updates
1. Maintain calibration-validation database along with the input libraries.
2. Periodically monitor test sections & input parameters & update database.
3. Verify local calibration or agency specific factors for future MEPDG versions.
33
Expanding the Realm of Possibility
Planning for Future UpdatesPlanning for Future Updates
" M-E_DPM
Calibration-validation database developed under NCHRP Project 9-30 and enhanced under NCHRP Project 9-30A. Provides features to store and manage data for calibrating M-E based methods.
34
Expanding the Realm of Possibility
Questions!Questions!
Thank you.Thank you.
Any Questions?Any Questions?
36
Expanding the Realm of Possibility
8 of 92

ODOT M-E IMPLEMENTATION PLAN
PAVEMENT SERVICES UNIT
Pavement Services Engineer Elizabeth Hunt, P.E.
Pavement Design EngineerRene’ Renteria, P.E.
Pavement Quality/Materials EngineerLarry Ilg, P.E.
Pavement Management EngineerJohn Coplantz, P.E.
ODOT M-E PAVEMENT DESIGN IMPLEMENTATION PLAN
OREGON STATE UNIVERSITY
RESEARCHERS
Todd Scholz, Ph.D., P.E.
Pavement Design & Asphalt Materials
Jason Ideker, Ph.D.
PCC & Innovative Materials
ODOT IMPLEMENTATION PLAN
! Mechanistic-Empirical Design Literature Review
" Research by OSU 2005-2006
! Backcalculation Software Literature Review & Evaluation
" Research by OSU 2005-2006
" Recommendation EverCalc (WsDOT)
ODOT IMPLEMENTATION PLAN
! AC Dynamic Modulus Research - OSU
" Completed November 2005
! Axle Load Spectrum Research - OSU
" WIM - Completed January 2008
" On-going traffic lane instrumentation
ODOT IMPLEMENTATION PLAN
! Perpetual Pavement Instrumentation (On-going Research by OSU)
" I-5 Jefferson Installed 2005
" US-97 Redmond Installed 2008
" Future installations TBD
! I-5 Victory to Lombard (2009?)
! I-5 South Medford Interchange (2009?)
ODOT IMPLEMENTATION PLAN
! M-E Pavement Design Inputs Research
" Material Characterization – Current OSU Research, Completion 2009
" Climatic Data – OSU Research (2009) & ODOT Staff
" Calibration – Proposed Research (Potential for FY10)
9 of 92
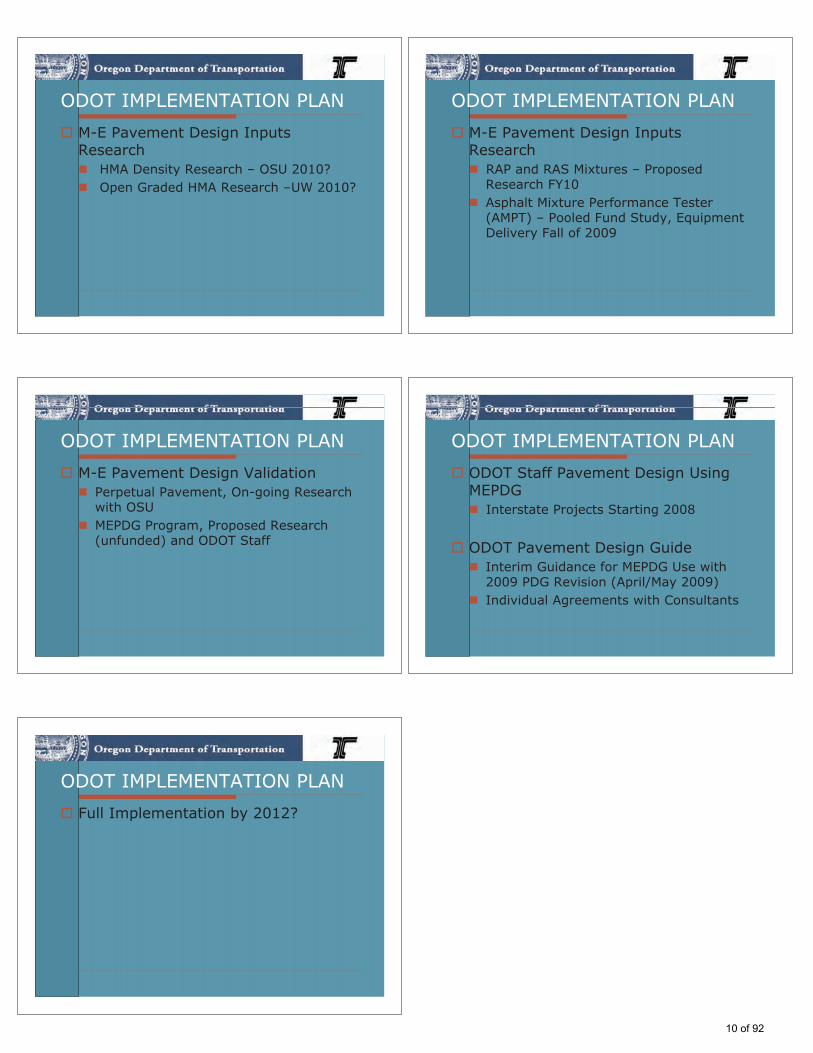
ODOT IMPLEMENTATION PLAN
! M-E Pavement Design Inputs Research
" HMA Density Research – OSU 2010?
" Open Graded HMA Research –UW 2010?
ODOT IMPLEMENTATION PLAN
! M-E Pavement Design Inputs Research
" RAP and RAS Mixtures – Proposed Research FY10
" Asphalt Mixture Performance Tester (AMPT) – Pooled Fund Study, Equipment Delivery Fall of 2009
ODOT IMPLEMENTATION PLAN
! M-E Pavement Design Validation
" Perpetual Pavement, On-going Research with OSU
" MEPDG Program, Proposed Research (unfunded) and ODOT Staff
ODOT IMPLEMENTATION PLAN
! ODOT Staff Pavement Design Using MEPDG
" Interstate Projects Starting 2008
! ODOT Pavement Design Guide
" Interim Guidance for MEPDG Use with 2009 PDG Revision (April/May 2009)
" Individual Agreements with Consultants
ODOT IMPLEMENTATION PLAN
! Full Implementation by 2012?
10 of 92

Wyoming DOTWyoming DOT
Implementation of the MEPDGImplementation of the MEPDG
North West States User Group MeetingNorth West States User Group Meeting
Corvallis, OregonCorvallis, Oregon
March 9, 2009March 9, 2009
Rick HarveyRick Harvey
State Materials EngineerState Materials Engineer
WYDOT Pavement DesignWYDOT Pavement Design
!! Materials ProgramMaterials Program
!! Centralized Pavement DesignCentralized Pavement Design
!! Small StaffSmall Staff
!! Materials Engineers=Pavement Design Materials Engineers=Pavement Design
EngineersEngineers
!! MEPDG Training & ImplementationMEPDG Training & Implementation
!! Calibration and Input DevelopmentCalibration and Input Development
2006 Implementation Plan2006 Implementation Plan
!! DIGIT Training for Key PersonnelDIGIT Training for Key Personnel
!! Pavement Designers Pavement Designers
!! Traffic Data Collection PersonnelTraffic Data Collection Personnel
!! Review of Existing Sensitivity StudiesReview of Existing Sensitivity Studies
!! To be conducted by WYDOTTo be conducted by WYDOT
!! Subgrade SoilsSubgrade Soils
!! MMRR
Testing Testing
!! Other InputsOther Inputs
!! Calibrate Using PMS DataCalibrate Using PMS Data
HibernationHibernation
!! Loss of StaffLoss of Staff
!! Resilient Modulus TestingResilient Modulus Testing
!! MMRR
Pooled FundPooled Fund
!! Elastic Modulus TestingElastic Modulus Testing
!! AMPT Pooled FundAMPT Pooled Fund
!! Software DevelopmentSoftware Development
!! AASHTOWare Pooled FundAASHTOWare Pooled Fund
New Implementation GoalsNew Implementation Goals
!! 2006 Plan Too Aggressive2006 Plan Too Aggressive
!! Research FundingResearch Funding
!! Reduce Level of InputsReduce Level of Inputs
!! Reduce Calibration & Validation Reduce Calibration & Validation
!! Useable and Implemented by 2011Useable and Implemented by 2011
!! Use Existing Information if PossibleUse Existing Information if Possible
!! Experienced Help WantedExperienced Help Wanted
New Implementation PlanNew Implementation Plan
!! Applied Research Associates (ARA)Applied Research Associates (ARA)
!! What Do We Need?What Do We Need?
!! Developed Design GuideDeveloped Design Guide
!! Developed Calibration GuideDeveloped Calibration Guide
!! Working with Neighboring StatesWorking with Neighboring States
!! Help with Existing SoftwareHelp with Existing Software
!! 18 Month Schedule18 Month Schedule
!! Research Approved Research Approved –– Jan. 2009Jan. 2009
!! Initial Meeting Initial Meeting -- ARAARA –– March 4, 2009March 4, 2009
11 of 92

Implementation PlanImplementation Plan
!! Primary Design & Rehab. Alternatives Primary Design & Rehab. Alternatives
!! Level 2/3 InputsLevel 2/3 Inputs
!! Existing Sites for CalibrationExisting Sites for Calibration
!! Wyoming Specific Design ManualWyoming Specific Design Manual
!! Implement for all Pavement DesignsImplement for all Pavement Designs
Design AlternativesDesign Alternatives
!! New Construction New Construction
!! HMA + Granular BaseHMA + Granular Base
!! Deep Strength HMA + Granular BaseDeep Strength HMA + Granular Base
!! UnUn--doweled PCCP on Granular Basedoweled PCCP on Granular Base
!! Doweled PCCP on Granular BaseDoweled PCCP on Granular Base
Design AlternativesDesign Alternatives
!! RehabilitationRehabilitation
!! HMA Overlays over HMA HMA Overlays over HMA
!! Granular BasesGranular Bases
!! Flexible & Rigid Treated BasesFlexible & Rigid Treated Bases
!! Reclaimed Bases?Reclaimed Bases?
!! HMA Overlays on Cracked & Seated PCCPHMA Overlays on Cracked & Seated PCCP
!! Concrete CPRConcrete CPR
Climate InputsClimate Inputs
!! Existing Weather StationsExisting Weather Stations
!! Interpolate Weather StationsInterpolate Weather Stations
!! ChallengesChallenges
!! No Stations in Rural AreasNo Stations in Rural Areas
!! No Stations in Unique Areas (Mountains)No Stations in Unique Areas (Mountains)
Traffic InputsTraffic Inputs
!! Counts and ClassificationCounts and Classification
!! 65 Sites with 5 Years of Data65 Sites with 5 Years of Data
!! 12 More Sites with 2 Years of Data12 More Sites with 2 Years of Data
!! Weight InformationWeight Information
!! 9 WIM Sites9 WIM Sites
!! ChallengesChallenges
!! Limited WIM CoverageLimited WIM Coverage
!! WIMs on High Traffic RoutesWIMs on High Traffic Routes
Soils & Granular Base InputsSoils & Granular Base Inputs
!! RR--Value Correlated to MValue Correlated to MRR
!! Back Calculated from FWDBack Calculated from FWD
!! ChallengesChallenges
!! Correlation Method?Correlation Method?
!! Back Calculation Method?Back Calculation Method?
12 of 92

HMA InputsHMA Inputs
!! Catalog of Mix DesignsCatalog of Mix Designs
!! Calculated from Volumetrics and Calculated from Volumetrics and
Materials PropertiesMaterials Properties
!! ChallengesChallenges
!! Properties of Existing HMA LayersProperties of Existing HMA Layers
Concrete InputsConcrete Inputs
!! Catalog of Materials & Mix PropertiesCatalog of Materials & Mix Properties
!! Compressive Strength DataCompressive Strength Data
!! Flexural Strength DataFlexural Strength Data
!! ChallengesChallenges
!! Not a lot of Existing DataNot a lot of Existing Data
Sites for Calibration & Sites for Calibration &
ValidationValidation
!! LTPP SitesLTPP Sites
!! LTPP Sites in Neighboring StatesLTPP Sites in Neighboring States
!! 15 Years of PMS Data15 Years of PMS Data
!! ChallengesChallenges
!! Few Granular Base SitesFew Granular Base Sites
!! No Superpave Mixture SitesNo Superpave Mixture Sites
!! No Dowelled PCCP SitesNo Dowelled PCCP Sites
Opportunities for CooperationOpportunities for Cooperation
!! Data Base of Information on New SitesData Base of Information on New Sites
!! Sharing of Traffic DataSharing of Traffic Data
!! RR--Value Calibration ProceduresValue Calibration Procedures
!! Procedures to Classify InProcedures to Classify In--Place HMAPlace HMA
!! Sharing of Materials Property DataSharing of Materials Property Data
!! Developing Models for InDeveloping Models for In--placeplace
RecyclingRecycling
Thank You
13 of 92

MechanisticMechanistic--Empirical Pavement Empirical Pavement
Design Guide Implementation Design Guide Implementation
at South Dakota DOTat South Dakota DOT
Gill L. HedmanGill L. Hedman
Pavement Design EngineerPavement Design Engineer
South Dakota DOTSouth Dakota DOT
March 9, 2009March 9, 2009
M-E PDG Implementation
At the SDDOT
Research Project SD2005-01 (APTech)
! Conduct Sensitivity Analysis
! Recommend Input Levels
- High, Intermediate, Defaults
! Determine Resource Requirements
! Identify Calibration Requirements
! Develop an Implementation Plan
* All activities based on Version 0.9, M-E PDG Software
SD2005-01 Project Objectives
• Identify the requirements and resources that will be
needed for SDDOT to implement the M-E Design
Guide
• Develop M-E Pavement Design Implementation Plan
for SDDOT
SD2005-01 Key Project Activities
• Sensitivity Analysis
– Determined which inputs have the most significant impact
on predicted pavement performance
• Recommended Input Levels
– Used results to produce a ranked listing of significant inputs
for 5 standard designs (both new pavement and overlay
designs with both flexible and rigid surfaces)
– Developed recommendations for the appropriate input level
(Level 1, Level 2, or Level 3)
– Identified differences between targeted input levels and
current SDDOT practices
SD2005-01 Key Project Activities (cont)
• Resource Requirements to Meet Target Levels
– Changes to data collection and testing procedures
– New testing equipment needed
– Training needs
– Other resources needed
• Calibration Requirements
– Process for evaluating transverse cracking on rigid
pavements
• Implementation Plan
SD2007-08
SDDOT M-E/PDG Implementation
Plan (Current)
• M-E/PDG Implementation Team
• SDDOT Transportation Implementation Group (TIG)
• 12 - SDDOT Representatives
• 1 - Federal Highway Representative
• 2 - Industry Representatives
• South Dakota Concrete Pavement Association
• Dakota Asphalt Pavement Association
• Develop a Communication Plan (Completed)
•Conduct M-E/PDG training (Completed in fall of 2008)
14 of 92

• Review and appraise M-E/PDG software relative to its performance
for South Dakota soils, materials, climate, traffic, and other
considerations.
• Research Projects underway
• SD2008-10 with Lance Roberts from the South Dakota School of
Mines and Technology to determine Resilient Modulus and Dynamic
Modulus Values for soils and asphalt mixes typically used in South
Dakota
• M-E/PDG design, validation testing, & monitoring through the
Asphalt Research Consortium (ARC) with Peter Sebaaly from the
University of Nevada Reno
• SD2008-03 with Peter Sebaaly from the University of Nevada Reno
to evaluate Warm Mix in South Dakota
• Evaluate Coefficient of Thermal Expansion in our Concrete Lab and
develop a data base based on our concrete mixes
SD2007-08
SDDOT M-E/PDG Implementation
Plan (Current)
• Review inputs’ significance using Version 1.0
• Assess training needs and begin training
• Begin database compilation using non-project
specific data
• Review recommendations for model calibration
SD2007-08
SDDOT M-E/PDG Implementation
Plan - Short term (1 to 3 years)
• Conduct preliminary calibration of models
• Acquire new equipment as needs define
• Train personnel in new testing requirements
• Begin using MEPDG alongside existing pavement
design procedure
• Develop MEPDG documentation and guidelines
• Calibrate and validate models
• Determine any further data collection needs
SD2007-08
SDDOT M-E/PDG Implementation
Plan - Mid-term (2 to 4 years)
• Move towards full implementation of MEPDG
• Develop a design catalog for standard designs
SD2007-08
SDDOT M-E/PDG Implementation
Plan - Long-term (> 4 years)
• The recommendations represent a large commitment of
resources for 3 to 5 years
• Model enhancements will continue
• New procedures are expected to be adopted by AASHTO
• Documentation lags behind development
• Expected to result in a better understanding of the
significant inputs that impact pavement performance
• Improved designs
• Potential use in construction acceptance
SD2007-08
SDDOT M-E/PDG Implementation
Plan - Expected Benefits
• http://www.state.sd.us/Applications/HR19ResearchP
rojects/Projects/sd2005-01_Final_Report.pdf
• ftp://ftp.state.sd.us/DOT/Research/MEPDG/Some
Apparent Problems with the MEPDG Model for JCP
Pavements.doc
15 of 92

Questions?
Thank You!
For more information…
" Dennis JohnsonSDDOT [email protected]
" Gill L. HedmanSDDOT Materials & [email protected]
" David HuftSDDOT Research Program [email protected]
Larry Engbrecht (SDACPA) Bob Longbons (Materials & Surfacing)
Gill Hedman (Materials & Surfacing) Blair Lunde (Project Development)
Brett Hestdalen (FHWA) Ken Marks (Trans Inventory Mgt)
Darin Hodges (Materials & Surfacing) Tony Ondricek (Pierre Region)
Dave Huft (Research) Rick Rowen (Materials & Surfacing)
Denny Johnson (Research) Ken Swedeen (DAPA)
Ryan Johnson (Operations Support) Dennis Winters (SD BIT)
Dan Johnston (Research)
M-E PDG/TIG
TIG Members:
16 of 92

Calibrate Calibrate
Performance CurvesPerformance CurvesGuidance to ODOT StaffGuidance to ODOT Staff
••““BackBack--calculationcalculation”” of existing roadsof existing roads
••Issues IdentifiedIssues Identified
!!Traffic Volumes & Axle LoadsTraffic Volumes & Axle Loads
!!Materials CharacterizationMaterials Characterization
!!Distress/Condition definitionsDistress/Condition definitions
Calibrate Calibrate
Performance CurvesPerformance CurvesCurrent ResultsCurrent Results
""ODOT ESALS overODOT ESALS over--estimated?estimated?
""““FatigueFatigue”” is more likely top down than bottom is more likely top down than bottom
up for our highwaysup for our highways
""AC stripping modeling?AC stripping modeling?
Calibrate Calibrate
Performance CurvesPerformance CurvesCurrent ResultsCurrent Results
""Historical BindersHistorical Binders
##AC or ARAC or AR
##PBAPBA
##PG and PG xxPG and PG xx--xx ERxx ER
!!Use of RapUse of Rap
##Effects to StiffnessEffects to Stiffness
##Long Term PerformanceLong Term Performance
##Need for Blend Charts?Need for Blend Charts?
17 of 92

Composite PavementsComposite Pavements
!!What is a Composite Pavement?What is a Composite Pavement?
Composite PavementsComposite Pavements
!!What is a Composite Pavement?What is a Composite Pavement?
••The FHWA "composite pavement" The FHWA "composite pavement"
category is defined as a "mixed category is defined as a "mixed
bituminous or bituminous penetration bituminous or bituminous penetration
roadway" of more than 25 mm (1 inch) of roadway" of more than 25 mm (1 inch) of
compacted material on a rigid basecompacted material on a rigid base
(source:(source: WsDOTWsDOT Interactive)Interactive)
Composite PavementsComposite Pavements
!!What is a Composite Pavement?What is a Composite Pavement?
••Occasionally, they are initially Occasionally, they are initially
constructed as composite pavements, but constructed as composite pavements, but
more frequently they are the result of more frequently they are the result of
pavement rehabilitation (e.g., HMA pavement rehabilitation (e.g., HMA
overlay of PCC pavement)overlay of PCC pavement)
(source:(source: WsDOTWsDOT Interactive)Interactive)
Composite PavementsComposite Pavements
!!Modeling of Composite PavementsModeling of Composite Pavements
••Modeling these pavements depends on Modeling these pavements depends on
the composite actionthe composite action
""A deep HMA overlay of a PCC pavement is A deep HMA overlay of a PCC pavement is
typically classified as a flexible pavement typically classified as a flexible pavement
""An HMA overlay of a PCC pavement with An HMA overlay of a PCC pavement with
no fracture preparation typically responds no fracture preparation typically responds
with rigid pavement characteristics with rigid pavement characteristics
Composite PavementsComposite Pavements
!!MEPDG ModelingMEPDG Modeling
••HMA OverlayHMA Overlay
""CRCP, JPCP or CRCP, JPCP or RubblizedRubblized PCCPCC
""PrePre--overlay repairs are criticaloverlay repairs are critical
••HMA over CTBHMA over CTB
""National Model not CalibratedNational Model not Calibrated
••HMA over New PCCHMA over New PCC
""MEPDG does not allow HMA over new PCC MEPDG does not allow HMA over new PCC
""Model as HMA overlay on PCCModel as HMA overlay on PCC
Composite PavementsComposite Pavements
!!ObservationsObservations
••MEPDG overlay on PCC matches our MEPDG overlay on PCC matches our
experienceexperience
##Thin HMA overlays do work on Interstate Thin HMA overlays do work on Interstate
CRCP or JRCP (no JPCP on Oregon CRCP or JRCP (no JPCP on Oregon
Interstate)Interstate)
##Thick HMA over CTB does not prevent top Thick HMA over CTB does not prevent top
down cracking but does mitigate transverse down cracking but does mitigate transverse
reflective crackingreflective cracking
18 of 92

Composite PavementsComposite Pavements
!!More ObservationsMore Observations
••RubblizedRubblized PCC performing well, potential PCC performing well, potential
to reduce HMA overlay thicknessto reduce HMA overlay thickness
$$Deflection data indicates Deflection data indicates rubblizedrubblized PCC stronger PCC stronger
than design estimatesthan design estimates
$$At construction, deflection data can help determine At construction, deflection data can help determine
properproper rubblizingrubblizing efforteffort
$$One of oldest projects 1997, IOne of oldest projects 1997, I--5 Evans Cr to Grants 5 Evans Cr to Grants
Pass, current PCI=85Pass, current PCI=85
Composite PavementsComposite Pavements
Questions?
19 of 92

FWD Backcalculation
Todd Scholz, P.E.
Oregon State University
Backcalculation Software
• OSU conducted a study to evaluate backcalculation programs to determine:
– Comprehensive list of programs
– Algorithms and pros and cons of each
– Operating system on which the programs run
– Sources/licensing/purchasing details
– Cost (if any)
– Recommended program
Process Seed
Moduli
Loads
Layer
Props
Measured
Deflections
Deflection
Calcs
Error
Check
Range of
Moduli
Controls
Search
for New
Moduli
ResultsAfter Lytton, 1989
Forward Calculation ! LEA
• Two methods:
– Odemark-Boussinesq
– IntegrationDist. from
LoadD
eflection
Theoretical
Deflection
Basin
Backcalculation
• Two common methods:
– Iteration
– Database
Backcalculation ! Iteration
e1e2
e3
e5
e6
e4e7
RMSE = {![ ( )]}1
n
ei
dmi
1/2
Dist. from
Load
Defle
ction
Calculated
Deflections
Measured
Deflections
20 of 92

Backcalculation ! Iteration
Measured
Calculated
Dist. from Load
De
flection
Backcalculation ! Database
Measured
Calculated
Programs – LEA & Backcalculation (from literature review)
ABAQUS CLEVERCALC ELSDEF ISSEM4 NUS-DEF UMPED
ANN COMDEF ELSYM5 JULEA OAF WESDEF
AYMA DAMA EPLOPT LEEP PADAL WESLEA
BACK DARWIN ERI Analysis LMBS PEACH WESTERX
BISAR DBCONPAS EVERCALC MICHBACK PEDD WINSASW
BISDEF DEFMET FAABACKCAL MICHPAVE PEDMOD
BKGREEN DIPLOMAT FALMAN MODCOMP PHONIX
BOUSDEF EFROMD ILLIBACK MODULUS PROBE
CHEVDEF ELCON ILLI-PAVE NIKE3D RPEDD1
CIRCLY ELMOD5 ILSL2X NUS-BACK SEARCH
Initial Selection Criteria(from literature review)
• SHRP Study
• FHWA Study
• Mn/ROAD
SHRP Study – PCS/Law• Look at both slab theory and an elastic layer model for rigid
pavements;
• Use layered elastic theory for flexible pavements;
• Allow variable slip conditions at layer interfaces;
• Allow flexible plate boundary conditions;
• Allow user input for seed moduli required, with independent moduli results;
• Report goodness of fit for each deflection measurement;
• Allow user-defined depth to rigid layer;
• Have a non-linear modeling capability for base and subgrade materials;
• Have the capability for the user to fix a layer modulus;
• Be able to model at least five layers for flexible pavements;
• Be readily available at a reasonable price;
• Have an available source code;
• Be capable of applying a weighing function to the error tolerances.
FHWA Study – Simpson & Von
Quintus
• Accuracy of program
• Operational characteristics
• Ease of use of program
• Stability of program
• Probability of success
21 of 92

Mn/ROAD Study• Accuracy of backcalculated moduli and forward
calculated response results;
• Use of the same forward calculation program for both back and forward calculations;
• Calculated moduli, stresses, and strains contained in one output file;
• Flexibility in selection of deflection sensor positions;
• Adaptability for users with different computer resources; obtain source: code if possible; ability to run in Windows, DOS, and/or UNIX environments;
• Ability to interface with MnROAD database;
• Computational efficiency; ability to process data files in batch mode;
• Program documentation with examples and case studies.
Initial ShortlistSoftware Title Rating Cost OS
EVERCALC 5 Free Win
MODULUS 6.0 5 Free Win
MODCOMP5 5 Free Win
ELMOD5 4 $65 Win
SW-1 (DAMA) 4 $400 Win
BAKFAA 3 Free Win
CIRCLY 3 Not Free Win, Excel
DARWIN 3 $2,300 Win
ERI Pavement Analysis 2 Not Free Win
MICHBACK 2 Free Dos
MICHPAVE 2 Free Dos
ELSYM5 2 $50 Dos
ILLI-PAVE 2 $50 Dos
ILLIBACK 2 $225 Dos
Shortlist & Some Program Details
ELMOD EVERCALC MODCOMP MODULUS
Developed
by
Ullidtz Mahoney
et al
Irwin/
Szebeyi
TTI
Forward
Calc. Meth.
Odemark-
Boussinesq
LEA
(WESLEA)
LEA
(Chevron)
LEA
(WESLEA)
Backcalc.
Method
Iterative Iterative Iterative Database
Converge
Method
Relative
error (5
sensors)
Sum of rel.
squared
error
Rel. defl.
error at
sensors
Sum of rel.
squared
error
Planned Evaluation
• Side-by-side comparison of programs from
the shortlist to determine:
– “Accuracy”
– Ease of use
– Stability
– Program recommended for use by ODOT
Trouble in River City
• MODCOMP
• ELMOD
• MODULUS
Plan B
• The programs from the shortlist utilize
similar methods for determining
convergence
• Hence, it was reasoned that the forward
calculation method likely contributes to the
bulk of the differences between programs:
– MEPDG utilizes JULEA
– EVERCALC utilizes WESLEA
22 of 92

JULEA vs. WESLEA
• Ran comparisons for same structure, layer
properties, and loading characteristics
• Found insignificant differences in
calculated stresses, strain, and deflections
for the conditions evaluated
Recommendation
• EVERCALC
MEPDG
• Master curve (undamaged, but aged):
loglog( *)
1 rtE
e" #
$%
&' &
&
MEPDG
• Estimate damage:
• Define $":
( )
*( )
ij
E NDTd
E pred'
' (1 )jd$ $' (
MEPDG
• Develop field damaged master curve:
log
(1 )log( *)
1 r
j
t
dE
e" #
$%
&
(' &
&
$"
23 of 92

1
Consideration of Environmental Variation Effects in M-E Design –Idaho WINFLEX 2006
By
Mike Santi
Idaho Transportation Department
Fouad Bayomy and Ahmad Abu Abdo
University of Idaho
2
Projects
1996 - FMK128_Pilot Study by Bayomy and Hardcastle
1997 - FMK173_ Soil Moisture Monitoring by Bayomy and
Hardcastle
2000 - KLK459_Soil Moisture Monitoring (Cont.) by
Bayomy
1996 - 2006 – Series of projects to develop the WINFLEX
(M-E Overlay Design System)
Subgrade Soil
AC Surface
Seasonal variations
Axle Loads
4
Objectives
! Replicate LTPP Seasonal sites at various regions of the state
! Develop Seasonal Shift Factors (SAF’s) for various regions.
! Implement the developed shift functions in the M-E design process to predict the accumulated seasonal damage.
Site # 4
Pack River
Site # 3
Worley
Site # 2
Moscow
Site # 1
Lewiston
Site # 5
Weiser
N
Idaho
Sites’
Map
6
Instrumentation and Data Collection
! Instrumented Five sites (8 installations) in
Idaho– TDR Moisture Probes
– MRC Thermistor sensors
– ABF Resistivity sensors
– Piezometers
! Climatic Data
! Traffic Data
! FWD
! LTPP-SMP Database
24 of 92

7
(a)" A C
(b )" A gg. B ase
(c)" R . C ap
T D R
T ype K /F
or F /F
AB F R es is tivity
P ro b e , 6 '
M R C
T herm is to r, 6 '
d 1
d 2
d 3d 4
Instrumentation
8
9
Implementation of the findings
10
Seasonal timing
Lewiston, Av. Monthly
10
30
50
70
90
1 2 3 4 5 6 7 8 9 10 11 12
Month
Air
Te
mp
r.,
0F
10
20
30
40
50
Ra
infa
ll,
mm
Air Tempr
Rainfall
11
Seasonal timing (cont.)
Lew iston, Av. Seasonal
10
30
50
70
90
1 2 3 4 5 6 7 8 9 10 11 12
Month
Air
Te
mp
r., 0
F
10
20
30
40
50
W inter
Fall
Summer
Fall
W interSpring
12
Moisture vs. rainfall
Lewiston Site
21
22
23
24
25
26
27
1 2 3 4 5 6 7 8 9 10 11 12Month
VM
C, %
15
19
23
27
31
35
39
Ra
infa
ll, m
m
VMC
Rainfall
25 of 92

13
Moisture variation
5
1 5
2 5
3 5
4 5
5 5
6 5
7 5
1 2 3 4 5 6 7 8 9 1 0 1 1 1 2
M o n th
Mo
istu
re C
on
ten
t, %
L e w is to n M o s c o w W o rle y
P R W e is e r
Seasonal Adjustment Factors
Mf = Cf x Mn
Mt = Ct x Mn
MW = CW x Mn
15
Subgrade Seasonal Adjustment Factors
(Ref: Table 8.5)
SAF’s
16
Subgrade Monthly Adjustment Factors
(Ref: Table 8.6)
MAF’s
IDAHO PAVEMENT CLIMATE ZONES
6
5
4
2
31
N
Seasonal Factors for
Subgrade
26 of 92

Air Temperature for ID Zones
Season and ConditionZone 1
Driggs
Zone 2
Idaho Falls
Zone 3
Twin Falls
Zone 4
Powell
Zone 5
McCall
Zone 6
Moscow
Winter - Freeze -0.6 0.0 6.7 0.6 0.6 8.9
Spring - Thaw 13.3 14.4 14.4 11.7 13.3 15.0
Summer - Normal 16.1 18.3 18.9 16.7 15.6 18.3
Fall/ Winter - Normal 1.1 0.6 2.2 2.2 1.7 1.1
* Shown values are the 68th percentile
Climatic Parameters
Climatic Parameter Zone 1
Driggs
Zone 2
Idaho Falls
Zone 3
Twin Falls
Zone 4
Powell
Zone 5
McCall
Zone 6
Moscow
Frost Depth, mm 1321 1372 660 940 1067 559
Freezing Index,
degree-days1507 1587 543 873 1062 442
Thaw Index, degree-
days395 415 230 279
Freeze Transition
Period, days15 9 44 24
Onset of Frozen
period10-Jan 3-Jan 1-Feb 10-Feb 30-Jan 15-Feb
Frozen period*, days 120 126 90 82 110 90
Frozen period, % time
of the year33% 35% 25% 22% 30% 25%
Onset of Thaw period 10-May 9-May 1-May 3-May 16-May 16-May
Thaw period**, days 38 36 15 27 24 30
Thaw period, % time
of the year10% 10% 4% 7% 7% 8%
Normal period, Days 192 194 260 212 207 245
Normal period, %
time of the year53% 53% 71% 58% 57% 67%
* Calculated based on Thaw Index of 24 degrees-days
** Calculated based on Thaw Index = 4.154+0.259(AFI)
SEASONAL VARIATIONESUG FOR ZONES 1,2,4&5
Spring
Thaw-R
Summer & Fall-WinterWinter
Frozen
12 Months
Recommended
Used in this study
Mn
Mt
Mf
(Mn+Mt)/2
(Mn+Mf)/2
Normal
12 Months
Winter-Spring
Wet
Spring
Wet- R
Summer& Fall-Winter
Normal
Recommended
Used in this study
Mn
Mw
(Mn+Mw)/2
SEASONAL VARIATION ESUG FOR ZONES 3 & 6
Seasonal Adjustment Factors for Zones 1, 2, 4 and 5
Seasonal Adjustment Factors, SAF Climate
Zone Winter
Frozen
Spring
Thaw
Summer
Normal
Fall Normal
Subgrade Eqn. 7 Eqn. 8,9,10 1 1
Base/Subbase 1 0.65 1 1
Traffic User Input
Temperature, F 31 55 62 34
Zone 1
Period, Months 4 1.5 3.5 3
Subgrade Eqn. 7 Eqn. 8,9,10 1 1
Base/Subbase 1 0.65 1 1
Traffic User Input
Temperature, F 32 58 65 33
Zone 2
Period, Months 4 1.5 3.5 3
Subgrade Eqn. 7 Eqn. 8,9,10 1 1
Base/Subbase 1 0.65 1 1
Traffic User Input
Temperature, F 33 53 62 36
Zone 4
Period, Months 3 1 4 4
Subgrade Eqn. 7 Eqn. 8,9,10 1 1
Base/Subbase 1 0.65 1 1
Traffic User Input
Temperature, F 33 56 60 35
Zone 5
Period, Months 4 1 4 3
Seasonal Adjustment Factors for Zones 3 and 6
Seasonal Adjustment Factors, SAF Climate
Zone Subgrade
Classification
Winter
Wet
Spring
Wet
Summer
Normal
Fall
Normal
GW,GP,SW,SP Eqn. 13,14,15 Eqn. 13,14,15 1 1
GC,SC,CL Eqn. 16,17,18 Eqn. 16,17,18 1 1
GM,SM,ML Eqn. 19,20,21 Eqn. 19,20,21 1 1 Subgrade
MH,CH Eqn. 22,23,24 Eqn. 22,23,24 1 1
Base/Subbase 0.65 0.85 1 1
Traffic User Input
Temperature, F 44 58 66 36
Zone 3
Period, Months 3 1 4 4
GW,GP,SW,SP Eqn. 13,14,15 Eqn. 13,14,15 1 1
GC,SC,CL Eqn. 16,17,18 Eqn. 16,17,18 1 1
GM,SM,ML Eqn. 19,20,21 Eqn. 19,20,21 1 1 Subgrade
MH,CH Eqn. 22,23,24 Eqn. 22,23,24 1 1
Base/Subbase 0.65 0.85 1 1
Traffic User Input
Temperature, F 48 59 65 34
Zone 6
Period, Months 3 1 4 4
27 of 92

Seasonal Factors for
Granular Base/Sub-base
SEASONAL VARIATIONESB/SBS FOR ZONES 1,2,4 &5
Winter
Spring
Summer& Fall-Winter
12 Months
Mn
0.65 Mn
SEASONAL VARIATION E BS/SBS FOR ZONES 3 & 6
12 Months
Winter-Spring
Wet
Spring
Wet- R
Summer& Fall-Winter
0.85 Mn
0.65 Mn
Mn
Normal
Example
Seasonal Shift FactorsCalculated by
WINFLEX for a
given Subgrade
modulus value
Seasonal Variation Factor for:
Climatic
Zone
Subgrade
Classification
where Needed
Winter
Frozen
Spring
Thaw
Summer
Normal
Fall
Normal
Zone 1 Subgrade 11.2 0.43 1 1
Base / SubBase 1 0.65 1 1
Traffic User Input
Temperature, C -0.56 12.78 16.67 1.11
Period (Month) 4 1.5 3.5 3
Zone 2 Subgrade 11.2 0.43 1 1
Base / SubBase 1 0.65 1 1
Traffic User Input
Temperature, C 0.00 14.44 18.33 0.56
Period (Month) 4 1.5 3.5 3
Zone 3 Subgrade GW, GP, SW, SP 0.81 0.9 1 1
GC, SC, CL 0.48 0.74 1 1
GM, SM, ML 0.6 0.8 1 1
MH, CH 0.35 0.68 1 1
Base / SubBase 0.65 0.85 1 1
Traffic User Input
Temperature, C 6.67 14.44 18.89 2.22
Period (Month) 3 1 4 4
Zone 4 Subgrade 11.2 0.43 1 1
Base / SubBase 1 0.65 1 1
Traffic User Input
Temperature, C 33 53 62 36
Period (Month) 3 1 4 4
Zone 5 Subgrade 11.2 0.43 1 1
Base / SubBase 1 0.65 1 1
Traffic User Input
Temperature, C 0.56 13.33 15.56 1.67
Period (Month) 4 1 4 3
Zone 6 Subgrade GW, GP, SW, SP 0.73 0.87 1 1
GC, SC, CL 0.38 0.69 1 1
GM, SM, ML 0.52 0.76 1 1
MH, CH 0.27 0.63 1 1
Base / SubBase 0.65 0.85 1 1
Traffic User Input
Temperature, C 8.89 15.00 18.33 1.11
Period (Month) 3 1 4 4
29
SAF (AC)
0
1
2
3
4
1 2 3 4 5 6 7 8 9 10 11 12
Month
SA
F(a
c)
Worley
Moscow
Effect of seasonal approximation on fatigue life
Worley
0E+00
1E+07
2E+07
3E+07
12 4 1
Seasons / Year
ES
AL
s
Moscow
3E+06
5E+06
7E+06
9E+06
12 4 1
Seasons / Year
ES
AL
s
28 of 92

31
Implementation in WINFLEX (Idaho M-E Overlay Design
Software)
Seasonal Adjustment Screen
Seasonal Adjustment Screen
29 of 92

MEPDG Calibration
-WSDOT
Jianhua Li
Jeff Uhlmeyer
March, 2009
2
Outline
! Bench Testing
! Distress Model Analysis
! Data Preparation
! Calibration
! Calibration Results Discussion
! Conclusions and Recommendations
3
Bench Testing
! Bench testing is to check software run-time issues,
model prediction reasonableness, and identify
calibration needs.
! Input sensitivity on estimated pavement distresses.
Med.Soil Type
HighAC Mix Stiffness
Med.HighMed.AADTT
Med.HighMed.Base Type
HighMed.Med.HighAC Thickness
Med.Med.Med.HighPG Binder
HighHighHighMed.Climate
IRI
AC
Rutting
Alligator
Cracking
Transverse
Cracking
Longitudinal
CrackingInput Factors
Note: Blank means low sensitivity level or not related
4
Model Analysis
! Elasticity is used to describe the effects of the
calibration factors on the pavement distress
models.
Where
Change in the estimated distress
Change in the calibration factor Ci
distress Estimated distress using default calibration factors
Ci Default value of Ci
iC
distress
( ) /E
( ) /i i
distress distress
C C
!"
!
( )distress!
( )iC!
5
Data Preparation
! Input values were generally taken from typical
WSDOT values. Where options of input level
were given, level 2 was preferred.
! Input data categories
" Traffic
" Climate
" Pavement structure
! Pavement performance data
6
Calibration
! New concrete pavements in 2005 (version 0.6)
! New flexible pavements in 2008 (version 1.0)
! Recommended Practice for Local Calibration of
ME Pavement Design Guide
" Split-sample approach
" Jack-knife testing approach
30 of 92

7
Calibration Steps
! Define calibration categories.
" Traffic (low. Med, high)
" Climate (Western and Eastern Washington)
" Soil modulus (weak, strong)
! Choose typical sections.
" WSPMS
" WSDOT previous studies about pavement material
and performance
" LTPP sections
! Calibrate the models.
! Validate the calibration results.
8
25.2425.2425.2425.24C4
1.49291.49291.49291.4929C3
0.44170.44170.44170.4417C2
0.82030.82030.82030.8203C1
Roughness
400400400400C8
0.659.672.041.2C7
0.40.0640.00640.4C6
25077.577.5250C5
0.00040.0002480.0002480.0008C4
0.0017250.0005350.0005350.001725C3
0.60.3410.3411.1C2
0.9340.40.41.29C1
Faulting
-1.68-1.68-1.68-1.68C5
1111C4
1.4641.4641.4641.22C2
2.42.42.42C1
Cracking
Reha.
DBR
New
Undoweled – MP
New
Undoweled
Defaults
For New PCCCalibration Factor
Calibration Results – Undoweled JPCP, V0.6
9
Discussion – Undoweled JPCP, version 0.6
! The calibration factors are significantly different
from the default values.
! Predicted trends and values are reasonable for
transverse cracking and faulting, except that
" Longitudinal cracking is significant in WSDOT PCC
pavements but not modeled in MEPDG.
" MEPDG understandably does not model studded tire
wear.
" The roughness model always underestimates actual
WSDOT roughness.
10
Calibration Results - New HMA, version 1.0
01Bs1
Subgrade Rutting
1.11Br3
1.1091Br2
1.051Br1
AC Rutting
60006000C3
11C2
1.0711C1Alligator cracking
10001000C4
00C3
3.5963.5C2
6.427C1Longitudinal cracking
1.031Bf3
0.971Bf2
0.961Bf1
AC Fatigue
Calibrated FactorsDefaultCalibration Factor
11
Discussion – New HMA, version 1.0
! The calibration factors are significantly different from
the default values.
! The default transverse cracking calibration factors
reasonably estimate WSDOT transverse cracking
conditions.
! Predicted trends and values are reasonable for
cracking and rutting.
! The default roughness model always underestimate
actual roughness, but the differences are small.
12
Conclusions
! The MEPDG is an advanced tool for pavement
design and evaluation.
! Calibration is required prior to implementation.
! The concrete pavement calibration results need
to be adjusted before use.
! The distress models for new flexible pavement
have been calibrated, except the IRI model.
31 of 92

13
Recommendations
! Local agencies need to balance the input data
accuracy and costs.
! The calibration is a continual process along with
implementation.
! States with similar climate and material
conditions may test the calibration results for
their local use.
! WSDOT will continue to monitor future works
related to MEPDG.
32 of 92

Performance Curve Calibration
(Oregon Plan)
Todd Scholz, P.E.
Oregon State University
Topics
• New Work HMAC Projects
• Rehabilitation with HMAC Overlays
New Work Projects
• On-going research to:
– Validate JULEA
– Initial validation of performance models:
• Fatigue cracking
• Rutting
New Work Projects: I-5
New Work
Projects: I-5
New Work Projects: I-5
33 of 92

New Work Projects: I-5 New Work Projects: I-5
New Work Projects: I-5 New Work Projects: Redmond
New Work Projects: Redmond New Work Projects: Redmond
34 of 92

New Work Projects: Redmond New Work Projects: Redmond
New Work Projects: Redmond
Agg. Base Rubblized PCC Base
Passenger Car
Loaded School Bus
Truck
0 0.5 1.0 1.5 2.0 2.5 3.0
Lo
ng
itu
din
al S
tra
in, m
icro
str
ain
20
10
0
20
10
0
50
40
30
-10
20
10
0
40
30
-10
-20
Time, seconds
Rehabilitation Projects
• New project beginning July 2009
• Objective – provide ODOT with HMAC
overlay performance models for rutting
and cracking (fatigue, thermal, and
reflective) calibrated to Oregon conditions
35 of 92

Work Plan Overview
Literature Review
Calibration Plan
Records Review Condition Surveys
Model Calibration
Task 1 - Literature Review
• NCHRP 01-40B: “User Manual and Local
Calibration Guide for the Mechanistic-
Empirical Pavement Design Guide and
Software”
• Efforts from other states
Task 2 - Calibration Plan
• Develop comprehensive plan based on
findings from literature review
• Initial thoughts include the following…
Historical Information
• Mix Design
• Structural Design
• Traffic
• Climate
In Situ Condition
• Rutting
• Fatigue Cracking
• Thermal Cracking
• Reflection Cracking
MEPDG
Runs
Compare:
• Predicted
• In Situ (Actual)
Adjust
Models
Validate
Task 3 – Records Review
1. Mine the ODOT PMS to identify candidate
projects
2. Identify projects for which requisite
information (mix design, structural design,
etc.) exists
3. Select specific projects for further
investigation
4. Obtain and summarize requisite
information
Task 4 – Condition Surveys
• Perform detailed condition surveys on
projects selected in Task 3 to quantify:
– Rutting
– Fatigue cracking
– Thermal cracking
– Reflective cracking
36 of 92

Task 5 – Model Calibration
1. Using info from records review, run
MEPDG to get predicted distress
2. Compare predicted distress to measured
distress from condition surveys
3. If significant differences exist, adjust
model coefficients
4. Repeat Steps 1 - 3 until differences are
reduced to an acceptable level
For each distress type:
Scope
• Structures
• Traffic levels
• Pavement condition
• Climate zones
Structures
• HMAC over HMAC
• HMAC over JPCP
• HMAC over CRCP
• HMAC over Rubbilized concrete – oldest
project built in 1997
} ?
Traffic
Pavement Condition Pavement Condition
37 of 92

ClimatePrincipal Challenges
• Requisite information for MEPDG runs:
– Traffic:
• Volume adjustment factors (MAF, truck dist.,
hourly dist., growth)
• Axle load distribution
• General (axles/truck & configuration)
– Structure (layer properties, mix design, etc.)
• In situ condition
38 of 92

Rigid Pavement Climatic
Effects in Illinois
Jeffery Roesler, Ph.D., P.E.
Associate Professor
Department of Civil and Environmental Engineering
University of Illinois
North-West MEPDG User’s Group Meeting
Corvallis, OR
March 9-10, 2009
Acknowledgements
! ICT R57 – Technical Review Panel (2005-08)
" Illinois Department of Transportation
! Amy Schutzbach et al.
! UIUC Students
" Jake Hiller
" Dong Wang
" Victor Cervantes
" Matt Beyer
" Amanda Bordelon
Overview
! Illinois has existing M-E JPCP method by Zollinger
and Barenberg (1989)
" No direct climate consideration
! IDOT has an semi-empirical method to determine
CRCP thickness
" No direct climate consideration
! Update/refine existing JPCP procedure and develop
M-E CRCP design method
Existing IDOT JPCP Method
! Traffic = ESALs
! MOR = 703 psi (?)
! k-value = 50, 100, 200 psi/in
! Temperature curling (k=100 psi/in)
! Joint Spacing = 15ft
! Shoulder Type = AC or Tied [widen]
! Reliability (95% curves)
! Failure = 20% slabs cracked – TF>10
! COPES data calibration
IDOT M-E JPCP Method
IDOT (2002)K=50 psi/in
IDOT assumed Thermal Gradients
35% Night (-0.65!F/in)
25% Day (+1.65!F/in)
40% Zero (0!F/in)
39 of 92

M-EPDG Evaluation
! Objective
" Evaluate version 0.91 vs. 1.0
" Determine effect of Climate on PCC thickness in
Illinois
" Is there a need for a geography / climate-based
design method in Illinois?
Concrete Coefficient of Thermal Expansion
(COTE)
! Illinois SHRP Test Sites
" 84 total cores
! AVERAGE80%
= 5.7x10⁻⁶/!F (69 cores)
! STD DEV80%
= 0.33x10⁻⁶/!F
! COV = 6%
SHRP Test Site cores in Illinois
Climate Effect Inputs
! Changes in Climatic Effects
" Climate data for several Illinois cities ran with E-
ICM
! Concrete thickness was changed to ensure less
than 20% slab cracking for each climate
" No faulting or IRI criteria limit!
Climatic Effects (v. 0.91)
! Five regions in Illinois
! Range of slab thickness – 10.5” to 12”
! Pavement at all sites had less than 20%
cracking at 30 yrs
Slab Thickness vs. Climate Region
9.5
10
10.5
11
11.5
12
12.5
Carbondale (12") Midway (11.5") Dupage (10.5") Peoria (11") St Louis (10.5")
Climate Region
Thic
kness (i
MEPDG Summary (Feb. 2007)
! Climate may change a slab thickness
" V0.8 - limited effect
" V0.91 - 1.5” statewide
! All cracking is top-down except Class 5
vehicle analysis
V.1.0 MEPDG / IDOT Inputs
! MEPDG (v1.0) default load spectra (TTC1)
! Illinois Vehicle Class Distribution
! Variables
" Shoulder type (AC, tied, widen lane)
" slab length (12, 15, 18 ft)
" fatigue algorithm (MEPDG)
" temperature profile (linear, nonlinear)
" built-in curl (-10!F)
40 of 92

Vehicle Class distribution
Class Illinois California M-EPDG
Class 4 1.4% 1.1% 1.8%
Class 5 3.8% 23.0% 24.6%
Class 6 2.3% 5.2% 7.6%
Class 7 0.0% 0.3% 0.5%
Class 8 3.8% 6.7% 5.0%
Class 9 84.4% 50.6% 31.3%
Class 10 0.5% 0.6% 9.8%
Class 11 2.8% 8.8% 0.8%
Class 12 0.3% 1.1% 3.3%
Class 13 0.3% 0.1% 15.3%
j2Slide 13
j2 add california distribution here.jroesler, 7/23/2007
Climate Study – 10x106 ESALs
Climate Study (10 million ESALs)
0
2
4
6
8
10
12
Ca
rbo
nd
ale
Ch
am
pa
ign
Mid
wa
y
O'H
are
Du
Pa
ge
Ro
ckfo
rd
Pe
ori
a
Wa
uke
ga
n
Qu
ad
Citi
es
St.
Lo
uis
Location
Th
ickn
ess (
inch
)
MEPDG
IDOT
RadiCAL
Climate Study – 60x106 ESALs
Climate Study (60 million ESALs)
0
2
4
6
8
10
12
14
Ca
rbo
nd
ale
Ch
am
pa
ign
Mid
wa
y
O'H
are
Du
Pa
ge
Ro
ckfo
rd
Pe
ori
a
Wa
uk
eg
an
Qu
ad
Citi
es
St.
Lo
uis
Location
Th
ickn
ess (
inch
)
MEPDG
IDOT
RadiCAL
Temperature Differential Freq.
0
0.05
0.1
0.15
0.2
0.25
0.3
-45 -40 -35 -30 -25 -20 -15 -10 -5 0 5 10 15 20 25 30 35 40 45
"T (oF)
Freq
uen
cy
Carbondale Champaign Dupage Midway Rockford O'Hare Waukegan
Max (oF) Min (
oF)
Carbondale 39.6 -30.6
Champaign 37.7 -40.3
Dupage 38.4 -42.3
Midway 37.8 -42.6
Rockford 39.4 -36.3
O'Hare 40.4 -29.9
k
MEPDG Temperature Data Files
1. Carbondale 8/1/98 - 7/31/05
2. Champaign 8/1/97 - 7/31/05
3. Dupage 8/1/97 - 7/31/05
4. Midway 8/1/97 - 7/31/05
5. O'Hare 8/1/96 - 7/31/05
6. Rockford 8/1/96 - 7/31/05
7. Waukegan 8/1/00 - 7/31/05
41 of 92

Joint Spacing – 10M ESALs and AC
Shoulder
Joint Spacing Study (AC shoulder, 10 million ESALs)
0
2
4
6
8
10
12
14
12 15 18
Joint Spacing (ft)
Th
ickn
ess (
inch
)
MEPDG
IDOT
RadiCAL
Thermal Properties
Absorptivity Study (60 million ESALs, Champaign)
0
2
4
6
8
10
12
14
0.65 0.85
Absorptivity
Th
ickn
ess (
inch
)
CTE 4.5
CTE 5.5
CTE 6.5
Findings – CLIMATE -JPCP
Climate
" Sensitive (1.5” to 2”)
" How to accommodate?
! Temperature Curling
" Nonlinear is more representative
(IL) Climatic Zone Consideration
! Separate CHART for state zones (?)
Design Feature limitations (h>10 inches)
! #15’ south of I-80?
! 18’ use structural fibers or higher specified
strength
! For h # 10 inches
! 12’ south of I-80?
Acknowledgements
The Illinois Center for Transportation (ICT) is
an innovative partnership between the Illinois
Department of Transportation (IDOT) and the
University of Illinois at Urbana-Champaign
(UIUC).
42 of 92

1
Characterizing Asphalt Mixtures Characterizing Asphalt Mixtures with RAPwith RAP
March 10, 2009Northwest M-E PDG User Group 2
Outline
!Recycled HMA Performance
!Asphalt Binder Blending
!M-E PDG Models and RAP
!Performance Models
!Summary
3
Outline
!Recycled HMA Performance
!Asphalt Binder Blending
!M-E PDG Models and RAP
!Performance Models
!Summary
4
Performance – Arizona SPS-5
12.8-in Coarse Agg
2.7-in Recycled HMA
4.2-in Conventional HMA
14.7-in Coarse Agg
2.8-in Conventional HMA
4.1-in Conventional HMA
S i 502 S i 505Section 502 Section 505
5
Performance – Arizona SPS-5 PCI
Fo
g S
ea
l B
oth
Cra
ck S
ea
Bo
th
Fo
g S
ea
l B
oth
Fo
g S
ea
l B
oth
0
10
20
30
40
50
60
70
80
90
100
8/87 5/90 1/93 10/95 7/98 4/01 1/04 10/06
Time
Pa
ve
me
nt
Co
nd
itio
n In
de
x (
PC
I)
Section 505 (No RAP)
Section 502 (RAP)
6
Performance – Arizona SPS-5Fatigue Cracking
Fo
g S
ea
l B
oth
Cra
ck S
ea
Bo
th
Fo
g S
ea
l B
oth
Fo
g S
ea
l B
oth
0
20
40
60
80
100
120
140
160
180
8/87 5/90 1/93 10/95 7/98 4/01 1/04 10/06
Time
Fa
tig
ue
Cra
ck
ing
De
du
ct
Va
lue
s
Section 505 (No RAP)
Section 502 (RAP)
43 of 92

7
Fo
g S
ea
l B
oth
Cra
ck S
ea
Bo
th
Fo
g S
ea
l B
oth
Fo
g S
ea
l B
oth
0
10
20
30
40
50
60
70
80
90
100
8/87 5/90 1/93 10/95 7/98 4/01 1/04 10/06
Time
Tra
ns
ve
rse
& L
on
git
ud
ina
l C
rac
kin
g
De
du
ct
Va
lue
s
Section 505 (No RAP)
Section 502 (RAP)
Performance – Arizona SPS-5Transverse/Longitudinal Cracking
8
Performance – Arizona SPS-5
2.4-in Conventional HMA 2.7-in Conventional HMA
20.7-in Coarse Agg 15.0-in Coarse Agg
4.1-in Conventional HMA 4.1-in Recycled HMA
2.6-in Conventional HMA 2.4-in Recycled HMA
Section 507 Section 508 Section 507 Section 508
9
Performance – Arizona SPS-5PCI
Fo
g S
ea
l B
oth
Cra
ck S
ea
50
8
Fo
g S
ea
l B
oth
0
10
20
30
40
50
60
70
80
90
100
8/87 5/90 1/93 10/95 7/98 4/01 1/04 10/06
Time
Pa
ve
me
nt
Co
nd
itio
n In
de
x (
PC
I)
Section 507 (No RAP)
Section 508 (RAP)
10
Fo
g S
ea
l B
oth
Cra
ck S
ea
50
8
Fo
g S
ea
l B
oth
0
20
40
60
80
100
120
140
160
180
8/87 5/90 1/93 10/95 7/98 4/01 1/04 10/06
Time
Fa
tig
ue
Cra
ck
ing
De
du
ct
Va
lue
sSection 507 (No RAP)
Section 508 (RAP)
Performance – Arizona SPS-5Fatigue Cracking
11
Fo
g S
ea
l B
oth
Cra
ck S
ea
50
8
Fo
g S
ea
l B
oth
0
10
20
30
40
50
60
70
80
90
100
8/87 5/90 1/93 10/95 7/98 4/01 1/04 10/06
Time
Tra
ns
ve
rse
& L
on
git
ud
ina
l C
rac
kin
g
De
du
ct
Va
lue
s
Section 507 (No RAP)
Section 508 (RAP)
Performance – Arizona SPS-5Transverse/Longitudinal Cracking
12
19.9-in Coarse Agg 19.5-in Coarse Agg
3.6-in Conventional HMA 3.9-in Conventional HMA
5.3-in Cement Treated Agg 5.3-in Cement Treated Agg
2.2-in Conventional HMA 2.0-in Recycled HMA
2.1-in Conventional HMA 2.4-in Recycled HMA
Section 506 Section 509
Performance – California SPS-5
Section 506 Section 509
44 of 92

13
Performance – California SPS-5PCI
Surface
Treatment 506 &
509
0
10
20
30
40
50
60
70
80
90
100
5/90 1/93 10/95 7/98 4/01 1/04 10/06
Time
Pa
ve
me
nt
Co
nd
itio
n In
de
x (
PC
I)
Section 506 (No RAP)
Section 509 (RAP)
14
Performance – California SPS-5Fatigue Cracking
Surface
Treatment 506 &
509
0
10
20
30
40
50
60
70
80
90
100
5/90 1/93 10/95 7/98 4/01 1/04 10/06
Time
Fa
tig
ue
Cra
ck
ing
De
du
ct
Va
lue
s
Section 506 (No RAP)
Section 509 (RAP)
15
Performance – California SPS-5Transverse/Longitudinal Cracking
Surface
Treatment 506 &
509
0
10
20
30
40
50
60
70
80
90
100
5/90 1/93 10/95 7/98 4/01 1/04 10/06
Time
Tra
ns
ve
rse
& L
on
git
ud
ina
l C
rac
kin
g
De
du
ct
Va
lue
s
Section 506 (No RAP)
Section 509 (RAP)
16
Performance – Low Desert Climate
0
10
20
30
40
50
60
70
80
90
100
0 1 2 3 4 5 6 7 8 9 10
Time (Years)
Pavem
ent
Conditio
n I
ndex
Conventional HMA
Recycled HMA
17
Performance – High Desert Climate
0
10
20
30
40
50
60
70
80
90
100
0 1 2 3 4 5 6 7 8 9 10 11 12
Time
PC
I
Conventional HMA
Recycled HMA
18
Outline
!Recycled HMA Performance
!Asphalt Binder Blending
!M-E PDG Models and RAP
!Performance Models
!Summary
45 of 92

19
Virgin Asphalt Considerations
!0 to 15% no change in binder grade
!16 to 25% one temperature grade lower
(high and low end)
!>25% use blending charts
20
Blended Virgin/RAP Asphalt Binder –High Temperature
21
Blended Virgin/RAP Asphalt Binder –Low Temperature
22
What Happens During Mixing with RAP?
23
Looking at the Asphalt Films
24
Air voids
Time 0
Virgin Binder
RAP Binder
Aggregate
46 of 92

25
Air voids
Blended Binder
Extent of virgin
binder diffusion
RAP Binder,
no virgin binder
diffusionTime 0 + X
26
Air voids
Blended Binder
Extent of virgin
binder diffusion
RAP Binder,
no virgin binder diffusion
Time 0 + Y
Completely
blended binder
27
Outline
!Recycled HMA Performance
!Asphalt Binder Blending
!M-E PDG Models and RAP
!Performance Models
!Summary
28
Witczak’s E* Predictive Equation
! E* = dynamic modulus, psi
! ! = bitumen viscosity, 106 Poise
! f = loading frequency, Hz
! Va = air void content, %
! Vbeff = effective bitumen content, % by volume
! "34 = cumulative % retained on ¾-in sieve
! "38 = cumulative % retained on 3/8-in sieve
! "4 = cumulative % retained on No. 4 sieve
! "200 = percent passing No. 200 sieve
29
RAP High Temperature Properties
No. Ave. Std. Dev. COV
Absolute
Viscosity, P
ASTM
D2171 60 2 1,020,651 279,868 27.4
60 8 436.01 143.94 33.0
64 8 216.88 73.73 34.0
70 8 78.86 27.82 35.3
76 8 29.27 9.97 34.0
82 8 11.70 3.95 33.7
88 8 4.96 1.68 33.8
DSR Critical
Temp
AASHTO
T315
Critical
Temp 8 93.3 2.6 2.7
Test MethodTest
Temp, C
RAP
DSR G*/sin#,
kPa
AASHTO
T315
Property
30
RAP Low Temperature Properties
No. Ave. Std. Dev. COV
6 3 254.0 5.3 2.1
0 3 391.7 5.5 1.4
-6 3 511.7 26.3 5.1
6 3 0.302 0.0010 0.3
0 3 0.256 0.0020 0.8
-6 3 0.209 0.0042 2.0
BBR Critical
Temp
AASHTO
T313
Critical
Temp 3 5.9 0.1 1.0
BBR, m-value
AASHTO
T313
AASHTO
T313
Property
BBR, Stiffness,
MPa
Test MethodTest
Temp, C
RAP
47 of 92

31
RAP Viscosity (ASTM D2171) – 60C
5,46472,44326
35,099357,18225
66,424424,47824
4,885279,22423
3,30626,82422
279,8681,020,65121
Std. Dev.AverageNo. of TestsLocation
32
RAP Properties
4.7
22.0
10
7.5
19.0
3
No. 4
Sieve, %
Retained
0.92
11.1
10
1.32
10.5
3
No. 200, %
Passing
0.271.10.0Std. Dev.
5.114.00.0Ave.
101010No.
Solvent
0.321.70.0Std. Dev.
5.713.00.0Ave.
333No.
Ignition
Asphalt
Binder
Content,
%DWA
3/8-in Sieve,
% Retained
¾-in Sieve,
% Retained
StatisticExtraction
Method
33
Witczak’s E* Predictive Equation
! E* = dynamic modulus, psi
! ! = bitumen viscosity, 106 Poise
! f = loading frequency, Hz
! Va = air void content, %
! Vbeff = effective bitumen content, % by volume
! "34 = cumulative % retained on ¾-in sieve
! "38 = cumulative % retained on 3/8-in sieve
! "4 = cumulative % retained on No. 4 sieve
! "200 = percent passing No. 200 sieve
34
Outline
!Recycled HMA Performance
!Asphalt Binder Blending
!M-E PDG Models and RAP
!Performance Models
!Summary
35
! $p(HMA) = accumulated permanent or plastic vertical
deformation in the HMA layer/sublayer, inches
! Components affected
! %r(HMA) = resilient or elastic strain calculated by structural
response model at mid-depth of each HMA sublayer, in/in
! Possibly affected
! &r1, &r2, &r3 = local or mixture field calibration constants
RAP Impact on Performance Models –Permanent Deformation
36
! Nf-HMA = allowable number of axle load applications
for a flexible pavement and HMA overlays
! Components affected
! C = function of effective asphalt content by volume and
percent air voids in the HMA mixture
! 'HMA = dynamic modulus of the HMA measured in
compression, psi
! Possibly affected
! &r1, &r2, &r3 = local or mixture field calibration constants
RAP Impact on Performance Models –Fatigue and Longitudinal Cracking
48 of 92

37
! Nf-HMA = allowable number of axle load applications
for a flexible pavement and HMA overlays
! Components affected
! 'HMA = dynamic modulus of the HMA measured in
compression, psi
! Possibly affected
! &r = local or mixture field calibration factor
! (m = mixture tensile strength, psi
RAP Impact on Performance Models –Transverse Cracking
38
! IRI = international ride index after construction,
in/mi
! Components affected
! FCTotal = area of fatigue cracking, percent of area
! TC = length of transverse cracking, ft/ mi
! RD = average rut depth, in
RAP Impact on Performance Models –IRI – New Pavements
39
Actual and Predicted PerformanceRutting
0
0.1
0.2
0.3
0.4
0.5
0.6
0.000 0.100 0.200 0.300 0.400 0.500 0.600
Measured Rut Depth, in.
Pre
dic
ted
Ru
t D
ep
th,
in.
Montana Colorado
40
Actual and Predicted PerformanceFatigue
0
20
40
60
80
100
0.00 20.00 40.00 60.00 80.00 100.00 120.00
Measured Fatigue Cracking, %
Pre
dic
ted
Fati
gu
e
Cra
ckin
g,
%
Montana Colorado
41
Outline
!Recycled HMA Performance
!Asphalt Binder Blending
!M-E PDG Models and RAP
!Performance Models
!Summary
42
Summary
!Limited performance information
!National research on binders
!RAP properties
!Influence of RAP on M-E PDG models
49 of 92

43
Questions/Discussion
50 of 92

Characterization of Unbound Materials
NW-MEPDG User Group Meeting
Corvallis, 10-Mar-09
Steve Saboundjian, P.E.
State Pavement Engineer
Alaska DOT&PF
Impact of Fines Content on Resilient Modulus
Reduction of Base Courses during Thawing
- Research work by UAF (Dr. Jenny Lu et al.)
- Funding by AUTC and ADOT&PF
Project Scope
Experimental design
• 3 base course materials (D-1): 3 AK Regions
• 1 gradation
• 3 Fines contents: P200 = 6%, 8%, 10%
• 4 Temperatures: 0, 15, 30, 68°F
• 3 Moisture contents (OMC, x% ± OMC)
Laboratory Tests
• Pressure plate suction test
• Frost-heave test
• Resilient modulus test
FBX ANC JUN
• A-1-a
• 3 P200 contents
Results: As P200 increases:
• Increase in MDD
• No change in OMC
• OMC (5.3%)
• OMC+0.7% (6%)
• OMC-2% (3.3%)
Compaction TestingASTM D1557 (C)
Resilient Modulus (MR) TestingAASHTO T307
Work completed:
• D-1 base courses from 3 Regions
• Temperature: 68oF
• Fines content: 6, 8, 10%
• Moisture content:
• OMC (5.3%)
• OMC+0.7% (6.0%)
• OMC-2% (3.3%)
MR Results: Fairbanks @ 3.3% (OMC-2%)
Resilient Modulus (FBX, Fines content = 6%)
0
10
20
30
40
50
60
70
0 5 10 15 20 25 30 35
Max. Axial stress (PSI)
Resil
ien
t M
od
ulo
us (
KS
I).
pressure 3 psi
pressure 5 psi
pressure 10 psi
pressure 15 psi
pressure 20 psi
Resilient Modulous (FBX, Fines content = 10%)
0
10
20
30
40
50
60
70
0 5 10 15 20 25 30 35
Max. Axial stress (PSI)
Resil
ien
t M
od
ulo
us (
KS
I).
pressure 3 psi
pressure 5 psi
pressure 10 psi
pressure 15 psi
pressure 20 psi
51 of 92

MR Results: Fairbanks @ 5.3% (OMC)
Resilient Modulus (FBX, Fines content = 6%)
0
5
10
15
20
25
30
0 5 10 15 20 25 30 35
Max. Axial stress (PSI)
Resil
ien
t M
od
ulo
us (
KS
I)
pressure 3 psi
pressure 5 psi
pressure 10 psi
pressure 15 psi
pressure 20 psi
Resilient Modulus (FBX, Fines content = 10%)
0
10
20
30
40
50
60
70
80
0 5 10 15 20 25 30 35
Max. Axial stress (PSI)
Resil
ien
t M
od
ulo
us (
KS
I)
pressure 3 psi
pressure 5 psi
pressure 10 psi
pressure 15 psi
pressure 20 psi
MR Results: Fairbanks @ 6% (OMC+0.7%)
Resilient Modulus (FBX, Fines content = 6%)
0
10
20
30
40
0 5 10 15 20 25 30 35
Max. Axial stress (PSI)
Resil
ien
t M
od
ulo
us (
KS
I).
pressure 3 psi
pressure 5 psi
pressure 10 psi
pressure 15 psi
pressure 20 psi
Resilient Modulus (FBX, Fines content = 10%)
0
10
20
30
40
0 5 10 15 20 25 30 35
Max. Axial stress (PSI)
Resil
ien
t M
od
ulu
s(K
SI)
pressure 3 psi
pressure 5 psi
pressure 10 psi
pressure 15 psi
pressure 20 psi
5-305-305-255-20OMC+0.7%
10-3015-3010-2010-40OMC
30-8530-7025-7020-60OMC-2%
Juneau
5-255-205-205-25OMC+0.7%
10-2510-4015-3515-35OMC
20-7020-5520-7015-55OMC-2%
Anchorage
5-355-305-305-25OMC+0.7%
15-655-1510-2510-20OMC
15-3520-6515-6015-45OMC-2%
Fairbanks
10%8%6%3.15%
Fines Content
Water ContentMaterial Type
Range of values MR (ksi) Data, 68F MR Model 1
where:
MR = resilient modulus
! = bulk stress
sd = deviator stress
Pa = reference pressure
k1, k2, k3 = regression constants
2 3
1
k k
dR a
a a
M k pp p
!"# $ # $% & ' & '
( ) ( )
May and Witczak (1981):
0
10
20
30
40
50
60
70
0 10 20 30 40 50 60 70
experimental value(KSI)
pre
dic
ted
va
lue
(KS
I)
`
MR Data Fitting (Fairbanks)
2 3
1
k k
dR a
a a
M k pp p
!"# $ # $% & ' & '
( ) ( )
K1= 937
K2= 1.53
K3=-0.9285
R2= 99%
Water content = OMC-2%; Fines content = 6%
MR Data Fitting (Fairbanks)
2 3
1
k k
dR a
a a
M k pp p
!"# $ # $% & ' & '
( ) ( )
K1= 1201
K2= 1.3277
K3=-0.794
R2= 98.6%
Water content = OMC-2%; Fines content = 8%
0
10
20
30
40
50
60
70
0 10 20 30 40 50 60 70
experimental value(KSI)
pre
dic
ted
va
lue
(KS
I)
`
52 of 92

MR Data Fitting (Fairbanks)
Water content = OMC-2%; Fines content = 10%
0
5
10
15
20
25
30
35
0 5 10 15 20 25 30 35
experimental value(KSI)
pre
dic
ted
va
lue
(KS
I)
`
2 3
1
k k
dR a
a a
M k pp p
!"# $ # $% & ' & '
( ) ( )
K1= 1462
K2= 0.2912
K3= 0.06
R2= 85.3%
Work in Progress
- Data analysis for MR Testing:
k1, k2, k3 =
f (source, PI, P200, density, w/c, suction, Temp., …)
- Permanent deformation modeling
- Frost-heave testing
Additional slides!
MR Model 2
where:
MR = resilient modulus
! = bulk stress
Pa = reference pressure
k1, k2 = regression constants
2
1
k
R
a
M kp
"# $% & '
( )
K- ! model (Seed et al.1962):
MR
Data Fitting (Fairbanks)
2
1
k
R
a
M kp
"# $% & '
( )
K1= 27403
K2= 0.562
R2= 75.3%
Water content: OMC-2%; fines content: 6%
0
10
20
30
40
50
60
70
0 10 20 30 40 50 60 70
experimental value(KSI)
pre
dic
ted
va
lue
(KS
I)
`
MR
Data Fitting (Fairbanks)
2
1
k
R
a
M kp
"# $% & '
( )
K1= 31481
K2= 0.5077
R2= 77%
Water content: OMC-2%; fines content: 8%
0
10
20
30
40
50
60
70
0 10 20 30 40 50 60 70
experimental value(KSI)
pre
dic
ted
va
lue
(KS
I)
`
53 of 92

MR
Data Fitting (Fairbanks)
2
1
k
R
a
M kp
"# $% & '
( )
K1= 20305
K2= 0.3523
R2= 87%
Water content: OMC-2%; fines content: 10%
0
5
10
15
20
25
30
35
0 5 10 15 20 25 30 35
experimental value(KSI)
pre
dic
ted
va
lue
(KS
I)
`
MR Results: Anchorage @ 3.3% (OMC-2%)
Resilient Modulus (ANC, Fines content = 6%)
0
10
20
30
40
50
60
70
80
0 5 10 15 20 25 30 35
Max. Axial stress (PSI)
Resil
ien
t M
od
ulo
us (
KS
I).
pressure 3 psi
pressure 5 psi
pressure 10 psi
pressure 15 psi
pressure 20 psi
Resilient Modulus (ANC, Fines content = 10%)
0
10
20
30
40
50
60
70
80
0 5 10 15 20 25 30 35
Max. Axial stress (PSI)
Resilie
nt M
od
ulo
us (
KS
I).
pressure 3 psi
pressure 5 psi
pressure 10 psi
pressure 15 psi
pressure 20 psi
MR Results: Anchorage @ 5.3% (OMC)
Resilient Modulus (Anchorage 6%)
0
5
10
15
20
25
30
35
40
0 5 10 15 20 25 30 35
Max. Axial stress (PSI)
Resil
ien
t M
od
ulo
us (
KS
I)
pressure 3 psi
pressure 5 psi
pressure 10 psi
pressure 15 psi
pressure 20 psi
Resilient Modulus (Anchorage 10%)
0
5
10
15
20
25
30
35
40
0 5 10 15 20 25 30 35
Max. Axial stress (PSI)
Resil
ien
t M
od
ulo
us (
KS
I)
pressure 3 psi
pressure 5 psi
pressure 10 psi
pressure 15 psi
pressure 20 psi
MR Results: Anchorage @ 6% (OMC+0.7%)
Resilient Modulus (ANC, Fines content = 6%)
0
5
10
15
20
25
30
35
40
0 5 10 15 20 25 30 35
Max. Axial stress (PSI)
Resil
ien
t M
od
ulo
us (
KS
I)
pressure 3 psi
pressure 5 psi
pressure 10 psi
pressure 15 psi
pressure 20 psi
Resilient Modulus (ANC, Fines content = 10%)
0
5
10
15
20
25
30
35
40
0 5 10 15 20 25 30 35
Max. Axial stress (PSI)
Resil
ien
t M
od
ulo
us (
KS
I)
pressure 3 psi
pressure 5 psi
pressure 10 psi
pressure 15 psi
pressure 20 psi
MR Results: Juneau @ 3.3% (OMC-2%)
Resilient Modulus (JUN, Fines content = 6%)
0
10
20
30
40
50
60
70
80
0 5 10 15 20 25 30 35
Max. Axial stress (PSI)
Resilie
nt
Mo
du
lou
s (
KS
I)
pressure 3 psi
pressure 5 psi
pressure 10 psi
pressure 15 psi
pressure 20 psi
Resilient Modulus (JUN, Fines content = 10%)
0
10
20
30
40
50
60
70
80
90
100
0 5 10 15 20 25 30 35
Max. Axial stress (PSI)
Resil
ien
t M
od
ulo
us (
KS
I)
pressure 3 psi
pressure 5 psi
pressure 10 psi
pressure 15 psi
pressure 20 psi
MR Results: Juneau @ 5.3% (OMC)
Resilient Modulus (JUN, Fines content = 6%)
0
5
10
15
20
25
30
35
40
0 5 10 15 20 25 30 35
Max. Axial stress (PSI)
Resil
ien
t M
od
ulo
us (
KS
I)
pressure 3 psi
pressure 5 psi
pressure 10 psi
pressure 15 psi
pressure 20 psi
Resilient Modulus (JUN, Fines content = 10%)
0
5
10
15
20
25
30
35
40
0 5 10 15 20 25 30 35
Max. Axial stress (PSI)
Resil
ien
t M
od
ulo
us (
KS
I)
pressure 3 psi
pressure 5 psi
pressure 10 psi
pressure 15 psi
pressure 20 psi
54 of 92

MR Results: Juneau @ 6% (OMC+0.7%)
Resilient Modulus (JUN, Fines content = 6%)
0
5
10
15
20
25
30
35
40
0 5 10 15 20 25 30 35
Max. Axial stress (PSI)
Resil
ien
t M
od
ulo
us (
KS
I)
pressure 3 psi
pressure 5 psi
pressure 10 psi
pressure 15 psi
pressure 20 psi
Resilient Modulus (JUN, Fines content = 10%)
0
5
10
15
20
25
30
35
40
0 5 10 15 20 25 30 35
Max. Axial stress (PSI)
Resil
ien
t M
od
ulo
us (
KS
I)
pressure 3 psi
pressure 5 psi
pressure 10 psi
pressure 15 psi
pressure 20 psi
55 of 92

M-E Concrete Pavement
Design in Illinois
Jeffery Roesler, Ph.D., P.E.Associate Professor
Department of Civil and Environmental Engineering
University of Illinois
North-West MEPDG User’s Group Meeting
Corvallis, OR
March 9-10, 2009
Acknowledgements
! ICT R57 – Technical Review Panel (2005-08)
" Illinois Department of Transportation
! Amy Schutzbach et al.
! UIUC Students
" Jake Hiller, Dong Wang, Victor Cervantes
" Matt Beyer, Amanda Bordelon! Bordelon, A., Roesler, J.R., and Hiller, J.E., Mechanistic-Empirical Design Concepts
for Jointed Plain Concrete Pavements in Illinois, Final Report for Illinois Center for
Transportation, University of Illinois, Urbana, IL, March 2009, 252 pp.
! Beyer, M. and Roesler, J.R., Mechanistic-Empirical Design Concepts for Continuously
Reinforced Concrete Pavements in Illinois, Final Report, Illinois Center for
Transportation, University of Illinois, Urbana, IL, March 2009, 80 pp.
Outline
• Existing IDOT Design methods
# JPCP and CRCP
• M-EPDG Evaluation
• Traffic
• Proposed JPCP/CRCP design
• Recommendations
Example, IDOT JPCP design curve Subgrade = Fair
IDOT M-E JPCP Curves (1992)
! k=50, 100, or 200 psi
! Flexural Strength = 750 psi
! D-bar = 18 inch
! Slab length = 15ft w/dowels
! ESALs: 1 to 60 million
! Temperature Curling
! Shoulder type (tied, asphalt, widen)
! Zero-Maintenance Fatigue Equation
! 95% Reliability
M-EPDG for Illinois DOT?
IDOT has M-E flexible and rigid pavement design guide
since 1989.
" Approved method by IDOT
" IDOT has confidence in JPCP
" Fundamental principles similar to M-EPDG
! M-EPDG makes it difficult to make future
changes/refinement to JPCP or CRCP design method
" Limits further independent design research
" No ability to check the models and coding of the M-EPDG
" IDOT can easily update their own code
2006
56 of 92

M-EPDG, con’t
! M-EPDG sensitivity checks
" Load spectra vs. ESALs
" Climate vs. joint spacing limit
! M-EPDG is very good for states w/o M-E
experience
Illinois DOT Traffic Questions
! How does load spectra variations for Illinois
conditions affect thickness design of concrete
pavement?
! Is load spectra necessary over ESALs?
" For IDOT, expensive to collect load spectra
IL Weigh Station Data
Marion (NB & SB)
Pesotum (NB)
Bolingbrook (NB & SB)Frankfort (EB)
Moline (EB & WB)
Maryville (WB)
WIM
Vehicle Class Distribution
0.10.61.20.10.00.20.10.30.013
1.20.00.00.00.00.00.00.00.012
1.84.93.34.12.62.41.22.93.511
0.31.21.10.70.70.81.51.00.910
84.384.385.985.984.084.085.285.290.490.488.888.887.587.580.180.179.079.099
2.72.33.74.12.22.63.06.26.78
0.00.00.00.00.00.00.00.00.07
1.02.12.82.41.82.91.44.03.76
6.71.82.72.41.11.31.54.04.65
1.81.01.11.11.10.93.71.61.64
Pesotum
(NB)
Maryville
(WB)
Marion
(SB)
Marion
(NB)
Moline
(WB)
Moline
(EB)
Frankfort
(EB)
Bolingbrook
(SB)
Bolingbrook
(NB)
Vehicle
Class
Vehicle Class distribution
Class Illinois* California M-EPDG
Class 4 1.4% 1.1% 1.3%
Class 5 3.8% 23.0% 8.5%
Class 6 2.3% 5.2% 2.8%
Class 7 0.0% 0.3% 0.3%
Class 8 3.8% 6.7% 7.6%
Class 9 84.4% 50.6% 74%
Class 10 0.5% 0.6% 1.2%
Class 11 2.8% 8.8% 3.4%
Class 12 0.3% 1.1% 0.6%
Class 13 0.3% 0.1% 0.3%
TTC1
j6
57 of 92

Slide 12
j6 add california distribution here.jroesler, 7/23/2007
Comparison - Axle Weight DistributionClass 9 Tandem Axle Weight Distribution
0
2
4
6
8
10
12
14
6000
1000
0
1400
0
1800
0
2200
0
2600
0
3000
0
3400
0
3800
0
4200
0
4600
0
5000
0
5400
0
Axle Weight (lbs)
Fre
qu
en
cy (
%)
ME-PDG
Bolingbrook N
Mation S
Marion N
Moline W
Pesotum
M-EPDG (v.1.0) Inputs Assumptions
! 20-year design
! Slab thickness = 10-inch
! 4” Asphalt Concrete Base (PG64-22)
! A-7-6 soil (13,000 psi)
! Joint spacing = 15 ft (1.5” dowels @ 12in. c-c)
! AC shoulder
! MOR = 650 psi
! 95% reliability & 20% slab cracking @ failure
-Use site specific vehicle and axle load distributions
AADTT vs. ESALs
! Higher AADTT to reach same ESAL count
! Illinois has lighter axle weight distribution
0
5000
10000
15000
20000
25000
ME-PDG Bolingbrook Marion S Marion N Moline
AA
DT
T
0
20
40
60
80
100
120
140
ES
AL
s
(mil
lio
n)
ADDTT
ESALs
Traffic and Climate Effect on Slab
Cracking Level = 80x106 ESALs
0
5
10
15
20
25
Marion S
B
(Carb
ondale
)
Bolin
gbro
ok
NB
(A
uro
ra)
Fra
nkfu
rt E
B
(Mid
way)
Molin
e E
B
(Molin
e)
Mary
vill
e W
B
(St Louis
)
Pesotu
m N
B
(Cham
paig
n)
ME
PD
G
TT
C11
(Mid
way)
Traffic Distribution
% C
rackin
g a
t 95%
Relia
bili
ty
Effect of Load Spectra on Slab Cracking
0
2
4
6
8
10
12
14
Bolin
gbro
ok
NB
Fra
nkfu
rt
EB
Mary
vill
e
WB
Marion S
B
Molin
e E
B
Pesotu
m
NB
TT
C11
TT
C1
Traffic Distribution
% C
rackin
g a
t 95%
Relia
bili
ty
70
72
74
76
78
80
82
84
86
88
90
ES
ALs (
mill
ions)
Cracking
ESALs
St. Louis Climate
58 of 92

ESALs versus Load Spectra (MEPDG)
! For the same climate (Aurora, IL)
! Different weigh-scales and WIM sites – similar
thickness for same amount of ESALs
0
50
100
150
200
250
300
350
Bo
ling
bro
ok
NB
Mo
line
EB
Pe
so
tum
NB
TT
C1
TT
C1
1
Traffic Distribution
Allo
wa
ble
ES
AL
s (
mill
ion
s)
10 inch
9.5 inch
9 inch
Climate Effect, M-EPDG
! Same traffic distribution (MEPDG TTC11) and
same ESALs/AADTT
! No clear trend in climatic zones throughout IL
0
2
4
6
8
10
12
14
16
18
Ch
am
pa
ign
Ca
rbo
nd
ale
Ro
ck
ford
Mid
wa
y
Au
rora
Pe
ori
a
St
Lo
uis
Mo
line
De
ca
tur
Climate
% C
rac
kin
g a
t 9
5%
Re
liab
ility
Proposed JPCP Design - Overview
! Stress Calculations
" Westergaard
" Adjustment Factors
! Fatigue Models
! Failure Criteria - Slab Cracking
! Same approach as ILLICON (Barenberg 1994)
Stress Calculation
! Westergaard edge stress
! Factors:
" f1 Slab Geometry
" f2 Bonded/Unbonded Base
" f3 Shoulder Type
! Temperature curling stress
! Superposition correction factor, R
curlwesttotal Rfff !!! **** 321 "#
Equations from Salsilli (1991)
Westergaard Stress
)]/)(21(18.12
1
3
484.1
100[ln
)3(
)1(34
3
2la
ka
Eh
h
Pwest $
$$$%$
! ""&
"&""
"#
25.0
2
3
)1(12 ''(
)**+
,
&#
k
Ehl
$
S
aeq = Equivalent Radius of Load,
P = Equivalent Load
Equations from Salsilli (1991)
]001.0034664.0301805.0
000436.0045229.0017881.0
103946.0339485.0909.0[
3223
322
'(
)*+
,'(
)*+
,"'(
)*+
,'(
)*+
,"'(
)*+
,'(
)*+
,&
'(
)*+
,"'(
)*+
,'(
)*+
,&'(
)*+
,&
'(
)*+
,"'(
)*+
,"#
l
a
a
S
l
a
a
S
l
a
a
S
a
S
l
a
a
S
a
S
l
a
a
Saaeq
Slab Geometry Factor
! Infinite slab assumed for L/l > 5
! Equation only valid for L/l > 3 – corresponds to joint
spacing L of approximately 10 ft or more
]
[
'(
)*+
,''(
)**+
,"
'(
)*+
,&'(
)*+
,"''(
)**+
,&#
l
L
l
a.
l
L.
l
L.
l
a..f
eq
eq
1090510
0198240181706053307805822820
2
1
Equations from Salsilli (1991)
59 of 92

alpha
betaNeutral Axis
h2
h
Bonded/Unbonded Base
Equations from Ioannides et al. (1992)
31
223
23
/
effEh
hEhhh -.
/01
2"#
][ )/l!)(a(.!!
.ka
Ehln
!)h"(
!)P(# effeq
eq
eff
eff
eff 211812
1
3
4841
1003
134
3
2""
&"&"
"
"#
eff
u,eff
u,h
h!! #1
effeff
b, h
NAh!!
2
1
&#
! Unbonded
! Bonded3123 12 /
f )beta*h*h(h "#
3122
3
22 12 /f )alpha*h*h(h "#
Shoulder Type
! Asphalt Shoulder
! Widen Lane
" Based on RadiCAL – widen lane case no thinner
than tied shoulder
! Tied Concrete Shoulder
" Load Transfer Efficiency
! How to define LTE across shoulder?
][
32
3 0538910245650386201001321104541470 ''(
)**+
,"''
(
)**+
,&''
(
)**+
,"'
(
)*+
,"#D
a.
D
a.
D
a.
D
l..f
eqeqeq
w
''(
)**+
,#
l
a,
kl
AGGfuncf
eq
T3
Hiller (2007)
Load Transfer Efficiency
! Currently new design
assumes 10 ft concrete
shoulder is tied with
an LTE as user input
! Suggested LTE
levels?
" Monolithic shoulder
70% LTE
" Construction joint or
separated shoulder
40% LTE
8490
1
0120
0101 .
.
.
&
----
.
/
0000
1
2&
# LTE
kl
AGG
Ioannides and Korovesis (1990)
Temperature Curling Stress
! Curling Stress
! R factor for superposition
" Many equations available and included in design
spreadsheet
" After comparison to ILLI-SLAB (1994), ILIJOINT
equation which was originally used is still recommended
Equations from Salsilli (1991)
2
TCEcurl
3#
4!
510*TDT 3# 4
Temperature Determination
! Temperature Distribution or
! Equivalent Temperature Gradient
" 1.65 °F/in at 35% timeFrequency Analysis - Champaign 12" PCC (fall)
0.0%
2.0%
4.0%
6.0%
8.0%
10.0%
12.0%
14.0%
16.0%
18.0%
! -30 -30 to
-27.5
-27.5
to -25
-25 to
-22.5
-22.5
to -20
-20 to
-17.5
-17.5
to -15
-15 to
-12.5
-12.5
to -10
-10 to
-7.5
-7.5
to -5
-5 to
-2.5
-2.5
to 0
0 to
2.5
2.5 to
5
5 to
7.5
7.5 to
10
10 to
12.5
12.5
to 15
15 to
17.5
17.5
to 20
20 to
22.5
22.5
to 25
25 to
27.5
27.5
to 30
> 30
!T (°F)
% T
ime a
t !
T
Fatigue Equations
! Zero Maintenance
Darter (1977)
! ACPA
" Includes reliability R
" laboratory concrete
beams
Titus-Glover et al. 2005;
Riley et al. (2005)
! MEPDG
ARA (2007)
SRN *61.1767.17log &#
217.024.10
0112.0
*)log(log -
.
/01
2&#
& RSRN
22.1*2log &# SRN
5.0
)1(1* crPR
R5&
&#
MORSR total!
#
60 of 92

Equivalent Damage Ratio (EDR)
Zollinger and Barenberg (1989)
Wander Factor
Percent Slab Cracking Models
! Zero-Maintenance
! MEPDG
! ACPA (Input Pcr)
" Failure is determined when the fatigue damage = 1.0
98.1
%50
1
1&"
#FD
Pcr
99.2)3116.5(
*64.1
3903.0%50
%50%95
"#
"#
cr
crcr
PSe
SePP
6 78 9LogFD
crP &"# 5.44*00000421.01.01%50
6 78 9LogFD
crP &"# 6.32*00000235.01.01%95
Equations from IDOT JPCP Curve Reliability (1991) and ARA (2007)
Fatigue Limit
! New design does not include stress for
erosion
! Failure at
" 100% slab cracking (95% reliability) at TF=3
" 20% slab cracking (95% Reliability) at TF!10
" Fatigue Damage = 1.0 for ACPA
Inputs
750psiModulus of rupture – mean flexural strength
from 3rd-point bending at 90 days
MOR
18in.Offset distance between outer face of the
wheel and the slab edge
D
15 (L/l > 3)ftSlab lengthL
12in.Spacing between dual tiresS
0 to 24in.Base Layer Thicknessh2
50, 100, 200pciModulus of Subgrade Reactionk
4,600 ksiksiConcrete Elastic ModulusE
variablein.Concrete Thicknessh
<100 million ESALs-Cumulative Equivalent Single Axle LoadsESALs
Typical ValueUnitDescriptionSymbol
JPCP Spreadsheet Demo
Allowable ESALs
Allowed
Stress RatioEquivalent Damage Ratio
Westergaard Edge
StressSlab Size Effect 3 Layers Effect Shoulder Type Effect Total Edge Stress
Temperature Curling
Impact
Temperature Curling
StressTotal Stress
N SR EDR # west f 1 f 2 f 3 # e =# west *f 1 *f 2 *f 3 R # curl # total = # west *f 1*f 2*f 3 +
ACPA - - psi - - - psi ILLIJOINT psi psi
2.36E+13 0.456 0.05 247.26 0.980 0.993 1.000 240.46 1.124 94.22 346.4
with aeq and l with aeq and l with aeq and leff with aeq and l
2P
Geometry
h Trial Concrete Thickness 10 in. Allowed Fatigue Allowed Fatigue Allowable % Cracking Failure
Slab-Base Bonding Condition Unbonded layers based on Daytime Stress conon Zero Gradient co ESALs N Criteria
h 2 Initial Thickness of Base Layer 4 in. Zero-Maintenance 3.75E+09 1.07E+12 1.61E+13 0.000 2.2 20 pass
Shoulder Type Asphalt Shoulder ACPA 2.63E+05 1.57E+12 2.36E+13 4.526 20 - fail
L Slab Length 15 feet MEPDG 1.61E+05 1.35E+08 2.02E+09 7.410 155.2 20 fail
L Slab Length 180 in. Load and Temp stress Load stress only combined day/nighttime
D Widen Lane Extension 2 feet
W Lane width 12 feet blue numbers are user inputs
Traffic Loads orange numbers denote value not used
Single Axle Load 18,000 lb black numbers are computed
Tire Pressure 120 psi
P Single Tire Load 4500 lb
a Radius of Applied Load 3.455 in.
S Spacing Between Dual Tires 12 in.
18 in.
Material Properties
E Elastic Modulus of the Concrete 4,600,000 psi Check for Errors
u Poisson's Ratio 0.15 - a/l = PASS
MOR 759 psi L/l = PASS
E 2 Elastic Modulus of the Base Layer 600,000 psi W/l = PASS
k Modulus of Subgrade Reaction (k-value) 100 pci DT = PASS
k s Static k-value 100 pci D G = PASS
LTE Shoulder Load Transfer Efficiency 70.0 % D P = PASS
AGG Shoulder Aggregate Interlock Factor 1.50E+04 psi 78.07%, 100 ksi
AGG/kl Non-dimensional Shoulder Stiffness 3.36
Climate Factors
CTE Coefficient of Thermal Expansion 5.5E-06 in./in./°F
Temperature Determination MethodEffective Temperature
Gradient
Slab Positive Temperature Gradient 1.65 °F/in. Current IDOT procedure has 1.65 °F/in. for 25% for daytime positve gradient
Percent Time for Temperature Gradient 25%
Unit weight of concrete 0.087 pci
DG dimensionless parameter of the relative defle 4.383 - (using ks and ls)
DP dimensionless parameter of the deflection 22.950 - (using 2P, ks, and ls)
!T Temperature Differential 16.5 °F
DT Temperature 9.08 -
Reliability for ACPA
R' Reliability 95%
P cr Percent Cracking 20% Salsilli damage equation assumes 50% cracking
R* Effective Reliability 98%
Mean Modulus of Rupture, Flexural
Strength at 90 days by 3rd-Point Bending
TRAFFIC
Mean Wander Distance from Edge
STRESSES
Design ESALs
INPUTS
Fatigue Damage
Ratio
9.54E+07
n
-
FATIGUE
Percent Cracking (%) -
95% Reliability
S
74140612
939061
2255
153
153
300050
..
..
.
/
/
./.
P
G
D
D
DT
lW
lL
la
5
2
25
4101121 0 *)(*
Eh
P
kl
P hD P !"##5
2
2
10*kl
hD G #
D
Design ChartsSSR poor (k=50 pci)
6
7
8
9
10
11
12
13
14
1 10 100
Traffic Factor (million ESALs)
Co
ncre
te T
hic
kn
ess (
inch
es)
Current IDOT - AC
Current IDOT - Tied or Widen
New Design - AC
New Design - Tied or Widen
61 of 92

Design ChartsSSR fair (k=100 pci)
6
7
8
9
10
11
12
13
14
1 10 100
Traffic Factor (million ESALs)
Concre
te T
hic
kness (
inches)
Current IDOT - AC
Current IDOT - Tied or Widen
New Design - AC
New Design - Tied or Widen
Joint Spacing
6
7
8
9
10
11
12
13
14
1 10 100
Traffic Factor (million ESALs)
Co
ncre
te T
hic
kn
ess (
inch
es)
20 ft Joints
18 ft Joints
Current IDOT (15 ft )
15 ft Joints
12 ft Joints
Reliability
6
7
8
9
10
11
12
13
14
1 10 100
Traffic Factor (million ESALs)
Concre
te T
hic
kness (
inches)
Current IDOT
95% Reliability
90% Reliability
80% Reliability
Summary
! Spreadsheet-based JPCP design method
! No need for site specific climate or load spectra
! New concrete fatigue algorithm w/ reliability
! No calibrated damage model required
Summary of Proposed M-E Design for
JPCP in Illinois
! Single climatic zone
! Fatigue algorithm –
" ACPA with 95% reliability and 20% cracking for TF>10
! Assume unbonded interface condition
! Widen lane no thinner than Tied shoulder (based on
RadiCAL)
! MOR used in design = 750 psi (based on mean
design strengths used in field)
What is not included in JPCP?
! Calibration / Verification
" Video surveys
" Calibration of cracking model to MEPDG data or
IDOT projects
! Erosion stress analysis (after Zollinger &
Barenberg)
62 of 92

Continuously Reinforced Concrete
Pavements (CRCP)
Illinois CRCP Thickness Determination
! Currently using IL-Modified AASHTO
! In use since 1970’s
! Performance indicates design is conservative
5 Million ESAL’s
Soil CBR or “k”
Soil CBR = 3.0
“k” = 100
100 ft Jointed = 10in.
CRCP = 8in.
CRCP 80% of Jointed
Typical Illinois CRCP Thickness Design
10012 in.
300+14 in. (max)
2010 in.
58 in.
ESAL, MillionsThickness
Proposed CRCP Design
! Use framework of M-EPDG
! Simplify and implement into a spreadsheet
" ESALs
" Single Climate
" Delete some internal M-EPDG models
" Calibrate for Illinois CRCP sections
CRCP Inputs
! Pavement thickness
! Design life
" percent steel, bar size, depth to steel
! Climatic data (seasonal)
" temperature gradients through pavement, temperature at
steel depth, ambient temperature
! Shoulder type
" tied PCC, asphalt, gravel
! Design ESALs
63 of 92

CRCP Inputs
! Concrete properties
" modulus, COTE, strength, ultimate shrinkage,
cementitious content
! Base/subgrade properties
" modulus, thickness, type, k-value # unbonded case
! Construction season
" spring, summer, fall, winter
! Fatigue equation
" MEPDG, IDOT
CRCP Design Process
1. Environmental Effects
! Climatic data for Champaign, IL
" Pavement thickness = 8”, 10”, 12” 14”
2
TEC
CURL
%#
&'
( )CURLLOADTOT
R''' *#+
R=1.0 for now
CRCP Design Procedure
Frequency Analysis - Champaign 12" PCC (fall)
0.0%
2.0%
4.0%
6.0%
8.0%
10.0%
12.0%
14.0%
16.0%
18.0%
! -30 -30 to
-27.5
-27.5
to -25
-25 to
-22.5
-22.5
to -20
-20 to
-17.5
-17.5
to -15
-15 to
-12.5
-12.5
to -10
-10 to
-7.5
-7.5
to -5
-5 to
-2.5
-2.5
to 0
0 to
2.5
2.5 to
5
5 to
7.5
7.5 to
10
10 to
12.5
12.5
to 15
15 to
17.5
17.5
to 20
20 to
22.5
22.5
to 25
25 to
27.5
27.5
to 30
> 30
!T (°F)
% T
ime a
t !
T
CRCP Design Procedure
2. Mean Crack Spacing
b
bm
PCC
t
dc
PUf
h
dCf
L
1
028
2
21
*
,,-
.//0
1""
#
'
MEPDG (2007)
CRCP Design Procedure
3. Crack Width
10002 2,,
-
.//0
1"%*#
PCC
steelPCCshrE
fcTLCW '&3
MEPDG (2007)
CRCP Design Procedure
4. LTE across cracks
" Dimensionless shear capacity
" Crack stiffness
! Agg/kl
" Assume no shear capacity loss
( )4 5 ,,-
.//0
1,-
./0
1 ",,-
.//0
1
"""*""#
"100
118.1/)log()(183.0214.0log1
10011*100
1
BASE
ci
c
LTE
RJlaLTE
MEPDG (2007)
64 of 92

CRCP Design Procedure
5. Traffic Stresses
" STT, STB, SLB functions of LTEs, LTE
cCS/RRS
" Cataloged ILLISLAB results
" Calculate stress due to traffic loading, !LOAD
2
1
STBSTT
SLB
STT
STB
SLB
12
CRCP Design Procedure
5. Traffic Stresses
" STT, STB functions of LTEs, LTE
cCS/RRS
" Calculate stress due to traffic loading, !LOAD
72 in.
72 in.
44 in.
100 in.
STB
STT
iL
ISLAB2000 Model
48” 48” 48” 48” 48”
100”
44”
144”
144”
144”
sLTE
jLTE
cLTE
shoulder
passing lane
driving lane
CRCP Design Procedure
6. Damage
" Fatigue equations
! MEPDG: Log N = 2.0(MR/!
TOT)1.22 – 1
! IDOT: Log N = 17.61 - 17.61(!TOT
/MR)
" Damage equation (Seasonal calculation)
1"*#+ i
i
iii D
N
nfD
Equivalent Damage Ratio (EDR)
( )( )( )( )6
6
7
66
8
9
*":
*" ;
*" ;
*"
#
3414.00933.0,98
3064.00965.0,9885
2688.01138.0,8560
2806.01424.0,60
,
iis
iis
iis
iis
iSTT
LLTEIF
LLTEIF
LLTEIF
LLTEIF
EDR
!
!
!
!
( ) 5533.02264.0,
*"# iiiSTB LEDR !
CRCP Design Procedure
7. Punchouts (PO) / mile
a, b, c = calibration constants of 0.02, 1.0x10⁻³², 32386
! 50 Punchout/mile saturation limit
<#
"2*#
m
iDi
iTOTcbaPO
1log
,
1
j5
65 of 92

Slide 59
j5 calibration coefficientsjroesler, 12/17/2008
0
5
10
15
20
25
30
35
40
45
50
1E-09 1E-08 1E-07 1E-06 1E-05
Accumulated Damage
Punchouts/m
i
I-80
I-94 (Edens)
Calibration Curve
ATREL
CRCP Calibration Sections
MEPDG Function
0
5
10
15
20
25
30
35
40
45
50
1E-09 1E-08 1E-07 1E-06 1E-05
Accumulated Damage
Punchouts/m
i
I-80
I-94 (Edens)
Calibration Curve
ATREL
Section Age, yr DamageObserved
PO/mile
Predicted
PO/mileError
I80_EB_137.65 9.04 5.69E-08 1.3 0.21 1.19
I80_EB_137.65 17.04 1.19E-07 4.2 5.33 1.28
I80_EB_137.65 19.04 1.38E-07 3.23 9.29 36.70
I80_EB_137.65 21.04 1.58E-07 10.7 14.76 16.48
I80_EB_143.79 17.04 1.19E-07 7.1 5.33 3.13
I80_EB_143.79 19.04 1.38E-07 15.5 9.29 38.59
I80_EB_151.12 10.04 6.39E-08 0.748 0.35 0.16
I80_EB_152.33 18.04 1.29E-07 6.4 7.11 0.51
I80_EB_152.33 20.04 1.48E-07 11.15 11.84 0.48
I80_EB_152.33 27.04 2.27E-07 33.33 34.13 0.64
I80_WB_137.65 9.04 5.69E-08 1.3 0.21 1.19
I80_WB_137.65 17.04 1.19E-07 6.45 5.33 1.25
I80_WB_137.65 19.04 1.38E-07 11.15 9.29 3.47
I80_WB_137.65 21.04 1.58E-07 23.7 14.76 79.93
I80_WB_137.65 26.04 2.14E-07 27 31.22 17.78
I80_WB_143.79 17.04 1.19E-07 11.34 5.33 36.10
I80_WB_143.79 26.04 2.14E-07 50.88 31.22 386.64
I80_WB_148.39 9.04 5.69E-08 2.26 0.21 4.20
I80_WB_152.33 18.04 1.29E-07 0 7.11 50.59
I80_WB_152.33 20.04 1.48E-07 5.28 11.84 43.07
I80_WB_152.33 22.04 1.68E-07 23.76 17.94 33.91
I80_WB_152.33 27.04 2.27E-07 60 34.13 669.19
I94_edens_ 28.46 14.04 4.59E-08 0 0.08 0.01
I94_edens_ 28.46 22.04 8.26E-08 1 1.11 0.01
I94_edens_ 30.11 14.04 4.59E-08 0 0.08 0.01
I94_edens_ 30.11 22.04 8.26E-08 1 1.11 0.01
I94_edens_ 32.90 14.04 4.59E-08 0 0.08 0.01
I94_edens_ 32.90 22.04 8.26E-08 1 1.11 0.01
ATREL1-10",#5 30 3.06905E-06 50 49.99981653 3.366E-08
ATREL2-10",#6 30 1.27022E-06 50 49.99019357 9.617E-05
ATREL3-10",#7 30 2.68071E-06 50 49.99966228 1.141E-07
ATREL4-14",#7 30 3.71699E-08 0 0.030803108 0.0009488
CRCP Software Design Charts30 year, Kd = 50 psi/in, Reliability=95%
8.5
9.0
9.5
10.0
10.5
11.0
11.5
12.0
12.5
13.0
10 40 70 200
Design ESALs (millions)
Sla
b T
hic
kness (in
ch
Tied PCC (monolithic) Tied PCC (separate) Asphalt/Granular
Design Comparisons
*Both design procedures assume 20 year designs and tied concrete shoulders
*M-E design procedure assumes 95 percent reliability
11.012.510.012.09.511.09.09.0200
11.512.510.512.010.011.09.59.0100
11.512.5 11.012.010.511.010.09.550
New
M-E
IDOTNew
M-E
IDOTNew
M-E
IDOTNew
M-E
IDOT
200704010
Design ESALs (millions)
k-value
(psi/in.)
Summary of New Features
! Proposed CRCP Design Process
" Crack spacing prediction
" Fatigue-based thickness design
! New Equivalent damage ratios
! Top of slab strength reduction factor
66 of 92

CRCP Program Limitations
! Erosion analysis
! Reliability is a Traffic Multiplier of 4 (?)
! Load and temperature stress superposition
" R=1.0
! Widen Lane stresses - none
! Tied shoulder*
( )CURLLOADTOT
R''' *#+
Limitations, con’t
! Calculated stresses are extremely low
" Is this the right approach or are we using the
wrong thickness?
! CRCP = 0.8*JRCP
" No guarantee that CRCP will be thinner
Future Tasks
! Validate CS values with video survey*
! Acquire punchout data from IDOT videos*
! Endurance limit*
! How to define Reliability or confidence level?*
! Erosion effects (Dr. Zollinger)
*Mechanistic-Empirical Design Implementation and Monitoring for Rigid Pavements (ICT R27-61)
-Sponsored by IDOT (2009-2011)
Acknowledgements
The Illinois Center for Transportation (ICT) is
an innovative partnership between the Illinois
Department of Transportation (IDOT) and the
University of Illinois at Urbana-Champaign
(UIUC).
67 of 92

MEPDG RELATED ACTIVITIES
Peter E. Sebaaly
Western Regional Superpave Center
UNIVERSITY OF NEVADA
Two activities
• MEPDG Field sections
• Full Depth Reclamation
3/10/2009 2
MEPDG Field Sections
• Validation Sites for the Asphalt
Research Consortium:
– WRI
– Texas A&M
– UNR
– UWM
– AAT
3/10/2009 3
ARC Validation Sites
• ARC is working on:
– Fatigue
– Moisture damage
– Thermal Cracking
– RAP
– WMA
3/10/2009 4
ARC Validation Sites
• PG Binder
• Superpave Mix Design
• MEPDG Structural Design
One-mile long section or half-day
production
3/10/2009 5
ARC Validation Sites
• ARC will:
– Conduct Materials Characterization
• E* Master Curve
• Fatigue Characteristics
• Rutting Characteristics
• Thermal Cracking
• Moisture Damage
3/10/2009 6
68 of 92

Dynamic Modulus
Time
Str
ess
Str
ain
Time
time shift = !/"
# = #0sin(!t)
$ = $0sin(!t-!)
#0
$0
|E*| = "0/#0
7 3/10/2009 8
0.01
0.1
1
10
1.0E-05 1.0E-03 1.0E-01 1.0E+01 1.0E+03 1.0E+05
Frequency, Hz
E*
, 1
03 k
si
.
Resistance to Permanent Deformation
• Repeated Load triaxial test (RLT)
9
#d = 85 psi
Before After
ARC Validation Sites
• ARC will:
– Conduct MEPDG structural design
– Sample materials during construction
– Evaluate construction mixtures
– Monitor performance until end of 2011
– Develop a long-term monitoring plan
3/10/2009 10
ARC Validation Sites
• Agency gets:
– Implement MEPDG on a pavement
section
– Full characterization of the materials
– At no cost
3/10/2009 11
ARC Validation Sites
• ARC gets:
– Test new concepts
– Validate with field performance
www.arc.unr.edu
Interested:
3/10/2009 12
69 of 92

WHO JOINED
• NV RTC
• SDDOT
• WIDOT
3/10/2009 13
FULL DEPTH RECLAMATION
• SD School of Mines
• SDDOT
• Sebaaly: team member
3/10/2009 14
OBJECTIVES
• Develop a mix design procedures
• Construct test sections/performance
• Measure properties for MEPDG
3/10/2009 15
– Unstabilized
– Mechanically stabilized: add virgin aggregate
– Stabilized FDR with Portland Cement
– Stabilized FDR with Fly Ash
– Stabilized FDR with Asphalt Emulsion with 1% Lime
– Stabilized FDR with Foamed Asphalt with 1-2%
Portland Cement
Types of FDR
– Source of FDR: Poor and Good (SDDOT experience)
– Quality: Dirty and Clean (passing # 200)
– RAP: 0, 25, 50, and 75%
– Virgin Agg.: single source
– Lab-fabricated mixes
Compositions of FDR
FDR Type
Unstabilized Stabilized with PC
(3, 5, 7 %)
Stabilized with
Fly Ash
(10, 12, 15 %)
Stabilized with
Asphalt Emulsion
(3, 4.5, 6 %)+ Lime
Stabilized with
Foamed Asphalt
(2.5, 3, 3.5 %) + PC
-Moisture-density
-Mr and CBR
-Moisture-density
- Comp strength
-Moisture sensitivity
-Moisture-density
- Comp strength
-Moisture sensitivity
-Moisture-Density
-Superpave Gyratory
- Density with
Corelok
-Moisture sensitivity
-Moisture-Density
-Superpave Gyratory
-Density with Corelok
-Moisture sensitivity
70 of 92

• Optimum Moisture Content
• Strength: UC, TS, Mr
• Moisture Sensitivity: • Tube Suction
• AASHTO T-283 w and w/o FT
Mix design Issues
• What works and what does not
• What criteria to implement
• Repeatability and reliability
• Does the measurement make
engineering sense
Mix Design Issues
FDR + PC and FA
• PC: 3, 5, 7 %
• FA: 10, 12, 15 %
• Dry UC: 300 – 500 psi
• Coeff. of Variation: < 20%
• Tube Suction: max. 9.0
3/10/2009 21
Proctor Compactor
3/10/2009 22
FDR + PC
3/10/2009 23
FDR + PC
3/10/2009 24
71 of 92

UC Test
3/10/2009 25
FDR + PC and FA
Material OPT PC (%) UC (psi) OPT FA (%) UC (psi)
GC-25% 5 283 12 895
GC-50% 7 407 12 362
GC-75% 7 409 12 335
GD-25% 3 352 10 579
GD-50% 5 413 10 412
GD-75% 7 374 12 330
3/10/2009 26
FDR + PC and FA
Material OPT PC (%) UC (psi) OPT FA (%) UC (psi)
PC-25% 3 295 10 558
PC-50% 5 379 12 404
PC-75% 5 256 12 327
PD-25% 3 454 15 170
PD-50% 3 421 15 159
PD-75% 5 409 15 63
3/10/2009 27
FDR + Emulsion and Foamed
• Emulsion: 3.0, 4.5, 6.0 %
• Foamed: 2.5, 3.0, 3.5 %
• Dry TS (77F): > 30 psi
• Coeff. of Variation: < 20%
• TS Ratio: > 70%
3/10/2009 28
FDR + Emulsion + Lime
3/10/2009 29
FDR + Emulsion + Lime
3/10/2009 30
72 of 92

FDR + Emulsion + Lime
3/10/2009 31
Gyratory Compactor
3/10/2009 32
SGC Slotted Mold
3/10/2009 33
Compacted Sample
3/10/2009 34
FDR + Emulsion and Lime
Material Emulsion
(%)
Dry TS, 77F
(psi)
Emulsion +
1% HL (%)
Dry TS, 77F
(psi)
GC-25%
GC-50%
GC-75%
GD-25% 4.5 47 4.5 45
GD-50% 4.5 47 4.5 37
GD-75% 4.5 46 4.5 44
3/10/2009 35
FDR + Emulsion and Lime
Material Emulsion
(%)
Dry TS, 77F
(psi)
Emulsion +
1% HL (%)
Dry TS, 77F
(psi)
PC-25%
PC-50%
PC-75%
PD-25% 4.5 30 4.5 22
PD-50% 4.5 50 4.5 38
PD-75% 4.5 51 4.5 34
3/10/2009 36
73 of 92

Foaming Machine
3/10/2009 37
Foamed FDR
3/10/2009 38
FDR + Foamed and PC
Material Foamed +
1% PC (%)
Dry TS, 77F
(%)
Foamed +
2% PC (%)
Dry TS, 77F
(%)
GC-25% 3.5 33 3.0 53
GC-50% 3.5 30 3.0 51
GC-75% 3.5 39 3.0 58
GD-25% 3.5 45 3.0 56
GD-50% 3.5 44
GD-75% 3.5 51
3/10/2009 39
FDR + Foamed and PC
Material Foamed +
1% PC (%)
Dry TS, 77F
(%)
Foamed +
2% PC (%)
Dry TS, 77F
(%)
PC-25% 3.5 54 3.0 46
PC-50% 3.5 53 3.0 47
PC-75% 3.5 48 3.0 56
PD-25% 3.0 43 3.0 43
PD-50% 3.0 48
PD-75% 3.0 55
3/10/2009 40
Tests to Be Evaluated
Resilient
Modulus
Repeated
Loading
Triaxial
Unconfined
Compression
Modulus
of
Rupture
Dynamic
Modulus
Unstabilized X X
Cement
Stabilized X X
X
Fly Ash
Stabilized X X
X
Emulsion
Stabilized X X
Foamed
Asphalt
Stabilized
X X
Dynamic Modulus
Time
Str
ess
Str
ain
Time
time shift = !/"
# = #0sin(!t)
$ = $0sin(!t-!)
#0
$0
|E*| = "0/#0
42
74 of 92

3/10/2009 43
0.01
0.1
1
10
1.0E-05 1.0E-03 1.0E-01 1.0E+01 1.0E+03 1.0E+05
Frequency, Hz
E*
, 1
03 k
si
.
Resistance to Permanent Deformation
• Repeated Load triaxial test (RLT)
44
#d = 85 psi
Before After
75 of 92

Mechanistic-Empirical Pavement Design: Materials
Testing of Resilient and Dynamic Modulus
Lance A. Roberts, Ph.D., P.E.
Assistant Professor
South Dakota School of Mines and Technology
Rapid City, South Dakota
Presented at:
North-West MEPDG User Group Meeting
Oregon State University
Corvallis, Oregon
March 9-10, 2009
Scope/Objectives of Research Project
• Obtain resilient modulus (Mr) and dynamic modulus values
of construction materials through test performed using a
Simple Performance Tester (SPT). The HMA and soil
materials would be those that are typically used in South
Dakota.
• Develop a Mechanistic-Empirical pavement design
database for these material properties for use in the M-E
design process (i.e. design software).
• Gain an assessment on the possible need for acquisition of
an SPT machine and other laboratory testing equipment by
the SDDOT.
This presentation will focus on the resilient modulus testing of the base and subgrade materials.
Resilient Modulus Testing
Base and subgrade material sampling locations.
US-212 and US-281 in South Dakota.
US-281
US-212
Resilient Modulus Testing
where: MR = Resilient Modulus
Pa = Atmospheric pressure (psi)
! = Bulk stress ("1 + "2 + "3)
#oct = Octahedral Shear Stress
k1, k2, k3 = Regression coefficients
The MEPDG utilizes a constitutive model to predict the resilient
modulus of base, subbase, and subgrade materials. The model
recommended by the MEPDG is:
The regression coefficients will be determined based on the results of the resilient modulus testing.
Resilient Modulus Testing – Base Material
• Classification based on sieveanalysis.
• Optimum moisturecontent(OMC) and maximum dry density(MDD) based on modified Proctorcompactiontest.
• Base contains 50% RAP.
1.4256474761738US-212
Base
0.5324415441435US-281
Base
CcCu% Silt & Clay% Sand% Gravel
%
Passing
#200
%
Passing
#40
%
Passing
#10
USCSAASHTO
Sample
Resilient Modulus Testing – Base Material
US-212 Base Material US-281 Base Material
8.2126SW-SM well graded sand with silt and gravelA-1-aUS-212
9.0125GP poorly graded gravel with sandA-1-aUS-281
USCSAASHTO
OMC
(%)
MDD
(lb/ft3)
Classification
Base
Specimen
76 of 92

Resilient Modulus Testing - Base Material
Split mold and vibratory compaction device used for preparation of
samples consisting of granular base materials (Type 1).
Sample assembled in SPT machine and ready for testing.
Resilient Modulus Testing – Base Material
Testing was conducted based on AASHTO T-307.
1004.036.0402015
1002.018.0202014
1001.513.5152013
1003.027.0301512
1001.513.5151511
1001.09.0101510
1003.027.030109
1002.018.020108
1001.09.010107
1001.513.51556
1001.09.01055
1000.54.5554
1000.98.1933
1000.65.4632
1000.32.7331
500-10001.513.515150
# of Load
Applications
Constant
Stress,
0.1"max
(psi)
Cyclic
Stress, "cyclic
(psi)
Max Axial
Stress,
"max
(psi)
Confining
Pressure,
"3(psi)Sequence
Resilient Modulus Testing – Base Material
Results for resilient modulus testing of US-281 base.
Mr versus Test Sequence
Mr versus Bulk Stress
Resilient Modulus Testing – Base Material
Results of regression analysis US-281 base:
k1 = 895
k2 = 0.79
k3 = -0.50
0.00%-17.44%4.43%9.11%CV
0.000.090.0481.46std dev
8.70-0.500.79894.57average
20,7570.998.7-0.460.79909.193
17,4100.998.7-0.600.83806.792
21,7650.998.7-0.440.76967.741
MR
value with
"3=4psi &
"d=30psi
R2
w(%) target =
9 $ 1%k
3k
2k
1Sample
Resilient Modulus Testing – Base Material
Results for resilient modulus testing of US-212 base.
Mr versus Test Sequence
Mr versus Bulk Stress
Resilient Modulus Testing – Base Material
Results of regression analysis US-212 base:
k1 = 1330
k2 = 0.64
k3 = -0.45
5.05%-13.79%4.09%2.83%CV
0.430.060.0337.69std dev
8.52-0.450.641331.43average
27,6680.998.3-0.370.621340.424
25,3040.998.3-0.500.671276.063
27,1220.988.3-0.420.621359.002
26,7010.999.16-0.490.661350.241
MR
value with
"3=4psi &
"d=20psi
R2
w(%) target =
8.2 $ 1%k
3k
2k
1Sample
77 of 92

Resilient Modulus Testing – Subgrade Material
• Classification based on sieve analysis and Atterberglimits.
• Optimum moisturecontent(OMC) and maximum dry density(MDD) based on modified Proctorcompactiontest.
64351649097US-212 Subgrade
66304668593US-281 Subgrade
% Silt & Clay% Sand% Gravel% Passing
#200
% Passing
#40
% Passing
#10
USCSAASHTO
Sample
Resilient Modulus Testing – Subgrade Material
US-281 US-212
Liquid Limit Testing of Subgrade Materials
Resilient Modulus Testing – Subgrade Material
US-212 Subgrade Material US-281 Subgrade Material
10.5120.5101525
CL sandy lean
clayA-4US-212
11118211637
CL sandy lean
clayA-6US-281
USCSAASHTO
OMC
(%)
MDD
(lb/ft3)
PI
(%)
PL
(%)
LL
(%)
Classification
Subgrade
Specimen
Resilient Modulus Testing – Subgrade Material
Static compaction device used for preparation of samples consisting of
clay subgrade materials (Type 2)
Sample assembled in SPT machine and ready for testing.
Resilient Modulus Testing – Subgrade Material
Testing was conducted based on AASHTO T-307.
1001.09.010215
1000.87.28214
1000.65.46213
1000.43.64212
1000.21.82211
1001.09.010410
1000.87.2849
1000.65.4648
1000.43.6447
1000.21.8246
1001.09.01065
1000.87.2864
1000.65.4663
1000.43.6462
1000.21.8261
500-10000.43.6460
# of Load
Applications
Constant
Stress,
0.1"max
(psi)
Cyclic
Stress,
"cyclic
(psi)
Max
Axial
Stress,
"max
(psi)
Confining
Pressure,
"3(psi)Sequence
Resilient Modulus Testing – Subgrade Material
Results for resilient modulus testing of US-281 subgrade.
Mr versus Test Sequence
Mr versus Bulk Stress
78 of 92

Resilient Modulus Testing – Subgrade Material
Results of regression analysis US-281 subgrade:
k1 = 1918
k2 = 0.68
k3 = -0.68
0.52%-41.53%17.09%1.88%CV
0.060.280.1236.01std dev
11.03-0.680.681918.37average
21,2200.9311.0-0.430.581946.903
19,1610.9711.0-0.630.661877.902
17,4480.9711.1-0.990.811930.301
MR
value with
"3=2psi & "
d=6psi
R2
w(%) target =
11 ± 0.5%k
3k
2k
1Sample
Resilient Modulus Testing – Subgrade Material
Results for resilient modulus testing of US-212 subgrade.
Mr versus Test Sequence
Mr versus Bulk Stress
Resilient Modulus Testing – Subgrade Material
Results of regression analysis US-212 subgrade:
k1 = 1926
k2 = 0.42
k3 = -0.50
3.36%-18.78%7.14%1.45%CV
0.350.090.0327.93std dev
10.30-0.500.421926.33average
21,6250.8710.7-0.610.391903.303
22,6910.9010.1-0.430.421957.402
21,8280.8810.1-0.470.451918.301
MR
value with
"3=2psi & "
d=6psi
R2
w(%) target =
10.5 ± 0.5%k
3k
2k
1Sample
THANK YOU.
QUESTIONS?
79 of 92

Non-Standard Materials
Characterization
NW-MEPDG User Group Meeting
Corvallis, 10-Mar-09
Steve Saboundjian, P.E.
State Pavement Engineer
Alaska DOT&PF
Characterizationof
Asphalt Treated Base CourseMaterial
- Research work by UAF (Dr. Jenny Lu et al.)
- Funding by AUTC and ADOT&PF
Project Scope
To determine stiffness, fatigue, and permanent
deformation characteristics
Experimental design
• 3 base course materials (D-1): 3 AK Regions
• ATB: PG 52-28 neat asphalt binder
• EATB: CSS-1 emulsion
• FASBC: foamed-asphalt
• 3 Temperatures: -10, 0, 20oC
• 3 Stabilizer contents
Laboratory tests
• Flexural Fatigue
• Resilient Modulus
Asphalt-Treated Base
• SGC compaction
• Target air voids = 6%
• Coring and trimming specimen
• Final specimen size: 4” x 6”
Resilient Modulus (MR) Testing
AASHTO T307 mod
Northern Region ATB results:
• Binder content: 2.5 , 3.5 , 4.5%
• Temperature: -10, 0, 20oC
• 3 replicates
Modeling
dkk
R eSkM!32
31"
where:
MR
= resilient modulus
S3
= confining pressure
sd
= deviator stress
k1, k
2, k
3= regression constants
80 of 92

Northern Region ATB
dkk
R eSkM!32
31"
K1=569.5
K2=0.1127
K3=-0.0004
R2=0.96
MR of ATB
( 2.5% Binder,Northern Region, 20 oC)
600
650
700
750
800
850
0 10 20 30 40 50 60 70
Deviator Stress (psi)
MR (
ksi)
confining 3 psi
confining 5 psi
confining 10 psi
confining 15 psi
confining 20 psi
Northern Region ATB
dkk
R eSkM!32
31"
K1=248.3
K2=0.2097
K3=0.0023
R2=0.96
MR of ATB
( 3.5% Binder,Northern Region, 20 oC)
200
250
300
350
400
450
500
550
0 10 20 30 40 50 60 70
Deviator Stress (psi)
MR (
ksi)
confining 3 psi
confining 5 psi
confining 10 psi
confining 15 psi
confining 20 psi
Northern Region ATB
dkk
R eSkM!32
31"
K1=174.6
K2=0.1290
K3=0.0052
R2=0.95
MR of ATB
( 4.5% Binder,Northern Region, 20 oC)
150
170
190
210
230
250
270
290
310
330
350
0 10 20 30 40 50 60 70
Deviator Stress (psi)
MR (
ksi)
confining 3 psi
confining 5 psi
confining 10 psi
confining 15 psi
confining 20 psi
Northern Region ATB
dkk
R eSkM!32
31"
K1=984.3
K2=0.2391
K3=0.0045
R2=0.78
MR of ATB
( 2.5% Binder,Northern Region, 0 oC)
0
500
1000
1500
2000
2500
0 10 20 30 40 50 60 70
Deviator Stress (psi)
MR (
ksi)
confining 3 psi
confining 5 psi
confining 10 psi
confining 15 psi
confining 20 psi
Northern Region ATB
dkk
R eSkM!32
31"
K1=952.0
K2=0.2214
K3=0.0032
R2=0.93
MR of ATB
( 3.5% Binder,Northern Region, 0 oC)
1000
1200
1400
1600
1800
2000
2200
0 10 20 30 40 50 60 70
Deviator Stress (psi)
MR (
ksi)
confining 3 psi
confining 5 psi
confining 10 psi
confining 15 psi
confining 20 psi
Northern Region ATB
dkk
R eSkM!32
31"
K1=614.2
K2=0.1899
K3=0.0064
R2=0.95
MR of ATB
( 4.5% Binder,Northern Region, 0 oC)
600
700
800
900
1000
1100
1200
1300
1400
1500
0 10 20 30 40 50 60 70
Deviator Stress (psi)
MR (
ksi)
confining 3 psi
confining 5 psi
confining 10 psi
confining 15 psi
confining 20 psi
81 of 92

Work in Progress
- Data analysis for MR
Testing:
k1, k
2, k
3= f (source, ac%, Temperature, …)
- Permanent deformation modeling
- MR
testing of CR, SE regions ATB at:
3 Temperatures
3 Binder contents
- Fabrication of foamed-asphalt MR
specimens
Foamed-asphalt specimen fabrication
82 of 92

Session 3Session 3——Technical IssuesTechnical Issues
SMA, OGFC, PMA, & Rubber SMA, OGFC, PMA, & Rubber Modified SurfacesModified Surfaces
Northwest MEPDG User GroupNorthwest MEPDG User Group
Corvallis, ORCorvallis, OR
March 9, 2009March 9, 2009
Harold L. Von Quintus, P.E.
2
Expanding the Realm of Possibility
Outline/QuestionsOutline/Questions
1. Material Testing & Characterization.
2. Impact of Surface Layer on Predicted
Distress.
3. MEPDG Simulation of Beneficial Effect.
Open-Graded Gap-Graded, SMA Well-Graded, Fine
3
Expanding the Realm of Possibility
MEPDGMEPDG –– Design Applicability Design Applicability
to Surface Mixturesto Surface Mixtures
! How do we characterize
these wearing surface
mixtures using the current
design method; 1993
AASHTO Design Guide?
" Different layer coefficient?
" Combine with other layers?
4
Expanding the Realm of Possibility
Do these mixtures perform better Do these mixtures perform better
than conventional densethan conventional dense--gradedgraded
HMA wearing surfaces; whatHMA wearing surfaces; what’’s the s the
benefit?benefit?
5
Expanding the Realm of Possibility
Performance IssuesPerformance Issues
Key DistressBetter
Performance?Wearing Surface
RavelingLocation
SpecificOGFC
Same as HMA
& Raveling
Location
Specific
Rubber Modified
Surface
Same as HMAYesPMA
Same as HMAYesSMA
6
Expanding the Realm of Possibility
Reduced levels of Distress;Reduced levels of Distress;
So how should they be simulated So how should they be simulated
in the MEPDG?in the MEPDG?
(Input Levels 1, 2, or 3)(Input Levels 1, 2, or 3)
83 of 92

7
Expanding the Realm of Possibility
MEPDG Inputs for HMA MixturesMEPDG Inputs for HMA Mixtures
! Air voids @ construction
! Effective asphalt content
by volume
! Gradation
! Density
! Asphalt grade
! Asphalt properties
! Indirect tensile strength
! Creep compliance
! Dynamic modulus
! Poisson’s ratio
! Absorptivity
8
Expanding the Realm of Possibility
MEPDGMEPDG –– Applicability of Test Applicability of Test
Methods to Thin LayersMethods to Thin Layers
! Should (or can) these materials be tested
in the laboratory & field?
9
Expanding the Realm of Possibility
ExampleExample
! Is there a difference in
the distress predictions
between the use of
these thin layers using
version 1.0?
" Well-graded, fine mix
" Gap-graded, SMA mix
" OGFC, open-graded mix
10
Expanding the Realm of Possibility
0
1
2
3
4
5
6
7
8
9
10
0 2 4 6 8 10 12
Age, years
All
igato
r C
rackin
g,
% T
ota
l
Lan
e A
rea
Well-Graded, Fine OGFC, Open-Graded SMA, Gap-Graded
0
0.1
0.2
0.3
0.4
0.5
0.6
0.7
0 2 4 6 8 10 12
Age, years
Ru
t D
ep
th,
inch
es
Well-Graded, Fine OGFC, Open-Graded SMA, Gap-Graded
0
500
1000
1500
2000
2500
0 2 4 6 8 10 12
Age, years
Tra
nsvers
e C
rackin
g,
ft./
mi.
Well-Graded, Fine OGFC, Open-Graded SMA, Gap-Graded
0
2000
4000
6000
8000
10000
12000
0 2 4 6 8 10 12
Age, years
Lo
ng
itu
din
al
Cra
ckin
g,
ft./
mi.
Well-Graded, Fine OGFC, Open-Graded SMA, Gap-Graded
11
Expanding the Realm of Possibility
50
60
70
80
90
100
110
120
130
140
0 2 4 6 8 10 12
Age, years
IRI,
in
./m
i.
Well-Graded, Fine OGFC, Open-Graded SMA, Gap-Graded
12
Expanding the Realm of Possibility
MEPDG & Wearing SurfacesMEPDG & Wearing Surfaces
! Rutting—Nil to minor effect.
! Alligator Cracking—Minor effect.
! Longitudinal Cracking—Huge effect.
! Transverse Cracking—Huge effect.
! IRI—Significant effect, because of
transverse & longitudinal cracking
differences.
84 of 92

13
Expanding the Realm of Possibility
! Do these thin wearing surfaces provide
structural benefit or reduce load-related
distresses in terms of structural
response?
May provide less
structural supportNoOGFC
Reduces rutting &
crackingYesRubber Modified Surface
Reduces rutting &
crackingYesSMA
Reduces rutting &
crackingYesPMA
14
Expanding the Realm of Possibility
! How does one consider
these wearing surface
mixtures in the MEPDG to
accurately predict
performance or load
related distresses?
Open-Graded
Friction Course
15
Expanding the Realm of Possibility
“Typical Agency Values” “State/Regional Cal. Values”
Transfer Function
(Statistical or
Empirical Model)
16
Expanding the Realm of Possibility
PMA Mix PMA Mix
CalibrationCalibration
FactorsFactors
! Asphalt Institute
study comparing
PMA and SMA
mixtures to
conventional neat
HMA mixtures.
0.1
1
10
100
0.1 1 10 100
Calibration Coefficient, Kt3, Neat Mixes
Calib
rati
on
Co
eff
icie
nt,
Kt3
,
PM
A M
ixes
0.00001
0.0001
0.001
0.01
0.1
1
0.00001 0.0001 0.001 0.01 0.1 1
Fatigue Calibration Factor, Kf1, Neat Mixes
Fa
tig
ue
Ca
lib
rati
on
Fa
cto
r,
Kf1
, P
MA
Mix
es
-4
-3.5
-3
-2.5
-2
-3.5 -3 -2.5 -2 -1.5
Rutting Calibration Factor, k r1, Neat HMA Mixes
Ru
ttin
g C
ali
bra
tio
n F
ac
tor,
kr1,
PM
A M
ixe
s
17
Expanding the Realm of Possibility
MEPDG & Surface MixturesMEPDG & Surface Mixtures
Options for Simulation:
! Simulate individual
layer; or
! Combine surface
mixture into binder
layer.
Then, determine local
or agency specific
calibration factors.
18
Expanding the Realm of Possibility
Questions!Questions!
85 of 92

Todd Scholz, P.E.
Oregon State University
Todd Scholz, P.E.Todd Scholz, P.E.
Oregon State UniversityOregon State University
Traffic DataTraffic DataTraffic Data
TopicsTopics•• MEPDG InputsMEPDG Inputs
•• Oregon data collection effortsOregon data collection efforts
86 of 92

Aggregate BaseRubblized PCC Base
Pavement InstrumentationPavement Instrumentation
87 of 92

!t1 !t2
WanderWander
88 of 92

0
10
20
30
40
50
7.0
0
7.5
0
8.0
0
8.5
0
9.0
0
9.5
0
10.0
0
Single Tire Width (inches)
Fre
qu
en
cy
0
10
20
30
40
50
60
82.0
84.0
86.0
88.0
90.0
92.0
94.0
Center-to-Center Outer Tire Spacing
(inches)
Fre
qu
en
cy
0
10
20
30
40
50
60
-10 0 10 20 30 40
Offset from Inner Edge of Fogline
(inches)
Fre
qu
en
cy
Mean = 14.2 in.
Std. Dev. = 8.3 in.
89 of 92

!t
Axle Spacing
!t
Wheel Base
ThankThankYou!You!
90 of 92

Traffic Data in MEPDG
-WSDOT
Jianhua Li
Jeff Uhlmeyer
March, 2009
2
Research Approach
! Traffic Data Preparation
! Axle Load Spectra Development
! Sensitivity Analysis
3
MEPDG Traffic Data
! AADTT, truck speed and annual growth rate
! General traffic inputs
" Truck-traffic directional distribution factor
" Lane distribution factors
" Wheel base configurations
" Tire characteristics
! Axle load spectra
" Axle load distribution factors for single, tandem, tridem and
quad axle types
" Truck volume adjustment factors by month, hour and truck
class
4
Data Preparation
! Data source
" WSPMS
" The WSDOT Pavement Guide
" WIM stations
! Data processing
" Access
" TrafLoad
" MEPDG Utility Program
" Excel
5
WSDOT WIM Stations
0186,100Spokane77.327P30
92961,800Benton13.1221P17
1478,900Pullman87.7195P15
21093,100Whiteman22195P14
1794,800Ritzville6195P13
21469,900Adams21890P10
215715,000Wapato12182P09
29524,000Yakima48.582P08
1466,200Clark17.714P07
1263,500Clark11.914P06
211102,200Columbia37712P05
14311,000Wapato66.397P03
TrainDoubleSingle
Truck (%)AADTCountyMPSRSite
6
Axle Load Distribution
(loads in kips)
Single axle load
0
0.1
0.2
3 6 9 12 15 18 21 24
Fre
qu
en
cy
Tandem axle load
0
0.1
0.2
6 12 18 24 30 36 42 48
Default
Light
Moderate
Heavy
Tridem axle load
0
0.1
0.2
0.3
12 21 30 39 48 57 66 75
Fre
qu
en
cy
Quad axle load
0
0.1
0.2
12 21 30 39 48 57 66 75
91 of 92

7
Spectra Development
! Based on the potential impacts on pavement
performance, three general load spectra were
presented.
" Light axle load spectra with light single, tandem, tridem
and quad axle load distributions.
" Moderate axle load spectra with the light single axle
load distribution, and moderate tandem/tridem/quad axle
load distributions.
" Heavy axle load spectra with the light single axle load
distribution, heavy tandem axle load distribution, and
moderate tridem/quad axle load distributions.
8
Truck Volume Adjustment Factor Truck class
0
10
20
30
40
50
4 5 6 7 8 9 10 11 12 13
Fre
qu
en
cy (
%) Heavy
Moderate
Light
MEPDG Default
Month of the year
0
5
10
15
1 2 3 4 5 6 7 8 9 10 11 12
Fre
qu
en
cy (
%)
Hour of the day
0
5
10
0 2 4 6 8 10 12 14 16 18 20 22
Fre
qu
en
cy (
%)
9
Sensitivity Analysis
! MEPDG outputs were more sensitive to AADTT
and annual growth rate than the developed load
spectra.
! The three developed axle load spectra have
similar effects on MEPDG outputs.
! Special Investigations are needed
" For roads with anticipated traffic change in future.
" For design of high-volume roads or heavy-loading vehicles.
10
Conclusions
! MEPDG is only moderately sensitive to the
developed axle load spectra for typical WSDOT
pavement designs.
! One group of axle load spectra can present the
axle load characteristics in MEPDG for WSDOT.
92 of 92