implementation of the cap reform in various countries: variations and...
TRANSCRIPT

Slide number 1
Implementation of the CAP reform in various countries: variations and consequencesBeef Task Force, Dublin, August 24th, 2007Daniel Brüggemann, Dr. Claus Deblitz
German Agricultural SocietyFrankfurt
Institute of Farm EconomicsFederal Agricultural Research CentreBraunschweig
Brüggemann, August 2007 Slide number 2
Content
EU beef production
Common Agriculture Policy (CAP)– Overview– From a beef perspective– On farm level– The German case
Summary

Brüggemann, August 2007 Slide number 3
EU Beef Production

Brüggemann, August 2007 Slide number 4
Total cattle Inventory EU-251,000 head in 2005
2,69913,035
5,973
19,454
6,998
6,261
3,759 5,482
10,507
Source: ZMP Marktbilanz Vieh und Fleisch 2007
Comments: Data are basedon the year 2003 for:DK, GR, ES, FR, IE, IT, CY, HU, NL, AT, PT, SK, FI, GB
Total: 87,749
EU
–be
efpr
oduc
tion

Brüggemann, August 2007 Slide number 5
Total beef production EU-251,000 tons in 2005
209
3011,216
137
660
85
1,792
572
872
381 326
120
137
754
Source: ZMP Marktbilanz Vieh und Fleisch 2007
Comments: Data are basedon the year 2003 for:DK, GR, ES, FR, IE, IT, CY, HU, NL, AT, PT, SK, FI, GB
Total: 7,921
EU
–be
efpr
oduc
tion
Brüggemann, August 2007 Slide number 6
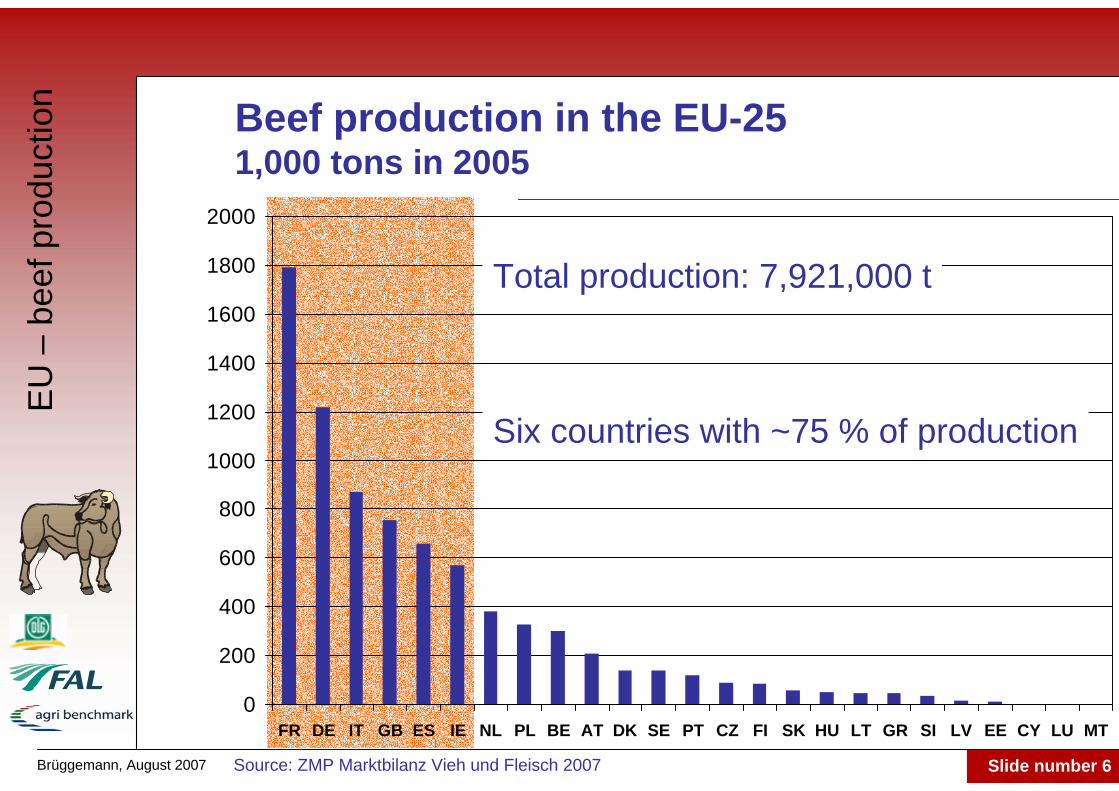
Beef production in the EU-251,000 tons in 2005
0
200
400
600
800
1000
1200
1400
1600
1800
2000
FR DE IT GB ES IE NL PL BE AT DK SE PT CZ FI SK HU LT GR SI LV EE CY LU MT
Six countries with ~75 % of production
Total production: 7,921,000 t
Source: ZMP Marktbilanz Vieh und Fleisch 2007
EU
–be
efpr
oduc
tion

Brüggemann, August 2007 Slide number 7
0
500
1000
1500
2000
2500
3000
3500
4000
4500
FR ES GB IE DE IT BE PT AT SE GR NL CZ DK SI HU LU SK PL FI LT EE LV CY MT
Suckler Cows in the EU-25 1,000 Head in 2005
Six Countries with ~80 % of suckler cows
EU-15: 11,800,000NMS EU-25: 300,000 (appr.)
Source: ZMP Marktbilanz Vieh und Fleisch 2007
EU
–be
efpr
oduc
tion
Brüggemann, August 2007 Slide number 8
0%
10%
20%
30%
40%
50%
60%
70%E
S PT IE FR BE
GR LU GB
EU
SE SI
AT IT CZ
DK
DE
SK
HU NL FI EE LV LT PL
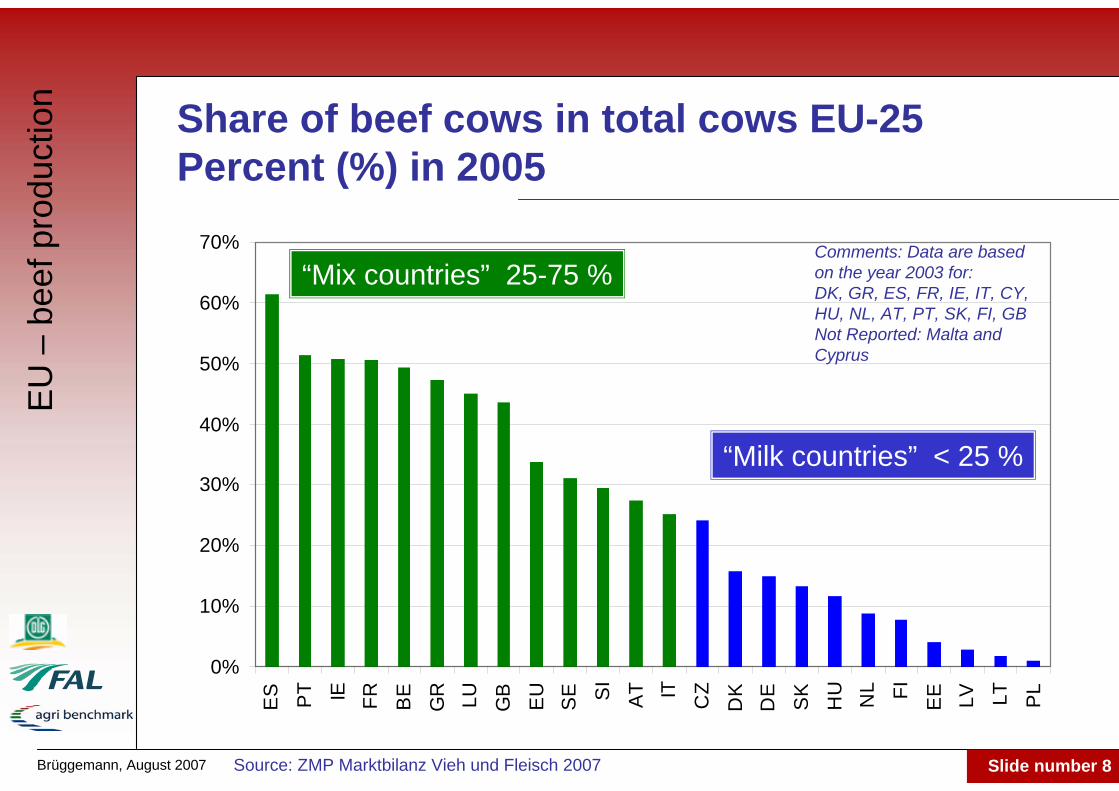
Share of beef cows in total cows EU-25 Percent (%) in 2005
“Milk countries” < 25 %
“Mix countries” 25-75 %
Source: ZMP Marktbilanz Vieh und Fleisch 2007
Comments: Data are basedon the year 2003 for:DK, GR, ES, FR, IE, IT, CY, HU, NL, AT, PT, SK, FI, GBNot Reported: Malta and Cyprus
EU
–be
efpr
oduc
tion
Brüggemann, August 2007 Slide number 9
CAPOverview
EU
-po
licy

Brüggemann, August 2007 Slide number 10
The evolution of the CAP
1960: Protectionism price policy
1984: Milk-Quota
1987: Set aside (facultative)
1992: McSharry Reform (Uruguay Round)
1999: Agenda 2000
2003: MTR – Luxembourg Agreement
2009: Health Check
2013: ???
EU
-po
licy
Brüggemann, August 2007 Slide number 11
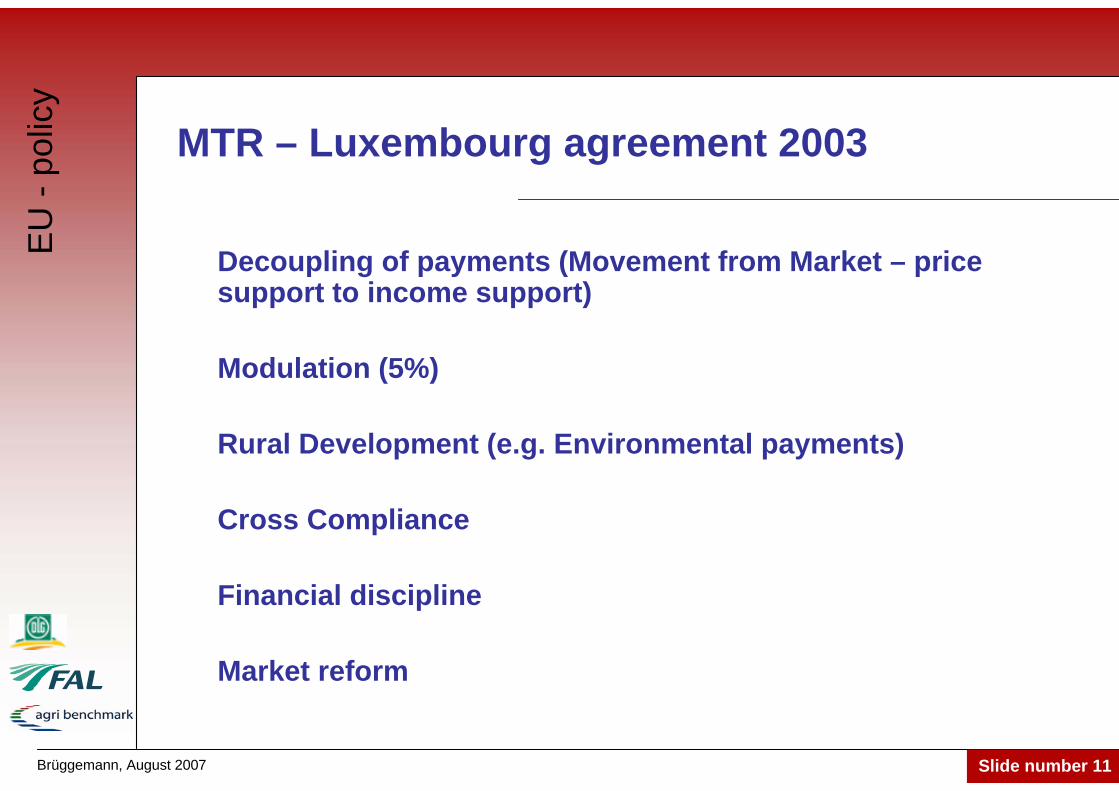
MTR – Luxembourg agreement 2003
Decoupling of payments (Movement from Market – pricesupport to income support)
Modulation (5%)
Rural Development (e.g. Environmental payments)
Cross Compliance
Financial discipline
Market reform
EU
-po
licy
Brüggemann, August 2007 Slide number 12
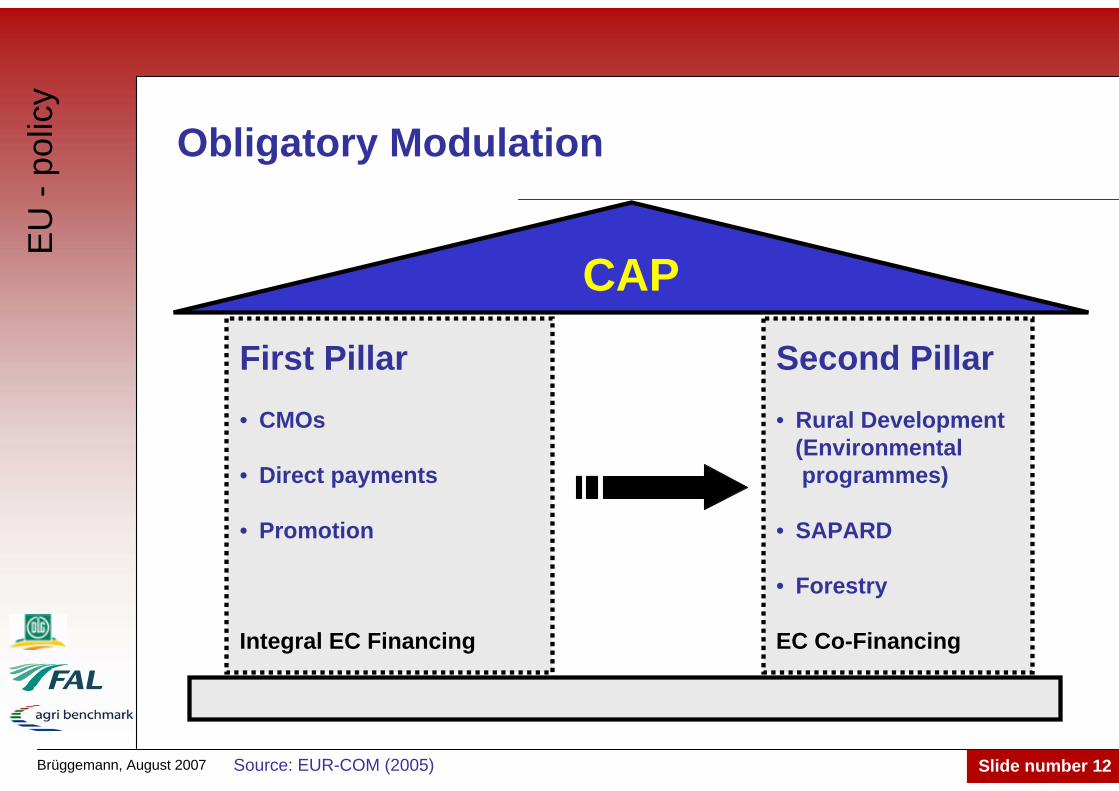
Obligatory Modulation
CAPFirst Pillar• CMOs
• Direct payments
• Promotion
Integral EC Financing
Second Pillar• Rural Development
(Environmentalprogrammes)
• SAPARD
• Forestry
EC Co-Financing
Source: EUR-COM (2005)
EU
-po
licy

Brüggemann, August 2007 Slide number 13
Decoupling Models
Historical model (SPS)
Regional model
Hybrid or combi model– Static– Dynamic
Partial coupling possible
Source: EU-COM (2006)
EU
-po
licy
Brüggemann, August 2007 Slide number 14
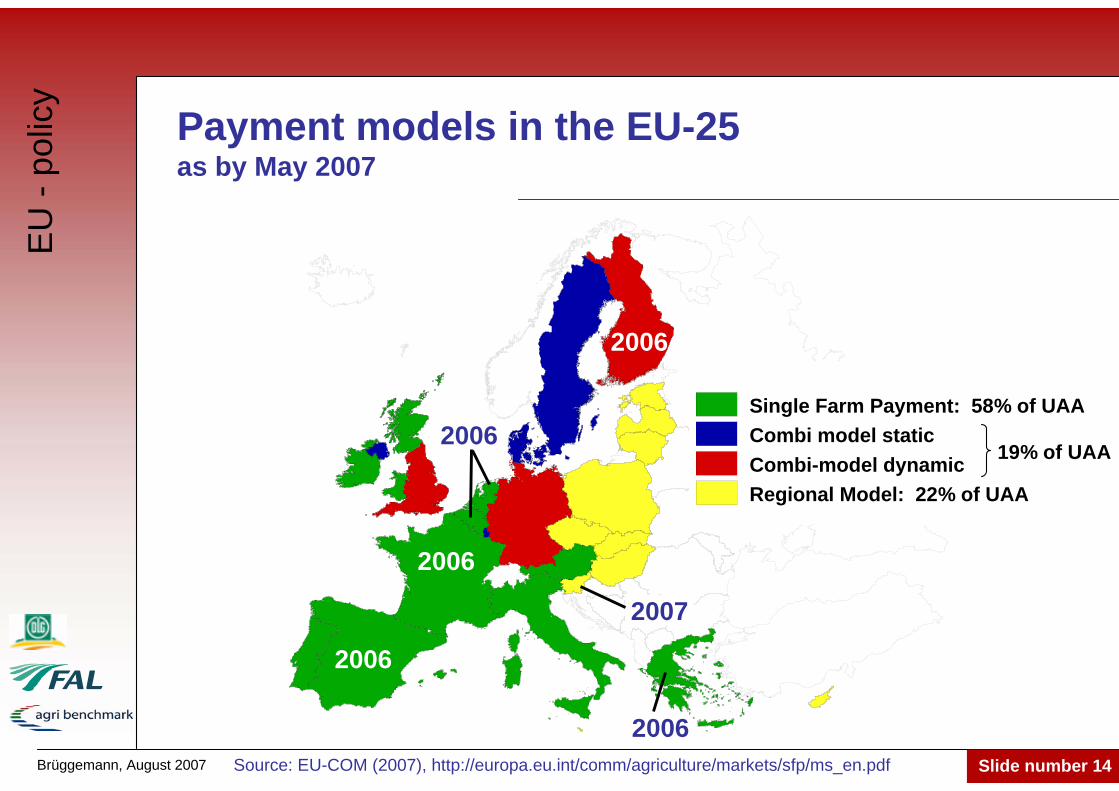
Payment models in the EU-25as by May 2007
Source: EU-COM (2007), http://europa.eu.int/comm/agriculture/markets/sfp/ms_en.pdf
EU
-po
licy
2006
2006
2006
2006
2006Single Farm Payment: 58% of UAA Combi model staticCombi-model dynamicRegional Model: 22% of UAA
19% of UAA
2007
Brüggemann, August 2007 Slide number 15
CAPBeef and cow-calf
Brüggemann, August 2007 Slide number 16
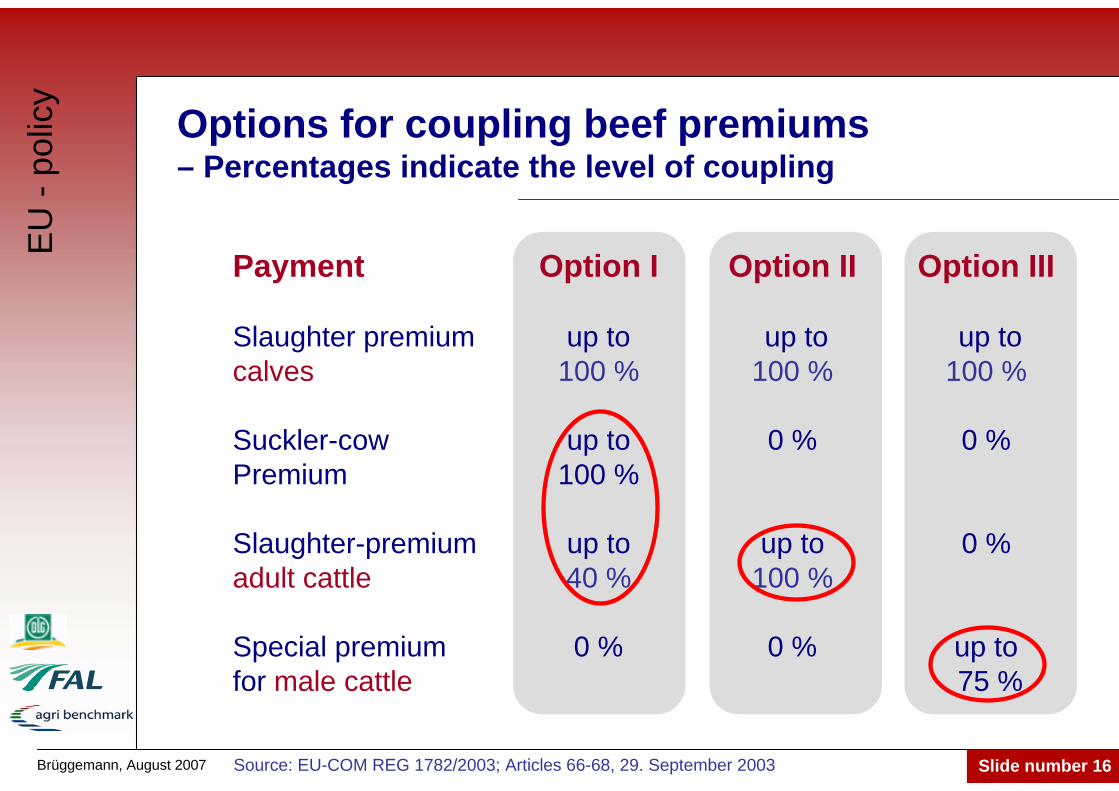
Options for coupling beef premiums– Percentages indicate the level of coupling
Payment Option I Option II Option III
Slaughter premium up to up to up tocalves 100 % 100 % 100 %
Suckler-cow up to 0 % 0 %Premium 100 %
Slaughter-premium up to up to 0 %adult cattle 40 % 100 %
Special premium 0 % 0 % up tofor male cattle 75 %
Source: EU-COM REG 1782/2003; Articles 66-68, 29. September 2003
EU
-po
licy

Brüggemann, August 2007 Slide number 17
Options for coupling beef premiums by country
EU
-po
licy
Total decoupling partly withmodification
I Coupling suckler-cowand slaughter premium
II Coupling slaughter premiums
III Coupling special male bovine premium
Source:http://ec.europa.eu/agriculture/markets/sfp/ms_en.pdf
Slaughter premium calves not coupled in: BE Zone Sud: Wallonia, DK, SI, FI, SE

Brüggemann, August 2007 Slide number 18
Coupled suckler cow premiums by country
EU
-po
licy
Suckler cow premium100 % coupled
Source:http://ec.europa.eu/agriculture/markets/sfp/ms_en.pdf
Brüggemann, August 2007 Slide number 19
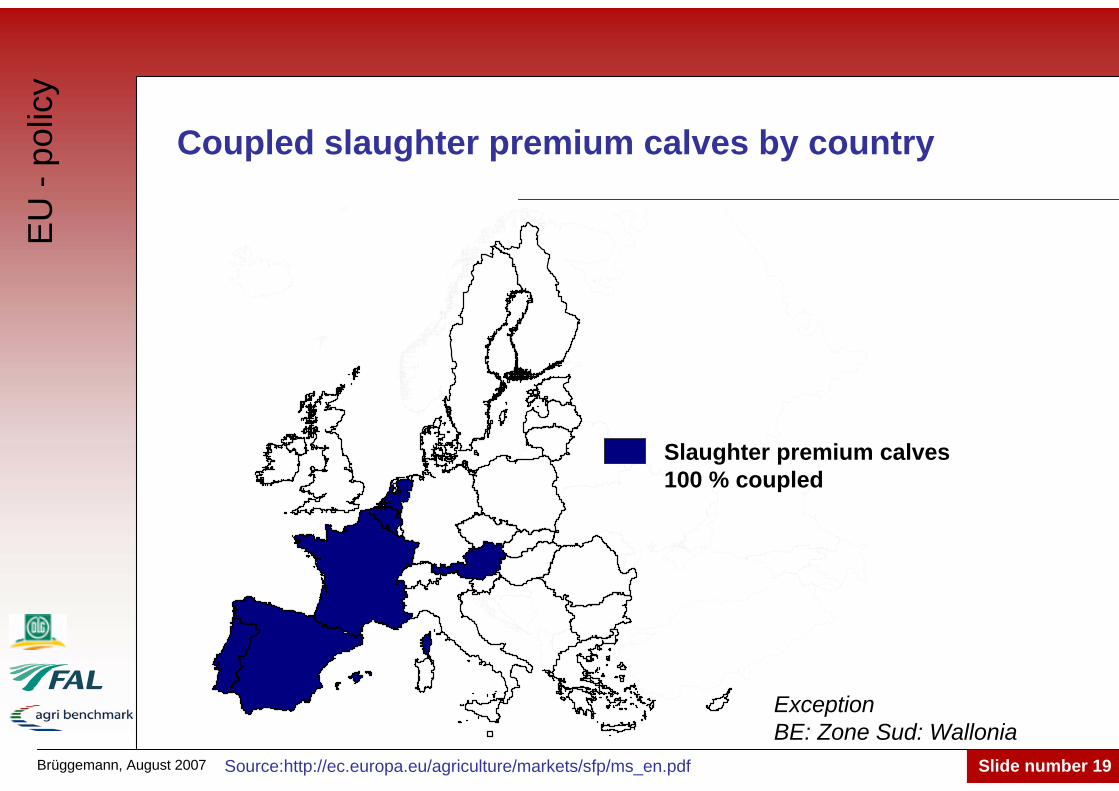
Coupled slaughter premium calves by country
EU
-po
licy
Slaughter premium calves100 % coupled
Source:http://ec.europa.eu/agriculture/markets/sfp/ms_en.pdf
ExceptionBE: Zone Sud: Wallonia
Brüggemann, August 2007 Slide number 20
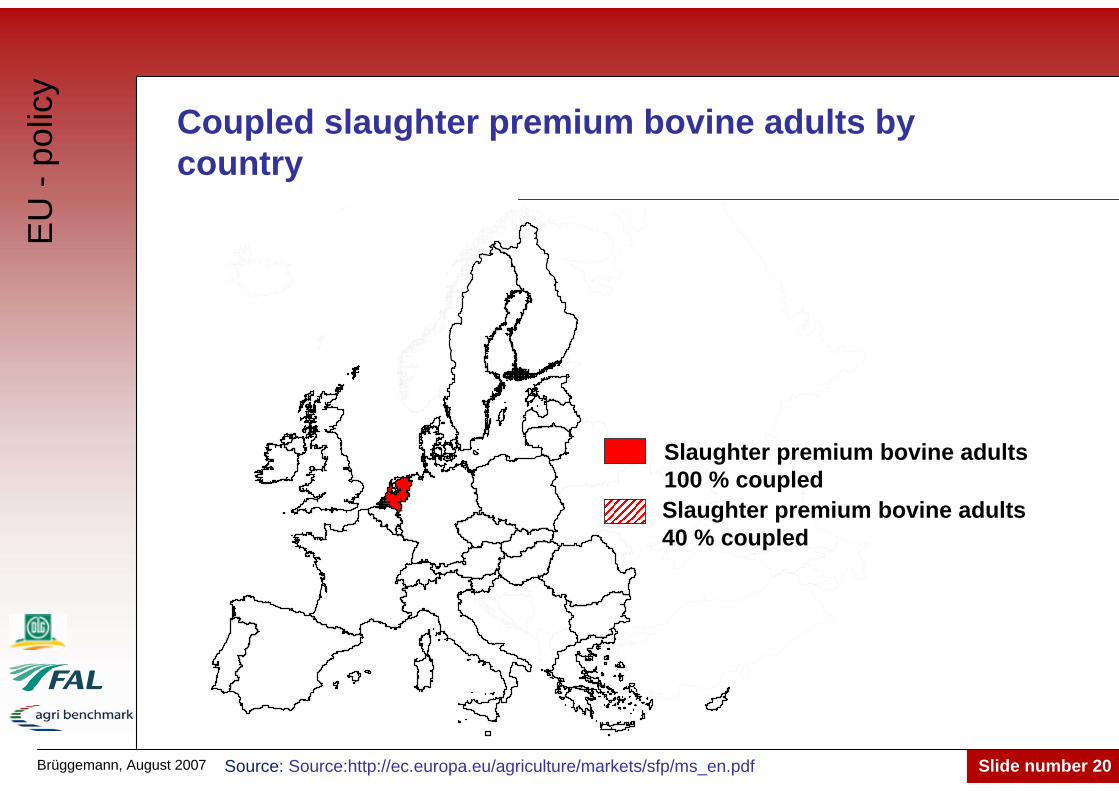
Coupled slaughter premium bovine adults bycountry
EU
-po
licy
Slaughter premium bovine adults100 % coupled
Source: Source:http://ec.europa.eu/agriculture/markets/sfp/ms_en.pdf
Slaughter premium bovine adults40 % coupled
Brüggemann, August 2007 Slide number 21
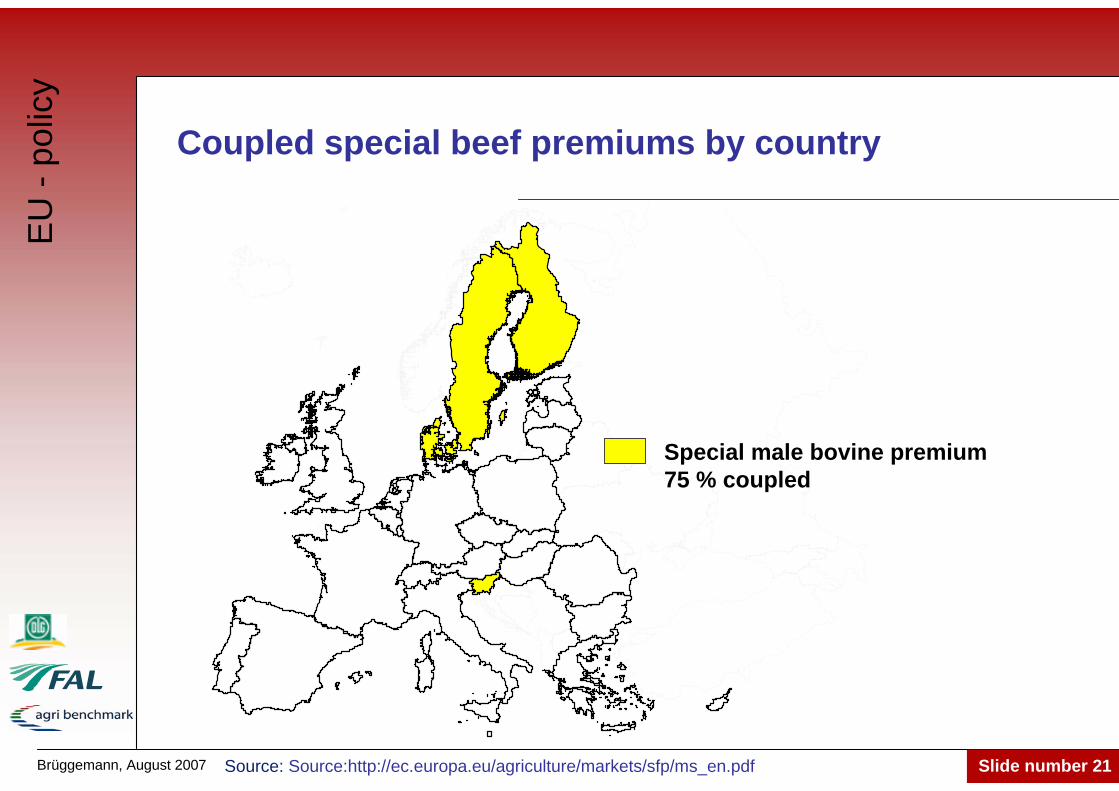
Coupled special beef premiums by country
EU
-po
licy
Special male bovine premium75 % coupled
Source: Source:http://ec.europa.eu/agriculture/markets/sfp/ms_en.pdf
Brüggemann, August 2007 Slide number 22
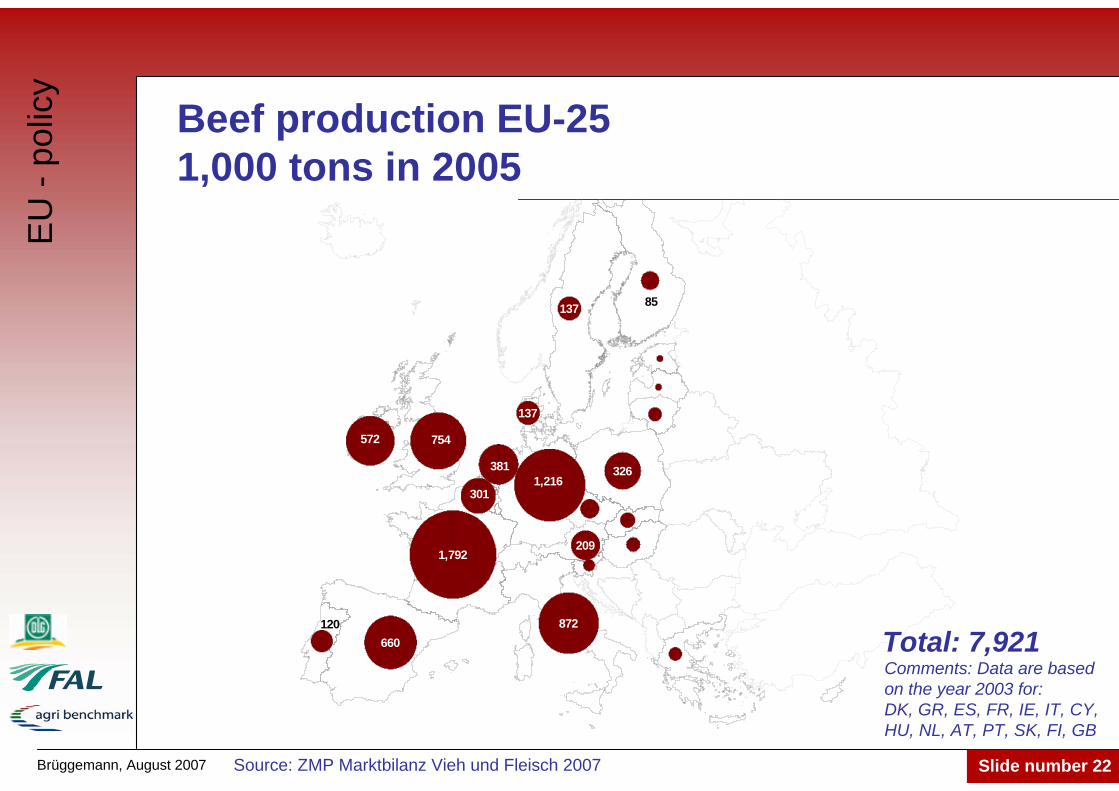
Beef production EU-25 1,000 tons in 2005
209
3011,216
137
660
85
1,792
572
872
381 326
120
137
754
Source: ZMP Marktbilanz Vieh und Fleisch 2007
Comments: Data are basedon the year 2003 for:DK, GR, ES, FR, IE, IT, CY, HU, NL, AT, PT, SK, FI, GB
Total: 7,921
EU
-po
licy
Brüggemann, August 2007 Slide number 23
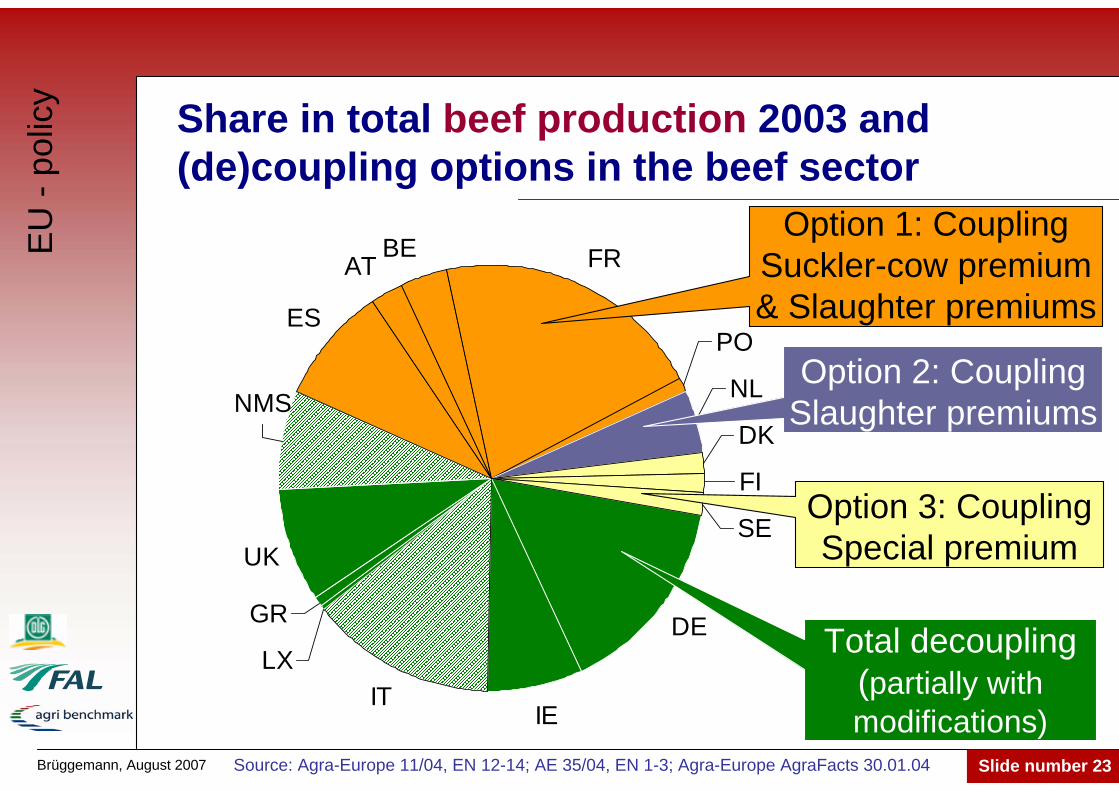
Share in total beef production 2003 and (de)coupling options in the beef sector
DE
IEIT
LX
GR
UK
ES
ATBE FR
PO
NL
DK
FI
SE
NMS
Total decoupling(partially with modifications)
Option 1: CouplingSuckler-cow premium& Slaughter premiums
Option 2: CouplingSlaughter premiums
Option 3: CouplingSpecial premium
Source: Agra-Europe 11/04, EN 12-14; AE 35/04, EN 1-3; Agra-Europe AgraFacts 30.01.04
EU
-po
licy
Brüggemann, August 2007 Slide number 24
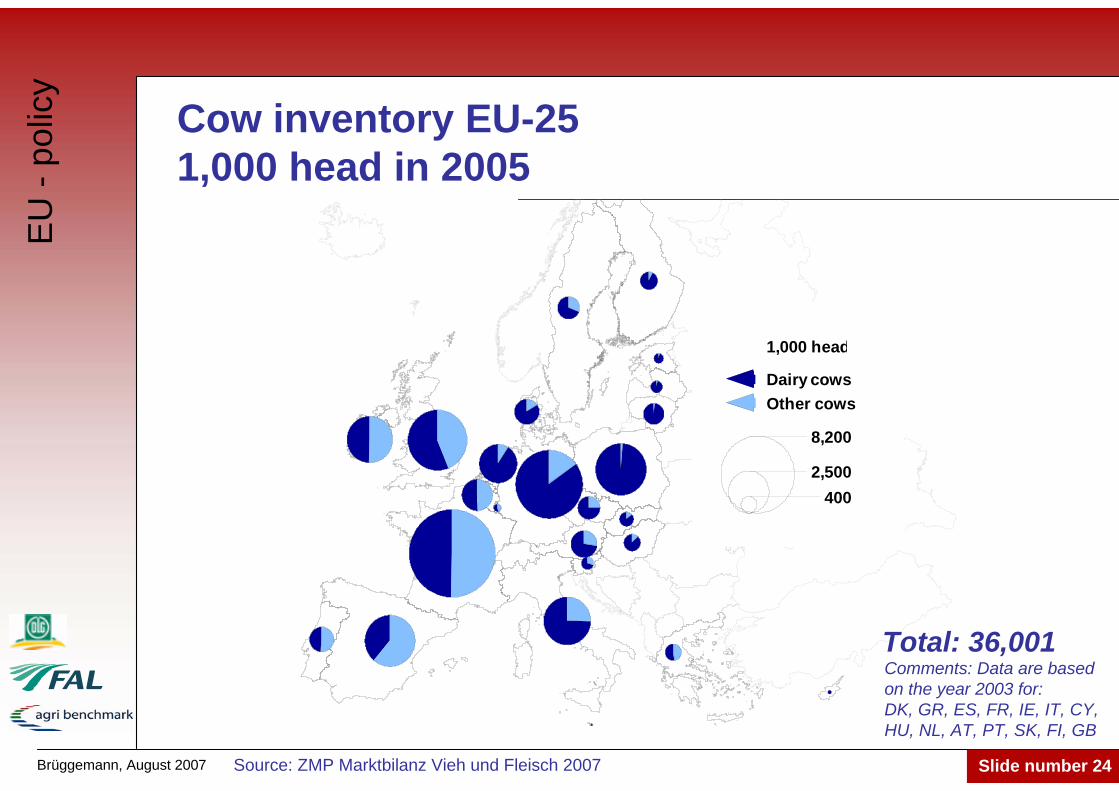
Cow inventory EU-25 1,000 head in 2005
1,000 head
Dairy cowsOther cows
8,200
2,500400
Source: ZMP Marktbilanz Vieh und Fleisch 2007
Comments: Data are basedon the year 2003 for:DK, GR, ES, FR, IE, IT, CY, HU, NL, AT, PT, SK, FI, GB
Total: 36,001
EU
-po
licy
Brüggemann, August 2007 Slide number 25
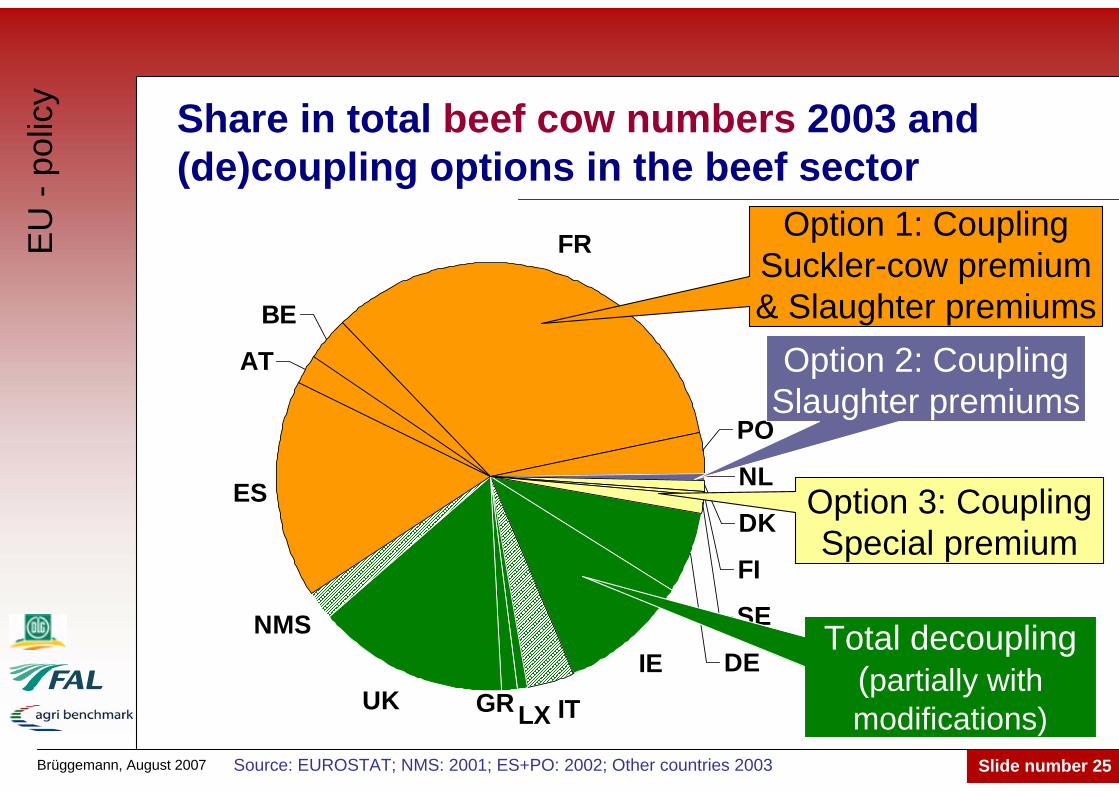
DEIE
ITLXUK
NMS
ES
AT
BE
FR
PO
NL
DK
FI
SE
GR
Source: EUROSTAT; NMS: 2001; ES+PO: 2002; Other countries 2003
Share in total beef cow numbers 2003 and (de)coupling options in the beef sector
Total decoupling(partially with modifications)
Option 1: CouplingSuckler-cow premium& Slaughter premiums
Option 2: CouplingSlaughter premiums
Option 3: CouplingSpecial premium
EU
-po
licy

Brüggemann, August 2007 Slide number 26
Conclusion
Different payment models used
Different share of decoupled and coupled directpayment
Different economic situation for beef farmerswithin Europe => „COMMON Agriculture Policy“?
EU
-po
licy

Brüggemann, August 2007 Slide number 27
CAPOn farm level

Brüggemann, August 2007 Slide number 28
Coupled situation until 2004 / 2005– Beef finishingEUR per 100 kg carcass weight
0
100
200
300
400
500
600
700
AT-
7
AT-
30
DE
-190
DE
-240
DE
-280
DE
-360
FR-4
5
FR-9
0A
FR-9
0B
ES-9
50
ES-6
950
IE-7
5
CZ-
160
CZ-
780
HU
-80
HU
-440
PL-1
2
PL-3
0
DepreciationOther cash costAnimal purchase
Beef returns + government paymentsBeef returns
Sumgovernmentpayments
Source: Own calculations after IFCN Beef Report 2004
Part of thepayment thatmust be used to compensate a loss that occurswithoutpayments
Ana
lysi
ngpo
licy
impa
ct
Brüggemann, August 2007 Slide number 29
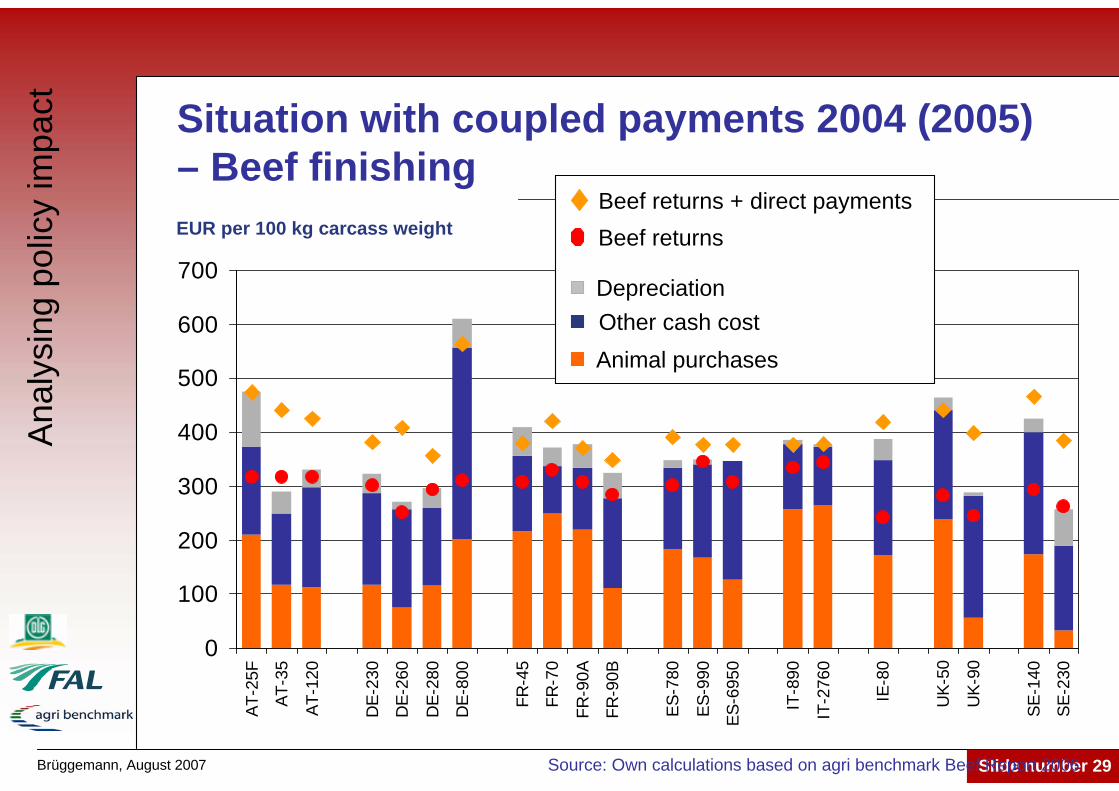
Situation with coupled payments 2004 (2005)– Beef finishingEUR per 100 kg carcass weight
0
100
200
300
400
500
600
700AT
-25F
AT-3
5
AT-1
20
DE-
230
DE-
260
DE-
280
DE-
800
FR-4
5
FR-7
0
FR-9
0A
FR-9
0B
ES-7
80
ES-9
90
ES-6
950
IT-8
90
IT-2
760
IE-8
0
UK-
50
UK-
90
SE-1
40
SE-2
30
Source: Own calculations based on agri benchmark Beef Report 2006
Depreciation
Beef returns
Other cash costAnimal purchases
Beef returns + direct payments
Ana
lysi
ngpo
licy
impa
ct

Brüggemann, August 2007 Slide number 30
Situation with decoupled payments 2005 (2006)– Beef finishing
0
100
200
300
400
500
600
700AT
-25F
AT-3
5
AT-1
20
DE-
230
DE-
260
DE-
280
DE-
800
FR-4
5
FR-7
0
FR-9
0A
FR-9
0B
ES-7
80
ES-9
90
ES-6
950
IT-8
90
IT-2
760
IE-8
0
UK-
50
UK-
90
SE-1
40
SE-2
30
Source: Own calculations based on agri benchmark Beef Report 2006
EUR per 100 kg carcass weight
Depreciation
Beef returns
Other cash costAnimal purchases
Beef returns + direct payments
Ana
lysi
ngpo
licy
impa
ct
Brüggemann, August 2007 Slide number 31
0
100
200
300
400
500
600
700
800AT
-25C
AT-3
0
DE-
1100
DE-
1400
FR-6
5
FR-8
0
FR-8
5
ES-7
5
ES-1
50
IE-2
5
UK-
60F
UK-
60C
SE-1
50
HU
-150
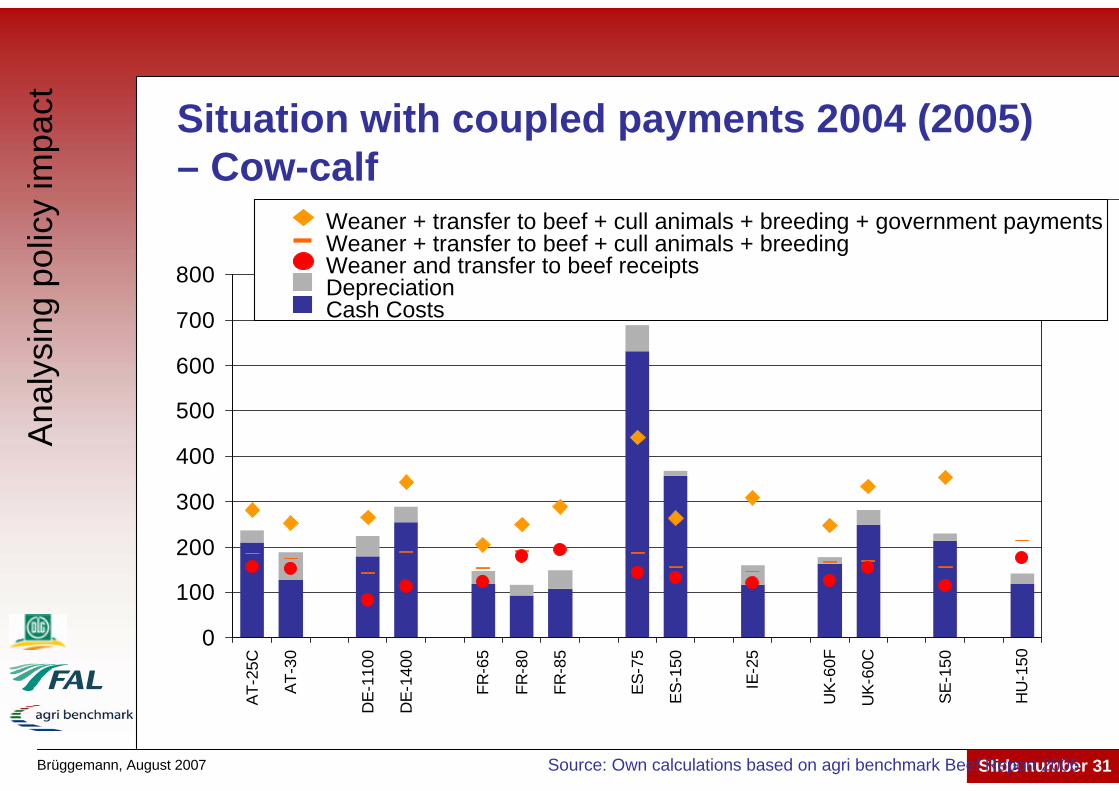
Situation with coupled payments 2004 (2005)– Cow-calf
Source: Own calculations based on agri benchmark Beef Report 2006
Ana
lysi
ngpo
licy
impa
ct
DepreciationCash Costs
Weaner and transfer to beef receipts
Weaner + transfer to beef + cull animals + breeding + government paymentsWeaner + transfer to beef + cull animals + breeding
Brüggemann, August 2007 Slide number 32
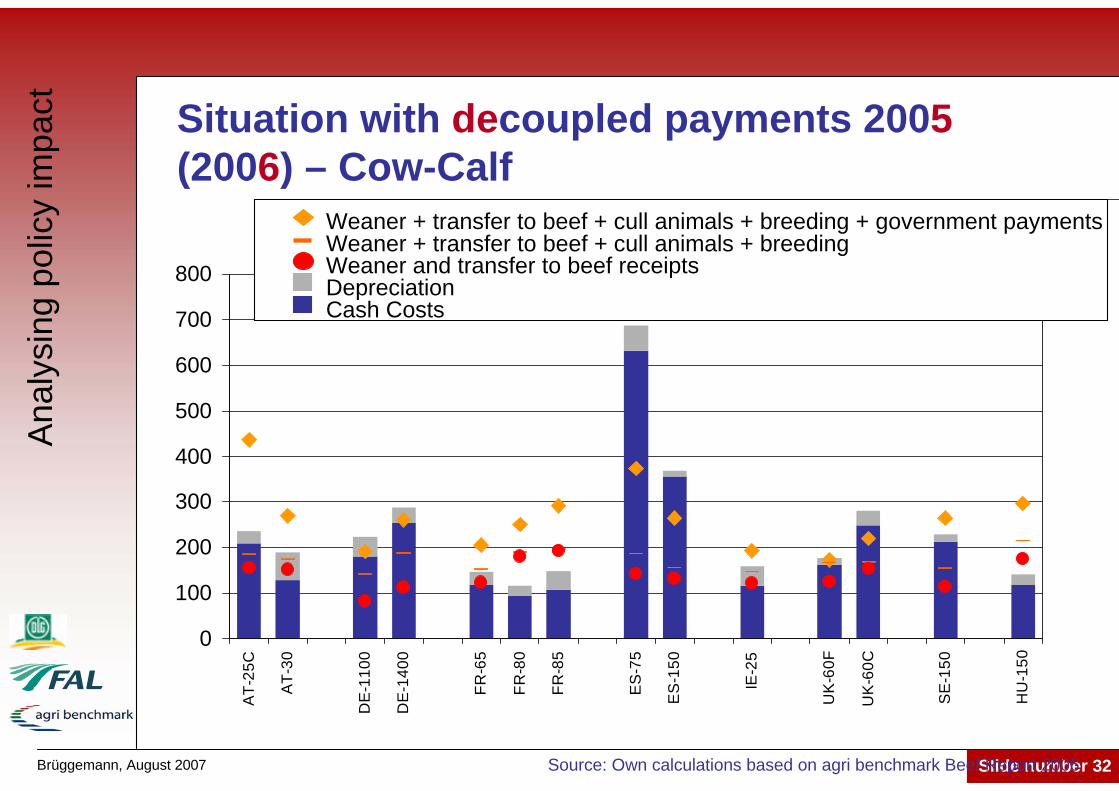
Situation with decoupled payments 2005 (2006) – Cow-Calf
Ana
lysi
ngpo
licy
impa
ct
0
100
200
300
400
500
600
700
800A
T-25
C
AT-
30
DE
-110
0
DE
-140
0
FR-6
5
FR-8
0
FR-8
5
ES
-75
ES
-150
IE-2
5
UK
-60F
UK
-60C
SE
-150
HU
-150
DepreciationCash Costs
Weaner and transfer to beef receipts
Weaner + transfer to beef + cull animals + breeding + government paymentsWeaner + transfer to beef + cull animals + breeding
Source: Own calculations based on agri benchmark Beef Report 2006

Brüggemann, August 2007 Slide number 33
Which policy has beenimplemented in Germany?
Brüggemann, August 2007 Slide number 34
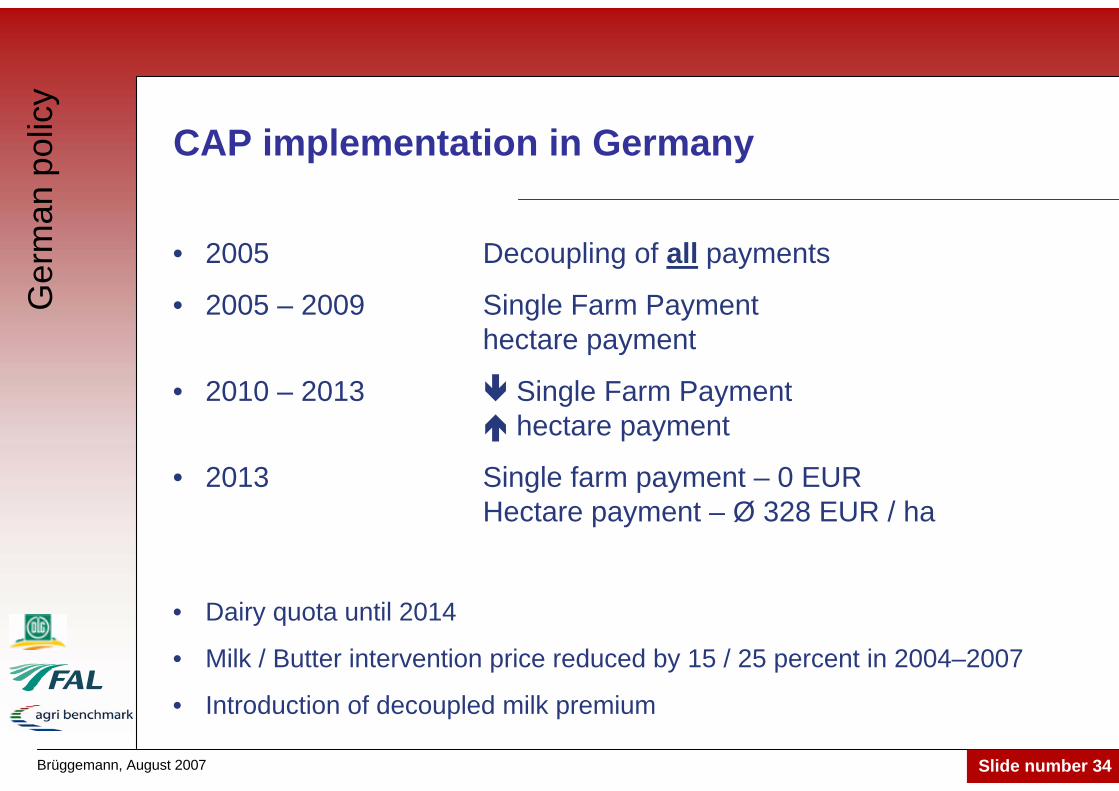
CAP implementation in Germany
• 2005 Decoupling of all payments
• 2005 – 2009 Single Farm Paymenthectare payment
• 2010 – 2013 Single Farm Paymenthectare payment
• 2013 Single farm payment – 0 EURHectare payment – Ø 328 EUR / ha
• Dairy quota until 2014
• Milk / Butter intervention price reduced by 15 / 25 percent in 2004–2007
• Introduction of decoupled milk premium
Ger
man
pol
icy

Brüggemann, August 2007 Slide number 35
Allocation of coupled premiums to SFP and hectare payments in Germany 2005-2009
Hectare payment Single farm payment
Source: DBV (German Farmers Association)
Grand Cultures p/Seed production p/
75 % dec. starch payments p/
Decoupled hop p/
Dairy p/
Suckler cow p/
Special p/ male cattle
Slaughter p/ calves
50% extensific. p/cattle
Ewe p/25 % dec. starch payments
Decoupled part tobacco and dry feed
Slaughter p/ adults
National p/ cattle
50% extensification p/ cattle
Cro
plan
dG
rass
land
Ger
man
pol
icy

Brüggemann, August 2007 Slide number 36
Bundesland Grassland Cropland
Baden Wurttemberg 56 317Bavaria 89 299Brandenburg 70 274Hesse 47 327Mecklenburg-Pomerania 61 316Lower Saxony 102 259Northrhine-Westphalia 111 283Rheinland-Palatina 50 288Saarland 57 296Saxony 67 321Saxony-Anhalt 53 337Schleswig-Holstein 85 324Thuringia 61 338
Germany 79 301
2005
Start values of acreage payments by Bundesländer (estimation)
Source: BMVEL 2004
Ger
man
pol
icy
Single farm payment
Calculated individuallyfor each farm
based on average ofthe years
2000 -2002
Brüggemann, August 2007 Slide number 37
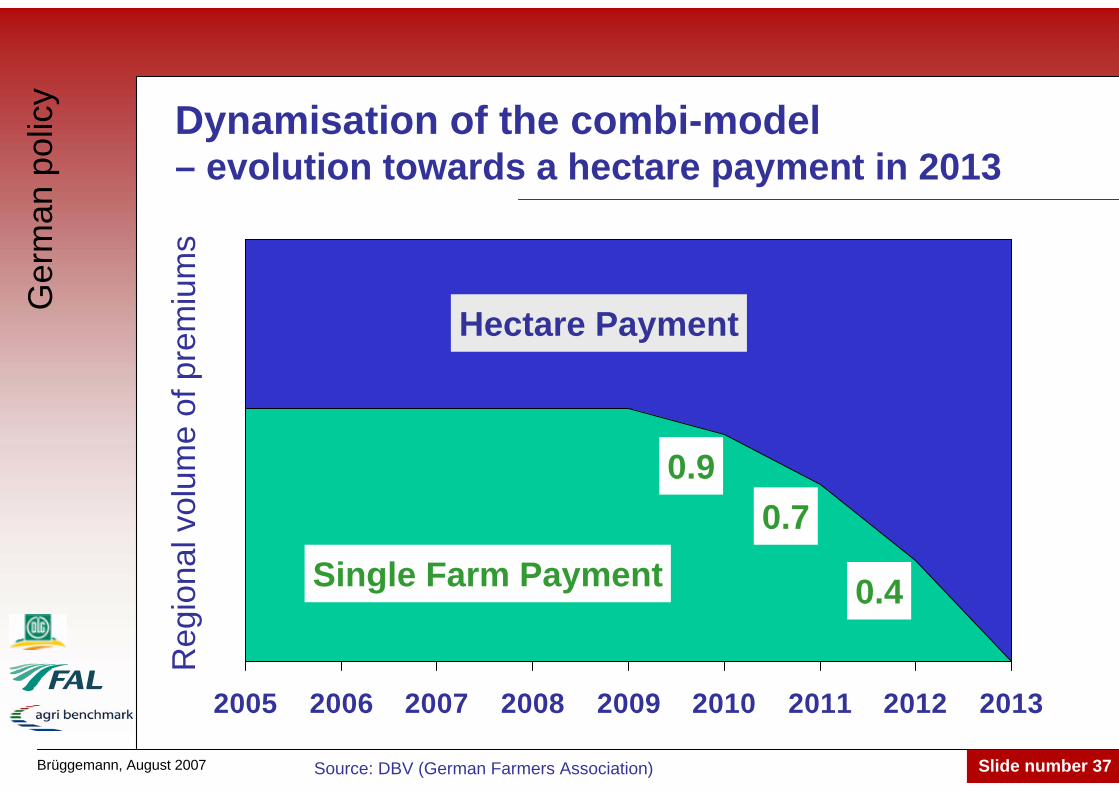
Dynamisation of the combi-model– evolution towards a hectare payment in 2013
Source: DBV (German Farmers Association)
2005 2006 2007 2008 2009 2010 2011 2012 2013
Hectare Payment
Single Farm Payment
Reg
iona
l vol
ume
of p
rem
ium
s
0.90.7
0.4
Ger
man
pol
icy
Brüggemann, August 2007 Slide number 38
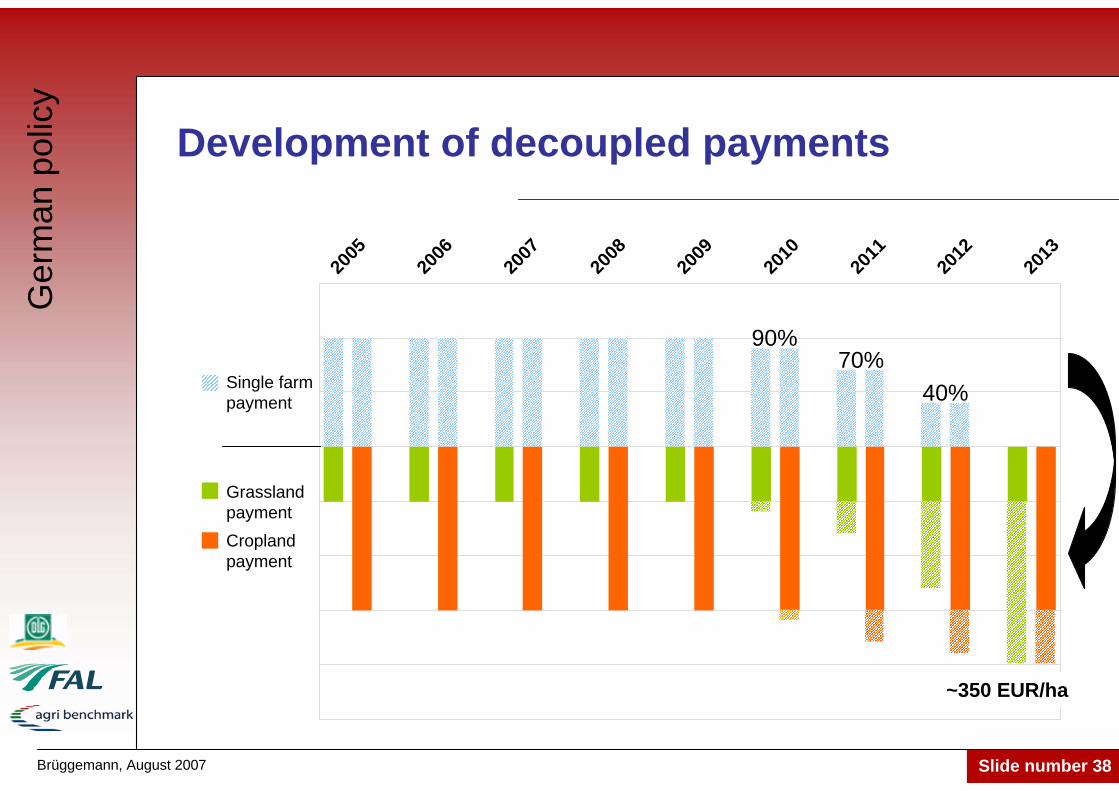
Development of decoupled payments
Ger
man
pol
icy
~350 EUR/ha
90%70%
40%
2005
2006
2007
2008
2009
2010
2011
2012
2013
Single farmpayment
Grassland paymentCroplandpayment
Brüggemann, August 2007 Slide number 39
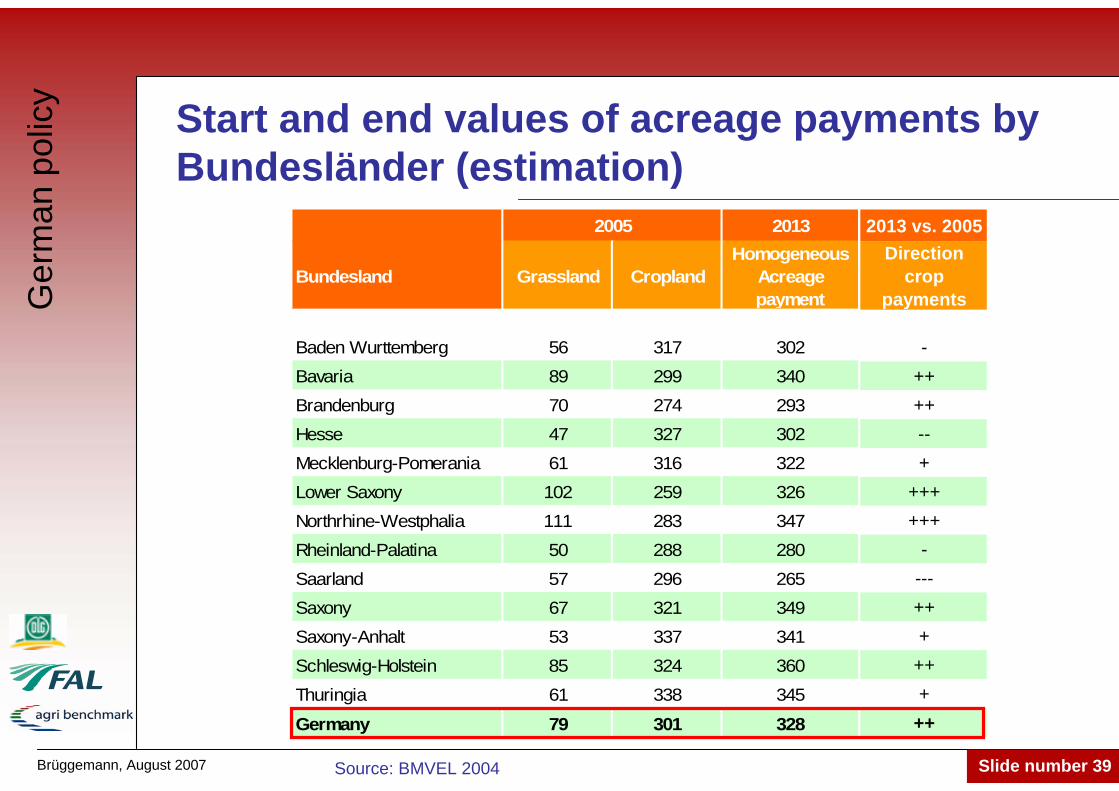
2013 vs. 2005Direction
crop payments
-++++--+
++++++
----+++
+++
++
Start and end values of acreage payments by Bundesländer (estimation)
2013
Bundesland Grassland CroplandHomogeneous
Acreage payment
Baden Wurttemberg 56 317 302Bavaria 89 299 340Brandenburg 70 274 293Hesse 47 327 302Mecklenburg-Pomerania 61 316 322Lower Saxony 102 259 326Northrhine-Westphalia 111 283 347Rheinland-Palatina 50 288 280Saarland 57 296 265Saxony 67 321 349Saxony-Anhalt 53 337 341Schleswig-Holstein 85 324 360Thuringia 61 338 345
Germany 79 301 328
2005
Source: BMVEL 2004
Ger
man
pol
icy
Brüggemann, August 2007 Slide number 40
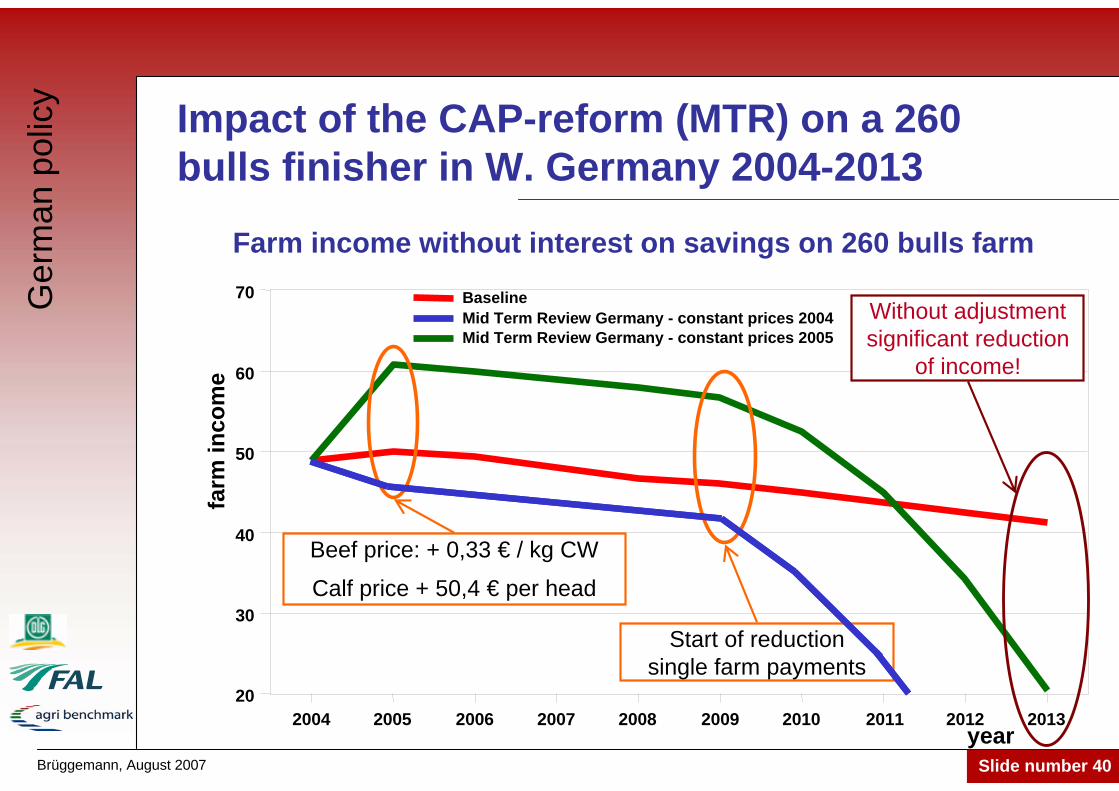
Impact of the CAP-reform (MTR) on a 260 bulls finisher in W. Germany 2004-2013
Farm income without interest on savings on 260 bulls farm
2004 2005 2006 2007 2008 2009 2010 2011 2012 201320
30
40
50
60
70 Baseline
Mid Term Review Germany - constant prices 2005
Beef price: + 0,33 € / kg CW
Calf price + 50,4 € per head
Start of reductionsingle farm payments
farm
inco
me
year
Without adjustmentsignificant reduction
of income!
Mid Term Review Germany - constant prices 2004
Ger
man
pol
icy

Brüggemann, August 2007 Slide number 41
Implications
• Full decoupling: no obligation to produce anymore
• The SFP until 2009 reduces the liquidity problems for intensive (dairy and beef finishing) farms
• To receive payments the land must be maintained in a defined status (cross compliance), basically kept ‘open’
• This can be done mechanically by mulching once a year at cost of approx. 40 EUR/ha
• If the loss from beef production is below –40 EUR/ha, mechanical maintenance is the better alternative
Ger
man
pol
icy
Brüggemann, August 2007 Slide number 42
Summary
Beef and suckler-cow herd are dominated by a few countries within the EU-25
Different decoupling models have beenimplemented and will last until 2013
Currently beef farmers face a different economicsituation, e.g. total decoupling in Germany
In a long term view this policy should beconsidered as preliminary
Environment, Rural Development, AnimalWelfare, etc. will be of increasing interest and important challenges in the near future