implementation of the 5s model as a source to increase
TRANSCRIPT

Saimaa University of Applied Sciences Business Administration, Lappeenranta Degree Programme in International Business Management Master of Business Administration
Sergey Klementev Implementation of the 5S model as a source to increase labor productivity and as a platform for the continuous improvements for SPPM Master Thesis 2015

2
Abstract Sergey Klementev Implementation of the 5S model as a source to increase labor productivity and as a platform for the continuous improvements for SPPM 135 pages, 1 appendix Saimaa University of Applied Sciences Business Administration, Lappeenranta Masters Degree Programme International Business Master Thesis 2015 Instructors: Principal Lecturer, Tuuli Mirola, Saimaa University of Applied Sciences; Deputy of the General Director for Financial and Economic, Kirill Rogal, Syassky Pulp & Paper Mill.
SPPM is located in the Leningrad region. The company was founded in 1928
and specializes in producing hygiene products. The market of these products is
highly competitive, here are all the main players, multinational companies,
domestic manufacturers as well as small local producers. The main problem in
the enterprise is low labor productivity, and it reflects the overall picture in the
Russian industry.
The purpose of the thesis is to search for ways of continuous improvement (CI)
that can be used to, foremost, improve the labor productivity and, secondly,
identify which of them could be suitable in the case of SPPM.
The main contributions of this research are an understanding of the existing
quality system management approaches, their influences on business,
especially on labor productivity and finding the most suitable solution for the
company, particularly for SPPM.
Keywords: competiveness; productivity; quality management; continuous improvement; 5S; TQM

3
Preface This work took much more time than I could have imagined. There were
objective and subjective reasons. During this study a lot of mistakes were
made, at the same time it brought me a wealth of experience in similar works.
But all that would not have been if I had not have the support of my supervisor
Tuuli Mirola and personally Minna Ikävalko. I also want to thank my supervisor
from Syassky PPM Rogal Kirill. Special thanks to Mr. Brady, CEO of KBR
Russia and Dmitry Timokhin, head of the quality department of KBR Russia, for
their assistance and materials provided. Despite the fact that the material
provided by Mr Claes Berlin is not included in this work, I would like to express
my deep gratitude for his help in this work.

4
Table of Contents
Abstract............................................................................................................... 2 Preface................................................................................................................ 3 1 Introduction to the research study................................................................. 6
1.1 Background ............................................................................................... 6 1.2 Problem discussion and delimitation..................................................... 11 1.3 Research aim and objectives ................................................................ 13 1.4 Research questions.............................................................................. 14 1.5 Research design ................................................................................... 14 1.6 Structure of the thesis ........................................................................... 15
2 Literature review.......................................................................................... 17 2.1 Continuous improvement ...................................................................... 17 2.2 Historical background and development............................................... 20 2.3 Existing approaches of CI ..................................................................... 23
2.3.1 Lean thinking ................................................................................. 25 2.3.2 Six Sigma....................................................................................... 29 2.3.3 Lean Six Sigma.............................................................................. 31
2.4 Comparison existing approaches........................................................ 33 3 Research strategy and methodology ........................................................... 37
3.1 Philosophical assumption.................................................................... 37 3.2 Research strategy ............................................................................... 38 3.3 Research methods ............................................................................... 40
3.3.1 Pest analysis.................................................................................. 40 3.3.2 Case study..................................................................................... 41 3.3.3 Interview ........................................................................................ 42 3.3.4 Expert opinion................................................................................ 43
3.4 Data analysis........................................................................................ 44 4 Analysis of the preconditions in Russia....................................................... 45
4.1 Historical background............................................................................ 45 4.2 Pest analysis ......................................................................................... 48
4.2.1 Political factors............................................................................... 49 4.2.2 Economic factors ........................................................................... 54 4.2.3 Social factors ................................................................................. 58 4.2.4 Technological factors..................................................................... 61
4.3 Cross-cultural analysis .......................................................................... 65 4.4 Conclusion of the PEST analysis ............................................................ 72
5 Case of Sayssky Pulp & Paper Mill............................................................. 76 5.1 Historical summary................................................................................ 76 5.2 Company profile .................................................................................... 77 5.3 Problems discussion ............................................................................. 80 5.4 Interview with the staff........................................................................... 85 5.5 Given data............................................................................................. 88 5.6 Main outputs from the interviews........................................................... 92

5
6 Case of KBR East company........................................................................ 94 6.1 KBR profile .............................................................................................. 94 6.2 KBR in Russia ......................................................................................... 95 6.3 QM is a philosophy.................................................................................. 96 6.4 5S............................................................................................................ 98 6.5 Obstacles in the implementation of 5S.................................................. 102 6.6 Benefits of 5S........................................................................................ 104 6.7 Main findings of the KBR case study .................................................... 105
7 Expert opinion ........................................................................................... 107 7.1 Who is Mr. Ho........................................................................................ 107 7.2 Why 5S works ....................................................................................... 108 7.3 5S is the foundation to continuous improvement .................................. 109 7.4 Summary of the section......................................................................... 111
8 Data analysis............................................................................................. 112 9 Conclusion ................................................................................................ 116 List of figures................................................................................................... 118 List of tables.................................................................................................... 120 References...................................................................................................... 121 Appendix 1 Study plan.................................................................................... 131

6
1 Introduction to the research study
"In terms of productivity, we are still far in comparison with the leading
countries… For example, we are lagging behind countries such as Norway 4
times, despite the fact that citizens in Norway work for 14 days less than in
Russia. On average, we are lagging behind the developed countries
somewhere 2.5 times. "
Maxim Topilin, Minister of Labor
and Social Protection
of the Russian Federation
This chapter is devoted to the description of prerequisites for this paper,
including a discussion of the problem, which leads to the formulation of
assumptions, the investigation of which this work will be devoted to. Then will
be shown the aims and objectives of this study, then briefly the scope and
delimitation will be explained. Finally research design and the structure of this
study will be presented.
1.1 Background
The main contributions of this research are an understanding of the existing
quality system management approaches, their influences on business,
especially on labor productivity and finding the most suitable solution for the
company, particularly for Sayssky Pulp and Paper Mill (SPPM). In order to
better understand what makes the company competitive, it is needed to
indentify the existing characteristics of modern world.
If the outside reflections of the policy issues are left out, the main and obvious
characteristic of modern society would be the process of globalization.
Globalization has become an important aspect of the modern world system, one
of the most influential forces shaping the future course of development of our
planet. It affects all areas of public life, including the economy, politics, social
sphere, culture, ecology, safety, etc. (Jones 2006, p. 10). Professor of sociology
at the University of California (USA) M.Castels defined globalization as "a new
capitalist economy," based on information, knowledge, and information
7
technology as the main sources of productivity growth and competitiveness.
This new economy is organized primarily through a network management
structure of production and distribution, rather than individual firms, and it is
global (Castels 2001, p. 52).
More specifically, globalization can be defined as a process, which increases
economic openness, economic cohesion and economic integration in the world
economy (Nayyar 2006, p. 137). In 2010, the added value within the global
production of transnational corporations (TNCs) was about $ 16 trillion dollars,
i.e. about one quarter of global GDP. Only on foreign affiliates of TNCs
accounted for more than 10% of global GDP and one third of world exports
(UNCTAD 2011).
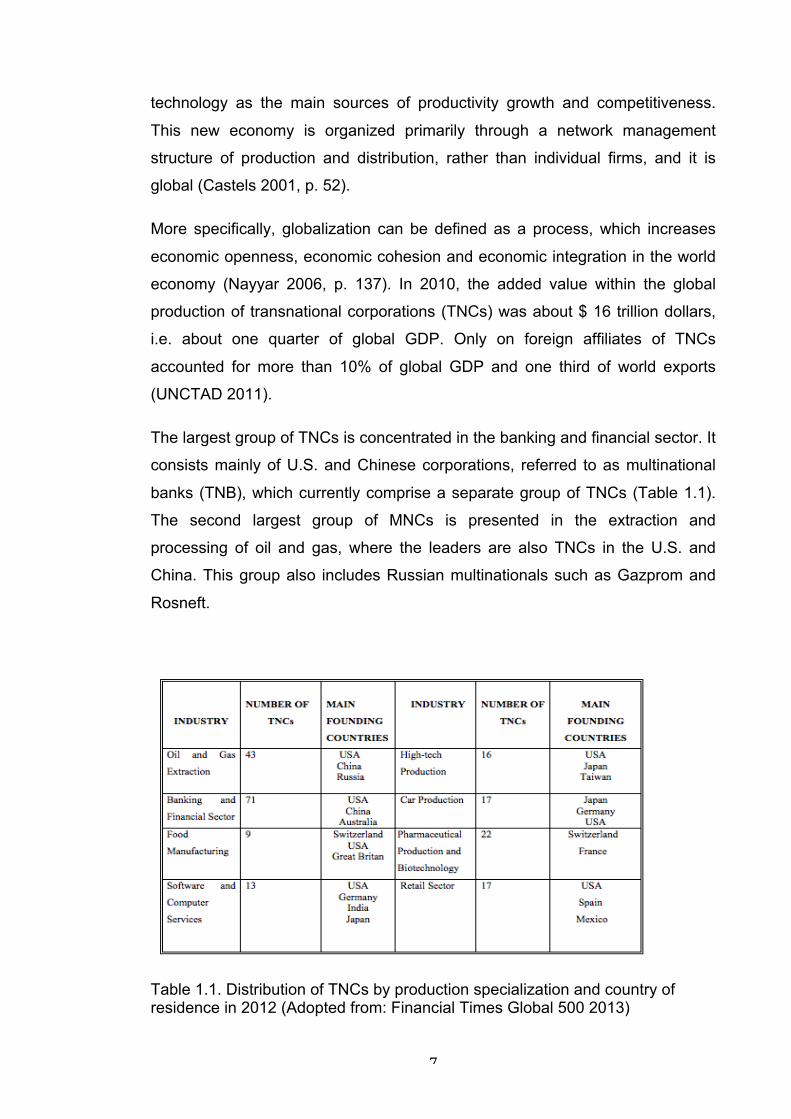
The largest group of TNCs is concentrated in the banking and financial sector. It
consists mainly of U.S. and Chinese corporations, referred to as multinational
banks (TNB), which currently comprise a separate group of TNCs (Table 1.1).
The second largest group of MNCs is presented in the extraction and
processing of oil and gas, where the leaders are also TNCs in the U.S. and
China. This group also includes Russian multinationals such as Gazprom and
Rosneft.
Table 1.1. Distribution of TNCs by production specialization and country of residence in 2012 (Adopted from: Financial Times Global 500 2013)
8
Globalization affects all economies around the world. It affects the production of
goods and services, use of labor, investment, technology and distribution from
one country to another. All this ultimately affects the production efficiency,
productivity and competitiveness. It is globalization that has caused the
aggravation of international competition. Competition in its turn forces
companies to look for new approaches that can ensure their competitiveness,
and probably, productivity plays the main role in this case. (Roghanian et al.
2012, p.65.)
Over the past few decades there have been significant changes in the Russian
economy. Russia joining the WTO, actually, only formalized the fact that the
economics of Russia in the XXI century is an integral part of the global
economic space, with all its the advantages and disadvantages. This fact
means that Russian companies need to act in the face of fierce competition
from transnational corporations (TNCs), which largely determine the dynamics
and structure of modern markets. Thus in the issues related to the efficiency of
activities Russian companies come to the forefront. (Nigmatulin 2013.)
A joint research effort by MGI and McKinsey's Moscow office finds that key
historic sources of the growth of the Russian economy—favorable global market
conditions for Russian exports, positive demographic trends, and available
capacity—are no longer available, and in this new environment productivity and
new investment become critical drivers for the economy's future growth. The
current global economic crisis has made the need to address the productivity
challenge even more urgent. (McKinsey Global Institute 2009, p.9.)

9
Figure 1.1. Labor productivity in Russia (McKinsey Global Institute 2009, p.13)
The research conducted in 2009 by MGI, identifies productivity gaps in Russia.
Productivity stands on average at 26 percent of US levels in 2007 (Figure 1.1).
The analysis identifies key shortcomings common to all sectors and finds that
inefficient business processes account for 30 to 80 percent of the productivity
gap with the United States, depending on the sector. (McKinsey Global Institute
2009, p. 28)
According to the Organization for Economic Cooperation and Development
(OECD), any representative of the Group of Seven (G7) works 2.5 times more
effectively than the Russians. Norway or Ireland, which occupy one of the
leading positions in labor productivity in the world, exceed Russians on this
indicator almost 4 times. Even a starker picture emerges if we consider that
Norwegians work 14 days less a year than Russians (see Figure 1.2).

10
Figure 1.2. Correlation between working hours and cost in different countrues (Adopted from: OECD 2011)
The figures look scary, especially when we talk about the current trend in the
development of the modern world and increasing competition as a
consequence of this trend. What are the main reasons for such a strong
backlog from the world leading countries?
After the collapse of the Soviet Union 's, the Russian economy was in a deep
crisis, and only towards the end of the 90s it was just beginning to recover. In
1999, in the most important sectors of the economy, the average labor
productivity was about 18% of the U.S. level. According to the data published
by McKinsey Group in April 2009, this figure rose to 26%. According to the
authors, this productivity growth (on average this figure is 7% per year),
followed by the GDP growth was associated with an increase in the number of
the working population (including the expense of migrant workers) and the fuller
capacity utilization (from 45 % in 1998 to 80 % in 2007). However, further
0 50 100 150 200
Mexico South Korea
Chile Greece Russia
Hungary Poland Israel
Estonia Turkey
Czech Republic Portugal
USA Luxemburg
Austria Switzerland
Belgium Ireland
Denmark France Norway Germany
Netherland
number of working hours per month
hour cost in USD

11
growth rate of productivity due to the same factors is impossible (McKinsey
Global Institute 2009, p. 22) .
The advantage of low cost does not work anymore. This competitive advantage
is no longer with us: selling price of electricity for industrial consumers in Russia
is about 55% higher than in the US, gas and coal costs are about the same as
in the U.S. (Nigmatulin 2013). An average "clean" salary in Russia (23 410
Rubles, or 582 Euros per month in 2012) not only outperformed all the CIS
countries, but also a number of EU member states, such as Hungary (335
Euros), Lithuania (289 Euros) and Latvia (286 Euros) (Eurostat 2013).
So in this case it is difficult not to agree with one of the main findings of the
study conducted by McKinsey Groups that the main reason for the low labor
productivity in Russia there is inefficiency in the organization of labor.
This phenomenon is common to all industries in Russia. Syassky PPM is no
exception. If the company previously was able to take advantage of localization,
such as low-cost resources, currently this potential is exhausted. Nowadays, the
value of productivity moves to the forefront, as a competitive edge of the
company. So the main question is how the company can improve this
performance.
1.2 Problem discussion and delimitation
Michael Porter (1990) states: “The only meaningful concept of competitiveness
at the national level is productivity.” He highlights that profitability, cost
competitiveness, and growth in long-term would be generated through
productivity improvement. He stressed that a nation’s companies must
relentlessly improve productivity in existing industries by raising product quality,
adding desirable features, and improving product technology (Porter 1990, p.
76).
Productivity is commonly defined as a ratio of a volume measure of output to a
measure of input. The unit of input can be labor hours (labor productivity) or all

12
production factors including labor, machines and energy (total factor of
productivity) (Atkinson 2013, p.4).
Figure 1.3. The productivity formula
From a mathematical point of view it looks quite simple (Figure 1.3). If it is
needed to improve productivity, it would be necessary either to reduce the input
or to increase the output. For instance, to gain access to cheaper sources of
raw materials or labor than is used. Unfortunately it is not so. This advantage
can only take place in the short term. It is well illustrated by the Russian
economy that was discussed above, but it has no relation to the definition of
productivity. Atkinson (2013) emphasizes that there are still misconceptions that
moving production, for example to China, can increase productivity. Even more,
"in fact, moving jobs to China might actually decrease productivity since firms in
China use fewer machines and are less efficiently organized than firms in the
United States". (Atkinson 2013, p. 4.)
In this context, the most comprehensive definition of productivity is the one,
which was formulated by Bernolak (1997):
"Productivity means how much and how well we produce from the
resources used. If we produce more or better goods from the same
resources, we increase productivity. Or if we produce the same goods
from lesser resources, we also increase productivity. By "resources",
we mean all human and physical resources, i.e. the people who
produce the goods or provide the services, and the assets with which
the people can produce the goods or provide the services" (Bernolak 1997,
p.204).

13
Productivity is observed as a significant success factor for organizational
operation in global and competitive situation (Tangen 2005, p. 4) and to be
probably the major area for operational and process management (Reid &
Sanders 2011, p. 5). In fact, according to the definition by Bernolak (1997), we
can say that the productivity is how the company is able to use their resources,
so it lies in the area of operational and process management.
At the same time, there is a consensus among researchers that performance
management is a significant component of continuous improvement and
successful management (Acur & Englyst 2006, p.74; A. Neely, Gregory, &
Platts 2005, p.1229). In terms of competitive operating advantages, QM (Quality
Management) policy is considered to be one of the major decision categories in
operations strategy (Reid & Sanders 2011, p. 174).
Considering the above arguments, as well as the conclusion made by McKinsey
in their study (McKinsey 2009), the main focus in this paper will be placed on
the study of continuous improvements (CI) as a likely source to increase
productivity in general.
1.3 Research aim and objectives
Hopefully, this study will have a practical implementation at SPPM (Sayssky
Pulp and Paper Mill). Thus the main aim is to reach understanding in theoretical
and practical approaches of continuous improvements in general. Firstly, the
aim is to find the reasons for using quality management, particularly in Russia.
Secondly, the objective is to determine which one could be suitable in case of
SPPM. Lastly, the target is to create the first steps or some roadmap for
implementation of the chosen approach.

14
1.4 Research questions
In this thesis the following questions will be examined:
1. Are there any obvious reasons and conditions for using CI initiatives in
Russia?
2. Which of them could be suitable in case of SPPM?
3. What are the first steps in the implementation of the chosen approach that
could be proposed to the company?
1.5 Research design
The research design (see Fgure 1.4.) was divided into three parts: the first part
is literature review that describes historical background, development of the
existing approaches as well as selecting strategies in an international practice
with aim to understand the philosophy and theory of CI. In the second part the
analysis of the preconditions in Russia was conducted. This analysis includes
historical background of the development quality management in Russia, then it
is a study of macro factors (social, economic, political, and technological
factors) by the PEST model. Finally, there is a cross-cultural analysis (Europe,
USA, Japan and Russia). The data set should bring the answer to the main
question of this work. The third part is assigned to the empirical study. The main
research tool is the case studies. Primarily, it is an internal case of Syassky
PPM. Internal company documents and interviews with staff will be used. Then,
there is the case of the company, which has successfully implemented a quality
management system. The case of KBR, which operates in the same industry
and in the same region that is very important for this study, was selected.
Lastly, the expert opinion was used in this study. The research conducted by
professor Samuel Ho, the leading expert in quality management, particularly in
area of 5S implementation was chosen. Mr. Ho worked for the companies in the
UK, Europe, the USA and Asia. As a result, an implementation roadmap for the
SPPM will be formed.

15
More detailed description of the research design will be given in section 3.
Figure 1.4. Research design.
1.6 Structure of the thesis
This thesis consists of nine sections, described as follows:
Section One investigates the research background and formulates the research
questions. It shows the objectives of this study as well as the research design
and used study tools.
Section Two reviews the literature on CI (e.g. the approaches to CI initiatives
together with their development and background). It also provides a theoretical
framework to the research including a review of theories, ideas adoption and
selection strategy.

16
Section Three describes the research design and methodology, explains and
justifies the chosen research activities.
Section Four analyzes the prerequisites for the use of CI initiatives in Russia.
The main research question will be answered here.
Section Five provides a presentation of the company SPPM. This chapter will
analyze the current situation of the company, using internal documents and
interviews with staff.
Section Six presents case of the KBR. This chapter will examine the experience
of the company, which has successfully implemented quality management in
the enterprise.
Section Seven shows the expert opinion, particularly professor Samuel Ho's
opinion about the chosen approach.
Section Eight collects all given data and analyzes it. The roadmap will be
designed in this chapter.
Section Nine summarizes the results.

17
2 Literature review
Section One briefly explained the research background and described the
research objectives. This section reviews the relevant literature, which
underpins this research and describes how this research relates to existing
works on continuous improvement.
According to Saunders et al, the literature review is required for each project. At
first, the preliminary search helps the author to generate and refine his other
research ideas. Secondly, project assessment criteria usually require the author
to demonstrate awareness of the current state of knowledge in the subject, its
limitations, and how the research fits in this wider context. (Saunders et al.
2009, p. 58.)
The purpose of this section is to get an understanding and definition of quality
management, in particular the continuous improvement. Basically there will be
explored definitions of continuous improvements, historical background,
development and existing approaches to quality management. Ultimately we
should get theoretical frameworks for this study.
2.1 Continuous improvement
Despite the fact that in literature there are many definitions of continuous
improvement, historically it is associated with Japanese method Kaizen. Kaizen
can be roughly translated from Japanese to mean "good change". This
philosophy assumes according to Imai that ‘’our way of life – be it our working
life, our social life or our home life – deserves to be constantly improved.’’(Imai
1997, p.1). Kaizen is a long-term approach to work that systematically seeks to
achieve small, incremental changes in processes in order to improve efficiency
and quality. One of the core principles of Kaizen is self-reflection of processes,
which is also known as “Feedback”. The purpose of CI is the identification,
reduction, and elimination of suboptimal processes, in other words is to become

18
efficient. Kaizen can be applied to any kind of work, but it is perhaps best
known for being used in lean manufacturing and lean programming. (Pankaj et
al. 2013, pp.57-58.)
In literature readers can come across the term "Continual" instead of
"Continuous". These terms are frequently used interchangeably, but some
quality authors make distinction. Hammer and Champy define continuous
improvement as subset of continual improvement, with a more specific focus on
linear, incremental improvement within an existing process. Some practitioners
also associate continuous improvement more closely with techniques of
statistical process control (Hammer & Champy 1993, p.46).
W. Edwards Deming, a guru in the quality field, determines Continual
Improvement broader in scope than continuous improvement. He refers this
term to general processes of improvement and encompassing “discontinuous”
improvements—that is, many different approaches, covering different areas
(American Society for Quality). In other words, continual improvement speaks to
the PROCESS of improvement (always and forever (continually) ongoing, in all
of its forms and in all areas) rather than the NATURE of the improvements.
"Continuous improvement" is common usage among business management, to
explain both meanings. It is merely the way the word has been conventionally
used in this context, in a common understanding that existed regardless of
prescriptive preferences. However, ISO (International Organization for
Standardization) has chosen the more careful usage Continual Improvement
Process (CIP) for its standards including ISO 9000 and ISO 14000 (ISO).
Research of CI has been mainly focused on defining the nature, its tools,
organizational issues required to support these initiatives, its applicability to
various types of organizations, implementation issues, and critical success
factors (Bhuiyan & Baghel 2005, p. 769). So they allocate two models of
behavior on continuous improvement initiatives. There are revolutionary and
evolutionary models.
Bessant et al. have argued that managing this process effectively depends
upon seeing CI not as a binary state or a short-term activity but as the evolution

19
and aggregation of a set of key behavioral routines within the firm (Bessant et
al. 1999, p. 75). Mandar Dabhilkar and Lars Bengtsson shared this position
adding that the evolutionary model of continuous improvement behavior stems
from a resource-based strategy view, and it has strong impact on plant
operating performance (Dabhilkar & Bengtsson 2004, p.125). Then Chen et al.
based on analysis of literature indentified three main areas of this model: (a)
standard problem detection-solving process, (b) leadership (c) organizational
learning (Chen et al. 2012, p. 3).
Some authors argue that in the face of shrinking product life cycles, a
prerequisite for continuous improvements are innovations. Sower and Fair
developed the concept of transcendent quality (transcendent approach) and
provided an argument for it’s being the fundamentally most important approach
to thinking about quality. They claim that focus almost exclusively on continuous
improvement may be blind to breakthrough (Sower & Fair 2005, p.8). The most
important role in this model is given to technology (Sower & Fair 2005, p.13).
At the same time Michael L. Tushman and Charles A. O’Reilly call the company
to be ambidextrous, i.e. who know how to properly combine in their work
efficiency with innovation activities, tactics and strategy, solution of large and
small problems (Tushman & O’Reilly 2013, p.3). Cole emphasizes that some
industry conditions give managers much stronger incentives, resources, and
constraints to use the one rather than the other model (Cole 2001, p.9). Since
continuous improvement is conventionally considered, then it is likely best in
slow-moving industries, while there is an industry where understanding of
continuous improvement is widened to think in terms of continuous innovation.
He stresses that in many situations, those firms that can find a way to do both
would be best off (Cole 2001, p.19).
The other example this sort of model is hybrid model, which was proposed by
Beenish Qamar. The proposed model exhibit both types of the revolutionary
and evolutionary changes, depending on the benefits and detriments related to
these change approaches (Qamar 2012, pp. 4-8).

20
2.2 Historical background and development
To better understand the existing approaches of continuous improvement, it is
necessary to trace the development of these initiatives. The initial attempts to
apply the quality management approaches were taken in the 1800s by several
companies, which encouraged any improvements carried out staff in order to
achieve better results. And in the late 1800s early 1900s some companies
already used scientific approaches to standardize certain processes, such as
the development of norms of piecework wages (Bhuiyan & Baghel 2005, p.
762). In that time Taylor, an American engineer, founder of the scientific
organization of labor and management, suggested doing work tangible and
measurable through analyzing manufacturing processes and separating them
into a set of tasks, which could be standardized and repeated. His techniques
became the basis of scientific management (Rath & Strongs\Management
Consulting 2003, p. 5). In 1913 Henry Ford adopted these ideas to his the first
moving assembly line used for large-scale manufacturing. It was the first model,
which became later famous as Just-in-Time model and Lean Manufacturing
(Rath & Strongs\Management Consulting 2003, p. 6).
In the 1920s Walter Shewhart was involved in project at Western Electric
Corporation in Rochester, New York where he was investigating ways of
improving the economics of the electromechanical relay manufacturing lines at
Western Electric. Shewhart started using the emerging science of applied
statistics to see if issues causing process variations might be identified and
fixed before leading to the production of defective parts. As a result of this
work, he founded theory and approach to continuous improvement, which
became the foundational work for the Statistical Quality Control (SQC)
movement, the Total Quality Management (TQM) movement. (PP&S White
paper 2013, p.3.)
The next stage in the development of quality management refers to Japan. It
covers period from 1947 to the end of the 1970s. Sometimes that period call
"quality Japanese miracle"(Paraschivescu 2013, p.44). At this particular time
were laid down the basics of what we today call TQM, which are often linked to

21
people like Edwards W. Deming, Joseph M. Juran and Kaoru Ishikawa.
Japanese companies developed their own approaches based on works of these
people (Bergquist, Garvare, & Klefsjö 2007, p.256). Much of the Japanese
success was based on the three fundamental tenets of Juran (Klefsjö, Bergquist
& Edgeman 2006, p.164). He developed numerous quality theories, two
concepts in particular serve as the basis for establishing a traditional quality
system and to support strategic quality management – Juran’s Quality Trilogy
for managing quality (quality planning, quality control and quality improvement)
and his Quality Planning Roadmap (Juran & Godfrey 1998, pp.2.5-2.7). As a
result of these efforts, we can say that the economic growth and manufacturing
dominance of Japanese industries in the 1980s can be attributed to the
successful application of TQM in Japan (Klefsjö, Bergquist & Edgeman 2006,
p.165).
The quality revolution in the West began as a backlash to the Japanese
success. Total quality management (TQM) became the centre of these drives in
most cases since 1980s (Martínez-Lorente, Dewhurst & Dale 1998, p. 379).
TQM has developed in many countries into holistic frameworks, aimed at
helping organisations achieve excellent performance, particularly in customer
and business results. In Europe, a widely adopted framework is the so-called
“Business Excellence” or “Excellence” Model, promoted by the European
Foundation for Quality Management (EFQM), in the UK by the British Quality
Foundation (BQF) in the US the Malcolm Baldrige National Quality Award
created by an Act of Congress (Fisher & Nair 2009, p.11). These programmes
focus on pre-production activities and rely on quality standards or instructions to
assist with the reduction of the risk of failures and mistakes in the processes
used to produce a product or service (Bergquist, Garvare & Klefsjö 2007,
p.254). Despite the large number of such programs ISO standarts have become
the most internationally recognised (Thawesaengskulthai 2007, p. 18) . ISO is a
series of quality management systems (QMS) standards created by the
International Organization for Standardization, a federation of 132 national
standards bodies. The ISO 9000 QMS standards are not specific to products or
services, but apply to the processes that create them. The standards are

22
generic in nature so that they can be used by manufacturing and service
industries any- where in the world. (ISO 2014.)
As we see throughout the history there have been several stages in the
development of the quality movement. Although in literature a lot of definitions
of quality management, mostly authors agreed that we could divide whole
development into four eras. According to Dale et al. (see Figure 2.1.) there are
Inspection, Quality Control (QC), Quality Assurance (QA) and Total Quality
Control (TQM)(Dale et al. 2007, p. 23-24).
However, some researchers say that we can now distinguish the fifth era is
continuous improvement, which tends to overlap with issues such as
sustainable business development, the environment and interest groups
(Bergquist et.al. 2012, p.12; Thawesaengskulthai 2007, p.14).
Other researchers believe that further development of quality management will
lie in the field of innovation and technology (Cole 2001, p.19).
Figure 0.1. Four stages in the evolutions of QM (Dale et al. 2007, p.24)

23
2.3 Existing approaches of CI
The PP&S company distinguishes as a result of the development quality
management initiatives, the following methods for quality improvement in use
today that cover product-, process- and/or people-based improvement:
• ISO – guidance on use for process improvement and process capability
determination.
• QFD – quality function deployment, also known as the House of Quality
approach, that focuses on customer wants or needs in the (re)design of a
product or service.
• Kaizen – Japanese for change for the better; the common English term is
continuous improvement.
• Zero Defect Program – created by NEC Corporation of Japan, based
upon statistical process control and one of the inputs for the inventors of Six
Sigma.
• Six Sigma – combines established methods such as statistical process
control, design of experiments and failure mode and effects analysis (FMEA) in
an overall framework.
• PDCA – Shewhart/Deming's plan, do, check, act cycle for quality control
purposes. Six Sigma's DMAIC method (define, measure, analyze, improve,
control) may be viewed as derivation of this.
• Taguchi methods — statistical oriented methods including quality
robustness, quality loss function, and target specifications.
• The Toyota Production System – reworked in the west into “Lean
manufacturing”.
• TQM – total quality management is a strategy aimed at embedding
awareness of quality in all organizational processes. First promoted in Japan
with the Deming prize, it has been adapted in the U.S. as the Malcolm Baldrige

24
National Quality Award and in Europe as the European Foundation for Quality
Management award (each with their own variations).
• BPR – business process reengineering, a management approach aiming
at 'clean slate' improvements (abandon existing practices). (PP&S White paper
2013, p.5.)
Gershon also identifies a variety of existing techniques such as Six Sigma,
Lean Management, Lean Six Sigma, Agile Management, Re-engineering, Total
Quality Management, Just-In-Time, Kaizen, Hoshin Planning, Poka-Yoka,
Design of Experiments, and Process Excellence (Gershon 2010, p 61).
At the same time, a numerous of authors discuss that nowadays most of the
companies use or should use a combination of methods (Thawesaengskulthai
2007, p. 22). Thawesaengskulthai based on literature review found out that so
called "blending recipe" mainly centres around TQM and Six Sigma
programmes and the ‘other ingredients’ which are typically suggested as
appropriate (Thawesaengskulthai 2007, p. 23). Bhuiyan & Baghel also confirm
this view, stating the assumption that the combination of programs helps to
overcome the weaknesses of one program or another resulting in a combined
CI program that is more far reaching than any one individually (Bhuiyan &
Baghel 2005, p. 765). They describe a combination of Lean Manufacturing and
Six Sigma as the most well-known (ibid).
Pirasteh shares this opinion. According to his research, over 95% of all
continuous improvement initiatives are based on one of the three
methodologies. The most widely known and used methodologies that produced
significant results are Lean Thinking, Six Sigma and Theory of Constraints
(TOC). These continuous improvement approaches have shown considerable
tangible impact at a large number of companies, including: Toyota, Motorola,
GE, GM, Boeing, Intel and the US Navy & Air force. (Pirasteh & Fox 2010,
p.260.)

25
Having taken into account these statements I will study the three approaches as
the most useful and famous among researchers, exactly Lean Thinking, Six
Sigma and hybrid model Lean Six Sigma.
2.3.1 Lean thinking
As I mentioned above, Henry Ford was the founder of system, which latter
became more famous as Lean Manufacturing or Lean Thinking, when he
established the concept of mass production in his factories. The Japanese
adopted lean manufacturing and improved it (Bhuiyan & Baghel 2005, p. 763).
This adoption refers to Toyota Motor Company, where Taiichi Ohno, former
executive vice president of Toyota, developed the methodology Toyota
Production System (TPS) focuses on improving workflow to reduce waste,
which in turn, will improve business performance. It is a systematic approach to
identifying and eliminating waste through CI by following the product at the pull
of the customer in pursuit of perfection (ibid).
Seven main types of wastes were identified as a part of the Toyota Production
System (El-Namrouty & Abu Shaaban 2013, pp. 70-71):
1. Overproduction, it is unnecessary to produce more than needed.
2. Too much inventory. Work in progress that is idle is inventory. Wait time
accounts for much of the total cycle time in most transactional processes.
3. Unnecessary motion. It includes any unnecessary physical motions or
walking by workers, which divert them from actual processing work
4. Unnecessary transportation. It includes any movement of materials that does
not add any value to the product, such as moving materials between
workstations.
5. Over processing. It means work that could be combined with other work.
6. Producing defects or rework & duplication.
26
7. Waiting of both people and parts (standing time and delay time). (ibid.)
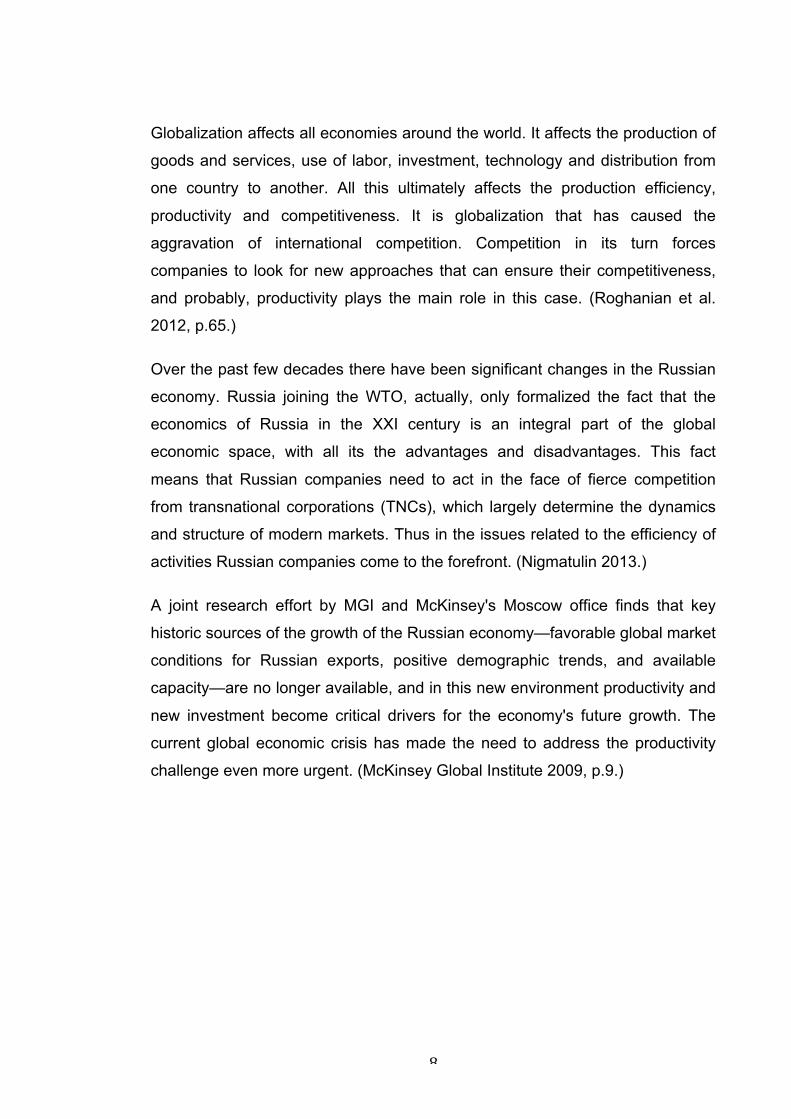
Lean manufacturing has deal with Five Primary Elements (see Figure 2.2.)
there are Manufacturing Flow, Organization, Process Control, Metrics, and
Logistics (Feld 2001, p.4).
Figure 0.2. Five Primary Elements (Feld 2001, p.5)
What does it mean? In other words, it adheres to the following principles: focus
on customers perspective; process and value flows mapping; continuous flow of
material and information across the business units; focuses on a pull system by
the customer; commitment of all the organization to the continuous
improvement (Sanchez 2012, p.16).
Lean thinking based on the idea of Just-in-Time (JIT), but Lean thinking
includes two extra features. One comes from the organizational structure of the
company, where eliminates many levels of management, bringing everyone
closer to the processes. The second feature is a strong process analysis
orientation, where every step in the work processes is evaluated. It is important
that processes should add value, trying to reduce or eliminate those that don’t.

27
This is more structured than JIT, but this process analysis is the same, to
eliminate the waste in the process. (Gershon 2010, p 66.)
Lean manufacturing unites a set of interrelated dimensions, where concepts
and initiatives support each other to continuously identify and reduce waste
(Sanchez 2012, p.17). In this case company should apply several techniques
and tools to support this method. One of them is the 5 S. This tool came from
Kaizen. The 5S model consists of five elements where the capital letters begin
from S. These are:
- seiri-(selection): proper (suitable) preparation of a workplace, manner and
instrument of work; with the elimination of everything useless,
- seito-order (systemic): tidiness in a workplace and preparation of every
required tools in the manner enabling simple and quickly utilization,
- seiso-clearness (cleaning): order in a workplace allowing on increase of safety
of workplace, control of equipment and responsibility for the means of
production
- seiketsu-consolidation (standardisation): reminding employees about their
duties in the aspect of care of used tools and equipment and about keeping the
workplace order,
- shitsuke- discipline (self-discipline): adaptation of employees to the principles
accepted by the organization, independent elimination of bad custom, training.
(Pankaj et al. 2013, p.59.)
The main tasks of the 5s are to reduce costs, increase quality, and improve
safety by sorting useable elements from non useable ones, simplifying work
stations, sweep tidiness of the area ensuring an accurate performance of
equipment, standardize work procedure, and sustain the housekeeping
activities to continuously reach efficiency (Sanchez 2012, p.17). Another tool to
reduce idle time is total productive maintenance (TPM) to improve machine
availability and a better utilization of maintenance and production resources
(ibid).

28
Lean thinking affects every aspect of the organization and leads to a complete
cultural change for the organization. To implement it successfully, a company
does not need sophisticated systems, but it requires are correct attitude,
employee involvement, and continuous improvement (Reid & Sanders 2011, p.
255). Reid & Sanders define the following steps in the implementation process
JIT, which they consider to be similar to lean thinking (Reid & Sanders 2011,
p.232): 1) Make quality improvements; 2) Reorganize workplace; 3) Reduce
setup times; 4) Reduce lot sizes and lead times; 5) Implement layout changes;
6) Switch to pull production; 7) Develop relationship with suppliers (Reid &
Sanders 2011, pp. 255-256).
For the successful implementation Sanchez also offers to use certain metrics
(see Table 2.1.), which will help the company to maintain continuous
improvement (Sanchez, 2012, p.18).
Table 0.1. Lean Manufacturing Metrics (Sanchez 2012, p.18)
Researchers call many advantages of this method. Among them are reduction
in inventory, improved quality, reduced space requirements, shorter lead times,
lower production costs, increased productivity, increased machine utilization,
greater flexibility (Reid & Sanders 2011, p. 254). However, this methodology is
sometimes criticized for ignoring the customer perspective, as well as
underutilizing statistical/systems analysis (PP&S White paper 2013, p.7)

29
2.3.2 Six Sigma
Six Sigma takes the roots from the 1980 when Robert Galvin, at that time CEO
at Motorola, realised the importance of working systematically with variance
reduction. Together with Bill Smith, Mikel Harry and Richard Schroeder, they
created an improvement program that was given the name Six Sigma (Klefsjö
et al. 2006, p.168). Sigma, σ, is a letter in the Greek alphabet used by
statisticians to measure the variability in any process. A company’s
performance is measured by the sigma level of their processes. Traditionally,
companies accepted three or four sigma performance levels as the norm,
despite the fact that these processes created between 6,200 and 67,00
problems per million opportunities (Gershon 2010, p 64). Bill Smith came up
with the idea of inserting hard-nosed statistics into the blurred philosophy of
quality. The program was inspired by Japanese work, but also strongly
influenced by Jurans thoughts. Due to Six Sigma, Motorola managed to reduce
their costs and variation in many processes and were an inaugural winner of
Americas Malcolm Baldrige National Quality Award in 1988 (Klefsjö et al. 2006,
p.168).
The term ‘Six Sigma’ derives from the original goal of having no more than ‘3.4
defects per million opportunities’ in products, processes or service operations.
The formal statistical formulation is as follows: Suppose you have a process
variable that is normally distributed with some mean and standard deviation.
Further, suppose the process mean can drift over time within 1.5 standard
deviations. Then, if the process is within ‘Six Sigma’ limits, one will get no more
than 3.4 defects per million parts, operations, etc. (Fisher & Nair 2009, p.10.)
So we can formulate the definition of Six Sigma as an organized and systematic
method for strategic process improvement based on statistical methods and the
scientific method to make dramatic reductions in the customer defined defect
rates, in attempt to minimize defects to the level of accepting close to zero was
and focuses on reducing variation in all the processes of the organization
(Bhuiyan & Baghel 2005, pp. 764-765).

30
According to Reid & Sanders there are two aspects to implementing the Six
Sigma concept. The first is the use of technical tools to identify and eliminate
causes of quality problems, and the second aspect of Six Sigma
implementation is people involvement (Reid & Sanders 2011, p.208).
An important part of Six Sigma related to the first aspects is the DMAIC
procedure (see Figure 2.3.):
Step 1: Define the quality problem of the process.
Step 2: Measure the current performance of the process.
Step 3: Analyze the process to identify the root cause of the quality problem.
Step 4: Improve the process by eliminating the root causes of the problem. Step
5: Control the process to ensure the improvements continue. (Reid & Sanders
2011, p.208.)
Figure 0.3. DMAIC model (Sai Global)

31
It can be coordinated with other major initiatives and systems, such as new
product development, materials requirement planning (MRP), and just-in-time
(JIT) inventory control (Bhuiyan & Baghel 2005, p. 765).
Six sigma initially was thought of as a system that could be used only in
manufacturing operations, but more recently it has proven to be successful in
nonmanufacturing processes as well, such as accounts payable, billing,
marketing, and information systems (Bhuiyan & Baghel 2005, p. 767).
The benefits, which linked to Six Sigma are increased understanding of
variation and its relation to defect levels and process yield; the relationship of
process steps to defect rates; focus on production and service design; and
improved understanding of the relationship between defect performance and
financial performance (Reid & Sanders 2011, p. 209).
Six sigma programs is increasingly considered a mission-critical best practice,
even among mid-sized and smaller firms. After the evolution of lean
manufacturing many companies such as GE, ABB, Honeywell, Sony, Honda,
and Ford have followed Motorola’s lead and have been using six sigma to
achieve their company’s unprecedented goal (Bhuiyan & Baghel 2005, p. 764).
At the same time, the rapid growth of Six Sigma in America and slower growth
in the rest of the world may indicate that Six Sigma is better suited to the
American way of doing business (Klefsjö et al. 2008, p.121). It has also been
criticized for potential negative effects such as ignoring the customer, stifling
creativity (especially in research) and being oversold or inappropriately applied
by consultants (PP&S White paper 2013, p.6).
2.3.3 Lean Six Sigma
To get a bigger share of the market was developed a new methodology called
lean six sigma by some big companies. Lean six sigma is a relatively new
methodology, and as such, has not been studied in great detail (Bhuiyan &
Baghel 2005, p. 765).

32
There is a set of benefits, which could bring this hybrid model. On one hand
Lean firms should take advantage of statistical analysis and quantitative data
for decision-making. On the other hand Six Sigma has been utilized as a cost
reduction technique by improving quality (Sanchez 2012, p.20). Lean
manufacturing and six sigma individually cannot achieve the required
improvements at the rate at which lean six sigma can, and using this
combination, greater value to the customer can be provided (Bhuiyan & Baghel
2005, p. 765). You can find some integration steps in accordance with Sanchez
in Table 2.2.
Table 0.2. Integration steps of Lean Thinking and Six Sigma (Sanchez 2012, p.20)
However company could meet the number of challenges, which were
highlighted by Sanchez. First of all, there is a need for the implementation to be
defined as a strategy and focus on process. Secondly, there has to be a
balance between the both methodologies to obtain the largest amount of
benefits from both lean and Six Sigma. Lastly, a balance must exist between
complexity and sustainability, since some problems are unique and will require
the application of different tools. (Sanchez 2012, p.21.)
Sanchez also identified some limitations in implementing lean Six Sigma
methodology. One limitation is the balance required between statistical tools
and creative solutions. Then the second limitation of implementing the lean Six
Sigma is the large set of tools available, which sometimes results in difficulty for
a professional when choosing the correct tool for application in the business
environment. And the third difficulty is the uneven level of mathematical and
33
statistical knowledge, which make the lean Six Sigma tools more challenging for
some employees. (Sanchez 2012, p.21.)
2.4 Comparison existing approaches
Throughout the world, the company has achieved leadership use strategies that
differ from each other, but the principles of activity, the nature and development
of all successful companies are the same. The main driver is always
competition. Companies achieve competitive advantage due to innovations.
They approach to understanding innovation in the broadest sense, using both
new technologies and new ways of business and working processes. Having
reached these advantages the company is able to hold them only through
continuous improvements. According to Porter, "the creation of more
sustainable advantages often means that the company should be regarded as
obsolete advantages, even if they are still advantages" (Porter 1990, p. 78). In
other words, the only possibility to retain a competitive advantage is continuous
improvement (ibid).
Summing up the literature review, we can say that continuous improvement is
the company's aspiration to become effective. In turn, efficiency of the company
is determined by its ability to control costs and wastes through the optimization
of existing processes on the one hand and meet the demands and expectations
of consumers, in other words is ability to control the quality, on the other hand.
During the development of continuous improvement has been developed a wide
variety of methods and models corresponding to the solution of certain
problems. But somehow all methods are based on the main principles:
- Reduction of waste and defects
- The processes and standardization
- Customer focus
- Involvement of all employees in process improvement
- Continuity of action

34
As a summary, specific characteristics for each of the approaches are listed in
the Table 2.3., which was developed by Dr. Zoe Radnor. ISO 9000 is not
included in this list as it is an accredited standard rather than an approach in
itself (Radnor 2010, p.23).
The history of the development of quality management shows that the
emergences of new methodology occur in response to the new challenges of
the environment. New approaches complement the existing tools, depending on
the stage of development of the company and solved problems. We can not say
that this or that model is a versatile tool for the construction of quality
management in the company. Furthermore, many researchers are inclined to
believe that the company should use a combination of models.
Thawesaengskulthai in the literature review devoted to the selection of
technology implementation of continuous improvement pays attention to the
diversity of approaches. The most promising in her opinion are Bendell (2005);
Ho (1999); Krasachol (2000) (Thawesaengskulthai 2007, p.29).
The methodology by Bendell (2005) starts from a company’s problem and links
it to the initiative’s main benefit i.e. if the main issue for a company is market
pressure, it should adopt ISO9001, if it is chronic waste, then Lean would be
more suitable, if it is variation problem, then implement Six Sigma. When it is a
people issue, Investors in People will solve it. The TQM Excellence model by
Ho (1999a) suggests a sequence of adoption starting from 5S, BPR, QCC, ISO,
TPM and TQM (see Figure 2.4). The QM framework by Krasachol (2000) also
propose five stage of QM implementation starting from no tools in the unaware
stage, to 5S, QC, GMP in the basic stage, ISO 9001, SPC, 7QC tools in the
developing stage (Thawesaengskulthai 2007, p.29).

35
Table 0.3. Characteristics and Comparison of Business Improvement Techniques (Radnor 2010, p.24)

36
Figure 0.4. Prescriptive approach to the selection of QM techniques (Thawesaengskultai 2007, p.30)
If look at the proposed approaches, one may find that the first step how to start
choice of the techniques it is the determination what is the main internal
problem and what is the existing stage of the development quality management
of the company at this moment. Thus, for the success of the selection of a
particular technique is necessary to understand the current situation in the
company and clearly define the basic problem. In addition, using a combination
of different methods it allows to neutralize the shortcomings of a single
methodology.

37
3 Research strategy and methodology
In this section I will describe the strategy of this study and give the explanation
choosing methodology. According to Creswell, in the process of making-
decision how we should form the research design, there are three questions,
which we could keep in mind:
1. What knowledge claims are being made by the researcher (including a
theoretical perspective)?
2. What strategies of inquiry will inform the procedures?
3. What methods of data collection and analysis will be used?( Creswell 2003,
p.5)
Basically, these questions or framework of research design could be
categorised into the following steps: a) philosophical assumptions, b) strategy
inquiry, and c) methods (Creswell 2003, p.23).
3.1 Philosophical assumption
I start with the purpose of this study. The aim is to get deep understanding in
existing approaches of Continuous Improvement and identify which of them
could be suitable in case of SPPM. In other words, the purpose of research is to
find solutions to real-world problems in a manner that the solutions are
generalizable, and to see the knowledge that is gained through this research
could be transferred into a change in practice. That is to find “whatever works”
to answer the research question. Hence, the most appropriate is a pragmatic
approach.
What does it mean? Pragmatism is a deconstructive paradigm that advocates
the use of mixed methods in research, “sidesteps the contentious issues of truth
and reality” (Feilzer 2010, p. 8), and “focuses instead on ‘what works’ as the
truth regarding the research questions under investigation” (Tashakkori &
Teddlie 2003, p. 713). Creswell has summarized the works of researchers and
has identified the main ideas of this approach:

38
- Pragmatism is not committed to anyone system of philosophy and reality.
- Individual researchers have a freedom of choice. They are "free" to choose the
methods, techniques, and procedures of research that best meet their needs
and purposes.
- Pragmatists do not see the world as an absolute unity. In a similar way, mixed
methods researchers look to many approaches to collecting and analyzing data
rather than subscribing to only one way (e.g., quantitative or qualitative).
- Truth is what works at the time; it is not based in a dualism between reality
independent of the mind or within the mind.
- Pragmatist researchers look to the "what" and "how" to research based on its
intended consequences-where they want to go with it.
- Pragmatists agree that research always occurs in social, historical, political,
and other contexts. (Creswell 2007, p.23.)
In other words, pragmatism asserts that concepts are only relevant where they
support action. This means that the most important determinant of your position
on each of the continua is the research question – one position may be more
appropriate than another for answering a particular question (Saunders et al
2009, p.109). The importance of research finding is the practical consequences.
Pragmatists recognize that there are many different ways of interpreting the
world and undertaking research, that no single point of view can ever give the
entire picture and that there maybe multiple realities (ibid). Given all this, a
pragmatic philosophical assumption was chosen for this study.
3.2 Research strategy
According to Crotty, starting point in developing a research proposal is to
identify the methodologies which relate to “the strategy, plan of action, process
or design lying behind the choice and use of particular methods, and linking the
choice and use of methods to the desired outcomes” (Crotty 1998, p.3).

39
The justification of the choice of methodologies lies in answering the questions
posed for the research (Saunders et al 2009, p.136). Yin categorizes the types
of the questions for the different research strategies using a basic
categorization scheme for the types of question: ''who,'' "what," ''where,'' "how,"
and "why."(see Table 3.1.)
Table 0.1. Relevant Situations for Different Research Strategies (Yin 2003, p.6)
Yin also highlights the importance of context. For instance, within a case study,
the boundaries between the phenomenon being studied and the context within
which it is being studied are not clearly evident. This is the complete opposite of
the experimental strategy, where the research is conducted within a highly
controlled context. It also differs from the survey strategy where, research can
try to deal with phenomenon and context, but their ability to explore and
understand this context is limited by the number of variables for which data can
be collected. (Yin 2003, p.13.)
This study was focused on three Specific Research Questions. These were:
1. Are there any obvious reasons and conditions for using CI initiatives in
Russia?
2. Which of them could be suitable in case of SPPM?
3. What are the first steps in the implementation of the chosen approach that
could be proposed to the company?
Here we can find two types of questions. There are - "what "and "how".
According to Yin (2003), the most suitable strategy to these types of questions
is survey, but at the same time if you wish to gain a rich understanding of the
context of the research and the processes being enacted, the choice of the

40
case study strategy will be preferred and the case study strategy also has
considerable ability to generate answers to the question ‘why?’ as well as the
‘what?’ and ‘how?’ questions, although ‘what?’ and ‘how?’ questions tend to be
more the concern of the survey strategy. (Saunders et al 2009, p.146.)
3.3 Research methods
3.3.1 Pest analysis
The answer to the main question of this work somehow lies in the analysis of
external environmental factors as well as national culture and historical
background of the development of quality management in Russia. This defines
the ability or opposite views on the use of the advantages which quality
management provides.
The components normally considered part of the general environment are
economic, technological, social and political (Gupta 2013, p.013). The analysis
of these factors is called PEST analysis, which is an acronym for external
environmental factors (P)olitical, (E)conomic, (S)ocial and (T)echnological
(Ward & Rivani 2005, p.11) . This type of analysis is very often used in business
issues, especially for developing a sustainable competitive advantage;
identifying opportunities and threats (Yüksel 2012, p.53). But also the analysis
could be used as a tool to identify narrower contexts and focus research
questions on feasible and meaningful regional contexts (Peng & Nunes 2007, p.
230).
National culture refers to the issues of macro environmental factors. It is often
considered among the socio-cultural factors, but in the context of the
implementation of quality management, this factor is crucial. According to
Abbas Mardani and Mansooreh Kazemilari there is a link between national
culture and TQM elements. They state that cultural influence not only comes
from organization culture but also from national culture and culture influences
the understanding of core TQM concepts in a country and it also has an effect

41
on the operationalisation of TQM. They found substantial results that “power
distance”, “long-term orientation” and “individualism” are more critical elements
that can impact the TQM implementation effort (Mardani & Kazemilari 2012,
p.304).
Hence, the combination of PEST analysis and cross-cultural analysis was
chosen to give an answer to the main research question.
3.3.2 Case study
To answer the second research question, as noted in the literature review, to
determine the most appropriate techniques, it is necessary to understand the
current situation and the main problem of the company. According to Saunders
(2009), a case study is considered to be an intensive and holistic description
and analysis of a restricted phenomenon, thus case studies will be the most
appropriate method (Saunders 2009, p.146). But a single case is usually used
where it represents a critical case or, alternatively, an extreme or unique case
(ibid). In this case the evidence from multiple-cases is often considered more
compelling, and the overall study therefore regarded as being more robust than
a single-case study (ibid). The rationale for using multiple cases focuses upon
the need to establish whether the findings of the first case occur in other cases
and, as a consequence, the need for synthesis from these findings. Therefore
the multiple-case design was chosen.
The overall criterion for selecting the cases was that the organisation should
have successfully implemented TQM. In order to find something that "really
works", and in accordance with the philosophy assumption, it was necessary to
choose the companies working in this industry and in similar conditions. In
accordance with these criteria, the case of KBR was selected. KBR is a
company that is situated in Svetogorsk, Leningrad region. The company is the
general contractor of International Paper. KBR carries out maintenance of
equipment and processes. More details about the company will be discussed in
Section 6 of this study.
42
3.3.3 Interview
Marshall and Rossman (1999) defined interview as "a useful way to get large
amounts of data quickly" (Marshal & Rossman 1999, p. 108). According to YIN
(2003) one of the most important sources of case study information is the
interview: "most commonly, case study interviews are of an open-ended nature,
in which you can ask key respondents about the facts of a matter as well as
their opinions about events" (YIN 2003, p.90). Ritchie (2003) describes
individual interviews as a probably the most widely used method in qualitative
research. She highlights that interviews are particularly well suited to research
that requires an understanding of deeply rooted or delicate phenomena or
responses to complex systems, processes or experiences because of the depth
of focus and the opportunity they offer for clarification and detailed
understanding (Ritchie & Lewis 2003, p.36). Saunders et al. (2009) said the use
of interviews can help to gather valid and reliable data that are relevant to
research objectives. Semi-structured and in-depth interviews are used in
qualitative research not only to reveal and understand the 'what' and 'how' but
also to place more emphasis on explaining the 'why'. Also, semi-structured
interviews can be most appropriate for situations where the questions are either
complex or open ended or where the order and logic of questioning may need
to be varied from one to another interviewee, as well as depth interviews can
help the researcher to understand the meanings that people hold for their
activities (Saunders et al., 2009, p.324).
From the above discussion semi-structured interviews were chosen as a main
source of data collection in this research. To obtain a general perspective on
QM implementation, the top management and middle management of various
directorates in the two case studies were interviewed. There are two cases, one
is directly the case of the company Syassky PPM, which this work focuses on
and the case of KBR, which is mentioned above.

43
3.3.4 Expert opinion
According to Saunders et al. (2009), if you are using a case study strategy you
are likely to need to use and triangulate multiple sources of data (Saunders et
al. 2009, p. 146). Triangulation is a method used to determine the location of a
fixed point based on the laws of trigonometry. These laws state that if one side
and two angles of a triangle are known, the other two sides and angle of that
triangle can be calculated. Triangulation extended beyond its mathematical
roots in the 1970s when it began to be used as a sociological method (Hale
2010, p. 13).
Triangulation refers to the use of different data collection techniques within one
study in order to ensure that the data are telling you what you think they are
telling you (Saunders et al. 2009, p.146) Norman Denzin differentiates between
four different types of triangulation: triangulation of data (involving time, space,
and person), investigators (it consists of the use of multiple, rather than single
researcher), theories (it consists of using more than one theoretical frame in the
interpretation of the phenomenon) and methodologies (it involves using multiple
methods) (Hale 2010, p. 14).
In principle, one of the most powerful methods for developing informative priors
is to synthesise the information from an expert. Despite the fact, that expert
opinion has complex, subjective nature and, there has been no formally
established methodology for treating expert judgment, using of expert judgment
is critical, and often inevitable, when there are no empirical data or information
available on the variables of interest (Ouchi 2004, p. 2). Expert opinion is often
necessary in forecasting tasks because of a lack of appropriate or available
information for using statistical procedures (Rowe & Wright 2001, p. 125).
Considering the strategies and goals of the study, data triangulation approach
would be most appropriate. To complete the triangulation approach of the data
collection for this research the expert opinion of professor Samuel Ho, the
leading expert in quality management, particularly in area of 5S implementation,
will be used.

44
3.4 Data analysis
According to Saunders et al. (2009) qualitative data analysis procedures
include both deductive and inductive approaches, range from the simple
categorisation of responses to processes for identifying relationships between
categories (Saunders et al. 2009, p.480). Yin (2003) maintains that data
analysis consists of "examining, categorizing, tabulating, testing, or otherwise
recombining both quantitative and qualitative evidence to address the initial
propositions of a study" (Yin 2003, p.109).
Kohlbacher (2006) argued that the qualitative content analysis could prove to
be a useful tool for analyzing data material in case study research (Kohlbacher
2006, p.24). He points that one of the key features of the qualitative content
analysis in contrast to the classical quantitative content analysis is that the
context is also central to the interpretation and analysis of the material. It is not
only the manifest content of the material that is important but also the latent
content as well as formal aspects need to be taken into consideration
(Kohlbacher 2006, p.25).
According to Kohlbacher (2006), the object of the qualitative content analysis
can basically be any kind of recorded communication. Furthermore, qualitative
or expert interviews are a very common field of application for qualitative
content analysis. Hence in a comprehensive study, which aims at analyzing
different kinds of data material, the same method can be applied to different
types of evidence—a major advantage not only from a pragmatic point of view,
but also as far as quality criteria are concerned. Therefore, the qualitative
content analysis can be viewed as a comprehensive approach to the data
analysis, which seems to be especially suitable for case study research. It can
certainly contribute to adding and enhancing rigor, validity and reliability of case
study research. (Kohlbacher 2006, p.27.)

45
4 Analysis of the preconditions in Russia
In this section the author will try to find out if there are preconditions for the
implementation of quality management systems in Russia. First of all, the
author will address to the historical aspects, in order to understand whether
there were attempts to implement quality management systems in the prior
years. What were these attempts and what they brought in general. Then the
author will try to understand what opportunities exist today, which are dictated
by factors of external macro environment. Separately, the issue of the cultural
features will be studied, as it deeply influences the success of the
implementation of such systems.
4.1 Historical background
The Soviet school of quality takes its roots from the military sector of economy.
In the late 20s of the XX century, the development of manufacture and an
increase in output of the enterprises, mostly military factories, led to the
necessity to create specialized structures for supervision and quality control
such as the Department of Technical Control (OTK –Russian abbreviation)
(Mishin 2005, p. 29).
In the 1950s new requirements for product quality especially for the military
purposes, resulted to the further development of the individual elements of
quality management and the introduction of more sophisticated methods.
Quality management was implemented in industries providing scientific and
technical progress, such as radio engineering, chemistry, aviation, military
missilery. At that time, some approaches have were developed. The most
famous (since 1955) quality assurance techniques were named as a system:
- Saratov system zero-defect manufacturing of products (BIP)
- Gorky KANARSPI system (quality, reliability, resource, from the first products)
- Rybinsk system scientific organization of labor, production and management
(NOTPU)
46
- Yaroslavl system scientific organization of operations on increasing the motor-
resource of drivers (NORM)
- Lvov system of the defect free labor (SBT). (Mishin 2005, p. 29.)
These systems were a powerful means to improve product quality. Since 1962,
similar systems have begun to be introduced in the GDR and Poland, as well as
in the US, Germany, Japan and other countries. In principle, BIP system was
embodied in the foreign programs "zero defect" (Kane et al. 2008, p.11).
However, all these systems had significant drawbacks. Firstly, the limited scope
was used in the product life cycle. Secondly, it did not cover all functions and
activities (e.g. marketing). The most significant drawback was lack of an
integrated approach to manage quality and insufficient use of funds in the form
of quality management standardization. It should be noted that virtually all of
these systems as a control object provide more quality of work, not the quality
of products and services. (Mishin 2005, p.30.)
The next step in the development of quality management systems was the
transition to complex systems. In the early 70's, Gosstandart in cooperation with
experts in Lvov created a comprehensive system of quality control (KSUKP).
The system is based on the principle of enterprise standards as internal
organizational, regulatory and legal framework for the functioning of the system
of quality management. And already in 1978 by Gosstandard was developed
and approved the Basic Principles of the Unified State System of Quality
Control (ESGUKP) and later GOST (Kane et al. 2008, p.15).
Further development of the systems covers a larger range of issues. So in the
1980s, in Dnepropetrovsk were developed KSUKP and EIR (comprehensive
quality management system and efficient use of resources), and then in
Krasnodar was presented comprehensive system to improve production
efficiency (KSPEP). KSUKP and EIR and KSPEP got generic name - Integrated
systems to improve production efficiency and quality of work (KSPEP and KR)
(Kane et al. 2008, p.18).

47
Thus, for several decades the improvement of the quality of products at the
enterprises of the USSR were associated with the creation of these system of
quality control, but a significant shift in this area did not happen. This gave rise
to the view that the systems of quality control and, in particular, complex
systems are not effective and enterprises should not deal with them. However,
such findings have been made without a thorough analysis of the real roots
caused of poor quality. (Kane et al. 2008, p.19.)
The planning and administrative system of economic management in those
years has not stimulated the process of creating high-quality products. The
largest disadvantages were monopoly in the production of many kinds of
products; the primary responsibility of companies and their leaders is production
capacity, which is often achieved by reducing the product quality and was not
backed by adequate resources; pricing mechanism and other factors. (Kane et
al. 2008, p.19.) One can say that the company, on the one hand, is not
encouraged to improve the quality of products and, on the other hand, may well
exist making products with low quality. In other words, customers could not opt
for purchasing one product or service as opposed to another or as noted in
Russia ‘vote by rouble’, as no choice existed (Maslow et al. 2005, p.202).
At the same time it should be noted that the principles ISO 9000 and KSUKP
largely coincide. The main differences of the two quality systems (according to
ISO 9000) are as the follows:
• orientation to the satisfaction of the consumer
• assignment of responsibility for the quality of products on specific person
• verification of the suppliers by the consumers
• selection of a supplier of components and materials
• traceability of quality products ranging from materials to disposal of products
• marketing
• organization of accounting and cost analysis on the quality

48
• traceability of materials and components throughout the production cycle
• addressing the disposal of the product after use. (Kane et al. 2008, p.20.)
Anyway, we can say that the domestic experience of total quality management
is a good foundation for the development of ISO 9000 and other approaches to
quality management (Mishin 2005, p.38).
4.2 Pest analysis
The PEST analysis is the most common approach for considering the external
business environment. The PEST analysis stands for Political, Economic,
Social, and Technological analysis and describes a framework of macro-
environmental factors used in the environmental scanning component of
strategic management (Gupta 2013, p.013). In accordance with Ward and
Rivani (Ward & Rivani 2005, p.11), the original PEST model factors are
described in the Table 4.1. below:
Table 4.1. Drivers of the PEST model dimensions (Ward & Rivani 2005, p.11)
49
4.2.1 Political factors
Let's start the evaluation of the political factors looking at how Russia stands in
some international rankings. To compare Russia's positions, the status of the
countries included in the G20 will be used here. "Big Twenty" - G20 (official
name: Group of Twenty Finance Ministers and Central Bank Governors) is a
group of the most industrialized countries, which representing about two-thirds
of the world’s population, 85 per cent of global gross domestic product and over
75 per cent of global trade. Currently, the "Big Twenty" includes 19 countries -
Argentina, Australia, Brazil, Britain, Germany, India, Indonesia, Italy, Canada,
China, Mexico, Turkey, Russia, Saudi Arabia, the USA, France, South Africa,
South Korea, Japan - and the European Union. (The Group of Twenty (G20).)
In accordance with the context of political factors the following ratings were
selected: KOF Index of Globalization 2014, which is compiled by the Swiss
Economic Institute (KOF Swiss Economic Institute); The Global
Competitiveness Index 2014 is a global study and ranking countries in terms of
economic competitiveness by the World Economic Forum (World Economic
Forum); An annual ranking of global competitiveness (The IMD World
Competitiveness Yearbook 2014) is a global study ranking countries in terms of
economic competitiveness according to the Institute of Management (Institute of
Management Development); "Doing Business 2014» is a global study and
rating countries in terms of the creation of a favorable business environment,
calculated in accordance with the World Bank; Freedom in the World 2014 is an
annual survey rating the state of political and civil liberties in the world, by the
international NGO Freedom Houses; Global ranking of countries and territories
in the world in terms of gross domestic product, which is calculated in
accordance with the World Bank; Corruption Perceptions Index (CPI 2014) is a
global study rating countries in terms of corruption in the public sector,
calculated in accordance with the international non-governmental organization
Transparency International. The results obtained can be seen in Table 4.2. (The
World Bank; The World Economic Forum; Institute of Management
Development; KOF Swiss Economic Institute; Freedom House;
TRANSPARENCY INTERNATIONAL.)

50
Population GDP per
capita Country
mln. rank $ ,US rank
KFO rank
GCI rank
IMD rank
Doing Business rank
CPI rank
Freedom status
Australia 24,3 51 65390 9 19 22 17 10 11 free Argentina 42,7 32 11030 82 80 104 58 124 107 free Brazil 202,2 5 11690 81 76 57 54 120 69 free Canada 34,3 38 52200 20 12 15 7 16 10 free China 1371,0 1 6560 107 72 28 23 90 100 not free France 64,2 22 43460 30 21 23 27 31 26 free Germany 80,8 16 47270 24 26 5 6 14 12 free India 1267,3 2 1570 168 112 71 44 142 85 free Indonesia 252,8 4 3580 141 91 34 37 114 107 partly
free Italy 60,8 23 35860 39 22 49 46 56 69 free Japan 127,0 10 46330 26 59 6 21 29 15 free Republic of Korea
51,3 26 25920 45 60 26 26 5 43 free
Mexico 119,7 11 9940 89 70 61 41 39 103 partly free
Russia 141,9 9 13850 72 56 53 38 62 136 not free Saudi Arabia
29,3 45 26260 44 48 24 n\d 49 55 not free
South Africa
54,0 24 7190 101 58 56 52 43 67 free
Turkey 77,7 17 10970 83 46 45 40 55 64 partly free
The UK 64,3 21 41680 32 17 9 16 8 14 free The US 318,6 3 53470 17 32 3 1 7 17 free Table 4.2. Russias rating among the"Big Twenty" in 2014 (The World Bank; The World Economic Forum; Institute of Management Development; KOF Swiss Economic Institute; Freedom House; Transparency International)
The table above shows that Russia lags behind other countries in the rankings
of the "twenty" in almost all indicators, and takes the last place on the level of
corruption and the level of civil liberties. A more detailed analysis reveals the
"black holes". For instance, in the ranking of Doing Business 2015 Russia has
the worst position on the specification "international trade". Russia is much less
focused on international cooperation than all the advanced countries. In
accordance with ranking, the main problem areas here are the border crossing
regime, bureaucracy procedures and insufficient tax incentives for exports (The
World Bank).

51
Also, Russia has the worst position in the specification of "investor protection"
(along with China) and "construction permit" (along with India and China).
Russia demonstrated the worst performance in terms of the complexity of
getting the electricity (see Figure 4.1.) (ibid).
Figure 4.1. Russias position in the ranking of Doing Business 2015 (The World Bank)
IMD competitiveness ranking shows that Russia has a substantial backlog of
partners in the "business efficiency". The main problem areas are the "price",
"institutional environment", "legislation for business", "efficiency and productivity
of the business", "the practice of management." (IMD).

52
Traditional "failures" of competitiveness of the Russian economy according to
the Global Competitiveness Index of the World Economic Forum (GCI WEF) are
weak institutions, low efficiency of the commodity market, low efficiency and
level of development of the financial market (opacity, unequal conditions of
competition, preferences for the state-owned banks) (World Economic Forum).
Therefore, ratings identify the following "black holes" of the business and
investment climate in Russia:
1) Investment protection, 2) Corruption, 3) Barriers of entry into the market, 4)
international trade regime (primarily - border crossing regime), 5) Financial
Markets, 6) Access to networks (ibid).
The average position of Russia in the ratings could be considered as relatively
good result, if you do not look at other statistics. Using sources, which include
the U.S. Geological Survey, the U.S. Energy Information Administration,
Bloomberg and Financial Visualizations, the Internet resource 24/7 Wall St.
(24/7 Wall St., LLC is a Delaware corporation which runs a financial news and
opinion company with content delivered over the Internet) calculated the total
value of the proved reserves of 10 of the most valuable resources, by country in
the 2012 (Table 4.3.). They include oil, natural gas, coal, timber, gold, silver,
copper, uranium, iron ore and phosphate.

53
Rank Country Total
resource value
Oil reserves (value)
Natural gas reserves (value)
Timber reserves (value)
1 Russia $75.7 trillion 60 billion barrels ($7.08 trillion)
1,680 trillion cu. ft. ($19 trillion)
1.95 billion acres ($28.4 trillion)
2 United States $45 trillion not in top 10 272.5 trillion cu. ft. ($3.1 trillion)
750 million acres ($10.9 trillion)
3 Saudi Arabia $34.4 trillion 266.7 billion barrels ($31.5 trillion)
258.5 trillion cu. ft. ($2.9 trillion)
not in top 10
4 Canada $33.2 trillion 178.1 billion barrels ($21 trillion)
not in top 10 775 million acres ($11.3 trillion)
5 Iran $27.3 trillion 136.2 billion barrels ($16.1 trillion)
991.6 trillion cu. ft. ($11.2 trillion)
not in top 10
6 China $23 trillion not in top 10 not in top 10 450 million acres ($6.5 trillion)
7 Brazil $21.8 trillion not in top 10 not in top 10 1.2 billion acres ($17.5 trillion)
8 Australia $19.9 trillion not in top 10 not in top 10 369 million acres ($5.3 trillion)
9 Iraq $15.9 trillion 115 billion barrels ($13.6 trillion)
111.9 trillion cu. ft. ($1.3 trillion)
not in top 10
10 Venezuela $14.3 trillion 99.4 billion barrels ($11.7 trillion)
170.9 cu. ft. ($1.9 trillion)
not in top 10
Table 4.3. The Worlds Most Resource-Rich Countries (24\7 Wall St.)
The results show us, that Russia is the world’s richest country when it comes to
natural resources. It leads all other nations in the size of both its natural gas
and timber reserves. In addition to having such large gas and timber reserves,
Russia has the world’s second-largest deposits of coal and the third-largest
deposits of gold. Additionally, it has the second-largest estimated deposits of
rare earth minerals, although none are currently being mined. (24/7 Wall St..)
Information shakes and removes all doubt as to the incompetence of the
Russian authorities. On the one hand, Russia is the most resource-rich country,
and on the other hand the most inefficient country.

54
The analysis in the context of political factors indicates the problems of low
business activity associated with adverse factors of the business environment
and government regulation, and the problem of low domestic competition as the
central shortcomings of the Russian market. The main negative factors in this
area are:
1) extreme inequality of rights of market agents,
2) barriers of entry for new companies,
3) the distorting effect of state and monopoly sectors,
4) excessive and inefficient regulation,
5) insufficient pace of restructuring old companies receiving government
support in various forms,
6) corruption.
4.2.2 Economic factors
The Russian economy in the last 13 years has seen a growth in GDP, with the
exception of 2009 (in 2000 - 10%, in 2001 - 5.1%, in 2002 - 4.7%, in 2003 -
7.3%, in 2004 - 7.2% in 2005 - 6.4%, in 2006 - 8.2%, in 2007 - 8.5%, in 2008 -
5.2%, in 2010 - 4.3%, in 2011 - 4, 3% 2012 - 3.6% 2013 - 1.5%). Also, there
was an increase in industrial and agricultural production, construction, real
incomes as well as a decrease of population living below the poverty level (from
29% in 2000 to 13% in 2007). From 1999 to 2007, the production index of
manufacturing industries increased by 77%, including the production of
machinery and equipment – by 91%, textile and clothing production - by 46%,
food production - by 64%. (Ereport 2014.)
According to Kudrin and Gurvich, the main driver of growth of the Russian
economy in this period served as a massive influx of resources from outside. It
allows conditionally characterize acting economic mechanism as a "model
imported growth" (Kudrin & Gurvich 2014, p.12). The main components of
growth were superincomes generated from export expansion of oil and gas

55
resources that is income derived from an increase in prices, but not as a result
of increased extraction and deliveries. The total superincomes from export of oil
and gas in the period from 2000 to 2013 years amounted to 2.1 trillion dollars.
(Kudrin & Gurvich 2014, p.6.) In turn, the rise in exports spurred economic
growth primarily due to the expansion of domestic demand. In conjunction with
the increase in hydrocarbon prices, oil and gas revenues of the budget
increased 40 times (understood as the natural rent using resource payments
and export duties) in 2000-2008, or nearly 8 times in real terms (Kudrin &
Gurvich 2014, p. 7). Because of this the government has managed to
significantly reduce taxes in the non-primary sector, without prejudice to the
budgetary system, its total income for this period in real terms almost doubled.
All kinds of public spending grew: for example, by 2008, investment in fixed
assets from the budget increased in real terms, almost three times (ibid). The
growth of social spending and salaries in the public sector created additional
consumer demand, and the increase of state purchases created the demand for
industrial products. The rapid expansion of domestic demand influenced the
strategies of enterprises: they were focused mainly on increasing production,
and improving its efficiency was seen as a minor problem. (Kudrin & Gurvich
2014, p.14.)
Part of the surplus, which remained with producers after tax was directed to
increase wages, was not only in oil, gas and metals industries, but also
throughout the economy. As a result, real wage growth much outpaced the
growth of labor productivity (measured as the ratio of volume of production and
total labor costs) (Kudrin & Gurvich 2014, p.7).
There were other mechanisms, which increased the availability of financial
resources, firstly, a low base of interest rates in the US and the euro area, as
well as the increased flow of capital from developed countries in developing. In
just eight years (2000-2007) net capital inflows to developing countries and
countries with emerging markets grew almost 20 times (Kudrin & Gurvich 2014,
p.9).
Secondly, the exchange rate policy of the Bank of Russia, on the background of
consistently rising oil price, has shaped expectations of stable nominal

56
exchange rate. As a result the conditions of external borrowings recalculated
into rubles looked extremely profitable. In this case, the expansion of the
domestic market due to increased production and strengthening of the ruble
increased the attractiveness of the Russian economy to foreign investment. As
a result, instead of large-scale outflow of capital (11% of GDP in 1999) came
substantial inflow (7% of GDP in 2007) (ibid).
The following figures can illustrate this situation. According to Inozemtsev
(2014), the share of imports in GDP in 1980-2014 increased from 2 to 15%, but
exports of oil, gas, coal, ores and products of their primary processing more
than 75% (Inozemtsev 2014, p.3). The share of oil consumed in the country has
declined over the years from 84 to 30%, the share of investment in GDP - from
34-38 to 18-20%. The total debt of the state and corporations exceeded USD
650 billion, and it is comparable with the total reserves of the Central Bank and
public funds. The share of imported components in the aerospace industry
reached 65-70%, pharmaceuticals - 80%. Import dominates the market for
electronics, medical products, road construction, agricultural products and
machinery. (Bliakhman & Gazizullin 2014, p. 9.)
As a result, Russia has lost former competitive advantages related to cheap raw
materials, energy, and highly qualified staff at a low payment. According to the
Ministry of Economic Development of Russia, only 15 million of the total number
of 68 million workers in Russia is employed in effective workplaces. About 9
million are employed in the ministries, departments, supervisory structures,
about 2.5 million - in pension, insurance and financial funds, about 1.8 million -
in private security agencies (Bliakhman & Gazizullin 2014, p.9). By the
assessment of McKinsey, Russia has three times the gap from the leading
countries in labor productivity, in which 20-60% is associated with obsolete
equipment and technologies, and 30-80% with inefficient organization and lack
of incentives for innovation (McKinsey Global Institute, 2009).
According to Kudrin and Gurvich, state-connected companies with distorted
motivation still dominate in the Russian economy. "They are less interested in
making a profit, their commercial activities in many cases are combined with the
actual acting as an agent of the government, they have less responsibility for
57
the results - losses can be one way or another are covered by the government."
(Kudrin & Gurvich 2014, p.22). Distorted motivation of the state-owned
companies affects of all market participants who lose the incentive to cut costs.
Kudrin and Gurvich noted that "the main problem of the domestic economy is
the weakness of market mechanisms," adding that the current model will not be
able to provide not only economic growth, but also a way out of stagnation
(Kudrin & Gurvich 2014, p.21).
The underdeveloped market environment leads to incorrect evaluation of the
companies. It does not encourage the producers to eliminate the wastes, does
not make the business look for new, more advanced strategies and techniques.
As a result, economic resources are not moved to the most productive sectors,
there is no demand for innovation, the need to support the so-called "their"
companies increases the burden on the budget - thus, the economy is
increasingly lagging behind in development (Bessonova 2010, p.107).
According to Bessonova, the positive effects of competition on the efficiency of
production are constrained by the coexistence of the enterprises with high and
low productivity, because the industry's least efficient enterprises are protected
by institutional barriers (ibid).
Distorted motivation in state companies not only determine their own actions,
but also has an impact on all market participants. The state or state-owned
suppliers do not have incentive to cut costs as they can relatively easily include
them in their prices (due to inefficient state action during procurement, price
regulation of natural monopolies, etc.). This phenomenon is spreading across
the economy and as a consequence, it inevitably reduces the competitiveness
of production. (Kudrin & Gurvich 2014, p.22.)
Thus, to improve performance requires not only reducing barriers of entry,
restraining competition, but also facilitating the movement of factors of
production from less efficient to more efficient industries. This requires
improving the quality of the market environment, i.e. weak protection of
property, low competition, excessive state regulation, short planning horizon,
and finally poor labor organization. (Kudrin & Gurvich 2014, p.23.)

58
4.2.3 Social factors
Among all the factors of the social environment in the context of threats to the
development of industry in Russia, the most pronounced is the demographic
situation.
To highlight the main directions of the demographic changes in Russia in the
next 20 years, lets look at the results of the three prognostic authoritative
statistical institutes - the Federal State Statistics Service (Rosstat), UN
Population Division World Population Prospects and Census Bureau US. In
addition, to assess the potential value of human reproduction and migration to
population growth in Russia, the report of demographic forecast, conducted by
IDEM (Institute of Demography National Research University Higher School of
Economics (Russia)), was taken. It is based on scenarios of fertility and
mortality of Rosstat, but migratory growth from 2010 to 2030 was taken to be
zero.
According to these forecasts, in terms of impact on the socio-economic
development of the country during the study period, the most important trends
of population dynamics in Russia, there are decline in population, its aging and
declining population in the economically active age groups.(Rosstat 2010; UN
Population Division World Population Prospects The 2010 Revision; Census
Bureau US; IDEM).
According to these estimates, in Russia in the next two decades is expected the
depopulation (Table 4.4.). But, as we see, there is a noticeable difference in the
estimates of prospective population between Rosstat, the UN Population
Division and the Census Bureau.

59
Source 2010 2015 2020 2025 2030 Rosstat 141,9 142,2 141,9 140,9 139,4 IDEM 141,9 140,7 138,9 136,1 132,8 UN Population Division
142,9 142,2 141,0 139,0 136,4
Census Bureau 139,4 136,0 132,2 128,2 124,1 Table 4.4. Prospective assessment of Russias population, in million (Rosstat; UN Population Division; Census Bureau; IDEM)
In Russia will clearly manifest the global demographic trend, it is the aging of
the population. All forecasts predict by 2030 and almost identical noticeable
change in the age composition of the population (Table. 4.5.). The proportion of
persons aged 65 and older will increase by 60%. Almost every fifth inhabitant of
the country in 2030 will be over 65 years old. (Rosstat 2010; UN Population
Division World Population Prospects The 2010 Revision; Census Bureau US;
IDEM.)
Another unfortunate trend is population decline in economic activity or able-
bodied age (Table. 4.6.). It is of particular concern due to the fact that there
was no historical analogues maintain high rates of economic growth in a
shrinking population, including its economically active (McDonald and Temple
2008, p.30). Medium variant projection of Rosstat shows that population aged
15-64 will decrease in Russia by 2025 on 9-10 million people, while the
population within the officially defined boundaries of ability to work will decrease
2010 2030 Source
0-14 15-64 65 0-14 15-64 65
Rosstat 15,1 72 12,9 15,2 65,4 19,4 IDEM 15,1 72 12,9 15,3 65,2 19,5 UN Population Division
15 72,2 12,8 15,8 65,1 19,1
Census Bureau
15 71,7 13,3 14,2 64,9 20,9
Table 4.5. The age structure of the population of Russia in 2010 and 2030, % (Rosstat; UN Population Division; Census Bureau US; IDEM)

60
on 11 million people. The results of other forecasts give a greater reduction.
The number of children will vary in waves and in a narrow range, and the
number of persons in the older age groups will steadily increase. In the context
of demographic aging the economically active part of population will also age.
The proportion of young ages (under 35 years) will significantly decrease, and
the proportion of older people (aged 50 to 65 years) will increase by 2030.
(Rosstat 2010; UN Population Division World Population Prospects The 2010
Revision; Census Bureau US; IDE.)
Thus, in the 2010-2030 there will be very significant changes in the number of
age groups and quantitative relationships between them. Expected
demographic changes in the next two decades, threaten serious contraction in
the labor market, which in turn calls into question the possibility of rapid
economic growth. Labor shortages may increase significantly. The economy will
have to adapt to the new situation, in order to neutralize the possible adverse
consequences of such compression, in different ways, which can be
summarized in three groups. (Strategy 2020, pp. 52.)
A) It is improving the efficiency of the economy itself, permitting an answer to
reduce labor supply growth by increasing productivity. Modernization and
technological renewal of the entire production sphere - it is a question of
survival of Russia in the modern world (Medvedev 2009). There is obvious need
for significant investment in upgrading and accumulation of physical capital,
appropriate retraining. However, the revolutionary productivity growth cannot
occur without an increase in capital intensity and technological innovation, and
improving the labor organization (Strategy 2020, pp. 54).
Source 2010 2015 2020 2025 2030 Rosstat 102,2 99,8 96 93 91,1 IDEM 102,2 98,7 93,8 89,6 86,6 UN Population Division
103,2 99,7 95,2 91,5 88,8
Census Bureau 100 95,1 89,6 84,6 80,5 Table 4.6. Prospective evaluation of working age population (15-64 years), in million (Rosstat; UN Population Division; Census Bureau US; IDEM)

61
B) The other one, increasing and improving use of the available labor potential,
under current demographic conditions by increasing the levels of economic
activity of the population, by reducing unemployment, by increasing working
time and efficiency of its use, by increasing investment in human capital (health
and education), improvement of professional and domestic migration mobility
and so on (ibid).
C) And involvement of labor from outside, i.e. international labor migration (ibid).
4.2.4 Technological factors
Progress in technology involves the deepening of the scientific base and
extension of its use. The first activity is usually called the fundamental research;
the second is directly related to applied research and development (R & D). In
practice, they are closely interrelated. They are the result of innovations that
make the work more efficient, allow increasing the quantity, quality and variety
of manufactured goods and services (Voronina & Pykhteev 2014, p.25).
According to Porter (1990), all developing economies, depending on the
methods of competition, go through various stages of development. An
economy in which the driving forces are the factors of production (factor-driven
economy) depends mainly on the availability of natural, capital and human
resources, and a victory in the competition achieved by reducing production
costs. If economic development is conducted mainly through investment
(investment-driven economy), competition is determined, above all, by
opportunities to improve the technical efficiency of production. Innovative
Economy (innovation-driven economy) aims to create a new, higher "value for
consumers," while manufacturers of innovative products will have a competitive
advantage, even while maintaining production costs at a level approximately
equal to the cost of the competitors production. (Porter 1990, p.77.) It is an
innovative model that allows to overcome the nature of the raw materials export
growth reflects the main features of the inertial parameters of the development

62
is the most suitable for the domestic economy (Voronina & Pykhteev 2014,
p.26).
In Russia, 70s - 80s of the last century, there was the conception of the need of
priority development of industries producing capital goods, which, along with the
long-term arms race led to a significant degradation in the consumer sector,
especially in technical terms. Advanced technology, the most qualified
personnel, funding for R & D were concentrated in the military and allied
industries (Mishin 2005, p. 29). The civil sector, on the other hand, had a
permanent deficit of investment and innovation resources. According to the
Institute of Economic Forecasting, the share of Soviet military spending by mid-
80s reached almost 1/4 of GDP, which is much higher than the level of
developed countries. In particular, in the United States concerning the military
burden on the economy was at about 7% of GDP (Naryshkin 2007, p.53).
Market reforms, including their implementation did not have well thought-out
plan of conversion and demanded sharply reorient the direction of R & D.
Scientific - research organizations had to independently develop relationships
with potential customers. At the same time sharply reduced public funding,
which led to the loss of a significant part of qualified personnel (Voronina &
Pykhteev 2014, p.27). Research and innovation potential of the country is in a
very difficult position. The total number of organizations able to create attractive
investment development decreased from 4099 in 2000 to 3566 in 2012, i.e. on
533 units (Table 4.7.). Very significant changes have also occurred in their
structure: the number of engineering offices decreased more than 2.5 times.

63
Table 4.7. The number of organisations engaged in research and development, by type of organisation in the Russian Federation (Rosstat)
At the same time, the number of personnel engaged in research and
development has fallen over the years, more than 2 times to 1536.6 thousand
people in 1992 to 726.3 thousand people in 2012 (ibid).
Also there was reducing domestic expenditure on Russian R & D. In 2011, they
accounted for 1.1% of GDP, and about the same (1.12% of GDP) in 2012,
which is less 2 -3 times, than in developed countries. For example, in Germany
in 2011 it amounted to - 2.9% in the US - about 2.9%, in Japan - about 3.4%
(Table 4.8). Then, drastically reduced the number of patent applications. In
1991, were filed 190 thousand applications, in 2011 - only about 29 thousand
(Voronina & Pykhteev 2014, p.27).
COUNTRY GROSS DOMESTIC EXPENDITURE ON R & D, % OF GDP
THE SHARE OF RESEARCHERS IN THE TOTAL NUMBER OF STAFF, %
HIGH-TECH PRODUCTS, % OF MANUFACTURED EXPORTS
APPLICATIONS FOR REGISTRATION OF PATENTS
RUSSIA 1,1 50 6,5 28765 USA 2,9 87,2 27,1 231588 CHINA 1,8 81 28,7 194579 JAPAN 3,4 75 17,9 330110 GERMANY 2,9 59 13,5 49240 FRANCE 2,3 60 20,2 14743 THE UK 1,8 74 19,3 16523 Table 4.8. Statistics by country (Voronina & Pykhteev 2014, p.27)

64
Much of the funding for R & D (67.1%) occurs at the expense the state budget
and control over budget spending is poor. Typically, these funds are used for
the maintenance of a large number of public research institutions, are still
poorly connected with training as well as to entrepreneurial activity. Virtually no
signs of recovery interest of manufacturers to innovate: the proportion of
organizations that conducted the technological innovations in the industry in
2000 was 10.6%, in 2008 - 9.6, in 2012 - 9.9% (Kudrin & Gurevich 2014, p.14).
The level of innovation activity Russia lags behind not only the most developed
countries, but also from all emerging market countries (Table 4.9). It indicates
very weak incentives for Russian companies to improve their efficiency (Kudrin
& Gurevich 2014, p.27).
Unfortunately, in Russia the efficiency of investment in science, which is
determined by the level of innovation introduced in the country and an increase
in the share of high-tech manufacturing in GDP, not great. In practice, the main
purpose of investment in fixed assets is still the replacement of worn-out
machinery and equipment. This is reflected in the commodity composition of
exports. Russia is considerably inferior to the world's leading exporters of high-
tech products. Its share in the Russian industrial exports remains low: in 2011 it
was only 6.5%, while raw material component of Russian exports reached 70%.
(Voronina & Pykhteev 2014, p.27.)
In the 2000s, Russia's economy has been growing rapidly mainly due to income
from commodity exports, redistributed between sectors and stimulating
consumer and investment demand. The growth in revenue of the commodity
sector was not the result of modernization, efficiency and cost-effectiveness of
Country Share of organizations which conducted the technological innovation
The total level of innovative activity
Russia 9,1 10,3 Brazil 41,2 76 Poland 16,2 28,1 Turkey 35,2 51,4 South Africa 65,4 73,9 Table 4.9. Innovation indicators, 2012 (Kudrin & Gurevich 2014, p.27)

65
primary industries, and has been obtained due to the growth of world prices.
Over time, it became obvious that the export growth mechanism of raw
materials, in the form in which it is, has exhausted itself. Now Russia with all the
urgency of improving the competitiveness has faced the problem be caused of
a broad modernization of all industries. (Kudrin & Gurevich, 2014, p.16.)
4.3 Cross-cultural analysis
According to the majority of researchers, we can draw conclusions about certain
features of organizational cultures peculiar to most companies in this country,
having the idea of a national culture. The researchers attribute this to the
mentality of the citizens and the differences with respect to employees and
managers of the companies to business processes in different countries (Fey&
Denisson 2003, p.688).
Using ethnometry, direction ethno-sociological research that analyzes the
mental characteristics of different ethnic groups using formal (mathematical)
methods, in particular the method of Geert Hofstede, researchers seek to
identify "the mentality of the country in comparison with other countries,"
designating a country's position on the mental map of the world. (Gorshkov et
al. 2010, p.274.)
According to Gorshkov, Russia occupies on the mental map an intermediate
position between East and West; so to speak, it is in the mental isolation
(Gorshkov et al. 2010, p. 288). From this we can conclude that Russia is an
intermediate unit between East and West, or it is characterized by its own
qualitative specificity of mentality. Therefore, to the question "if Russia is an
European country", one can give the answer in the following form: "Yes, it is
approximately to the same extent as Israel. This conclusion seems paradoxical,
but that is the objective reality" (Gorshkov et al. 2010, p. 289).
So today's Russians in terms of individualism are close to the inhabitants of the
Czech Republic, Malta, Poland, Luxembourg and Estonia. The value of this
indicator in Russia today is very different from the situation in collectivist
66
countries (in the East) and does not hold out to the value of the majority
individualistically oriented countries of the West. (Gorshkov et al. 2010, p. 276.)
The measurement in cross-cultural studies on the dimension of power distance
leads researchers to a curious paradox. According to this indicator Russia is at
the same level with Ireland, Switzerland and Germany. The paradox, according
to the authors, is that "Russia is perceived as a country with authoritarian
traditions, but the survey data describe our country as a democratic country in
terms of mentality. Meanwhile, even the United States has a higher power
distance than our country "(Gorshkov et al. 2010, p. 278). In their explanation
of this paradox, researchers rely more on experience than on research data and
reproduce commonplace stereotypes. They point to double standards: "Russian
democracy - is liberalism in words" and " knowing one's place in fact". The idea
that “the existence of such a conflict has historical roots” is not based on
empirical data (Gorshkov et al. 2010, p. 283). Thus, the remarkably low index of
Russian power distance is largely a contradictory installation. In fact, in Russia
there is no recognition of equality, nor reverence power. One side pretends that
it pursues a policy based on the opinion of the majority and the other side
pretends that performs top-down solutions. The existence of such a conflict is
rooted in history and, for example, in the US calling "all take and share"
categorically does not cause sympathy, but in our country - it is always
accepted. (Gorshkov et al. 2010, p. 28.)
In contrast to the values, which are common in masculine societies, e.g. desire
to maximize income, recognition, career promotion and competition, in Russia
there are feminine traits, e.g. the value of maintaining friendly relations,
cooperation, comfort, and safety. In this respect Russia is similar to countries
such as Thailand, Guatemala, Uruguay, South Korea" (Gorshkov et al. 2010, p.
279). "It should be noted that one of the main features of Russians, which
foreigners emphasize are hospitality, kindness and sympathy. All these
qualities are the basis of feminine mentality, and femininity of the Russian soul
more than once became the subject of debate among Russian philosophers
(Gorshkov et al. 2010, p. 279).
67
"Russia should be considered moderately feminine society. Although modern
market reforms have taught the Russians to pay special attention to the value of
wealth, success and service career, however one can hardly argue that our
fellow citizens are ready for the rules of the game "every man for himself."
Careerism, the pursuit of the good things of life perceived by the majority of
Russians though with understanding, but with some tinge of disgust. The ideal
is when the income, prestige and career come "by themselves."(Gorshkov et al.
2010, p. 285). The relationship between people is basis on relationship in the
business environment. The situation when a good man but a bad worker easier
can hold down a job more is well known than the opposite situation, here
welcomes the exchange of gifts and services not only between family members,
but also between colleagues, which is considered as a sign of attention. There
is an unmistakable sign of feminine culture in Russia such as a constant
searching for the answer to the question "What should I do?" And the question
"Who is to blame?". (Gorshkov et al. 2010, p. 286)
Then, the Russians have very high uncertainty avoidance. It can be assumed
that what is considered the Russian thrust towards authoritarianism, in fact a
manifestation of the high uncertainty avoidance, reflecting the desire of the
laws, rules and procedures in a situation of instability of life in Russia. This
explains the paradoxical contradiction between authoritarianism characteristic
of Russian civilization, and low power distance inherent in the Russian
mentality. Russians love equality, but are extremely afraid of surprises, so they
are willing to tolerate (but not to love!), authoritarian regimes, which guarantee a
stable order of things "(Gorshkov et al. 2010, p. 288).
In the last decade, domestic and foreign scientists conducted empirical studies
the purpose of which was to identify cross-cultural differences, especially in
connection with the Russian business culture and to evaluate its impact on
organizational culture. The study, conducted by Latfullin and Gromova (2004)
was completed with 2144 Russian managers and it included the results of the
survey of 70 managers of Russian companies. They were enrolled in the MBA
program conducted by professor Smirnova, and the study identified peculiarities
of culture of Russian companies. The study of organizational culture as a
comparison criteria with the Japanese and American models examined

68
characteristics of management organizations, such as the image of the
company, objective of the business motivation for profit, core values, wages,
treatment of staff. (Table. 4.10)
The study showed that the image of the modern Russian company is quite
difficult to determine. It was noted that the image of the company depends on
its age, size, ownership, stage of the life cycle, for what purpose it was created,
and who is the founder.
Small and medium-sized Russian companies often resemble "family team". This
is because most private Russian companies were established 6-8 years ago,
but not more than 10 years ago and are either at the stage of "infant" or
"growth." For these stages of the life cycle of the organization the way to hire
employees is a 'family principle', which provides a high degree of confidence in
the company, higher reliability and safety activities. However, with the growth
and development of the company, it is gradually moving away from the
principles of kinship and nepotism. (Latfullin & Gromova 2004, p.94.)
The purpose of the business, which largely determines the image of the
company in Russia, is not always linked to the needs of the market. Factors
such as a significant proportion (40-50%) of shady business, a strong influence
of the state and government structures on the activities of the company, as well
as the identity of the entrepreneur still often are decisive in choosing the goals
of the organization. Despite this, the survey results show that many Russian
companies, successfully overcame the survival stage, having a focus on the
long-term existence of a profitable business as the primary goal (Latfullin &
Gromova 2004, p.95).
Depending on the factors mentioned above profit for many Russian companies
is a means of existence for others even more it is a tool for development. In
some cases, the dominant motive in making a profit is to enrich the owners and
senior management of the company, who used different methods of obtaining
short-term profits (ibid).

69
Polls showed that Russian companies values are orientated to material values
(about 95% of respondents). Only 5% of respondents indicated that their
companies have predominant orientation to person (ibid).
About three quarters of the respondents indicated that their company’s
management considers them as the labor source, and only a quarter believed
that their organizations consider them primarily as a person (ibid).
Russia is still a country where the collectivism is still more characteristic than
individualism. The emotional not rational approach to problem solving prevails
(ibid).
The study of relationships within organizations has shown that along with the
traditional Russian cooperation between the employees of the company exists
also competition. Large companies are characterized by a strong competition.
Cooperation is based on informal personal relationships. (ibid.)
In Russian companies the guarantees for the majority of employees are missing
or are low enough as a result of the country's social policy and because of the
possibility to circumvent existing labor law regulations (ibid).
The relationships between managers and subordinates in the vast majority of
Russian companies are based on subordination, hierarchy, centralization, and
authoritarian style of leadership. Characteristically individual decisions come
from the top - down, sometimes with elements of group discussion (ibid).
Promotion of employees career has might be based on merit and ability, but
often enough preference is still given to family members, relatives or friends
(ibid).
Many managers of the Russian companies build employees motivation based
on the average cost of a worker in the labor market. In this case the employees
are offered the lowest possible level of pay. The starting salary is maintained
long enough, the percentage of its growth is quite low, and there is
unreasonably high differentiation of labor (Latfullin & Gromova 2004, p.96).

70
This study identified four basic qualities of an ideal subordinate from the
Russian leaders point of view: professional knowledge, initiative, teamwork and
diligence. Mid-level managers in Russian companies are considered primarily
subordinates, and not leaders, with authority and responsibility.
Russian leaders often show caution and unwillingness to implement radical
changes in the company. Staff organizations are also often resistant to change
and do not believe in their positive results.
In general it can be noted that the organizational culture of Russian companies,
although having some similarities, differs significantly from both the American
and the Japanese cultures (Latfullin & Gromova 2004, p.96). The most
significant differences with American culture by parameters are e.g. collectivism
to individualism, emotional to rational, authoritarianism to democracy. The
similarity of the organizational culture of the Russian and Japanese companies
can be traced by parameters such as teamwork, cooperation, informal relations,
the image of the family.

71
Comparative criterion
USA Japan Russia
Image of the company
Sports team Family Family team
Purpose of the business
Profit Long term orientation to existence of business
Long term orientation to profitable existence of business
Motivation for profit Any funds As a means of achieving the goals of the organization
As a means of livelihood
Values Focusing on the material values
Focusing on the human
Focusing on the material values
Employees Just a labor resource
A man as an individual
Just a labor resource
Human relationship Functional Individualism
Emotional Collectivism
Emotional Collectivism
Competition Strong competition, the victory of the strong over the weak
Cooperation, harmony and coexistence
Competition and cooperation
Guarantees for employees
Low (short-term contracts and narrowly focused specialists)
High (long-term contracts, lifelong employment, universal specialists)
Low (often no guarantees)
Decision making Individual decisions from top to down
Collective decisions from down to top
Individual decisions from top to down
Promotion According to abilities and merits
According to a length of service
Nepotism and kinship
Payment Depending on the result
Depending on the length of service
The minimum salary based on the market value of the specialist
Table 4.10. Comparative analysis of the characteristics of organisational culture (Latfullin & Gromova 2004, p.95)

72
4.4 Conclusion of the PEST analysis
The competitiveness of a country depends on the tendency of its industry to
innovation and modernization. Companies could reach the benefits of relatively
strong global competitors due to the pressure and challenges. They get benefits
from the internal competition and demanding consumers (Porter, 1990, p. 73).
Summarizing the data, one can suggest that the problem of domestic
competition could be regarded as a key question due to the fact that it has a
pronounced macroeconomic and structural aspect.
Competition as macroeconomic factors: competition hampers the growth of
domestic prices, thus reducing the overall costs on economic growth and allows
escape from the alternative "attenuation" of growth or formation of "bubble" (the
transition from the "economy of demand" to the "economy of offers").
Competition as a structural factor: provides a redistribution of resources in
accordance with market signals.
Competition is not a technical, but a political problem. Attempts to reduce the
pressure of the state bureaucracy on business have made for many times, but
each time they have ended in failure. (Kudrin & Gurevich 2014, p.21;
Bessonova 2010, p.107.)
Bad institutions have a traditional problem in emerging markets, and the
stability of bad institutions is largely related to the problem of corruption,
bureaucracy and allowing its affiliated businesses receive transformational rent,
that is, the income associated with the low quality of institutions. In turn, the
problem of corruption (traditional in emerging markets) is largely associated with
poor motivation of bureaucracy to defend the public interest, including due to
the low level control of power on the part of society. (Baranov, 2010, p. 140.)
The "the vertical power" created by Putin, based on domination and
subordination, and leaves no choice for a man. This system is suitable for
internally unfree people dependent on paternalistic attitudes. It should be noted
that the vertical power stopped the centrifugal tendencies in the country,

73
increased the importance of the federal government and its impact on regional
processes and restored a unified system of government. As noted Migranyan,
"these actions of the authorities were more or less adequate to current reality"
(Migranyan 2006, p. 73). However, the vertical power has penetrated all
spheres of society and has become an obstacle for the development of initiative
and free will of the citizens, the source of the omnipotence of the bureaucracy,
uncontrolled by society, contributed to the expansion of corruption. As a result,
the positive effect of the vertical of power, reflected in the establishment of
political stability in the early 2000s., replaced by negative factors, which were
the logical result of the policy (Baranov 2010, p. 140). Vertical of power became
playable in all social processes, dominating almost the whole sphere of social
relations. Officials were arranged under it, which was the most clear vertical
power system - convenient for bureaucracy and inefficient for society (ibid).
Vertical power has not coped with the financial and economic crisis, requiring
an increase in public funding of significant projects, the personal intervention of
top officials to solve even the regional political and economic problems, a
testament to its inefficiency and the need to move to a relationship more
dependent on citizens and established by them (ibid).
According to Porter, the four main features are the basis of the competitive
advantages of the country, the so-called Diamond model. There are factor
conditions; demand conditions; related and supporting industries; firm strategy,
structure and rivalry (Figure 4.2). Michael E. Porter argued that a nation could
create new advanced factor endowments such as skilled labor, a strong
technology and knowledge base, government support, and culture. (Porter
1990, p. 82.)

74
Figure 4.2. Porters Diamond Model for the Competitive Advantage of Nations (Value based management)
Each of the four components determines the point on the rhombus competitive
advantages of the country. The condition of one of the components is
dependent on the other three. In general, the weak position in any of the
components will limit the ability of the industry to progress and updated. In the
case of Russia, and in accordance with PEST analysis, at presence of factor
conditions, related and supporting industries, as well as conditions demand,
weak components are internal competition and the role of government. Porter
stressed that the tough internal competition stimulates the development of
unique factors, but also enhances the interaction of all four components (Porter
1990, p. 86). Create internal competition can only the companies themselves,
trying to find their competitive advantage. Government cannot create a
competitive industry. The role of government is to create conditions for
companies to invest in innovation and improvement. The policy of static, short-
term cost advantages harms renewal and development and it is the most
common mistake of economic policies of governments (Porter 1990, p. 87).
The regulatory activities of government can contribute to achieving competitive
advantage by promoting and improving domestic demand. Regulation of
competition through policies aimed at preserving the state monopoly, control

75
over the investments in the industry and price fixing, leads to two negative
results. Reduced competition and not create Innovations (Porter 1990, p. 87).
So are there any prerequisites for the implementation of quality management
systems in Russia? Based on this analysis one can say that there are internal
conditions are due to the following factors, firstly, the inefficiency of the state in
combination with high level of corruption, which is unable to provide the work of
the law, protect human rights and freedoms, timely and adequately respond to
the challenges of our time. Secondly, the existence of a primitive raw materials
economy hinders a) innovation development, b) the massive growing of the
middle class, c) improving the living standards of the people. Thirdly, lack or low
levels of internal competition caused by the dominance of state-owned
companies. Fourthly, there is a demographic risk. Fifthly, the existing
experience in the construction of such systems in the period of socialist
development of the country, which were later found application in other
countries. Finally, Russia occupies an intermediate position on the mental map
of the world, which leads to flexibility in the choice of methods and models.

76
5 Case of Sayssky Pulp & Paper Mill
This section presents the case of Syassky PPM. The history of the company
and the information regarding the company will be presented very briefly at the
beginning. Then the current situation will be analyzed. The results of the
interviews, as part of the analysis and empirical part of this study, will be
demonstrated.
5.1 Historical summary
Syasstroy is a city located at the mouth of the river Syas, it is the 136 km of the
motorway "Cola" connecting St. Petersburg to Murmansk. The first mention of
the village "Syassky ryadky" by written sources was found in 1582. In 1702, by
the decree of Peter the Great, a shipyard was laid here, but the settlement of
Syasstroy was founded in 1926, in connection with the construction of Syassky
Pulp and Paper Mill.
In 1928, Syassky PPM was put into operation, hereafter in 1935 there was built
a sulfite-alcohol plant running on waste from the mill. In the history of the Soviet
industry Syassky Mill entered as a unique factory-school, preparing staff for new
pulp and paper companies in the country (Kulikov 2014, p. 14).
The original design capacity of the plant was 60 thousand tonnes of pulp
cooking per year. As a result of improved technology and reconstruction, the
capacity reached 120 thousand tons per year. Later them significantly
transformed and the following part were built and put into operation:
- A bleaching plant with the capacity of 100 thousand tonnes per year
- A workshop for the production of protein feed yeasts with the capacity of 2.5
thousand tons per year
- Cardboard and Paper Mill

77
- A complex of factories producing sanitary products, with the capacity of 53
thousand tonnes per year
- A groundwood workshop for the production refiner pulp of aspen wood, with
the capacity of 100 thousand tonnes per year.
The crisis of the 90's in the economy had impact on the business. In the period
from 1996 to 1998, the plant was shut down completely. Only at the end of
1998, a large amount of repair work was done and the plant was reopened
(ibid).
Today Syassky PPM is one of the leading manufacturers of sanitary products in
Russia. The main competitive advantage of the company is the complete
process chain: wood-balance - pulp - base paper - finished consumer products
(SPPM internal materials).
5.2 Company profile
JSC "SPPM" (Syassky Pulp and Paper Mill)
Year of Establishment: November 1928
Legal form: Joint Stock Company of open type
Structuring: part of a group of companies "SevZapProm"
Capital: 100% private capital
Employees: more than 2,500 people
Geography: Located in the city Syasstroy 150 km from St. Petersburg and 30
km from the district center of Volkhov, near the river Syas, the area of Lake
Ladoga.
Demographics: The population of 15,000 people.
Infrastructure and External Resources: The company owns 300 hectares of
land, has the necessary buildings and housing. It has its own transport

78
department, as well as access to the railway. The company is located near the
federal highway of St. Petersburg - Murmansk. There is the possibility of pure
abstraction. The company is located in an area of forests, with mixed forests in
the vicinity of the pipeline Volkhov - Petrozavodsk and Volkhov hydroelectric
power station.
Internal resources:
Equipment:
9 pulp boilers
3 paper machines for paper hygiene
1 paper machine for wrapping paper
1 board machine
3 machines for the production of toilet paper
4 automatic production lines for toilet paper and kitchen towels, new
2 automatic lines for production of napkins
Trucks and the necessary transport arrangements
The laboratory and equipment for quality control
Sewage treatment plants
Technology:
Sulfite pulping
Chlorine bleaching
Encumbrance:
The city is supported by the company, it is formed and developed around and
because of JSC “SPPM”. As a result the company has had a need to carry the
social burden, this includes the heating of residential and administrative

79
buildings in the city, containing a variety of non-core institutions (health care
center, recreation center), and dealing with the land, which is used inefficiently.
To maintain the existing business it is enough just to have 10 times less land.
The bank enterprise: JSC Sberbank of Russia Northwest Branch.
Products: cellulose, various kinds of technical papers, lignosulfonates, yeast,
toilet paper, napkins, and kitchen towels.
Turnover: 144 million Euros per year. (SPPM Internal materials.)
The technological chain of the enterprise is constructed in such a manner that it
covers all stages of wood processing to an end product. At each stage, the
company produces a product that is in demand in the market in one form or
another (pulp, paper for the production of toilet paper, etc.). In this case we
have a situation where a company can conduct business as a B2B market and
in the B2C market. This situation formed the basis for the formation of sales in
general. The sales department is divided into two parts business-to-business
(B2B) and sales in the market of consumer goods (FMCG). (SPPM Internal
materials.)
The company uses a functional management system. At the head of the
company is General Manager, who has three deputies. Each of them is
responsible for his or her own direction. (Ibid.)
The main instruments are three plans. The first is the development plan for the
company. It has been executed for three years and includes the investment
program. The second is the annual budget, including the annual plan forecast of
sales. The third is a strategic marketing plan, which has a three-year
framework. All plans are approved by the Board of Directors and adjusted every
six months. (Ibid.)
The main criteria for the formation of plans are oriented in the manufacture of
finished products, the modernization of enterprises and increased market share
of finished products. The main principle is the efficiency through all processes.
80
The first process assesses demand for finished products and as a result forms
a production plan for the processing site. Then according to their own needs the
plan is formed for the paper machine and pulping plant. Next that which comes
into force maximum capacity factor of the production chain. Thus the volume of
sales in the B2B area is formed. Then, depending on the conjuncture of prices,
there is a separation between the volumes of domestic and international B2B
markets. (Ibid.)
The main focus of the company to produce the final product. This trend is
chosen for several reasons:
- Relatively high annual growth of the market
- level of consumption in Russia is less in five times than in the developed
countries
- Full chain of production of the product
- Favorable geographical location. (Ibid.)
On the other hand, the company has met high industry competition. On the
market today there are almost all types of competitors, multinational companies,
domestic producers, local producers. (Ibid.)
The main problem is the reduction in profitability of the enterprise, despite the
modernization of equipment and processes of increasing output. Despite of all
attempts to control costs, this reduction process continues. Parallel to the
increase in output, there are increases the percentage of defects, sometimes,
this percentage reaches 30%. (SPPM Internal materials.)
5.3 Problems discussion
The market of hygiene products in Russia, where SPPM operates, in the past
few years shows a stable trend. The average market growth for the year in the
period from 2010 to 2015 was 8%. This dynamics is provided on the one hand
due to a serious backlog of the average consumption, it is 2 times less than the
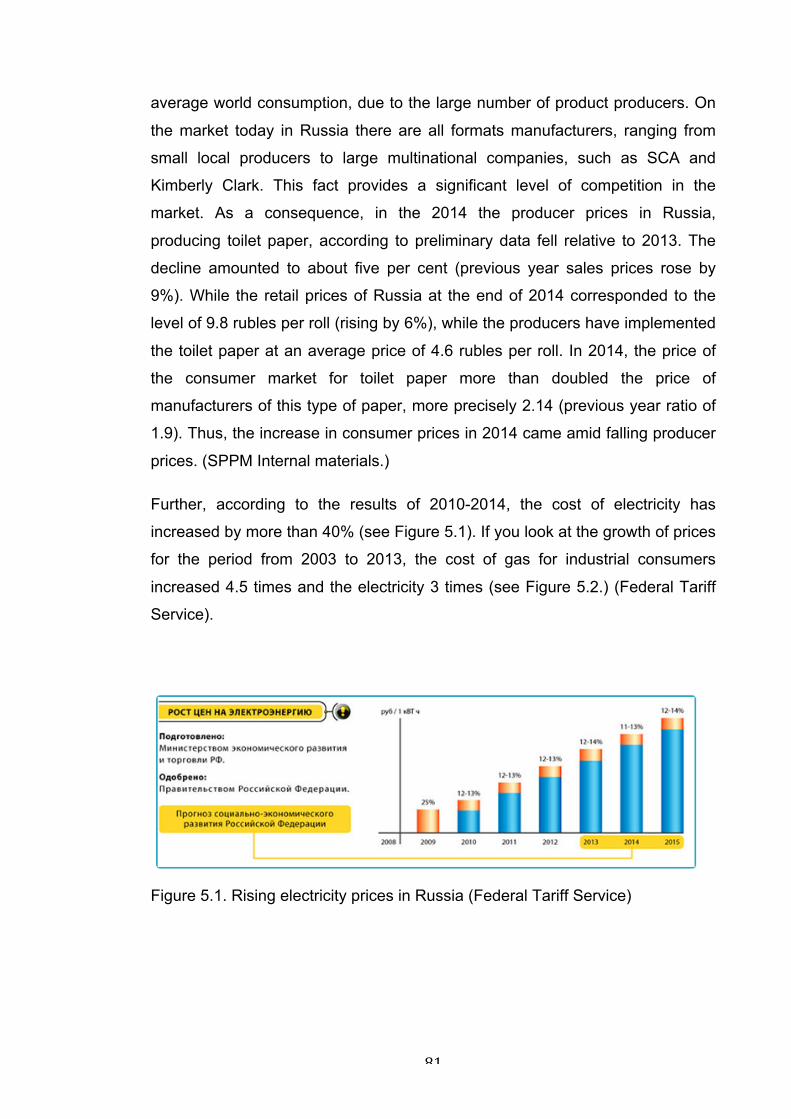
81
average world consumption, due to the large number of product producers. On
the market today in Russia there are all formats manufacturers, ranging from
small local producers to large multinational companies, such as SCA and
Kimberly Clark. This fact provides a significant level of competition in the
market. As a consequence, in the 2014 the producer prices in Russia,
producing toilet paper, according to preliminary data fell relative to 2013. The
decline amounted to about five per cent (previous year sales prices rose by
9%). While the retail prices of Russia at the end of 2014 corresponded to the
level of 9.8 rubles per roll (rising by 6%), while the producers have implemented
the toilet paper at an average price of 4.6 rubles per roll. In 2014, the price of
the consumer market for toilet paper more than doubled the price of
manufacturers of this type of paper, more precisely 2.14 (previous year ratio of
1.9). Thus, the increase in consumer prices in 2014 came amid falling producer
prices. (SPPM Internal materials.)
Further, according to the results of 2010-2014, the cost of electricity has
increased by more than 40% (see Figure 5.1). If you look at the growth of prices
for the period from 2003 to 2013, the cost of gas for industrial consumers
increased 4.5 times and the electricity 3 times (see Figure 5.2.) (Federal Tariff
Service).
Figure 5.1. Rising electricity prices in Russia (Federal Tariff Service)

82
electricity, $ \ mW gas, $ \ thousand. cu. m.
Figure 5.2. Rising electricity and natural gas prices in Russia (Federal Tariff Service)
According to Rosstat, in the period from 2003 to 2013, wages in Russia
increased by 6 times (see Figure 5.3) (Rosstat Russia).
Rub $
Figure 5.3. Rising wages in Russia (Rosstat)
------- $
------- Rub
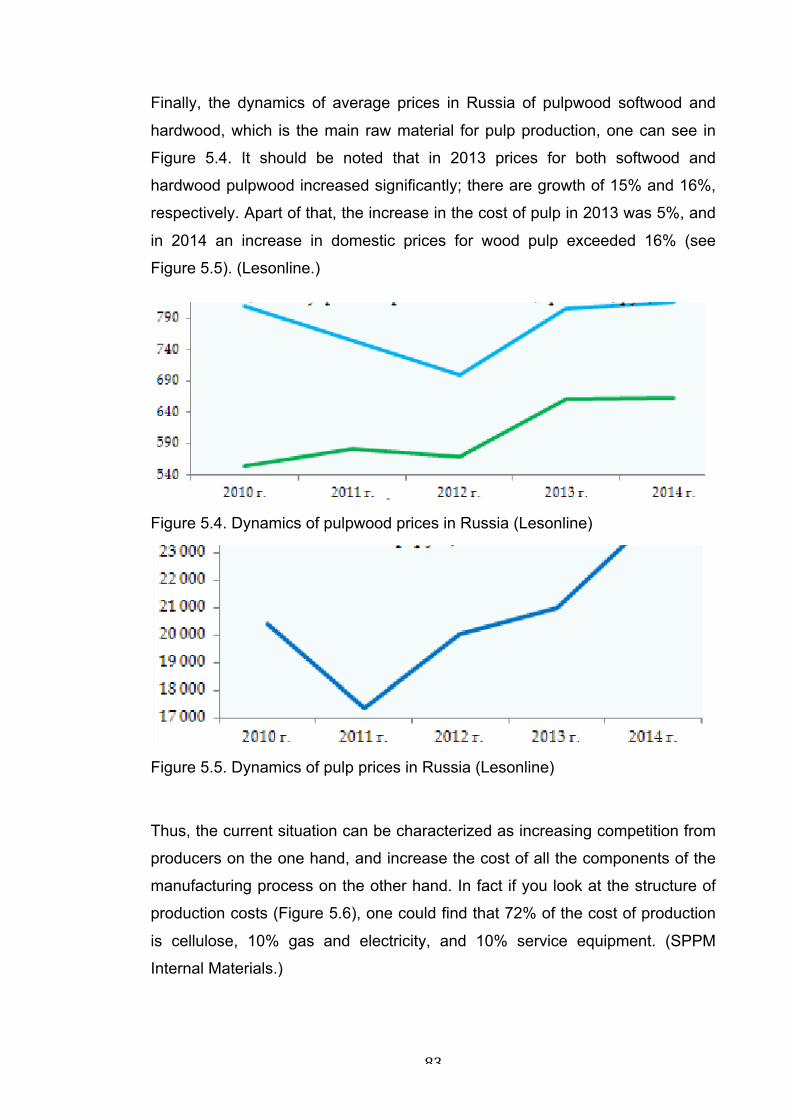
83
Finally, the dynamics of average prices in Russia of pulpwood softwood and
hardwood, which is the main raw material for pulp production, one can see in
Figure 5.4. It should be noted that in 2013 prices for both softwood and
hardwood pulpwood increased significantly; there are growth of 15% and 16%,
respectively. Apart of that, the increase in the cost of pulp in 2013 was 5%, and
in 2014 an increase in domestic prices for wood pulp exceeded 16% (see
Figure 5.5). (Lesonline.)
Figure 5.4. Dynamics of pulpwood prices in Russia (Lesonline)
Figure 5.5. Dynamics of pulp prices in Russia (Lesonline)
Thus, the current situation can be characterized as increasing competition from
producers on the one hand, and increase the cost of all the components of the
manufacturing process on the other hand. In fact if you look at the structure of
production costs (Figure 5.6), one could find that 72% of the cost of production
is cellulose, 10% gas and electricity, and 10% service equipment. (SPPM
Internal Materials.)
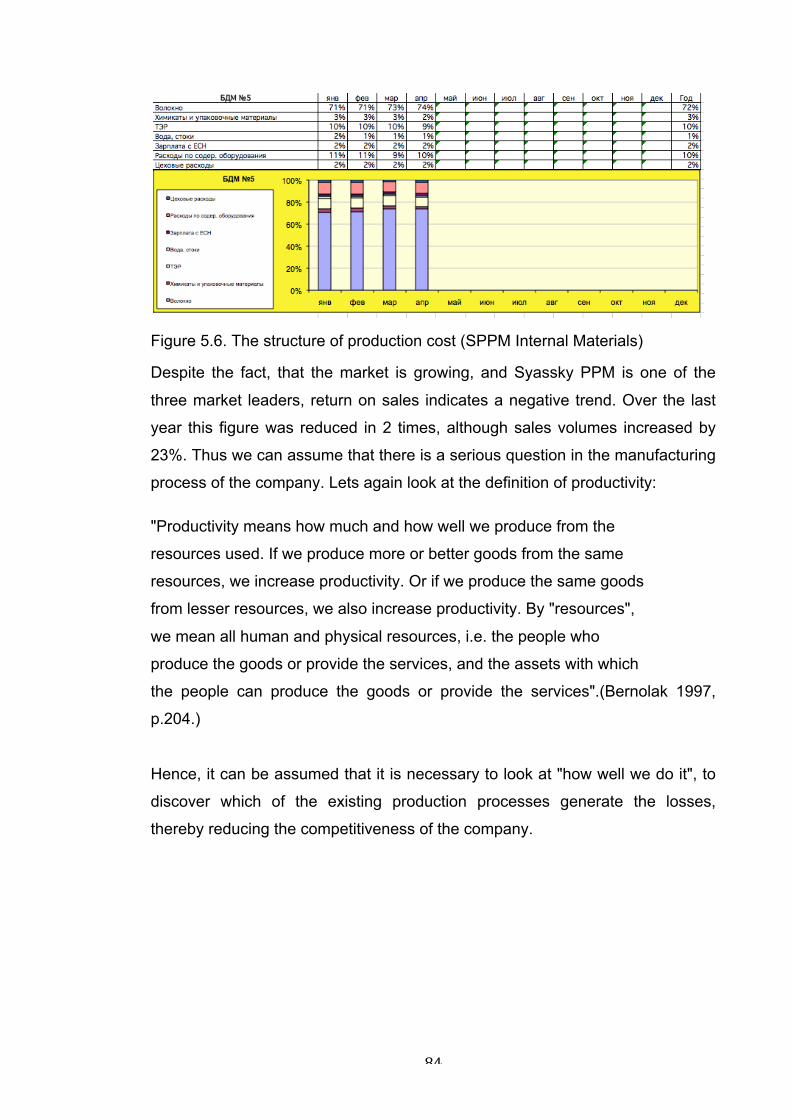
84
Figure 5.6. The structure of production cost (SPPM Internal Materials)
Despite the fact, that the market is growing, and Syassky PPM is one of the
three market leaders, return on sales indicates a negative trend. Over the last
year this figure was reduced in 2 times, although sales volumes increased by
23%. Thus we can assume that there is a serious question in the manufacturing
process of the company. Lets again look at the definition of productivity:
"Productivity means how much and how well we produce from the
resources used. If we produce more or better goods from the same
resources, we increase productivity. Or if we produce the same goods
from lesser resources, we also increase productivity. By "resources",
we mean all human and physical resources, i.e. the people who
produce the goods or provide the services, and the assets with which
the people can produce the goods or provide the services".(Bernolak 1997,
p.204.)
Hence, it can be assumed that it is necessary to look at "how well we do it", to
discover which of the existing production processes generate the losses,
thereby reducing the competitiveness of the company.
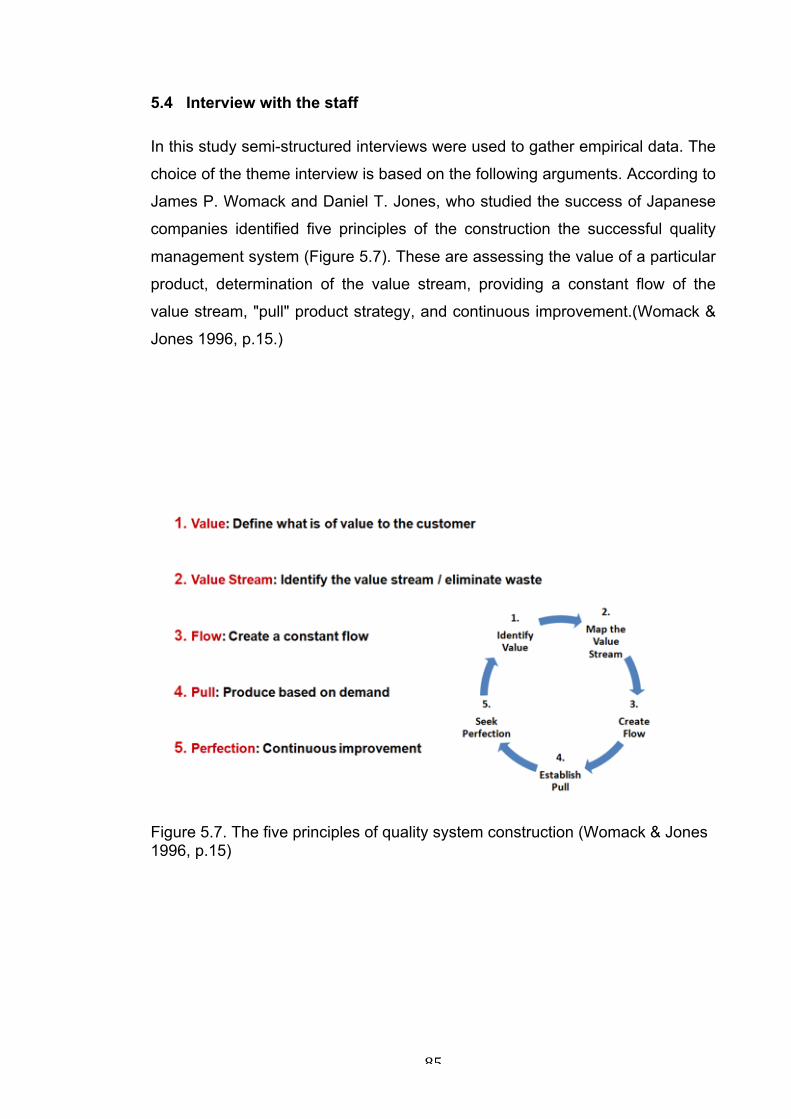
85
5.4 Interview with the staff
In this study semi-structured interviews were used to gather empirical data. The
choice of the theme interview is based on the following arguments. According to
James P. Womack and Daniel T. Jones, who studied the success of Japanese
companies identified five principles of the construction the successful quality
management system (Figure 5.7). These are assessing the value of a particular
product, determination of the value stream, providing a constant flow of the
value stream, "pull" product strategy, and continuous improvement.(Womack &
Jones 1996, p.15.)
Figure 5.7. The five principles of quality system construction (Womack & Jones 1996, p.15)

86
A. Kudryashov, in the context of Russian companies adds one more factor
(Figure 5.8): involvement of the employees in the activities and endowing them
with the necessary authority (Kudryashov 2012, p. 63).
Figure 5.8. Six factors (Kudryashov 2012, p.63)
Thus, the questions used in the interviews were divided into four blocks,
covering the above principles, namely, as employees understand the production
process as a whole, how they understand the value creation process of the
product, how they are involved in this process, what their expectations they
associate with the company.
1. How participants understand the process of creating a product in general?
What are the basic steps of creating a product they release?
2. How do they understand their place in the process of creating a product?
What do they evaluate from their point of view of the importance of this stage?
How do they rate their competence? What are the difficulties? What are their
relationships with colleagues in the chain? What kind of DMP (decision
makers), they can call?
3. How do they assess the activity of the enterprise as a whole? Why? What are
the forecasts for the next few years?
Value
Value Stream
Flow
Pull
Perfection
People Involvement

87
4. What they believe is necessary to change the company? What is missing?
Are they willing to participate in the process of enterprise development? What is
for them the company as a whole, just a job, and a part of life, the meaning of
life?
Full list of issues can be seen in Annex 1. Interviews were conducted in the
period 2013 - 2014's. Venue of the interviews was the administrative building of
the enterprise in Syasstroy. The format of the interview was "face to face". All
the interviews were in Russian, and were recorded on tape. It is assumed that
interview should involve representatives of various levels of management and
product development areas, those that form the so-called value chain. So the
information of the background of the interviewees is provided in Table 5.1.
A total number of participants was 17 people. The average interview duration
was 1 hour 30 minutes. The total duration was 22 hours and 45 minutes. During
the interviews, additional questions were used in order to clarify the position of
the respondents on some issues.
№ Position Gender Age Years of experience in SPPM
1 Production Director male 38 13 2 Chief Engineer male 45 20 3 Chief Technologist male 57 3 4 Chief Power Engineer female 58 37 5 Head of Supply Chain Department female 62 8 6 HR Specialist female 64 32 7 CFO female 45 22 8 Head of IT Department male 29 5 9 Head of Paper Machines Department male 38 18 10 Foreman of Paper Machines Plot male 55 36 11 Head of Consumer Products Department male 36 14 12 Foreman of Consumer Products Plot female 57 13 13 Sales Director male 37 2 14 Head of Marketing Department male 38 8 15 Lawyer female 34 14 16 Head of Security Service male 53 8 17 Head of Quality Department female 53 27 Table 5.1. Interview participants
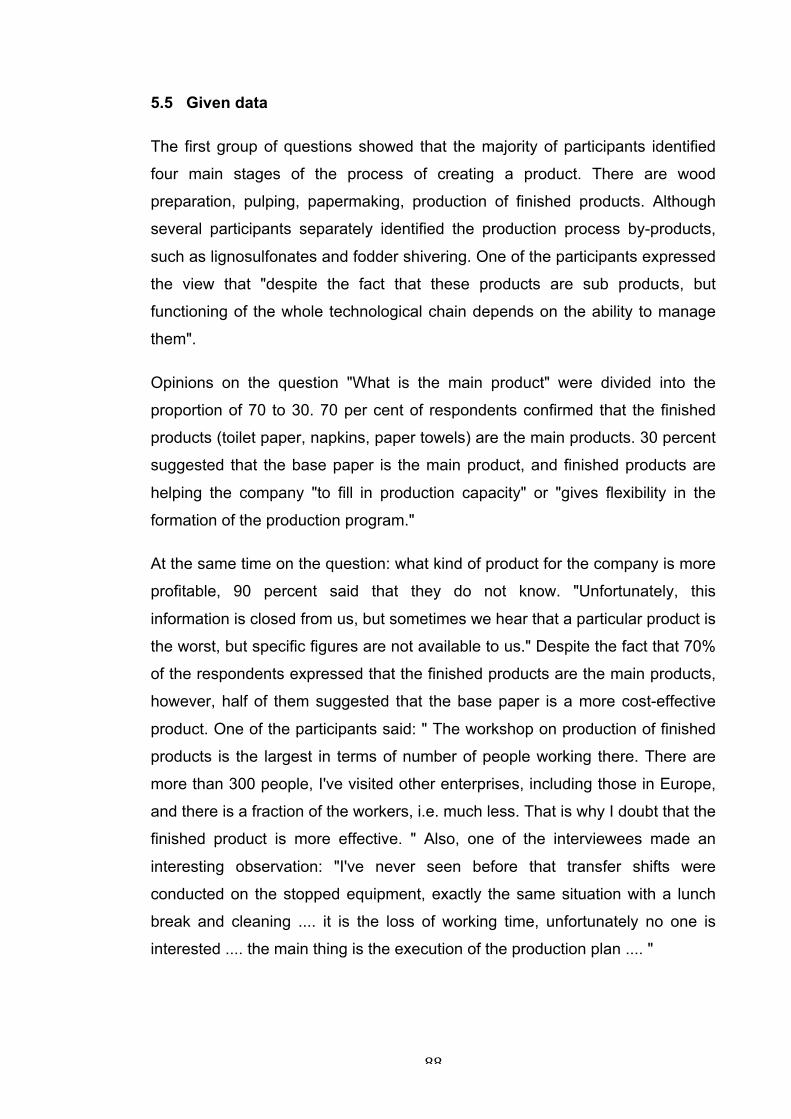
88
5.5 Given data
The first group of questions showed that the majority of participants identified
four main stages of the process of creating a product. There are wood
preparation, pulping, papermaking, production of finished products. Although
several participants separately identified the production process by-products,
such as lignosulfonates and fodder shivering. One of the participants expressed
the view that "despite the fact that these products are sub products, but
functioning of the whole technological chain depends on the ability to manage
them".
Opinions on the question "What is the main product" were divided into the
proportion of 70 to 30. 70 per cent of respondents confirmed that the finished
products (toilet paper, napkins, paper towels) are the main products. 30 percent
suggested that the base paper is the main product, and finished products are
helping the company "to fill in production capacity" or "gives flexibility in the
formation of the production program."
At the same time on the question: what kind of product for the company is more
profitable, 90 percent said that they do not know. "Unfortunately, this
information is closed from us, but sometimes we hear that a particular product is
the worst, but specific figures are not available to us." Despite the fact that 70%
of the respondents expressed that the finished products are the main products,
however, half of them suggested that the base paper is a more cost-effective
product. One of the participants said: " The workshop on production of finished
products is the largest in terms of number of people working there. There are
more than 300 people, I've visited other enterprises, including those in Europe,
and there is a fraction of the workers, i.e. much less. That is why I doubt that the
finished product is more effective. " Also, one of the interviewees made an
interesting observation: "I've never seen before that transfer shifts were
conducted on the stopped equipment, exactly the same situation with a lunch
break and cleaning .... it is the loss of working time, unfortunately no one is
interested .... the main thing is the execution of the production plan .... "

89
The second set of questions showed that the assessment of participation in the
process of creating the final product is minimal. Each of the participants in the
interview said that the previous stage in the creation of a product is the most
important. While the activities of each subsequent unit, in principle, depend on
the outcome of the previous one, in other words, the quality of the product
produced by the plot directly affects the outcome of further processing. So the
employee of the final product workshop stated that he is totally dependent on
the quality of the products that it receives from the workshop for the production
of base paper. In turn, the participant of the workshop of the production base
paper argued that the quality of its products depends on the production of pulp
and so on.
On the question of whether they can directly or indirectly affect the quality of the
products of their partners, all participants answered yes in theory, but in fact no.
When asked why, all unambiguously answered that it is because of wrong
motivation. Motivation is aimed at achieving the production plan, and does not
take into account certain features of a certain workshop. “For example, in a
workshop for the production of base paper in an attempt to reach the production
plan it is sometime required to reduce the percentage of moisture on the paper,
in order to increase the speed of the paper machine. It is not critical to the sale
on the B2B paper market, however it significantly affects the processing of the
final product on our own lines, which in turn reduces the speed lines” - said one
of the interviewees.
On the question of how the quality department affects these questions, the
answers were awesome, " they also all depend on the production plan results."
One of the interesting responses was as follows: "in general the quality
department in our company only fixes defects, although in principle its task is to
prevent them ….. And if the percentage of defects is above the average, they
are forced to negotiate with the workshops". Even more surprising was the
answer to the question "is the quality of products for you a motivating factor ": of
course we get a bonus for the quality of products …but in the case of achieving
the performance of the plan".

90
During the interview, all participants identified only two individuals who make
decisions. On the question of delegation of authority, 40% said that they have
the authority, but it is very limited. 20% were undecided. 10% said that they did
not have the authority, and, at best, they can give their expert assessment in
decision-making processes. 30% said that they have the necessary powers to
solve everyday problems.
The next group of questions gave an understanding of the current condition of
the enterprise as a whole among the interviewees. 15 of 17 respondents said
the current state of the enterprise is "chronically ill", but they noted that
business is better than 10 years ago. Among the main problems they have
identified the persistent lack of funding to address the current challenges,
because of what the problems are not solved, but simply "are stopped".
Another problem was identified by five participants; too wide a range of
products. "We produce more than 150 kinds of products, and more than 20
kinds of base-papers ... All that leads us to have huge balances in storage in
the form of finished products as well as in base-paper and raw materials ...it
leads to the big problems with production planning. On the one hand it is very
good that we listen to the needs of the market, but on the other hand, all that
hampers production and increases the risk of safety, for example. "
The next problem, which one of the participants identified, is the lack of
information flows. "Today the company has two operating systems that are able
to solve current problems, reduce the down time " of walking in the corridor ".
But for some reason the staff prefer to use a spreadsheet format " Excel " that
makes it impossible to correctly analyze the data, and also inhibits the
development of information systems to the format of the ERP (Enterprise
Resource Planning). Also there is a system of total dependence on the
information that is stored with a particular person. As a result, information
security is non-existent. "
Another weakness of the companies identified by half of the participants is the
personnel. "Today, the company employs more than 2,000 people, of whom
two-thirds are after 45 ". There is a very small number of young people. And

91
those that company has, they do not have a deep interest in the company. They
would rather go just to "serve" their time. Apparently they earn basic income
elsewhere. That is why among those who are ill or are on an educational leave,
60% are young people. Among the middle aged people a large percentage is
alcohol-addicted".
The last group of questions was devoted to the respondent’s opinions on what
is necessary to change in the company and in its activities. First and foremost,
the majority of respondents in varying degrees, identified indifference of
employees. The reason, according to the respondents, is the closed position of
the top managers and the high degree of bureaucracy, as well as the lack of
funds. Therefore many of the initiatives are damped at the first level of
management, at the level of foreman. "If one says what is necessary to change,
it is primarily relevant to their duties. Today people are totally indifferent, if the
floor is covered with garbage, then no one would ever think to pick it up, simply
bypass as an obstacle ... The same applies to their appearance, in case of their
coveralls, and condition of workplaces … everywhere there are absolutely
unnecessary things, you know how in the garage there is all that can be useful
someday" - told one of the interviewees.
"It seems to me that, despite the apparent indifference, people are willing to do
something, they just do not understand how they can do something .. It's no
secret that our solutions are changing fast enough .... and frankly, sometimes
people doing absolutely unnecessary work .... in workshops there aren't
someone who could organize people properly .... too large gap between wages
and the hierarchy of power "- was the opinion of another respondent.
However, all respondents unanimously expressed their willingness to
participate in change, regardless of the material benefits. The most abundant
opinion was that the situation could be remedied by the arrival of large
investors, such as foreign companies. On the question whether they meet the
competences level of foreign companies, the majority responded negatively. "I
think our level of competence today is lower than our competitors, companies
such as SCA. There are several reasons, firstly our working day is organized so
that just physically there is no strength enough for training. Secondly, it is

92
difficult to find even one day to visit another company and discover how other
companies manage their everyday activities "- told one of the respondents.
5.6 Main outputs from the interviews
Based on the data obtained in the course of the interviews, there are several
major factors that directly or indirectly affect the quality of work nowadays.
Insufficient mechanism of the management decisions is a factor. In many
cases, the decision-making process is significantly bureaucratic. Business
processes and workflows are not formalized enough, that gives rise to an
uncoordinated and conflicting decisions. Lack of harmonization of strategic and
operational planning and management is evidence.
There is a lack of a clear division of the boundaries between authority and
responsibility when units of "SPPM" interact in their daily activities. The
undeveloped system of delegation responsibility and monitoring the
effectiveness of management decisions leads to the excessive centralization of
management. There are no mechanisms to increase the interest of each
business unit in the processes of creation of any product or service of SPPM.
Quality management activities have fragmentary nature. The currently existing
elements of the quality management system in the structural units of SPPM are
not integrated into a single system and are not intended to achieve corporate
strategic goals.
There is a lack of unified methodological approaches to the diagnosis of the
quality and system of formalized service quality indicators of SPPM, in addition
there are no defined criteria for assessing the quality of service and efficiency in
terms of financial results of SPPM for each of the processes.
Using outdated regulations and not meeting the modern requirements of
technical regulations is not conducive to the effective implementation of
technological processes. This does not provide them with flexible optimization
in order to improve the quality and efficiency of resource usage.

93
There is imperfection of existing systems of internal marketing at SPPM.
There is an ineffective management of the information flows. The collection and
analysis of information, as well as internal statistical reporting is not fully
optimized, there is no single system that provides measurement, collection and
analysis of information about the quality of services and processes that can
promptly and objectively assess the performance of SPPM and effectively
manage resources and processes.
There is an imperfection and opacity of the current system of employee
motivation. The current motivation system does not allow to achieve the
required exist level of employees interest in the quality of internal or final
products of SPPM. There is no correlation between the levels of quality and
motivation based on the system of indicators, providing motivation for each
employee doing the job.
Summarizing these findings, there are three key points. The existing quality
management system does not fulfill its primary tasks, process control and loss
prevention. The nature of the service quality is aimed at fixing manufacturing
defects. The main goal of the company's quality system today is to match a
specified percentage of defects, rather than trying to reduce them as a whole.
The second important point is the lack of involvement of staff in the process of
any improvements. There are two negative factors: improper motivation aimed
only to obtain material values and lack of leadership institute. Finally, the third
important point is quite on authoritarian way of enterprise management, where
decision-making is concentrated in the hands of two key persons. All control is a
top-down and bottom-up movement is quite bureaucratic. In addition, there are
no clear boundaries between departments’ responsibilities in their daily
activities.

94
6 Case of KBR East company
This section presents the case of KBR. The information about the company in
the world and the history of the company in Russia will be presented at the
beginning. Then the information about the system and the principles of quality
management in the company will be provided. The method of data collection
was the interviews with CEO George Braddy and employees. Also, as a source
of information, the materials provided by Dmitry Timokhin, who is the head of
quality department were used, as well as my personal visits to the plant in
2013-2015 gave insights to the study.
6.1 KBR profile
The history of the company is more than 100 years, since its establishment in
1901 by Morris W. Kellogg. That year in New York he opened a tiny pipe
fabrication business, which would become a world-class engineering firm. Over
a century of history M.W. Kellogg underwent numerous acquisitions and name
changes from 1944 through the late 1980s, when it was acquired by Dresser
Industries, a provider of integrated services and project management for the oil
and gas industry. Ten years later, Halliburton acquired Dresser, and combined it
with M.W. Kellogg and Brown & Root to create a new, larger subsidiary —
Kellogg Brown & Root (KBR). (KBR.)
Finally, in 2006, KBR separated from Halliburton and completed a successful
initial public offering on the New York Stock Exchange. Today, KBR employs
approximately 27,000 people. The headquarters are situated in Houston (US),
but KBR operates in more than 70 countries on six continents and is considered
one of the world's premier engineering, procurement and construction (EPC)
and services companies. Among their services are the following: Engineering,
Procurement, Construction, Design/build, Proprietary process technologies,
Program and project management, Operations and maintenance, Logistics
management and support. (Ibid.)

95
6.2 KBR in Russia
In 2012 the company celebrated the 10th anniversary of its activities in the
Russian market. Nowadays, the KBR is a general contractor and partner of
International Paper (IP), one of the largest companies in the pulp and paper
market (Ibid).
In their turn, the IP activity in Russia began in 1998, when Svetogorsk pulp and
paper mill had become part of International Paper. Svetogorsk pulp and paper
mill, founded in 1887, it is the main enterprise of Svetogorsk, where about
16,000 people live (International Paper). It is a similar situation with the case of
Syassky PPM, as well as industry affiliation, and that is one of the reasons why
this case was chosen.
The most important area of services provided by the company for IP is the
management of equipment reliability, with the formation of the corresponding
service culture with an emphasis on maintaining the "health" of equipment
instead of repair and response to failure. A strategic choice of KBR is the
movement on the way of continuous improvement. This is the active
implementation of the enterprise practices "lean production", including the
organization of the working space by the 5S system, methods of analysis and
problem solving, general maintenance of equipment, quick changeover and
others (Figure 6.1).

96
Figure 6.1. Service Excellence System of KBR (KBR Internal Materials)
6.3 QM is a philosophy
KBR East is located in Svetogorsk (Russia), provides maintenance,
construction, engineering, and consulting services across Russia. They have
over 750 technical, professional, and subject matter experts.
Figure 6.2. George Brady CEO of KBR East (Russia)
George Brady has been the CEO of KBR East since 2009. Before that he worked in various positions at companies such as Scott Paper, Georgia-Pacific LLC, Bowater Newsprint, Life Cycle Engineering. In 1996 he graduated from the University of Alabama, in 2008 from the University of Villanova. He was educated in the field of quality management system of lean production and Lean Six Sigma.

97
According to Mr Brady, one can give any definition of the concept of quality
management. In the literature, there can be found hundreds of them, but the
essence of these definitions it is a philosophy, based on which whole business
of the company is constructed. At the heart of the philosophy, there are simple
and clear principles: transparency and clarity of all processes, the fight against
loss and decision-making based on facts, statistics, and the use of analysis
tools. But most importantly, the foundation of all the changes and improvements
is the involvement of all employees in this process (Brady 2014).
"When I came in 2009 to this position, I could clearly see the perplexity of staff.
They did not have at all any system of coordinates, just the absence of any
motivation other than salary. Correspondingly, the most important task was to
bring people into a single system. Based on my own experience and experience
of my colleagues, I can say that the workers do not need loud slogans or
demonstration of complex methodologies, they need simple and clear tasks,
which can solve their problems at the same time "- Mr. Brady said during the
interview.
According to Mr. Brady, the 5S system is an effective tool. From the words of
Mr. Brady, it is nothing like just putting things in order around you, and that is
clear and simple for workers. In fact, the first step is nothing new. The new idea
here is that action leads to behaviour change of the employees. This arises
from the learning process, and If learning has been taken successfully, the
organisational behaviour will be lifted to a dynamic and challenge-seeking level.
This will influence the top management in defining their vision. Built on firm
foundations, the new vision will establish a new culture within the organisation.
5S is a powerful quality tool for everyone to get involved in the improvement
process. (Brady 2014)
Indeed, according to Olofsson, the 5S system is able to unite people in a desire
to make their workplace better, which brings a sense of pride in the results of
the work with their own hands (Olofsson 2015, p. 15). In turn, it increases the
motivation and sense of morality in general, that is why 5S is often the first step
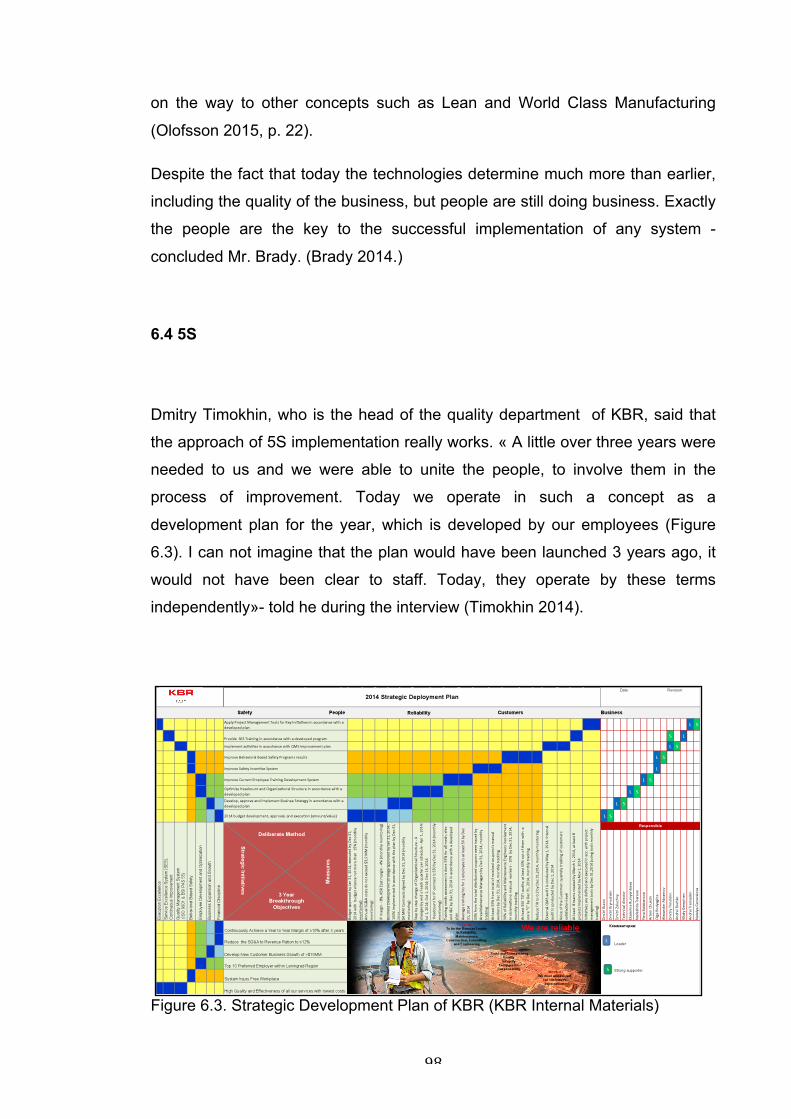
98
on the way to other concepts such as Lean and World Class Manufacturing
(Olofsson 2015, p. 22).
Despite the fact that today the technologies determine much more than earlier,
including the quality of the business, but people are still doing business. Exactly
the people are the key to the successful implementation of any system -
concluded Mr. Brady. (Brady 2014.)
6.4 5S
Dmitry Timokhin, who is the head of the quality department of KBR, said that
the approach of 5S implementation really works. « A little over three years were
needed to us and we were able to unite the people, to involve them in the
process of improvement. Today we operate in such a concept as a
development plan for the year, which is developed by our employees (Figure
6.3). I can not imagine that the plan would have been launched 3 years ago, it
would not have been clear to staff. Today, they operate by these terms
independently»- told he during the interview (Timokhin 2014).
Figure 6.3. Strategic Development Plan of KBR (KBR Internal Materials)

99
According to Mr. Timokhin, the 5S system consists of five steps. These are
sorting, simplifying, systematic cleaning, standardizing and sustaining. In
general, there is a sequence of steps, each of which has its own task. Sorting
aims to eliminate unnecessary items from the work area and complete an initial
cleaning. All items used in the work can be divided into several groups (Figure
6.4). The first group of items is the things that are regularly used and these
kinds of things have to be always at hand. This reduces time on search and
time for the movement of workers. The second group of items is items used at
regular intervals. For example cleaning equipment or special tools. There
should be organized a special place for these type of things. The next group of
items, which are used rarely or not at all, should be removed from the working
area. (Timokhin 2014.)
The next step is simplifying. It means, finding a place for everything. Everything
should be in place, clean and ready to use. Simplification is organizing the
workplace to ensure safety and effectiveness (Figure 6.5).
Figure 6.4. Sorting criteria (KBR Internal Materials)

100
The third step is to organize a systematic inspection for cleaning. Regular daily
cleaning and inspection of work areas and equipment will help to understand
the current status and determine if a corrective action is required. The idea is
make daily cleaning and inspections easier. The steps of systematic cleaning
are to identify points to check for performance, to determine acceptable
performance, to mark equipment and controls with visual indicators, and to
conduct daily cleaning and visual checks. (Timokhin 2014.)
Figure 6.5. Simplifying (KBR Internal Materials)
The fourth step consolidates results. This step forms the standards that apply to
all areas. Since the workplace team establishes the standards, everyone should
have had some involvement in establishing the 5S system in their work area.
Still, it is important to make these standards very clear. The stages of
standardization are: Setting a routine check-list for each workspace, which will
show what the command should be checked during self-examination;
Introducing a multi-level audit where each level in the organization has a role in
ensuring that 5S is maintained in working areas and that the 5S system
develops and strengthens; Establishing and documenting standard methods,
including regulations and circulars, across similar work areas (Figure 6.6).

101
Figure 6.6. Standardization (KBR Internal Materials)
Lastly, the fifth step must bring sustainability. If all the steps are done correctly,
you will be able to visually see that everything is in its place. That is important,
but not sufficient. A more systematic way to prevent backsliding and to support
continuous improvement is needed. The steps of sustaining are: establishing
and supporting workgroup on improvements, based on identified leaders in the
implementation of the four steps; regular audits, using the 5S checklist;
addressing backsliding and new opportunities found during routine checks;
conducting scheduled, routine checks by team leads or supervisors or by
people from outside of the workgroup. It is through sustaining activities that the
practice of 5S is refined. When items are not returned to their homes, the cause
is most likely to be that the home was inconvenient. When the work team
addresses these problems, they improve the sustainability of 5S and, more
importantly, they improve safety, morale, and productivity. (Timokhin 2014.)

102
6.5 Obstacles in the implementation of 5S
Despite the simplicity of the model, the implementation of the system often
results in failure. Often, companies mistakenly view 5S as just a housekeeping
activity. Apart from that, there is a number of obstacles in the implementation
that leads to failures. According to a study conducted by Anthony Manos and
Jennifer Molski there are: 1) lack of management support, 2) not enough time,
and 3) resistance to change (Manos & Molski 2011, p.5).
Other barriers, which were identified by researchers are poor communication,
the poor training and awareness of 5S and a significant barrier is the space
between managerial level and shop floor employees (Ghodrati & Zulkifli 2012,
p. 12).
Dmitry Timokhin also confirms that these factors are the main risks in the
implementation of 5S. "In the case of KBR, we used a number of tools in order
to avoid these risks. First of all, we have not experienced problems with the
support of management, as the main initiative came directly from Mr. Brady. In
cases with other companies, I recommend starting with the involvement of top
management, they need to "be got sick" by this idea, and here it is needed the
help of professionals in this area to achieve it " - said Mr. Timokhin. (Timokhin
2014.)
Secondly, we have launched some PR campaign. The basic idea was to bring
to the workers the need for change with the idea to improve safety in the
workplace. Mr. Brady personally met with workers to convey to them this idea.
Next, using various means (Internet, personal meetings, direct telephone line),
we have provided feedback directly to Mr. Brady "- continued Mr. Timokhin
(Ibid).
"Next, we launched a pilot area in which we tried to work out all steps of
implementation, taking into account the specifics of the company. But the most
interesting thing that we found that people watching the pilot site have begun to

103
change some things independently at their workplace. Today, almost 90% of
production sites have implemented a 5S system" - told Mr. Timokhin. (Ibid.)
"Of course, we are faced with a situation of backsliding and made sure that this
situation can be overcome only by training and by practice regular audits. In
addition, a very useful tool is the visualization and information desks (Figure
6.7)" - summed up Mr. Timokhin (Ibid).
Exactly the same findings were reported in the study conducted by Manos &
Molski . Among the means to overcome these obstacles, respondents singled
out training and coaching, show the benefits, audits and reward, communication
and sharing best practices (Manos & Molski 2011, p.6).
Figure 6.7. Information desk (KBR Internal Materials)

104
6.6 Benefits of 5S
What are the other benefits of the introduction of 5S? According to Olofsson,
one can highlight the direct and indirect benefits from the implementation of the
system. The direct benefits it considers are improved safety, wellbeing and
productivity. The indirect benefit is building the foundation for further improving
the company (Olofsson 2015, p. 13).
Olofsson stresses that safety is improved by being serious about keeping
everything in order. When everyone starts following the routines and rules, a
safe and secure circle is created (Olofsson 2015, p. 14). In case of wellbeing,
he notes that working in a functional and clean place, which was done
personally by employees, creates good feelings and pride, and it increases
motivation and morality of the staff (Olofsson 2015, p. 15).
With regard to productivity Olofsson identifies three main reasons that affect
productivity growth. These are increased productivity and quality by making
fewer mistakes, increased productivity by better reliability and increased
productivity by less searching (Olofsson 2015, pp. 17-19).
As for the indirect benefits, Olofsson pays attention to the fact that working after
a standard that is always being improved is a supporting pillar of successful
concepts like Lean Manufacturing and Total Quality Management, so one can
consider 5S as the first step on this way (Olofsson 2015, p. 21).
In turn, Mr. Brady said, despite the fact that the main task was to engage staff
with the idea to do the work safely, he can confirm that the implementation of
5S brought both tangible and intangible benefits (Figure 6.8). First of all, an
indicator of material benefits can be measured as a ROI (return on invest),
which was 1.5. Among the intangible benefits can be identified: increasing the
involvement of staff in improving; improved safety, increasing customer
satisfaction, improving the company's reputation, and improving production
standards. (Brady 2014.)

105
Figure 6.8. 5S long-term effects (KBR Internal Materials)
6.7 Main findings of the KBR case study
Summarizing the findings one can distinguish the following:
1. The main driver of change has been the CEO commitment to the principles of
total quality management
2. The main objective was to involve staff in the process of change
3. The 5S system has been chosen as the most appropriate tool to achieve the
objective
4. The criterion for the choice of 5S was the ease of implementation, as well as
a visual opportunity to observe the results achieved
106
5. PR campaign of the agenda was conducted in order to avoid well-known
obstacles
6. The idea of work safety was selected as agenda
7. A pilot site was originally selected to run the system
8. In order to avoid backsliding the following tools were used: regular coaching
and training, regular audits, development of regulations for the daily self-
assessment, direct communication with top management, the elicitation of the
leaders and the creation of working groups headed by the leaders, a system of
incentives and rewards.

107
7 Expert opinion
This section is dedicated to the expert opinion. First, information will be
provided directly from an expert. Having more than 20 years of experience in
various countries and being expert in the field of 5S implementation and
research, professor Samuel Ho was chosen to give an expert opinion in this
study. The following discussion focuses directly on the 5S system.
7.1 Who is Mr. Ho
Professor Samuel K. M. Ho (PhD in Mangt., FIQA, ISO9000 Lead Auditor, EQA
Assessor) is the Professor of Strategic and Quality Management of the
International Management Centres, UK. Before that, he was the Professor of
Strategy and Quality at the Luton Business School, the first professor in that
discipline in the UK. In 1987-88, he was awarded the Oshikawa Fellowship by
the Asian Productivity Organization to do research in South East Asia and
Japan. (CMQR.)
Не has improved and defined its terms in English/Chinese and developed the
world's first 5-S Audit Checklist, which was used for training in Malaysia under
an Asian Development Bank Quality Expert assignment in 1993-94 at SIRIM.
In 1998, he successfully bid for a HK$4.6 million project from the Industrial
Support Fund to train 2,500 people over a 2-year period to become the world's
first 5-S Lead Auditors. The response since launch has exceeded all
expectations, and as a result, the HK 5-S Association has been founded by
Prof. Ho in May 1999, and has now over 10,000 members. Furthermore, a 5-S
Company Certification scheme has been launched since 2001, and by now 80
firms of all kinds have registered, all recorded substantial improvement in

108
safety, hygiene, quality, productivity, image and competitiveness. He has been
the Principal Consultant to the Tao Heung Group on 5-S and ICSS since 2001.
In 2003, basing on the 5-S foundation and the ICSS framework, he had
successfully led the Tao Heung Group to win 4 awards from the CRE Award.
(Zoominfo 2015.)
7.2 Why 5S works
According to Ho, 5S is actually what every business wants. To achieve those
vital performance benefits it just happens that you need to Sort, Straighten,
Shine, Standardize and Sustain in order to create the right workplace situation
that will deliver the competitive performance a business needs. 5S does not
require major investment and deep theoretical knowledge. The system is based
on simple steps that you need to perform on a daily basis. The key here is the
concept daily. All that ultimately leads to the formation of self-discipline among
the workers. (Ho 2010, p.45.)
“Self-discipline means instilling the ability of doing things the way they are
supposed to be done”(Ho 2010, p.47). In other words, the goal is to make the
workplace with good habits. It is based on the involvement and training how it
should be done. So it breaks the old bad habits and form new attitudes. Daily
activities and practice create the discipline, which is an integral part of
production safety and productivity (Ibid).
Ho suggests, based on McGregor's "X" and "Y" theories of human behavior and
also "Z" Ouchi theory that " In order to make a successful and painless
transition from Theory X to Theory Y and then to Theory Z, organizations
should install some degree of discipline in the form of procedures and work
instructions. Consequently, self-discipline should be encouraged. Finally, the
employees will develop their own self-discipline framework. Ouchi has refined
McGregor’s theory, as he found out that self-discipline is important for
organizational success". (Ho 2014, p.273.)
Thus one can consider that the 5S system could be viewed as such tool, which
secure this transition.

109
7.3 5S is the foundation to continuous improvement
Ho says that the events of recent years in all areas of life (political, economic,
social and technological factors) have undergone significant changes, which led
to a paradigm shift in the process of strategic change of companies (Figure 7.1).
He argues: "The new idea here is that action leads to behaviour change of the
employees. This arises from the learning process". (Ho 2007, p. 2.) If the
learning process is built properly it will inevitably lead to a change in behavior,
corporate vision and culture in general. Ho confirms that by example of
'Kaizen': "Being action oriented, 5-S is a powerful quality tool for everyone to
get involved in the improvement process. Therefore, it is a very effective way to
implement the new management paradigm."(ibid.)
Figure 7.1. New paradigm (Ho 2007, p.2)
Based on the experience derived from the implementation of the
comprehensive quality management system and through in-depth research in
Hong Kong, Japan and the UK, Ho has identified the 5-S practice as the step
number one for a TQM/BE programme (Figure 7.2). He realized that "5-S is an
important step towards process improvement, the key to ISO 9000, ISO 14000
and OHSAS 18001 and can be used as an integrating tool towards “Business
Excellence”" (Figure 7.3). (Ho 2007, p.2.)
Figure 7.2. From 5S to TQM (Ho 2007, p.2)
To understand how this model works, it is necessary to look at each step in
detail. The implementation of 5S in addition to the staff involvement and

110
motivation brings clarity to existing business processes. BPR causes re-defining
and designing your business process effectively in order to meet the business
objectives in accordance with the needs of your customers. QCCs encourage
the employees to participate in continuous improvement. They improve human
resources capability to achieve the business objectives. ISO unites the
practises of the three previous steps, creating a quality management system.
TPM is a logical step, where lie the approach of 5S and the procedures required
by ISO standards. In case of successful implementation of these five steps the
company is ready to reach TQM. (Ho 1999, p.75.)
Figure 7.3. TQMEX model (Ho 1999, p.70)

111
7.4 Summary of the section
Taking into account the vast experience of Professor Ho in the field of research
and practical implementation of 5S, one can agree with his opinion that this
model can be applied to achieve certain goals. These tasks include the desire
to involve staff in the process of change and improvements; attempt to change
the behavior of the workers, which ultimately leads to changes in production
culture generally and can serve as a foundation for further continuous
improvement and the creation of a quality management system in the company.

112
8 Data analysis
The literature review, which was carried out in the second section of this study,
led to the following conclusions:
All methods are based on the main principles:
- Reduction of waste and defects
- The processes and standardization
- Customer focus
- Involvement of all employees in process improvement
- Continuity of action
It was also found out that for the company to reach the successful
implementation of a particular model, it is needed to determine the current state
of affairs in the company. And based on this finding to select the most suitable
approach.
The case study of Syassky PPM revealed that the company has not a quality
management system. Efforts of the quality department aimed only at identifying
defects. The process of identifying the causes and the correction process is
missing. In addition, there is no engagement and motivation of staff in the
process of improvement, there is only one objective to execute the production
plan. Further, the company has a quite authoritarian management style; as a
consequence there are no clear lines of responsibilities between departments.
The case study of KBR showed that the company had more or less similar
problems. The implementation of the 5S program really helped to solve these
problems. Furthermore, the time needed to set this system was much lower
than expected. However, in the case of KBR there was a major driver the CEO,
who is committed to the philosophy of quality management and has the
necessary knowledge and practical experience.

113
The expert's opinion confirmed that the 5S system is a successful tool,
particularly for solving problems similar to those, which were found in the case
study of Syassky PPM. Moreover, he argues that 5S is the foundation for
further improvements and from this point the company can move towards total
quality management.
Thus, it can be assumed that the 5S system may be seen as the first step of
Syassky PPM in the process of improving their efficiency, especially considering
the factor that the 5S model is simple and does not require large investments in
comparison with other methods. However, one must take into account the factor
that if KBR did not require the involvement of specialists to implement this
approach, due to CEO experience, in case of SPPM, it will be necessary to
attract professionals. Firstly, experts will be required for the formation of a
positive attitude of the top management of the company, because there is now
quite a skeptical attitude to such instruments. Secondly, experts will be required
in the process of implementation and training of employees. Also in the case of
SPPM, it is necessary to analyze the idea of the agenda. What kind of images
will reflect needs and expectations of employees, which can be grouped under
the idea of the introduction of 5S?
Hence, the road map might look as shown in Figure 8.1.

114
Figure 8.1. Road map
The first phase is preparation that will include:
- The choice and involvement of experts
- Coaching of top managers
- Selection of the pilot area
- The development of an implementation plan
- The choice of the agenda
- PR campaign
- Setting feedback instruments
The second phase is the implementation of the 5S system. The second phase
will require the establishment of a working group directly on a selected plot, as
well as conducting regular audits. The result of the successful completion of the
second phase will be the standardization process on the basis of which the
employees will be able to carry out daily self-assessment in accordance with the
standards. This is the third phase. Finally, standardization and transition to a
daily self-assessment system will lead to sustainability of the system and will
change behavior of the employees, and as a consequence will change a

115
production culture in general. Upon successful introduction, the company will be
able to see the clarity of the existing production processes, and will be able to
detect existing losses, so it can be considered as the driver for continuous
improvement. This is the fourth phase.

116
9 Conclusion
Summing up, in the course of the study, answering the main question of the
study, the main prerequisites for the implementation of quality systems in
Russia were discovered. There is the inefficiency of the state in combination
with high level of corruption. The existence of a primitive raw materials economy
hinders a) innovation development, b) massive growing of the middle class, and
c) improving the living standards of the people. There is a lack or low levels of
internal competition caused by the dominance of state-owned companies as
well as demographic risk. The existing experience in the construction of such
systems in the period of socialist development of the country, which were later
found applied in other countries. Then Russia occupies an intermediate position
on the mental map of the world, which leads to flexibility in the choice of
methods and models.
Based on the literature review, as a theoretical part, and the study of two cases
SPPM and KBR as an empirical part, the understanding was reached that given
the similarity of the prerequisites as well as the industry affiliation, the 5S
system is an acceptable tool for the first step on the road to efficiency of the
SPPM.
Further, taking into account the findings of the KBR case study as well as the
expert’s opinion possible steps of implementation of this system was shown.
However, there were a few questions that emerged during the study and that
require a separate research. First, against the backdrop of a huge number of
examples of well-functioning models of quality management as well as
prerequisites for implementing them in Russia, which were found in this study,
there is quite a skeptical attitude of the top managers to use such tools. The
question arises: What are the factors that form this attitude of top management?
Is it the result of lack of information or is there a gap in education or is there
may be something else?

117
Secondly, in the case of Russia, there is not really a clear understanding of the
process of selecting ideas for the agenda. What are the motivators that can
really reflect the expectations of employees in today's environment, especially
when we are talking about companies around which a city was formed?
The answers to these questions will help practitioners in the field of quality
management to find the most suitable approach for companies that have
decided to look inside the company with the idea to be more effective.

118
List of figures
Figure 1.1. Labor productivity in Russia, p. 9
Figure 1.2. Correlation between working hours and cost in different countrues, p. 10
Figure 1.3. The productivity formula, p. 12
Figure 1.4. Research design, p. 15
Figure 2.1. Four stages in the evolutions of QM, p. 22
Figure 2.2. Five Primary Elements, p. 26
Figure 2.3. DMAIC model, p. 30
Figure 2.4. Prescriptive approach to the selection of QM techniques, p. 36
Figure 4.1. Russias position in the ranking of Doing Business 2015, p. 51
Figure 4.2. Porters Diamond Model for the Competitive Advantage of Nations, p. 74
Figure 5.1. Rising electricity prices in Russia, p. 81
Figure 5.2. Rising electricity and natural gas prices in Russia, p. 82
Figure 5.3. Rising wages in Russia, p. 82
Figure 5.4. Dynamics of pulpwood prices in Russia, p. 83
Figure 5.5. Dynamics of pulp prices in Russia, p. 83
Figure 5.6. The structure of production cost, p. 84
Figure 5.7. The five principles of quality system construction, p. 85
Figure 5.8. Six factors, p. 86
Figure 6.1. Service Excellence System of KBR, p. 96
Figure 6.2. George Brady CEO of KBR East, p. 96
Figure 6.3. Strategic Development Plan of KBR, p. 98
Figure 6.4. Sorting criteria, p. 99
Figure 6.5. Simplifying, p. 100
Figure 6.6. Standardization, p. 101
Figure 6.7. Information desk, p. 103
Figure 6.8. 5S long-term effects, p. 105

119
Figure 7.1. New paradigm, p. 109
Figure 7.2. From 5S to TQM, p. 109
Figure 7.3. TQMEX model, p. 110
Figure 8.1. Road map, p. 114

120
List of tables
Table 1.1. Distribution of TNCs by production specialization and country of residence in 2012, p. 7
Table 2.1. Lean Manufacturing Metrics, p. 28
Table 2.2. Integration steps of Lean Thinking and Six Sigma, p. 32
Table 2.3. Characteristics and Comparison of Business Improvement Techniques, p. 35
Table 3.1. Relevant Situations for Different Research Strategies, p. 39
Table 4.1. Drivers of the PEST model dimensions, p. 48
Table 4.2. Russias rating among the"Big Twenty" in 2014, p. 50
Table 4.3. The Worlds Most Resource-Rich Countries, p. 53
Table 4.4. Prospective assessment of Russias population, in million, p. 59
Table 4.5. The age structure of the population of Russia in 2010 and 2030, p. 59
Table 4.6. Prospective evaluation of working age population (15-64 years), in million, p. 60
Table 4.7. The number of organisations engaged in research and development, by type of organisation in the Russian Federation, p. 63
Table 4.8. Statistics by country, p. 63
Table 4.9. Innovation indicators, 2012, p. 64
Table 4.10. Comparative analysis of the characteristics of organisational culture, p. 71
Table 5.1. Interview participants, p. 87

121
References Acur, N. & Englyst, L. 2006. Assessment of strategy formulation: how to ensure quality in process and outcome. INTERNATIONAL JOURNAL OF OPERATIONS & PRODUCTION MANAGEMENT, 26(1), pp. 69-91. American Society for Quality. http://asq.org/learn-about-quality/continuous-improvement/overview/overview.html. Accessed on 10.05.2014. Atkinson, R. 2013. Competitiveness, Innovation and Productivity: Clearing up the Confusion. THE INFORMATION TECHNOLOGY & INNOVATION FOUNDATION. Baranov, N. 2010. The political grounds of Russia's modernization. BULLETIN OF PHILOSOPHY AND SOCIOLOGY AT KSU, KURSK, 2010, №2, pp.140-143. Brady, G. 2014. Interview. Study the experience of the KBR, November 2014, Svetogorsk, Russia. Bernolak, I. 1997. Effective measurement and successful elements of company productivity: The basis of competitiveness and world prosperity. INTERNATIONAL JOURNAL OF PRODUCTION ECONOMICS, 52(1-2), pp. 203-213. Bergquist , B., Garvare R. & Klefsjö, B. 2007. Invited chapter, Chapter twelve: Quality Management for Tomorrow. Edited by: Foley, K., Hensler, D., Jonkers, J., in Quality Management and Organizational Excellence: Oxymorons, Empty Boxes or Significant Contributions to Management Thought and Practice? SAI GLOBAL LTD., SYDNEY. Bergquist, B., Garvare, R., Eriksson, H., Hallencreutz, J., Langstrand, J., Vanhatalo, E., Zobel, T. 2012. Alive and kikcing– but will quality management be around tomorrow? A SWEDISH ACADEMIA PERSPECTIVE, QUALITY INNOVATION PROSPERITY, XVI/2–2012, pp.1-18. Bessant, J. , Caffyn, S. , Gallagher, M. 1999. An evolutionary model of continuous improvement behaviour. TECHNOVATION, 21 (2001), p.p. 67–77. Bessonova, E. 2010. The Impact of Internal Competition and Foreign Investments on the Efficiency of Russian Industrial Enterprises. JOURNAL PRIKLADNAYA EKONOMETRIKA, NO 1, pp. 106—127. Bliakhman, L., Gazizullin ,N. 2014. Theoretical foundation of the transition to socio-innovative systematic economy. JOURNAL PROBLEMS OF MODERN ECONOMICS, ISSUE N 3 (51), 2014, pp. 7-14.

122
Bhuiyan, N. & Baghel, A. 2005. An overview of continuous improvement: from the past to the present. MANAGEMENT DECISION, VOL. 43, NO. 5, pp. 761-771. Castells, M. 2001. ‘Information technology and global capitalism’. In W. Hutton and A. Giddens, (eds.), On The Edge, Living with global capitalism, LONDON: VINTAGE. Center for Management Quality Research. http://www.cmqr.rmit.edu.au/staff/sam.html. Accessed on 12.09.2015. Chen Yen-Tsang, João Mário Csillag, Siegler , J., Batista, M. 2012. Behavioral Operations: Applying the Theory of Reasoned Action in Continuous Improvement Capabilities. XXXVI ENCONTRO DA ANPAD, RIO DE JANEIRO, 22-26 September 2012. Cole, R. 2001. From Continuous Improvement to Continuous Innovation. QMJ, VOL. 8, № 4, 2001, ASQ, pp.7-21. Creswell, J. 2003. Research Design: Qualitative, Quantitative and Mixed Methods Approaches. SAGE PUBLICATIONS. Creswell, J. 2007. Qualitative Inquiry & Research Design: Choosing Among Five Approaches. SAGE. Crotty, M. 1998. The Foundations of Social Research: Meaning and Perspective in the Research Process. SAGE. Dabhilkar, M. & Bengtsson, L. 2004. CONTINUOUS IMPROVEMENTS IN SWEDEN: RESULTS OF THE 2ND INTERNATIONAL CONTINUOUS IMPROVEMENT SURVEY. CINET 2004, p.p. 114-126, ISBN 1-74108-069-X. Dale, B., Van der Wiele, T. & Van Iwaarden, J. 2007. Managing quality. 5TH ED, BLACKWELL PUBLISHING LTD. El-Namrouty, K., AbuShaaban M. 2013. Seven Wastes Elimination Targeted by Lean Manufacturing Case Study “Gaza Strip Manufacturing Firms’’. INTERNATIONAL JOURNAL OF ECONOMICS, FINANCE AND MANAGEMENT SCIENCES, VOL. 1, NO. 2, 2013, pp. 68-80. Eurostat. 2013. Key figures on Europe. Online Eurostat yearbook, minimum wages, available at: http://ec.europa.eu/eurostat/tgm/table.do?tab=table&init=1&language=en&pcode=tps00155&plugin=1. Accessed on 10.05.2014 Feilzer, M. 2010. Doing mixed methods research pragmatically: Implications for the rediscovery of pragmatism as a research paradigm. JOURNAL OF MIXED METHODS RESEARCH, VOL.4, pp. 6 – 16.

123
Feld, W. 2001. Lean Manufacturing: Tools, Techniques, and How to Use Them. CRC PRESS. Fey, C. & Denison, D. 2003. Organizational Culture and Effectiveness: Can American Theory Be Applied in Russia? ORGANIZATION SCIENCE, NOV/DEC 2003, VOL. 14, ISSUE 6, pp. 686-706 Financial Times Global 500. 2013. http://www.ft.com/indepth/ft500. Accessed on 10.05.2014 Fisher, N. & Nair, V. 2009. Quality management and quality practice: Perspectives on their history and their future. APPL. STOCHASTIC MODELS BUS. IND. 2009; 25: pp.1–28. Freedom House. https://freedomhouse.org/ . Accessed on 23.02.2015 FREEDOM HOUSE REPORT. 2015. Freedom in the World 2015. https://freedomhouse.org/report/freedom-world/freedom-world-2015#.VOs1rShG89U. Accessed on 23.02.2015 FTS, Federal Tariff Servise. http://www.fstrf.ru/eng. Accessed on 20.06 2015 G20. https://g20.org/. Accessed on 20.02.2015 Gershon, M. 2010. Choosing Which Process Improvement Methodology to Implement. JOURNAL OF APPLIED BUSINESS & ECONOMICS, VOL. 10, ISSUE 5, pp. 61-69. Ghodrati, A. & Zulkifli, N. 2012. A Review on 5S Implementation in Industrial and Business Organizations. OSR JOURNAL OF BUSINESS AND MANAGEMENT (IOSR-JBM) ISSN: 2278-487X, VOLUME 5, ISSUE 3 (NOV. - DEC. 2012), pp. 11-13. Gorshkov, M., Tikhonova, N. & Krumm, R. 2010. Are the Russian society ready to modernization. MOSCOW: PUBLISHING HOUSE "VES MIR". Gupta, A. 2013. Environmental and pest analysis: An approach to external business environment. MERIT RESEARCH JOURNAL OF ART, SOCIAL SCIENCE AND HUMANITIES ,VOL. 1(2) pp. 013-017, http://www.meritresearchjournals.org/assh/index.html. Accessed on 21.06.2014 Hale, D. 2010. An IntroductIon to triangulation. UNAIDS Monitoring and Evaluation Fundamentals. Hammer, M. & Champy, J. 1993. Reengineering the Corporation: A Manifesto for Business Revolution. NEW YORK: HARPERCOLLINS. Hayes R., Pisano, G., Upton, D. & Wheelwright, S. 2005. Operations, Strategy, and Technology: Pursuing the competitive edge. JOHN WILEY & SONS, N.J.

124
Ho, S. 1999. Operations and Quality Management. INTERNATIONAL THOMSON BUSINESS PRESS. Ho, S. 2007. Business Excellence through 5-S and 6-Sigma. 2007 OXFORD BUSINESS & ECONOMICS CONFERENCE, ISBN : 978-0-9742114-7-3. Ho, S. 2010. From 5-S to construction excellence. JOURNAL MASTER BUILDERS, № 4, 2010, pp. 44-48. Ho, S. 2014. The Green 5-S Model for Organisational Learning and Development. Chapter 15, pp. 268-284 of the book: Learning Models for Innovations in Organizations: examining Roles of knowledge Transfer and Human Resources. Directed by Lindsay Johnston. Published by Business Science Reference, USA. Imai, M. 1997. Gemba Kaizen: A Commonsense, Low-Cost Approach to Management. MCGRAW-HILL PUBLISHING COMPANY. Inozemtsev, V. 2014. Obsessed by "superpower status". NEWSPAPER "MOSKOVSKY KOMSOMOLETS", №26579 , 23 JULY 2014, p. 3. International Organization for Standardization. http://www.iso.org/iso/home/standards/management-standards.htm. Accessed on 12.06.2014. Institute of Demography (IDEM). National Research University Higher School of Economics http://www.hse.ru/en/demo/. Accessed on 15.01.2015. Institute of Management Development. http://www.imd.org/. Accessed on 22.02.2015. Institute of Management Development. 2014. IMD World Competitiveness Yearbook 2014 Results. Available on: http://www.imd.org/wcc/news-wcy-ranking/. Accessed on 22.02.2015. International Paper. http://www.internationalpaper.com/. Accessed on 24.11.2014 . Internet portal of the world economy. http://www.ereport.ru/. Accessed on 22.02.2015. Jones, A. 2006. Dictionary of Globalization. UK: POLITY PRESS. Juran, J. & Blanton Godfrey, B. 1998. JURAN’S QUALITY HANDBOOK. 5TH ED., MCGRAW-HILL. Kane, M., Ivanov, V., Koreshkov, V. & Skhirtladze A. 2008. Sistemy, metody i instrumenty menedzhmenta kachestva. Russian edition. Study Guide PUBLISHING HOUSE: PETER, ST. PETERSBURG.

125
KBR East company, http://www.kbr-east.com/. Accessed on 28.11.2014. KBR , Internal Materials. Klefsjö, B., Bergquist, B. & Edgeman, R. 2006. Six Sigma and Total Quality Management: Different Day, Same Soup? INTERNATIONAL JOURNAL OF SIX SIGMA AND COMPETITIVE ADVANTAGE, 2(2), pp.162-178. Klefsjö, B., Bergquist, B. & Garvare, R. 2008. Quality Management and Business Excellence, Customers and Stakeholders – Do we Agree on What We are Talking About, and Does it Matter? THE TQM JOURNAL, 20(2), pp.120-129. KOF Swiss Economic Institute. http://globalization.kof.ethz.ch/. Accessed on 20.02.2015 KOF Swiss Economic Institute. 2014. KOF Index of Globalization available on:http://globalization.kof.ethz.ch/media/filer_public/2014/04/15/rankings_2014.pdf. Access on 20.02.2015. Kohlbacher, F. 2006. The Use of Qualitative Content Analysis in Case Study Research. FORUM: QUALITATIVE SOCIAL RESEARCH SOZIALFORSCHUNG, VOLUME 7, NO. 1, ART. 21 JANUARY 2006. Kudrin, A. & Gurevich E. 2014. A New Growth Model for the Russian Economy. JOURNAL "VOPROSY EKONOMIKI", № 12, 2014, pp. 4-36. Kudryashov, A. 2012. Lean Manufacturing: IMPLEMENTATION CHALLENGES. BULLETIN OF THE UNITED NATIONS INDUSTRIAL DEVELOPMENT ORGANISATION, Russia, number 6, 2012, pp. 60- 69. Kulikov, S. 2014. 85 years later. JOURNAL CBK, № 4, 2014, pp. 14-17 Latfullin, G. & Gromova, O. 2004. Organizational Behavior. UNIVERSITY TEXTBOOK. PUBLISHING HOUSE "PETER". Available on http://www.litmir.me/br/?b=133675. Accessed on 20.12.2014. Lesonline. Internet portal for the wood industry. http://www.lesonline.ru/analitic/?cat_id=12&id=272592. Accessed on 20.12.2014. Manos, A. & Molski, J. 2011. The very best of 5S. 5S Benchmarking Survey Report. Publisher: ANTHONY MANOS. Maslow, D., Chileshe, N., Watson, P. & Belokorovin, E. 2005. THE DEPLOYMENT OF TOTAL QUALITY MANAGEMENT (TQM): THE RUSSIAN EXPERIENCE. In: Khosrowshahi, F (Ed.), 21st Annual ARCOM Conference, 7-9 September 2005, SOAS, University of London, Association of Researchers in

126
Construction Management, Vol. 1, pp. 201-214. Mardani, A. & Kazemilari, M. 2012. Relationship between national culture and TQM implementation. Case study: Iranian multinational electrical manufacturing companies. ASIAN JOURNAL OF MANAGEMENT RESEARCH ,VOLUME 3 ISSUE 1, 2012, pp. 293-312. Marshall, C. & Rossman, G. 1999. "Designing Qualitative Research". 3 RD EDITION, SAGE PUBLICATIONS, LONDON, UK. Martínez-Lorente, A., Dewhurst, F. & Dale, B., 1998. "Total quality management: origins and evolution of the term". THE TQM MAGAZINE, VOL. 10, ISSUE: 5, pp.378 – 386 McDonald, P. & Temple, J. 2008. Demographic and Labour Supply Futures for Australia. AUSTRALIAN DEMOGRAPHIC AND SOCIAL RESEARCH INSTITUTE, Final report. McKinsey Global Institute. 2009. Lean Russia: Sustaining economic growth through improved productivity. WASHINGTON, D.C.: MCKINSEY & COMPANY, INC. Message from the President of the Russian Federation Medvedev D. to the Federal Assembly of the Russian Federation on 12 November 2009. Official web site of the President of Russia Medvedev D. 2009. http://www.kremlin.ru/transcripts/5979. Accessed on 28.02.2015 Migranyan, A. 2006. Putin's reforms state structure Russian policy. LECTURES / ED. NIKONOVA M. 2006. Mishin, V. 2005. Upravlenie kachestvom. Russian edition. PUBLISHING HOUSE UNITY. MOSCOW. ISBN 5-238-00857-0. Naryshkin, S. 2007. The Innovation Constituent of Investment Process. JOURNAL VOPROSY ECONOMIKI, №5, 2007, pp. 52-64. Nayyar, N. 2006. Globalization, History and Development: A Tale of Two Centuries. CAMBRIDGE JOURNAL OF ECONOMICS, № 30. Neely, A., Adams, C., & Kennerley, M. 2002. The Performance Prism: The scorecard for measuring and managing business success. FINANCIAL TIMES PRENTICE HALL LONDON. Neely, A., Gregory, M., & Platts, K. 2005. Performance measurement system design: a literature review and research agenda. INTERNATIONAL JOURNAL OF OPERATIONS & PRODUCTION MANAGEMENT, 25(12), pp. 1228-1263. Nigmatulin, B. 2013. How much high electricity prices are dangerous. "EXPERT", № 16 (848), APRIL 2013, available at http://ipem.ru/news/publications/633.html . Accessed on 28.02.2015

127
OECD. 2011. Labour productivity levels in the total economy. Available at http://stats.oecd.org/Index.aspx?DatasetCode=LEVEL . Accessed on 10.03. 2015 Olofsson, O. 2015. Succeeding with 5S. PUBLISHED BY WCM CONSULTING AB. Ouchi, F. 2004. A Literature Review on the Use of Expert Opinion in Probabilistic Risk. Analysis. WORLD BANK POLICY RESEARCH WORKING PAPER 3201, February 2004. Pankaj, M., Singh, M., & A Shrouty, V. 2013. A Review: Literature Survey for the Implementation of Kaizen. INTERNATIONAL JOURNAL OF ENGINEERING AND INNOVATIVE TECHNOLOGY (IJEIT), VOLUME 3, ISSUE 1, JULY 2013, pp.57-60. Paraschivescu, A. 2013. Japanese Quality Science and Culture. ECONOMY TRANSDISCIPLINARITY COGNITION, VOL. 16, ISSUE 1/2013, pp.43-49. Peng, G.& Nunes, M. 2007. Using PEST Analysis as a Tool for Refining and Focusing Contexts for Information Systems Research. ECRM 2007: 6TH EUROPEAN CONFERENCE ON RESEARCH METHODOLOGY FOR BUSINESS AND MANAGEMENT STUDIES, pp. 229-237. Pirasteh, R. & Fox, R. 2010. Profitability with No Boundaries: Optimizing TOC and Lean Six Sigma. AMERICAN SOCIETY FOR QUALITY. QUALITY PRESS, MILWAUKEE 53203. Porter, M. 1990. “The Competitive Advantage of Nations. HARVARD BUSINESS REVIEW, MARCH 1990. PP&S, inc. 2013. White paper. Quality Management: Then, Now and Toward the Future. Available at http://www.pp-s.com/Files/PPSWP_QMSbeyondprod.pdf . Accessed on 12.06.2014. Qamar, B. 2012. Towards a hybrid model of strategic change: Combining revolutionary and evolutionary approaches together. INTERNATIONAL JOURNAL OF MANAGEMENT AND STRATEGY, VOL. NO.3, ISSUE 5, JULY-DEC.2012, pp. 1-10. Radnor, Z. 2010. Review of Business Process Improvement Methodologies in Public Services. ADVANCED INSTITUTE OF MANAGEMENT RESEARCH. Rath & Strong. 2003. Rath & Strong's Six Sigma Leadership Handbook. JOHN WILEY & SONS, INC., HOBOKEN, NEW JERSEY. Reid, D. & Sanders, N. 2011. Operations Management: An Integrated

128
Approach. FOURTH EDITION, JOHN WILEY & SONS, INC. Ritchie, J. & Lewis, J. 2003. QUALITATIVE RESEARCH PRACTICE: A Guide for Social Science Students and Researchers. SAGE PUBLICATIONS. Roghanian, P., Rasli, A., Kazemi, M. & Gheysari H. 2012. Productivity Tools: TPM and TQM. IJFPSS, VOL 2, NO.4, PP. 65-69, DEC , 2012. Rosstat (Russia). http://www.gks.ru/wps/wcm/connect/rosstat_main/rosstat/ru/statistics/population/demography/. Accessed on 12.01.2015 Rowe, G. & Wright, G. 2001. Expert Opinions in Forecasting: The Role of the Delphi Technique. INTERNATIONAL SERIES IN OPERATIONS RESEARCH & MANAGEMENT SCIENCE VOLUME 30, 2001, pp. 125-144. Sai Global. https://www.saiglobal.com/ . Accessed on 12.01.2015 Sánchez, J. 2012. Assessing Sustainability of the Continuous Improvement Through the Identification of Enabling and Inhibiting Factors. Dissertation submitted to the faculty of the Virginia Polytechnic Institute and State University in partial fulfillment of the requirements for the degree of Doctor of Philosophy In Wood Science and Forest Products, August 9, 2012 Blacksburg, VA. Available at http://scholar.lib.vt.edu/theses/available/etd-08222012-183238/unrestricted/Madrigal_J_D_2012_f1.pdf . Accessed on 14.06.2014. Saunders, M., Lewis, P. & Thornhill, A. 2009. Research methods for business students. FIFTH EDITION, PRENTICE HALL, FINANCIAL TIMES. Sower, V. & Fair, F. 2005. There is More to Quality than Continuous Improvement: Listening to Plato. SAM HOUSTON STATE UNIVERSITY, QMJ VOL. 12, №. 1, ASQ 2005, pp. 8-20. Sayssky Pulp and Paper Mill. http://syas.ru/eng/index.html. Accessed on 25.09.2015. Syassky PPM internal materials. Strategy 2020: New Growth Model - a new social policy. INTERIM REPORT ON THE WORK OF THE EXPERTs on topical issues of socio-economic strategies RUSSIA FOR THE PERIOD TO 2020. Tangen, S. 2005. Evaluation and Revision of Performance Measurement Systems. A Doctoral Thesis, Woxén Centrum Department of Production Engineering Royal Institute of Technology Stockholm, Sweden, ISBN 91-7283-860-4. Tashakkori, A. & Teddlie, C. 2003. Handbook of mixed methods in social and behavioral research. THOUSAND OAKS, CA: SAGE.

129
Thawesaengskulthai, N. 2007. Selecting Quality Management and Improvement Initiatives: Case studies of industries in Thailand. Thesis submitted to the University of Nottingham for the degree of Doctor of Philosophy. The World Bank. http://www.worldbank.org/. Accessed on 21.02.2015. The World Bank. 2015. Doing Business 2015, Going Beyond Efficiency. Available on: http://www.doingbusiness.org/~/media/GIAWB/Doing%20Business/Documents/Annual-Reports/English/DB15-Full-Report.pdf. Accessed on 21.02.2015. The World Economic Forum. http://www.weforum.org/. Accessed on 21.02.2015. The World Economic Forum. 2015. The Global Competitiveness Report 2014 – 2015. Available on: http://www3.weforum.org/docs/WEF_GlobalCompetitivenessReport_2014-15.pdf. Accessed on 21.02.2015. Timokhin, D. 2014. Interview. Study the experience of the KBR. November 2014, Svetogorsk, Russia. TRANSPARENCY INTERNATIONAL. http://www.transparency.org/. Accessed on 23.02.2015. TRANSPARENCY INTERNATIONAL. 2014. CORRUPTION PERCEPTIONS INDEX 2014: RESULTS. Available on: http://www.transparency.org/cpi2014/results. Accessed on 23.02.2015. Tushman, M. & O’Reilly, C. 2013. Organizational Ambidexterity: Past, Present and Future. Academy of Management Perspectives. Available at http://www.hbs.edu/faculty/Publication%20Files/O'Reilly%20and%20Tushman%20AMP%20Ms%20051413_c66b0c53-5fcd-46d5-aa16-943eab6aa4a1.pdf. Accessed on 25.04.2014. UNCTAD. 2011. World Investment Report 2011. Available at http://unctad.org/en/Pages/DIAE/World%20Investment%20Report/WIR2011_WebFlyer.aspx . Accessed on 24.04.2014. UN Population Division. 2011. World Population Prospects The 2010 Revision. http:// www.unpopulation.org. Accessed on 12.01.2015. US Census Bureau. http://www.census.gov. Accessed on 12.01.2015. Voronina, A. & Pykhteev, Y. 2014. Innovative potential as a foundation of the long-term growth of the Russian economy. Journal PROBLEMS OF MODERN ECONOMICS, N 3 (51), 2014, pp. 25-30.

130
Ward & Rivani. 2005. An Overview of Strategy Development Models and the Ward-Rivani Model. Womack, J. & Jones, D. 1996. Lean Thinking: Banish Waste and Create Wealth in Your Corporation. SIMON & SCHUSTER, NEW YORK. Yin, R. 2003. Case study research, design and methods. (3rd ed., vol. 5). THOUSAND OAKS: SAGE. Yuksel, I. 2012. Developing a Multi-Criteria Decision Making Model for PESTEL Analysis. INTERNATIONAL JOURNAL OF BUSINESS AND MANAGEMENT, VOL. 7, NO. 24, 2012, pp. 52-66. Zoominfo. http://www.zoominfo.com/p/Samuel-Ho/42716863 . Accessed on 19.09.2015. 24/7 Wall St., LLC. www.247wallst.com. Accessed on 01.03.2015. 24/7 Wall St., LLC. 2012. Report: The World’s Most Resource-Rich Countries. Available on http://247wallst.com/special-report/2012/04/18/the-worlds-most-resource-rich-countries/. Accessed on 01.03.2015.

131
Appendix 1 Study plan
Method: Semi-structured individual interviews, participants will be offered the
same issues affecting the object of study, use of a "conversational method" and
all will be recorded on tape, duration 1 hour 30 minutes.
The purpose of the survey (interview) among 20 employees involved in the
chain of products is to find out:
1. How participants understand the process of creating a product in general?
What are the basic steps of creating a product they release?
2. How do they understand their place in the process of creating a product?
What do they evaluate from their point of view of the importance of this stage?
How do they rate their competence? What are the difficulties? What are their
relationships with colleagues in the chain? What kind of DMP (decision
makers), they can call?
3. How do they assess the activity of the enterprise as a whole? Why? What are
the forecasts for the next few years?
4. What they believe is necessary to change the company? What is missing?
Are they willing to participate in the process of enterprise development? What is
for them the company as a whole, just a job, a part of life, the meaning of life?
Practical application:
- The ability to configure the information flows
- Identification and assessment of competence of participants the process of
creating products
- Identification of weak areas
- Definition of the algorithm for further work
-Assessment of the relationship of the atmosphere in the company

132
- Identification of potential team members for processes of modernization
Thus formed four groups of questions. There are five questions in each group.
It is assumed that interview should involve representatives of various levels of
management and product development areas, those that form the so-called
value chain:
List of participants:
1. Production Director
2. Chief Engineer
3. Chief Technologist
4. Chief Power Engineer
5. Head of Logistic Department
6. Head of Supply Department
7. HR Specialist
8. CFO
9. Head of IT Department
10. Heads of production departments
11. Masters of production plots
12. Sales Director
13. Head of Marketing Department
14. Lawyer
15. Head of Security Service

133
Sets of questions:
Zero Group:
1. Name
2. Age and marital status
3. Education
4. How many years of experience for the enterprise
5. How was he/she hired by the company.
The first group of questions:
1. Could you describe the company which you represent as much as the whole
process?
2 If I understood you correctly that you selected a few basic steps of creating
the final product, please repeat them again?
3 How do you think these phases could exist independently?
4 In your opinion what is the main stage?
5 How do you evaluate, what is the main product for the enterprise, or what
product do you think the company should produce in large quantities?
The second group of questions:
1 So you're working for the position ......... Could you describe your functional, in
other words, your responsibilities? We have talked with you about the stages of
production, how would you assess the contribution of your plot to the common
cause, well, like a percentage?
2 How do you assess your personal contribution? What prevents you open up
to 100%?
134
3 Ok. If we were talking about sports, such as the baton and tried to shift it to
the production process, as you see who should passes the baton to you and
whom you should send it?
4 Continuing this theme, today your "band" is working harmoniously and can
claim to be champions or is there something that prevents this?
5 Well, if draw the line under the allegory of our sport, you certainly know that
every team has a coach, administrator or other person who helps team to
achive the results, so would you call somebody in the enterprise who can be
classified as "decision makers"?
The third group of questions:
1. You participate in a company's life, you know all about "inside" situation of
company as you see what are conditions, which the enterprise has today?
2. You said that the company is today ...... , Why do you think so?
3. Well, let's fantasize in 5-10 years that could happen here, from your point of
view?
4. Good, in connection with this what are your plans?
5. It is remarkable, and what do you think it is a common opinion about the
company or is it merely your personal opinion?
The fourth group of questions:
1. It was an interesting part of our communication, if I understood you correctly
that the company needed urgent action to upgrade it or it is the disease, which
tends to come and go?
2. Continuing this analogy do you think the company should wait for help from
the outside, the arrival of the new owner, such as purchase of company to the
foreign partners, or it is able to solve problems, perhaps with the assistance of
experts (doctors)?
3. Well, are you personally willing to participate in this "therapy"?

135
4. Do you have specific suggestions or thoughts on this?
5. And the last question, let's consider that the company was bought by foreign
concern, do you know that there are certain requirements for the competence
level of employees, how do you think you meet these requirements?
It is allow for the possibility of additional questions during the interview, for
disclosing in more detail the relationship participant.
The evaluation of the data is in the form of qualitative research, identifying the
general trend in the percentage each of items of the practical application of this
research.