implementation of a self-consistent stereo …...implementation of a self-consistent stereo...
TRANSCRIPT

IMPLEMENTATION OF A SELF-CONSISTENT STEREO PROCESSING CHAIN FOR 3DSTEREO RECONSTRUCTION OF THE LUNAR LANDING SITES
E. Tasdelena∗, K. Willnera, H. Unbekannta, P. Glasera, J. Obersta,b
a Technische Universitt Berlin, Institute for Geodesy and Geoinformation Science, Planetary Geodesy,Straße des 17.Juni 135 10623 Berlin, Germany
(e.tasdelen, konrad.willner, heinrich.unbekannt, philipp.glaeser)@tu-berlin.deb German Aerospace Center (DLR), Berlin-Adlershof, Germany
Commission IV/Working Group 8
KEY WORDS: 3D Models, ISIS, Lunar Orbiter Laser Altimeter (LOLA), Lunar Landing Sites
ABSTRACT:
The department for Planetary Geodesy at Technical University Berlin is developing routines for photogrammetric processing of plan-etary image data to derive 3D representations of planetary surfaces. The Integrated Software for Imagers and Spectrometers (ISIS)software (Anderson et al., 2004), developed by USGS, Flagstaff, is readily available, open source, and very well documented. Hence,ISIS was chosen as a prime processing platform and tool kit. However, ISIS does not provide a full photogrammetric stereo processingchain. Several components like image matching, bundle block adjustment (until recently) or digital terrain model (DTM) interpolationfrom 3D object points are missing. Our group aims to complete this photogrammetric stereo processing chain by implementing themissing components, taking advantage of already existing ISIS classes and functionality. We report here on the current status of thedevelopment of our stereo processing chain and its first application on the Lunar Apollo landing sites.
1 INTRODUCTION
One of the main goals in planetary geodesy is to retrieve a three-dimensional (3D) description of planetary surfaces and bodies.Many space exploration missions set out their journey having vi-sual sensors (cameras) on board to observe the foreign worlds.From these sensors, many images of planetary bodies have beencaptured and are available to use. These planetary images canbe used to produce cartographic products including digital terrainmodels (DTM), map-projected imagery and in some cases even3D models of the corresponding bodies. These data products aresuitable for further science analysis and mission planning.
Our group at the department for Planetary Geodesy at Techni-cal University Berlin is developing routines and softwares. Ouraim is to photogrammetrically process the available planetary im-age data, derive 3D representations and provide the results tothe scientific community. The Integrated Software for Imagersand Spectrometers (ISIS) software (Anderson et al., 2004), de-veloped by USGS, Flagstaff, was chosen as a prime processingplatform and tool kit. It is a specialized image processing pack-age which provides basic image processing operations as well asmission specific data operations. However, ISIS does not providea full photogrammetric stereo processing chain. Several com-ponents like image matching, bundle block adjustment (until re-cently) or digital terrain model (DTM) interpolation from 3D ob-ject points are missing. Our group aims to complete this pho-togrammetric stereo processing chain by implementing the miss-ing components, taking advantage of already existing ISIS classesand functionality.
In this research we present our stereo processing chain and its firstapplication on the Lunar Apollo landing sites. The processingchain contains several different steps namely dense image match-ing, object point estimation and DTM interpolation, resulting inlocal surface representations. Absolute global position of this lo-cal DTM is refined by applying the Lunar Orbiter Laser Altimeter
(LOLA) (Smith et al., 2011) data set. Currently, LOLA providesthe accepted global reference for the Earth moon.
2 STEREO PROCESSING CHAIN
To compute accurate 3D models and subsequently ortho-imagemaps several methods and software were developed. At the cur-rent stage this includes a software for automated matching, anobject point calculation tool and a 3D interpolation tool. Thegeneral workflow and components needed to derive DTMs andortho-images is displayed in Figure 1. After the identification ofimage sets that cover the area of interest, these image pairs arematched and dense depth maps which are defined for all pixels inthe overlapping areas are produced. The resulting depth maps arelater used as input for the object point calculation tool and 3D ob-jects points coordinates are estimated by applying the collinearityequations. The large numbers of 3D object point coordinates arefed into the DTM interpolation tool. Here the point coordinatesare map-projected applying existing ISIS functionality. The sin-gle pixel value for the final DTM can be determined by choosingbetween several interpolation methods like mean, median, inversedistance weighting (IDW), nearest neighbor (NN), intersectionaccuracy weighting (IAW). The next step is to project the imagesonto the derived DTMs to produce map-projected ortho-images.After this step the DTMs and ortho-images of area of interest areachieved. However due to the uncertainties in the spacecraft atti-tude, position, or instrument mounting the derived surface mod-els are likely displaced with respect to the global reference shapemodels. To detect and minimize these misalignments, the re-sulting DTMs are co-registered to Lunar Orbiter Laser Altimeter(LOLA) (Smith et al., 2011) tracks that intersect the study area.LOLA is a precise and accepted global geodetic grid of the Moon(Smith et al., 2011) and provides a good reference shape model.The shift values from the co-registration result are applied to theDTMs and ortho-images to achieve the global positions of them.Finally the shifted DTMs and ortho-images are merged and finalDTM and ortho-image mosaics are produced.
The International Archives of the Photogrammetry, Remote Sensing and Spatial Information Sciences, Volume XL-4, 2014ISPRS Technical Commission IV Symposium, 14 – 16 May 2014, Suzhou, China
This contribution has been peer-reviewed.doi:10.5194/isprsarchives-XL-4-257-2014 257

Figure 1: Stereo processing flowchart
2.1 Matching Software
The matching software is optimized for both orbital and close-ranged planetary images and compatible with ISIS formats aswell as other common formats like Vicar, TIFF, PNG or JPEG.It supports multithreading in order to increase the performanceand to handle large images, such as Lunar Reconnaissance Or-biter Camera (LROC) data, efficiently. The aim of this softwareis to provide accurate and high density conjugate point clouds thatwill serve as input for the following steps. Since the accuracy ofthe final 3D reconstruction highly depends on the precise identi-fication of conjugate points in the stereo images, special care wastaken during the development of the image matching software.
The matcher is designed to handle uncompressed, radiometricallycorrected and non-rectified images. Thus a pre-rectification andan existing DTM of the study area are not necessary. Figure 2shows the internal workflow of the matcher. It integrates differ-ent matching algorithms like a feature based (FB) and an area-based (AB) matching algorithm (Rodehorst, 2004). In orderto decrease the high geometrical differences between the non-rectified images, a special approach which grids the input imagesinto defined equal regions is implemented. Each grid undergoesa pre-processing stage and the geometrical differences of theseindividual grids are minimized by using the FB algorithm. It de-tects Speeded Up Robust Features (SURF) (Bay et al., 2008) astie-points and applies a transformation between the grids fromthese pixel coordinates. SURF are used since they are invariantto scale, rotation and up to some degree to radiometric deforma-tions (Bay et al., 2008). These characteristics make this typeof features ideal for planetary images where scale, rotation andradiometric differences are common due to the different space-craft orientations and illumination conditions. With this process
the geometrical relations of the input images are determined andthe differences are minimized. An example of this gridding andtransformation process can be seen in figure 3. The input imageswhich are shown in figure 3(a) contain a high difference in termsof geometry and disparity. These differences are minimized asshown in figure 3(c) by gridding and applying a transformationwith the detected features (fig. 3(b)). Dense area based matchingcan be applied in the resulting grids. This pre-processing processincreases the performance and the accuracy of the dense match-ing and makes it possible to match non-rectified images.
Figure 2: Dense matching flowchart
Figure 3: An example of the application of the pre-processing onLRO images. (a) overlay of input images, (b) grid region (bluerectangle) and detected features (blue points) visualized on theimages, (c) overlay of the grids after the transformation
At the core of the matcher, AB matching techniques like normal-ized cross-correlation (NCC) and least-squares matching (LSM)are used to perform a dense matching. Here it is attempted tofind a match for every pixel of the template image. Equation 1shows the well known formula to compute the cross-correlationcoefficient (ρncc) between two patches (a and b).
ρncc(a, b) =σa,bpσ2
a · σ2b
(1)
where a, b = 2 patches from stereo pairsρncc = the cross-correlation coefficientσa,b = the covariance between the two patchesσ2
a and σ2b = the variances of each patch
Each pixel with its neighborhood is compared with the other patcheswithin a search range from the other pair with Equation 1. Thecorrespondings are estimated with a winner-take-all approach (high-est cross-correlation coefficient). This delivers matching resultswith a 1 pixel accuracy. The result is then refined to sub-pixel
The International Archives of the Photogrammetry, Remote Sensing and Spatial Information Sciences, Volume XL-4, 2014ISPRS Technical Commission IV Symposium, 14 – 16 May 2014, Suzhou, China
This contribution has been peer-reviewed.doi:10.5194/isprsarchives-XL-4-257-2014 258

accuracy with LSM which is considered to be the most accurateimage matching technique with an accuracy of up to 0.01 pixels(Ackermann, 1984). It is an adjustment approach to minimizethe pixel value difference between two patches by applying a ge-ometrical and radiometrical model. The patches are treated likediscreet functions. The goal is to minimize the differences be-tween the functions of two patches. This defines the functionalmodel and the whole system is solved with respect to the param-eters of the chosen geometrical and radiometrical model. As thegeometrical model Affine transformation (Eq. 2) is used and thetransformation parameters, that minimize the difference, are cal-culated by applying the Gauss Markoff model of Least SquaresAdjustment (LSA) (Eq. 3) (Plackett, 1950). The transformationparameters represent the sub-pixel shift between the patches.
x′ = a1x+ a2y + a3 (2a)
y′ = b1x+ b2y + b3 (2b)
where a1, a2, a3, b1, b2, b3 = six unknown parametersx′, y′ = transformed coordinatesx, y = initial coordinates
`+ v = A.x (3)
where ` = the observationsx = the initial parametersA = the design matrixv = the error matrix added to the system
Equation 2 shows the general Affine transformation with unknownparameters. These parameters are the unknowns to be estimatedin the adjustment and they are updated for each iteration. Theobservations (`) in equation 3 are the pixel-wise differences ofthe patches and its size is equal to the number of pixels of the se-lected patch size. Thus the size of the design matrix (A) dependson the chosen patch size and the number of unknowns which issix in our affine transformation implementation. The new param-eters are calculated for each iteration by equation 4. When thechange in the parameters in two consecutive iteration drops be-low a threshold, the process stops and the current parameters areconsidered to be the final results.
xnew = (ATA).(AT `) (4)
where xnew = the new transformation parametersx = the initial parametersA = the design matrix` = the pixel value difference of the patches
After the matching of transformed grids, the result is back trans-ferred with respect to the corresponding transformation model.This pre-processing and matching stages are performed for eachgrid in the template image and the results from each grid aremerged to achieve the final matching result.
2.2 Object Point Calculation
A software which is capable of calculating the object points fromthe matching results is being developed. It uses the projective ge-ometric relationship between the images and the captured scene.Figure 4 (Julia, 2011) shows the basic idea of projecting a sceneto the image plane. In the figure 4 point O is the camera centerwith the focal length of c; x, y, z is the camera and X,Y, Z theglobal coordinate system. P is a point in the scene in the globalcoordinate which is projected to point p in the image plane. Itcan be noted that the ray between the camera center and the ob-ject point is the difference between the vector of object point andthe vector of camera center.
Figure 4: Imaging of a surface
This geometric relation can be expressed as in equation 5. Therotation matrix and the camera positions can be retrieved fromSPICE (Acton, 1996) kernels. The scale factor (m) is an un-known value which varies for each object point. If only one im-age is available then only the direction to an object point (P ) canbe determined but not its absolute position. The object coordi-nate of point P can only be computed if this ray intersects withother rays from other images in space. That is why two or moreimages which provide two or more rays for each object points areneeded.
0@PX
PY
PZ
1A =
0@OX
OY
OZ
1A +mR
0@px
py
c
1A (5)
where PX , PY and PZ = the object point coordinatesOX , OY and OZ = camera center coordinatesR = the rotation matrix between the camera coordinate
and the global coordinate systemm = the scale factorpx, py = the coordinate of image point p in image
coordinate systemc = the focal length of the camera
Figure 5 depicts the situation if we only consider 2 images. Inan ideal case the two rays would intersect in space defining theobject point at this intersection. However, due to the unavoidableuncertainties from camera position, camera orientation, cameradistortion, or correspondence detection, these two rays do not in-tersect. In order to find the point that is close to both rays, thevalues of the scale factors (m1 and m2) that correspond to theminimum distance between the rays should be solved by mini-mizing the normal equation 6.
The International Archives of the Photogrammetry, Remote Sensing and Spatial Information Sciences, Volume XL-4, 2014ISPRS Technical Commission IV Symposium, 14 – 16 May 2014, Suzhou, China
This contribution has been peer-reviewed.doi:10.5194/isprsarchives-XL-4-257-2014 259

Figure 5: Two images imaging geometry
X2 =
" 0@O1X
O1Y
O1Z
1A +m1R1
0@p1x
p1y
c1
1A−
0@O2X
O2Y
O2Z
1A −m2R2
0@p2x
p2y
c2
1A #2(6)
where X2 = the norm to be minimizedO1X , O1Y and O1Z = the first camera centerO2X , O2Y and O2Z = the second camera centerR1 and R2 = the rotation matrices between
the cameras and the global coordinate systemm1 and m2 = the scale factors for each camerap1x, p1y =the image coordinate of object point P
in the first imagep2x, p2y = the image coordinate of object point P
in the second imagec1, c2 = the focal lengths of the cameras
To solve the ray intersection problem, equation 6 is differentiatedwith respect to m1 and m2 and the result is set to zero. Aftersolving it for m1 and m2, these values are plugged into the rayequations to obtain the point for each ray that is closest to theother ray. Mid point of the two point locations yields the depthestimate.
The object point calculation tool parses all the matched pointsfrom the previous step of the stereo processing chain and appliesthe explained approach to estimate the object points. It uses al-ready existing camera models within the ISIS frame. SPICE ker-nels provide the camera interior and exterior orientations. A firstimplementation is finalized and needs further testing. It is also en-visaged to integrate a bundle adjustment module within this toolto minimize the uncertainties of camera orientations and avoid thepossible offsets and distortion between the derived surface modeland the absolute frame.
2.3 Interpolation Tool
The 3D object point coordinates, that are derived from the match-ing and subsequent object point calculation, are then used forthe DTM interpolation. The body-centric coordinates are map-projected into a pre-defined cube file, which serves as a targetcontainer. The pixel values of the target cube defined by the ob-ject point height at this position. It is possible that several ob-ject points define the value of one pixel of the target position.Different interpolation methods like mean, median, inverse dis-tance weighting (IDW), nearest neighbor (NN), intersection ac-curacy weighting (IAW) are implemented to determine exactly
one value for the resulting pixel. The input data can be providedin non-sequential order and there are no specific requirements interms of spatial distribution or homogeneity of the distribution ofthe points. Furthermore the interpolator has a gap filling featureand export capability to different formats like CUB, TIFF, Er-das RAW. Figure 6 schematizes the DTM creation process. Theobject points are converted from 3D body-centric coordinates tomap coordinates and a template DTM is filled with the valuesfrom coinciding points by applying different interpolation meth-ods.
Figure 6: Interpolation Tool - The points with different colorsrepresents the object points that fall into one pixel
3 TESTS
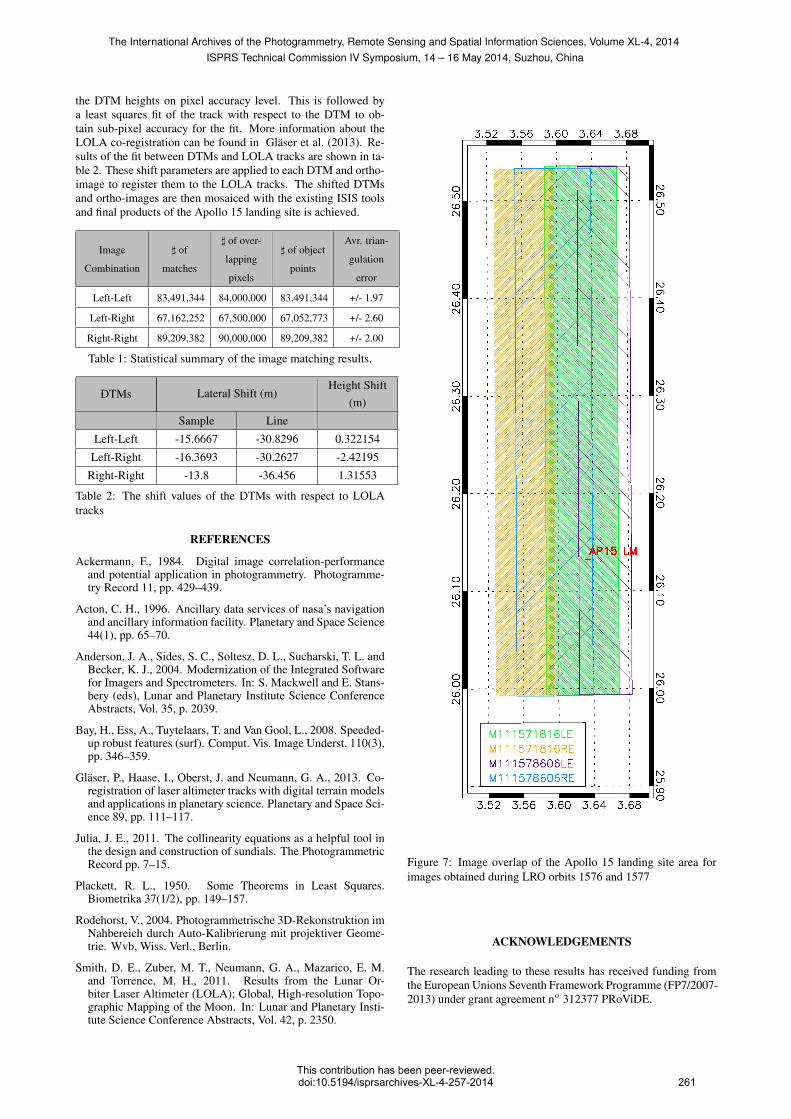
The stereo chain was tested with the Apollo 15 landing site. Weused LROC images of 1576 and 1577 with 0.51 meters per pixelground resolution. The two right images, the two left images andone right/left image pair were matched to provide DTMs coveringparts of the Apollo 15 landing site area (fig. 7). Table 1 showsthe statistical summary of the image matching and triangulationresults. As can be seen, the rate of successful matches is veryhigh and thus the coverage of the depth maps are satisfactory.Moreover, the average triangulation error are relatively low. Thiserror states a relative error and should not be confused with theabsolute error, that relates to the uncertainty with respect to aglobal reference. It only suggests that the object points are in agood consistency and says nothing about the deviation of DTMsfrom the real surface values.
3.1 Co-Registration to the LOLA Reference
While the DTMs benefit from the very good internal consistency,small offsets and possible distortion between the derived surfacemodels remain. The models are also not referenced to a commonreference frame as uncertainties in the spacecraft attitude, posi-tion, or instrument mounting on the spacecraft are present. Whilea bundle block approach to correct for these small misalignmentsis currently under development, we have studied a different ap-proach using LOLA data as reference. The resulting DTMs areco-registered to Lunar Orbiter Laser Altimeter (LOLA) tracksthat intersect the study area. During this process a grid searchis performed looking for a best fit between the LOLA profile and
The International Archives of the Photogrammetry, Remote Sensing and Spatial Information Sciences, Volume XL-4, 2014ISPRS Technical Commission IV Symposium, 14 – 16 May 2014, Suzhou, China
This contribution has been peer-reviewed.doi:10.5194/isprsarchives-XL-4-257-2014 260
the DTM heights on pixel accuracy level. This is followed bya least squares fit of the track with respect to the DTM to ob-tain sub-pixel accuracy for the fit. More information about theLOLA co-registration can be found in Glaser et al. (2013). Re-sults of the fit between DTMs and LOLA tracks are shown in ta-ble 2. These shift parameters are applied to each DTM and ortho-image to register them to the LOLA tracks. The shifted DTMsand ortho-images are then mosaiced with the existing ISIS toolsand final products of the Apollo 15 landing site is achieved.
Image
Combination
] of
matches
] of over-
lapping
pixels
] of object
points
Avr. trian-
gulation
error
Left-Left 83,491,344 84,000,000 83,491,344 +/- 1.97
Left-Right 67,162,252 67,500,000 67,052,773 +/- 2.60
Right-Right 89,209,382 90,000,000 89,209,382 +/- 2.00
Table 1: Statistical summary of the image matching results.
DTMs Lateral Shift (m)Height Shift
(m)
Sample Line
Left-Left -15.6667 -30.8296 0.322154
Left-Right -16.3693 -30.2627 -2.42195
Right-Right -13.8 -36.456 1.31553
Table 2: The shift values of the DTMs with respect to LOLAtracks
REFERENCES
Ackermann, F., 1984. Digital image correlation-performanceand potential application in photogrammetry. Photogramme-try Record 11, pp. 429–439.
Acton, C. H., 1996. Ancillary data services of nasa’s navigationand ancillary information facility. Planetary and Space Science44(1), pp. 65–70.
Anderson, J. A., Sides, S. C., Soltesz, D. L., Sucharski, T. L. andBecker, K. J., 2004. Modernization of the Integrated Softwarefor Imagers and Spectrometers. In: S. Mackwell and E. Stans-bery (eds), Lunar and Planetary Institute Science ConferenceAbstracts, Vol. 35, p. 2039.
Bay, H., Ess, A., Tuytelaars, T. and Van Gool, L., 2008. Speeded-up robust features (surf). Comput. Vis. Image Underst. 110(3),pp. 346–359.
Glaser, P., Haase, I., Oberst, J. and Neumann, G. A., 2013. Co-registration of laser altimeter tracks with digital terrain modelsand applications in planetary science. Planetary and Space Sci-ence 89, pp. 111–117.
Julia, J. E., 2011. The collinearity equations as a helpful tool inthe design and construction of sundials. The PhotogrammetricRecord pp. 7–15.
Plackett, R. L., 1950. Some Theorems in Least Squares.Biometrika 37(1/2), pp. 149–157.
Rodehorst, V., 2004. Photogrammetrische 3D-Rekonstruktion imNahbereich durch Auto-Kalibrierung mit projektiver Geome-trie. Wvb, Wiss. Verl., Berlin.
Smith, D. E., Zuber, M. T., Neumann, G. A., Mazarico, E. M.and Torrence, M. H., 2011. Results from the Lunar Or-biter Laser Altimeter (LOLA); Global, High-resolution Topo-graphic Mapping of the Moon. In: Lunar and Planetary Insti-tute Science Conference Abstracts, Vol. 42, p. 2350.
Figure 7: Image overlap of the Apollo 15 landing site area forimages obtained during LRO orbits 1576 and 1577
ACKNOWLEDGEMENTS
The research leading to these results has received funding fromthe European Unions Seventh Framework Programme (FP7/2007-2013) under grant agreement no 312377 PRoViDE.
The International Archives of the Photogrammetry, Remote Sensing and Spatial Information Sciences, Volume XL-4, 2014ISPRS Technical Commission IV Symposium, 14 – 16 May 2014, Suzhou, China
This contribution has been peer-reviewed.doi:10.5194/isprsarchives-XL-4-257-2014 261