implementation for improving client and provider outcomes · implementation for improving client...
TRANSCRIPT

Implementation for Improving Client
and Provider Outcomes
Gregory A. Aarons, Ph.D.
University of California, San Diego
Department of Psychiatry
Child & Adolescent Services Research Center
Center for Organizational Research on Implementation and Leadership
Presented for the Native Children’s Research
Exchange. University of Colorado Health
Sciences. 29 September, 2016
Acknowledgements
Funding support
– National Institute of Mental Health
– National Institute on Drug Abuse
– Centers for Disease Control and Prevention
– NIH Fogarty International Center
– National Institute of Child Health and Development
– PEPFAR
The NIH-PEPFAR PMTCT Implementation Science Alliance
Nigeria Implementation Science Alliance
RoadmapWhat is Implementation science?
Define “implementation outcomes”
Present the Exploration, Preparation, Implementation, Sustainment (EPIS) framework
Define “implementation strategies”
Results of clinic and provider focused implementation studies
3

4
Khoury MJ. et al. The continuum of translation research in genomic medicine: how can we accelerate the appropriate integration of human genomic discoveries into health care and disease prevention? Genet Med 2007:9(10):665-674.; https://www.iths.org/about/translational
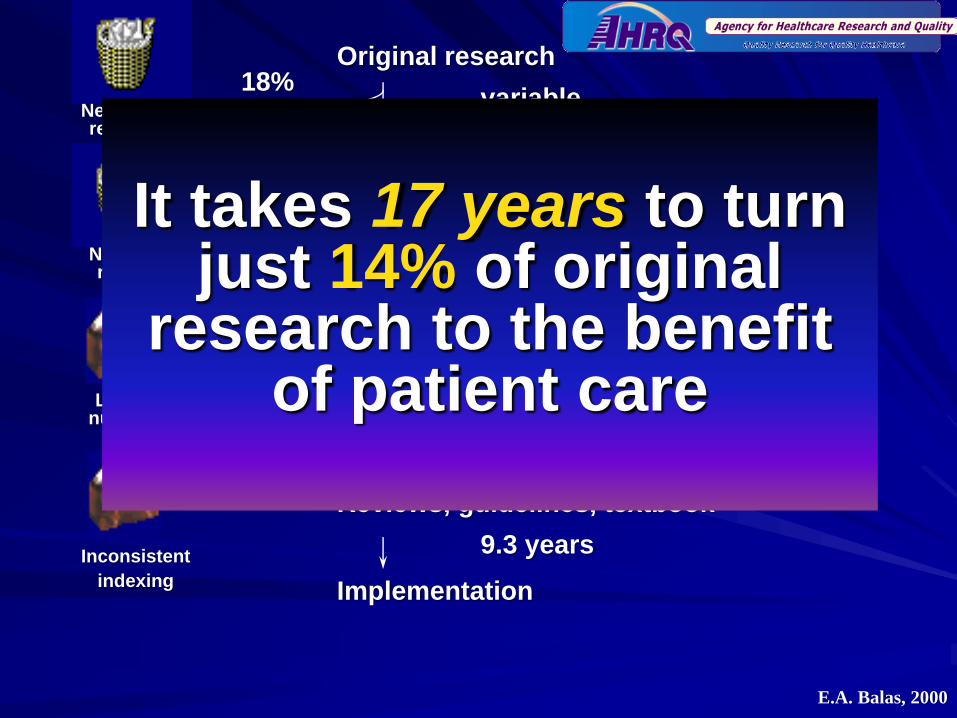
Original research
Acceptance
Implementation
Publication
Bibliographic databases
Submission
Reviews, guidelines, textbook
Negative results
variable
0.3 year
6. 0 - 13.0 years50%
46%
18%
35%
0.6 year
0.5 year
9.3 years
Dickersin, 1987
Koren, 1989
Balas, 1995
Poynard, 1985
Kumar, 1992
Kumar, 1992
Poyer, 1982
Antman, 1992
Negative results
Lack of numbers
Expert
opinion
Inconsistent
indexing
17:14
It takes 17 years to turn just 14% of original
research to the benefit of patient care
E.A. Balas, 2000

The Difference between
Dissemination and Implementation?
Dissemination– “targeted distribution of information and intervention
materials to a specific public health or clinical practice audience. The intent is to spread knowledge and the associated evidence-based interventions.”
Implementation– “the use of strategies to introduce or change
evidence-based health interventions within specific settings”
Source: NIH PAR-10-038; Adapted from Lomas, 1993


Implementation
Frameworks and Strategies
Implementation Framework:
– A proposed model of factors likely to impact
implementation and sustainment of EBP
(Aarons, Hurlburt, & Horwitz, 2011; Damschroder
et al., 2009; Tabak et al., 2012)
Implementation Strategy:
– Systematic processes to adopt and integrate
evidence-based innovations into usual care.
(Powell et al., 2011)

Why Frameworks?
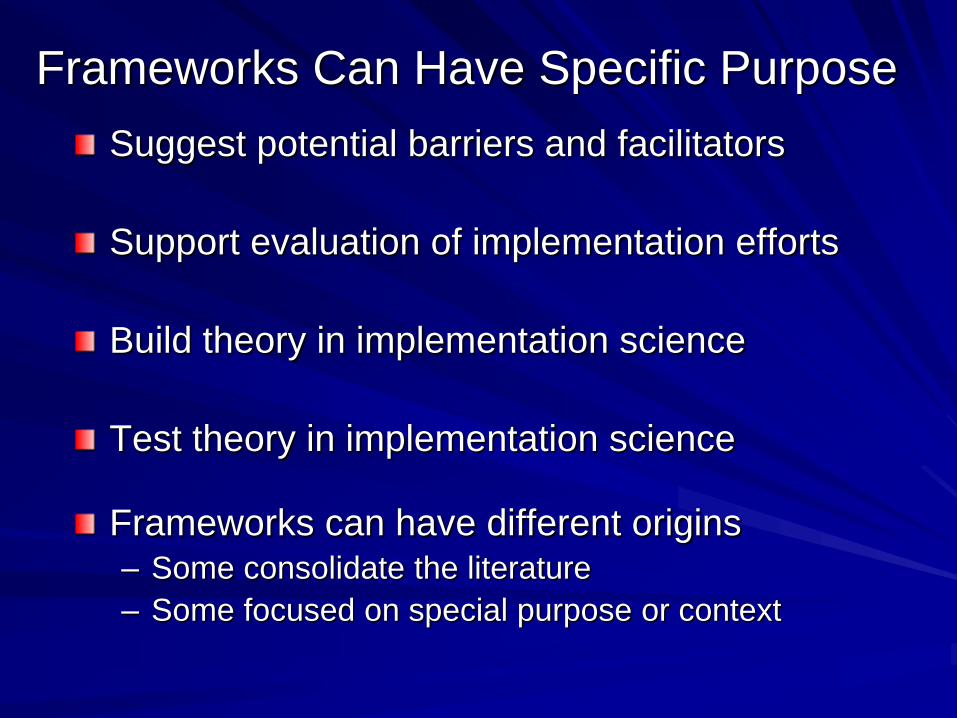
Frameworks Can Have Specific Purpose
Suggest potential barriers and facilitators
Support evaluation of implementation efforts
Build theory in implementation science
Test theory in implementation science
Frameworks can have different origins – Some consolidate the literature
– Some focused on special purpose or context

Review of Models (Tabak, et al., 2012)
Reviewed 61 models – Models (aka “theories” or “frameworks”)
– Frameworks evaluated on:
Construct flexibility– Broad highly operationalized
Focus on dissemination vs. implementation– D-only D=I I-only
Socioecologic framework level– Individual Community System
Source: Tabak, R. G., Khoong, E. C., Chambers, D. A., & Brownson, R. C. (2012). Bridging research and practice: models
for dissemination and implementation research. American journal of preventive medicine, 43(3), 337-350.

Implementation Outcomes
Intervention
Strategies
Evidence
Based
Practices
Implementation
Strategies
Systems
Environment
Organizational
Group/Learning
Supervision
Providers
Consumers
Implementation
Outcomes
Fidelity
Reach
Acceptability
Sustainability
Uptake
Costs
Workforce
Service
Outcomes
Efficiency
Safety
Effectiveness
Equity
Patient-Centered
Timeliness
Client
Outcomes
Symptoms
Functioning
Satisfaction
Quality of Life
Outcomes
Implementation Research Methods
Proctor, E., Silmere, H., Raghavan, R. Hovmand, P., Aarons, G.A., Bunger, A., Griffey, R., & Hensley, M. (2011). Outcomes
for Implementation Research: Conceptual Distinctions, Measurement Challenges, and Research Questions. Administration
and Policy in Mental Health and Mental Health Services Research, 38(2), 65-76.
*IOM Standards of Care
12

Common Elements of Frameworks
Multiple Levels
– Implementation occurs in complex systems
– Need to identify concerns at different levels
Multiple phases– Implementation occurs over time
– There may be relatively discrete phases or stages

Why Consider Multiple Phases?
Characterizes process of implementation
Develops a way to think about what supports are needed during the implementation process
Helps in providing a “long-term view”
Helps in planning
Aarons, G.A., Hurlburt, M. & Horwitz, S.M. (2011). Advancing a Conceptual Model of Evidence-Based Practice Implementation in Public Service Sectors. Administration and Policy in Mental Health and Mental Health Services Research.38, 4-23.

Service Environment
Legislation
Leadership
Policies
Resources
Service Contracts
Inter-organizational Environment
Relationship of service system with CBOs
Relationships between provider organizations
Collaboration
Competition
Co-opetition
Outer Context
Exploration, Preparation, Implementation, Sustainment (EPIS)
Conceptual Model of Implementation and Sustainment
EBP Characteristics
EBP Developers
Purveyors / Implementation Support
EBP
System
Fit
EBP Organization
Fit
Individual Adopter Characteristics
Attitudes to EBP
Fidelity
Commitment to EBP
Org. Commitment
Job Satisfaction
Turnover Intentions
Turnover
Intra-Organizational Characteristics
Leadership
Policies
Structure
Culture
Climate
MIS
Data monitoring/feedback
Inner Context
EBP Provider
Fit
Patients/Consumers
Need
Advocacy
Interconnections
Interactions-Linkages-Relationships
EBP
Patient
/ Client
Fit
Aarons, G.A., Hurlburt, M. & Horwitz, S.M. (2011). Advancing a Conceptual Model of Evidence-Based Practice Implementation in
Public Service Sectors. Administration and Policy in Mental Health and Mental Health Services Research.38, 4-23.

Service Environment
Legislation
Leadership
Policies
Resources
Service Contracts
Inter-organizational Environment
Relationship of service
system with CBOs
Relationships between
provider organizations
Collaboration
Competition
Co-opetition
Outer Context
Sustainment Model of EBP Implementation in Public Sectors (EPIS Framework)
EBP Characteristics
EBP Developers
Purveyors / Implementation Support
EBP
System
Fit
EBP Organization
Fit
Individual Adopter Characteristics
Attitudes to EBP
Fidelity
Commitment to EBP
Org. Commitment
Job Satisfaction
Turnover Intentions
Turnover
Intra-Organizational Characteristics
Leadership
Policies
Structure
Culture
Climate
MIS
Data monitoring/feedback
Inner Context
EBP Provider
Fit
Patients/Consumers
Need
Advocacy
Interconnections
Interactions-Linkages-Relationships
Procurement-Contracting
EBP
Patient
/ Client
Fit
Aarons, G.A., Green, A.E., Willging, C.E., Ehrhart, M.E., Roesch, S.C., Hecht, D.B., & Chaffin, M.J. (2014). Mixed-method study of a
conceptual model of evidence-based intervention sustainment across multiple public-sector service settings. Implementation
Science, 9:183
Sustainment Outcomes
QUALITATIVE
Level of Institutionalization
Continued use of EBP
Adaptations
QUANTITATIVE
Provider Reach/Penetration
Client Reach/Penetration
Org. Sustainment Climate
Fidelity

Exploration, Preparation, Implementation,
Sustainment (EPIS) Model
Exploration– System/org assessment to understand barriers and facilitators
Preparation– Taking what is learned in exploration and planning for
implementation
Implementation– Training, putting structures and processes in place
Sustainment– Begin with sustainment in mind
– Practice(s) institutionalized at multiple levels
Aarons, G. A., Hurlburt, M., & Horwitz, S. M. (2011). Advancing a conceptual model of evidence-based practice implementation in
public service sectors. Administration and Policy in Mental Health and Mental Health Services Research, 38(1), 4-23.

EXPLORATION
OUTER CONTEXT
Sociopolitical Context
Legislation
Policies
Monitoring and review
Funding
Service grants
Research grants
Foundation grants
Continuity of funding
Client Advocacy
Consumer organizations
Interorganizational networks
Direct networking
Indirect networking
Professional organizations
Clearinghouses
Technical assistance centers
INNER CONTEXT
Organizational characteristics
Absorptive capacity
Knowledge/skills
Readiness for change
Receptive context
Culture
Climate
Leadership
Individual adopter characteristics
Values
Goals
Social Networks
Perceived need for change
ADOPTION DECISION /
PREPARATION
OUTER CONTEXT
Sociopolitical
Federal legislation
Local enactment
Definitions of “evidence”
Funding
Support tied to federal and
state policies
Client advocacy
National advocacy
Class action lawsuits
Interorganizational networks
Organizational linkages
Leadership ties
Information transmission
Formal
Informal
INNER CONTEXT
Organizational characteristics
Size
Role specialization
Knowledge/skills/expertise
Values
Leadership
Culture embedding
Championing adoption
ACTIVE IMPLEMENTATION
OUTER CONTEXT
Sociopolitical
Legislative priorities
Administrative costs
Funding
Training
Sustained fiscal support
Contracting arrangements
Community based organizations.
Interorganizational networks
Professional associations
Cross-sector
Contractor associations
Information sharing
Cross discipline translation
Intervention developers
Engagement in implementation
Leadership
Cross level congruence
Effective leadership practices
INNER CONTEXT
Organizational Characteristics
Structure
Priorities/goals
Readiness for change
Receptive context
Culture/climate
Innovation-values fit
EBP structural fit
EBP ideological fit
Individual adopter characteristics
Demographics
Adaptability
Attitudes toward EBP
SUSTAINMENT
OUTER CONTEXT
Sociopolitical
Leadership
Policies
Federal initiatives
State initiatives
Local service system
Consent decrees
Funding
Fit with existing service funds
Cost absorptive capacity
Workforce stability impacts
Public-academic collaboration
Ongoing positive relationships
Valuing multiple perspectives
INNER CONTEXT
Organizational characteristics
Leadership
Embedded EBP culture
Critical mass of EBP provision
Social network support
Fidelity monitoring/support
EBP Role clarity
Fidelity support system
Supportive coaching
Staffing
Staff selection criteria
Validated selection procedures
Aarons, G.A., Hurlburt, M. & Horwitz, S.M. (2011). Advancing a Conceptual Model of Evidence-Based Practice Implementation in
Public Service Sectors. Administration and Policy in Mental Health and Mental Health Services Research.38, 4-23. 18

Adapted EPIS Model Based on Systematic Review in
Child/Adolescent Mental Health
Novins, D.K., Green, A.E., Legha, R.K., & Aarons, G.A. (2013). Dissemination and Implementation of Evidence-Based Practices for Child and Adolescent Mental Health: A Systematic Review. Journal of the American Academy of Child and Adolescent Psychiatry. 52(10), 1009-1025
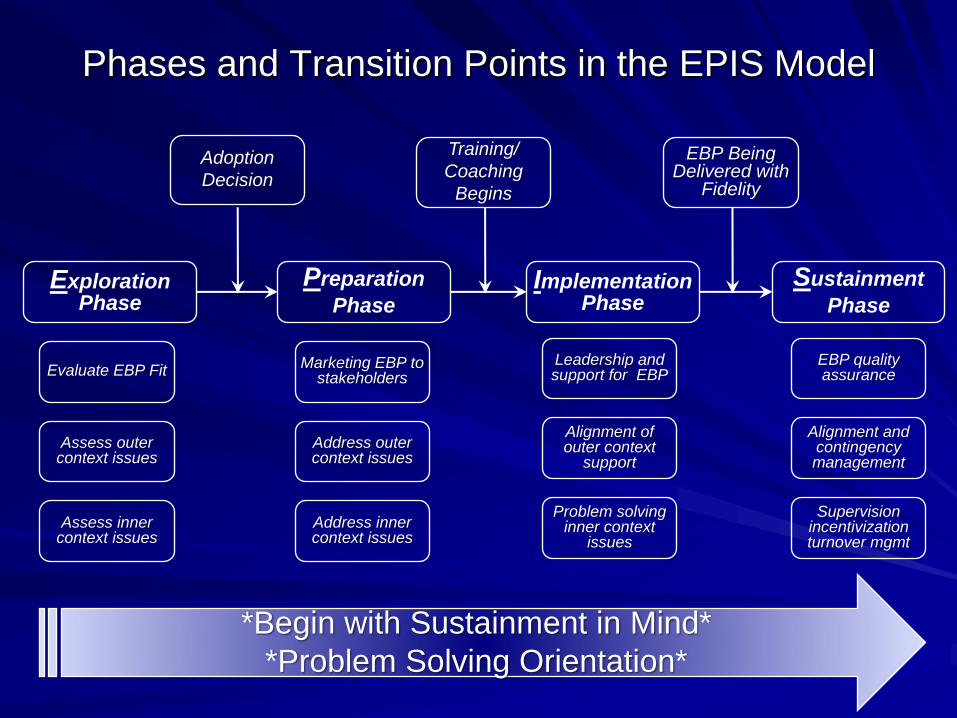
Exploration Phase
Preparation
PhaseImplementation
PhaseSustainment
Phase
Phases and Transition Points in the EPIS Model
Adoption
Decision
Training/
Coaching
Begins
EBP Being Delivered with
Fidelity
Evaluate EBP Fit
Assess outer context issues
Assess inner context issues
Marketing EBP to stakeholders
Address outer context issues
Address inner context issues
Leadership and support for EBP
Alignment of outer context
support
Problem solving inner context
issues
EBP quality assurance
Alignment and contingency management
Supervision incentivization turnover mgmt
*Begin with Sustainment in Mind*
*Problem Solving Orientation*

Implementation Strategies
Implementation Strategy:
– Systematic process(es ) to adopt and
integrate evidence-based innovations into
usual care.
(Powell et al., 2011)
– Strategy should derive from theory
Powell, B. J., McMillen, J. C., Proctor, E. K., Carpenter, C. R., Griffey, R. T., Bunger, A. C., ... & York, J. L. (2012). A compilation of strategies for implementing clinical innovations in health and mental health. Medical Care Research and Review, 69(2), 123-157.

Implementation Strategies
Address specific factors identified in implementation frameworks
Discrete implementation strategies – Clinical reminders, training only
Multifaceted implementation strategies– Training + reminders
– Training + fidelity monitoring + coaching
Blended implementation strategies (comprehensive)– Dynamic Adaptation Process strategy (DAP)
– Leadership and Organizational Change for
Implementation (LOCI)
Source: Powell , McMillen, Proctor et al (2011). A compilation of strategies for implementing clinical innovations in health and mental health. Medical Care Research and Review, 69(2) 123-157.
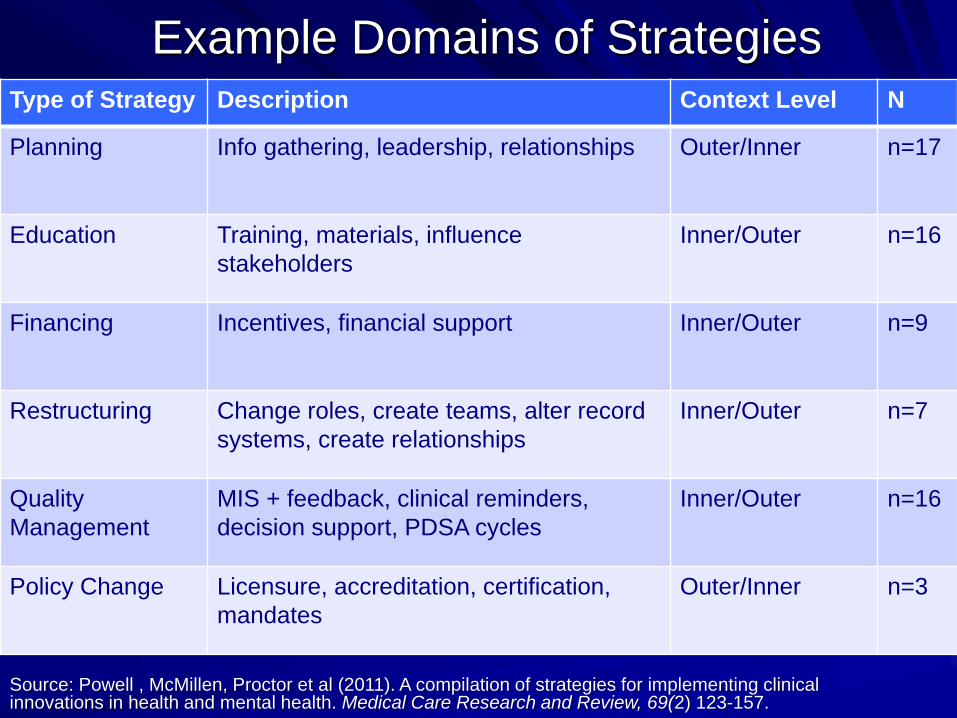
Example Domains of StrategiesType of Strategy Description Context Level N
Planning Info gathering, leadership, relationships Outer/Inner n=17
Education Training, materials, influence
stakeholders
Inner/Outer n=16
Financing Incentives, financial support Inner/Outer n=9
Restructuring Change roles, create teams, alter record
systems, create relationships
Inner/Outer n=7
Quality
Management
MIS + feedback, clinical reminders,
decision support, PDSA cycles
Inner/Outer n=16
Policy Change Licensure, accreditation, certification,
mandates
Outer/Inner n=3
Source: Powell , McMillen, Proctor et al (2011). A compilation of strategies for implementing clinical innovations in health and mental health. Medical Care Research and Review, 69(2) 123-157.

Organizational Factors in Youth
Mental Health ServicesNIMH PI: Aarons
Participant Organizations
– 49 programs in San Diego County94.4% participation rate
– Services providedOutpatient (49.0%) Day treatment 19.6%, Assessment/evaluation (9.8%), Case management (7.8%), Residential treatment (5.9%), other (7.9%)
Participant providers– 322 public sector clinical and case management service workers from
programs providing mental health services to children and adolescents and their families
96% participation rate
– 80% Full-time employees32% MFT, 31% Social work, 23% Psychology, 2% Psychiatry, 12% Other
Develop a measure of provider attitudes to adopting EBP
Examine correlates of attitudes

Participants (Clinics=49; Providers=322)
GenderMale
Female
23.3%
76.7%
RaceCaucasian
Hispanic
African-American
Asian/PI
Other
64.8 %
15.0 %
7.2 %
5.9 %
7.1 %
EducationSome college
B.A., B.S.
Some grad
MSW, MA, MFT
Ph.D. M.D.
3.2 %
19.9 %
10.1 %
56.2 %
10.1 %

Leadership, Organizational Climate
and Working Alliance
Transformational
Leadership
.28*
ns 0.13
.71*
ORGANIZATIONAL
CLIMATE
WORKING
ALLIANCE
Green, A. E., Albanese, B. J., Cafri, G., & Aarons, G. A. (2014). Leadership, Organizational Climate, and Working Alliance in a Children’s Mental Health Service System. Community Mental Health Journal, 50(7), 771-777.
N = 332 Mental health clinicians and case managers in 49 youth mental health programs

Results
Organizational climate and work attitudes mediated the effective of organizational culture on staff turnover.
Aarons, G.A., & Sawitzky, A. C. (2006). Organizational climate partially mediates the effect of culture on work attitudes and turnover. Administration and Policy in Mental Health and Mental Health Services Research,33(3), 289-301. PMCID: PMC1564125
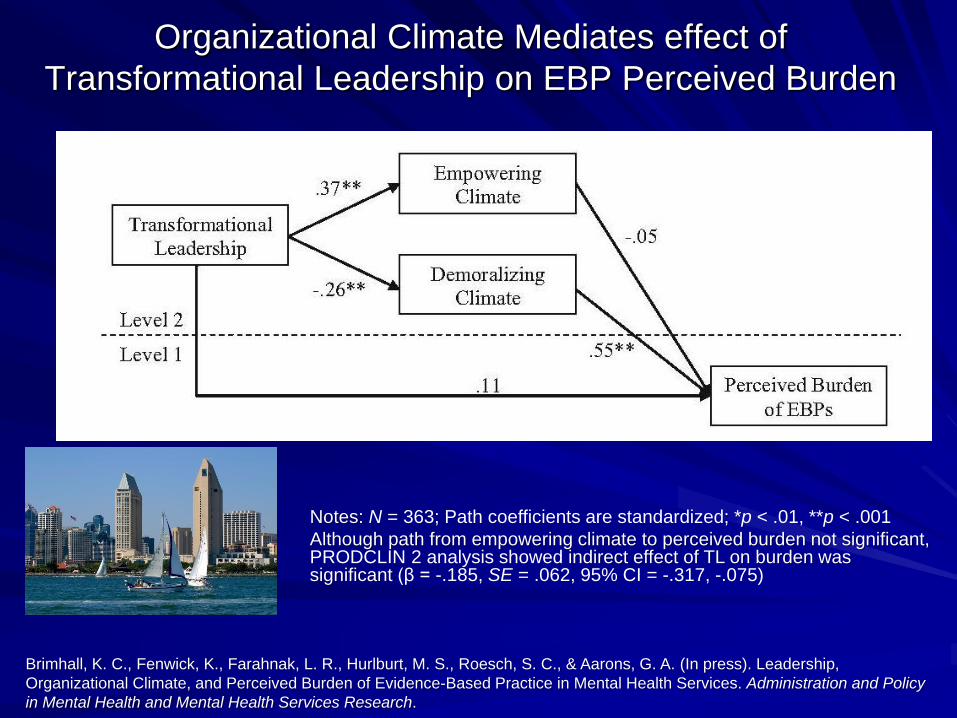
Organizational Climate Mediates effect of
Transformational Leadership on EBP Perceived Burden
Brimhall, K. C., Fenwick, K., Farahnak, L. R., Hurlburt, M. S., Roesch, S. C., & Aarons, G. A. (In press). Leadership,
Organizational Climate, and Perceived Burden of Evidence-Based Practice in Mental Health Services. Administration and Policy
in Mental Health and Mental Health Services Research.
Notes: N = 363; Path coefficients are standardized; *p < .01, **p < .001
Although path from empowering climate to perceived burden not significant, PRODCLIN 2 analysis showed indirect effect of TL on burden was significant (β = -.185, SE = .062, 95% CI = -.317, -.075)

Leadership Impact on Climate and Turnover
During Statewide Behavioral Health Reform
Aarons, G.A. & Sommerfeld, D.H., & Willging, C. (2011). The Soft Underbelly of System Change: The Role of Leadership and
Organizational Climate in Turnover during Statewide Behavioral Health Reform. Psychological Services, 8(4) 269-281.
Clinic Level Clinic Level Individual Provider
EmpoweringClimate
DemoralizingClimate
TransformationalLeadership
.800***/.598***
TurnoverIntentions
-.162 / -.370***.263**/.377*
.426***/.467***
-.341**/ -.482***
Turnover
Low organizational stress n=83
High organizational stress n=107
K=14 agencies,
3 rural counties, 3 urban counties

ARC Org. Intervention Effect on Turnover
39
65
0
10
20
30
40
50
60
70
ARC Control
30
Glisson C., Dukes, D., & Green, P. 2006. The Effects of the ARC Organizational Intervention on Caseworker Turnover, Climate, and Culture in Children’s Service Systems. Child Abuse & Neglect, 30, 855-880.
An
nu
al tu
rnover
pe
rce
nt
Note: Baseline turnover rate = 50%.

Mixed-Methods Study of a Statewide
EBP Implementation (NIMH R01MH072961 PI: Aarons)
Implementation of SafeCare® in Oklahoma’s Statewide Children’s Services System
Organizational and Clinical Theory/Hypothesis Driven
Combines exploratory and confirmatory approaches
Mixed Methods– Equal quantitative and qualitative components
Longitudinal at organization/team level
Requires collaboration and ongoing relationship building and maintenance
31
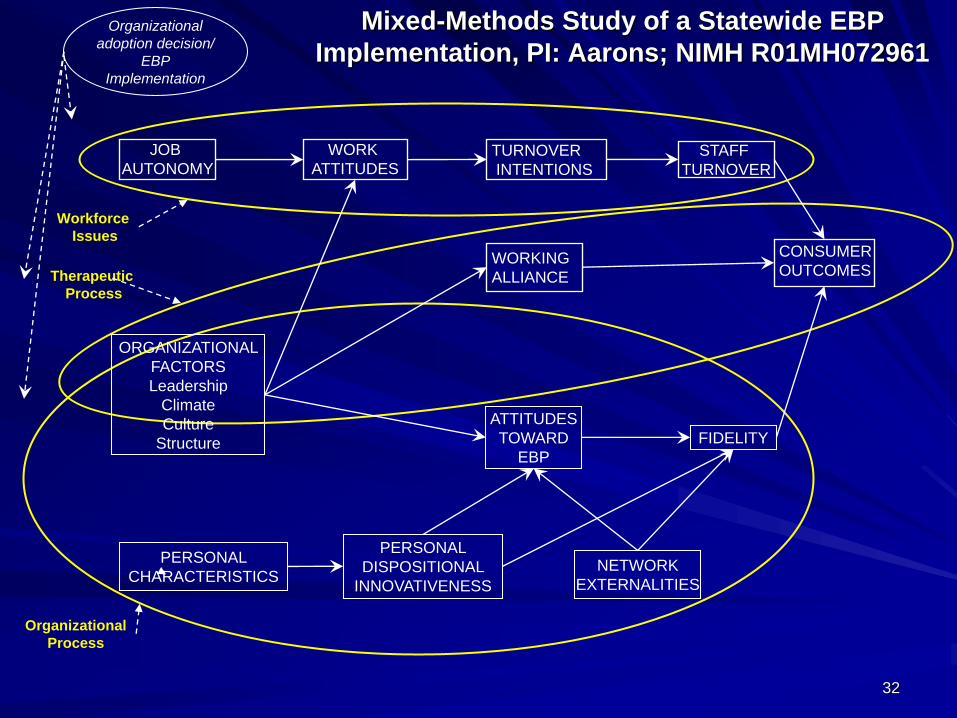
Mixed-Methods Study of a Statewide EBP
Implementation, PI: Aarons; NIMH R01MH072961Organizational
adoption decision/
EBP
Implementation
ORGANIZATIONAL
FACTORS
Leadership
Climate
Culture
Structure
PERSONAL
CHARACTERISTICSNETWORK
EXTERNALITIES
ATTITUDES
TOWARD
EBP
PERSONAL
DISPOSITIONAL
INNOVATIVENESS
FIDELITY
JOB
AUTONOMY
WORK
ATTITUDESTURNOVER
INTENTIONS
STAFF
TURNOVER
WORKING
ALLIANCE
CONSUMER
OUTCOMES
Workforce
Issues
Organizational
Process
Therapeutic
Process
32
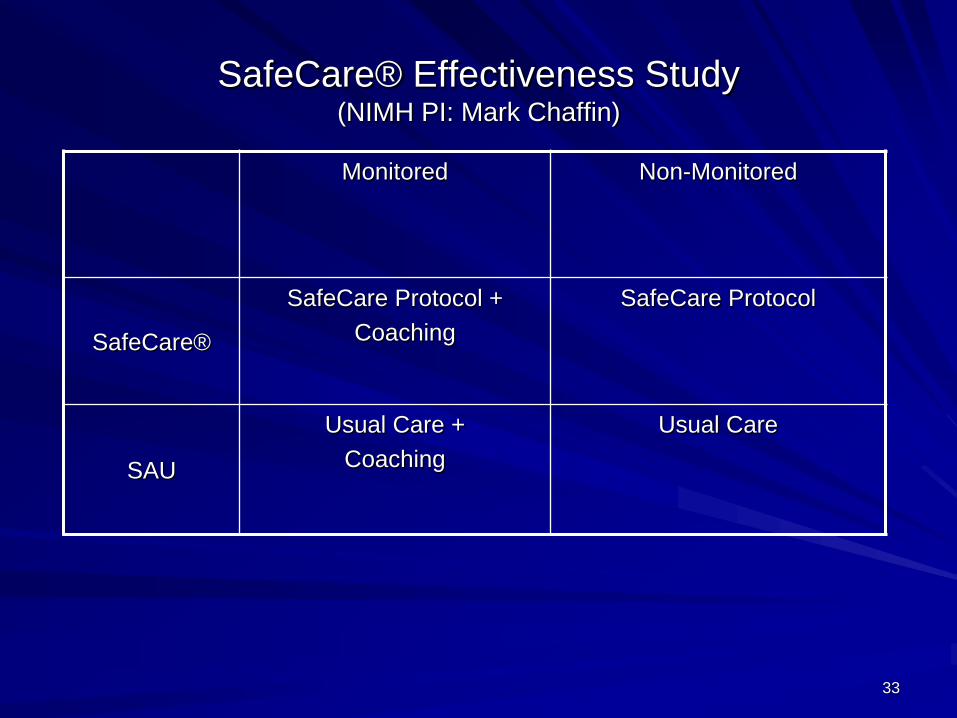
SafeCare® Effectiveness Study(NIMH PI: Mark Chaffin)
Monitored Non-Monitored
SafeCare®
SafeCare Protocol +
Coaching
SafeCare Protocol
SAU
Usual Care +
Coaching
Usual Care
33
Methods
Participants = service providers, supervisors, agency directors and executive directors (n approx. 140 but varies by wave, 21 teams of providers) – Race/ethnicity closely matches the service population
Longitudinal Web-based organizational surveys– Completed by service providers and supervisors
Annual Qualitative data collection (interviews, focus groups)– Service providers, supervisors, agency directors
Inherent quantitative data problems at system/organizational level– The “small n” problem
– Level 2 missing data problem
Response rates– Qualitative: >95%
– Quantitative: >95% over 12 waves
34

Mixed-Methods EBP Implementation StudyNIMH 5R01MH072961 (PI: Aarons) Implementation
NIMH 5R01MH065667 (PI: Chaffin) Effectiveness
Legend
EBP SafeCare
Usual Care35
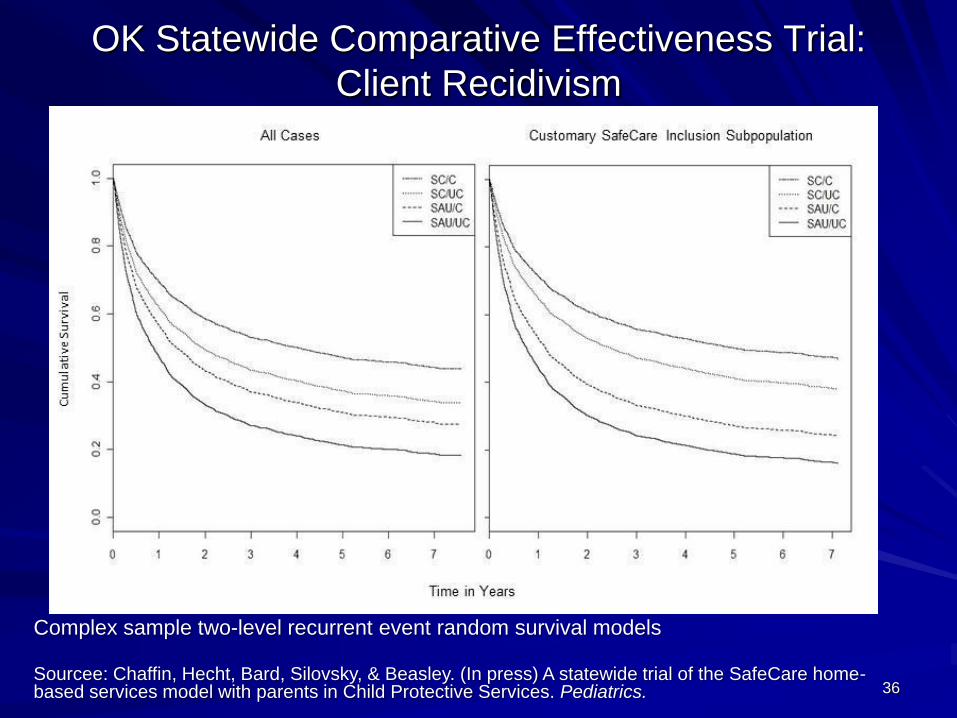
OK Statewide Comparative Effectiveness Trial:
Client Recidivism
Complex sample two-level recurrent event random survival models
Sourcee: Chaffin, Hecht, Bard, Silovsky, & Beasley. (In press) A statewide trial of the SafeCare home-based services model with parents in Child Protective Services. Pediatrics. 36

Figure 1. Kaplan-Meier Survival Function Estimates (Retention Probability) by Study Condition.
Note: SC/M = participating in SafeCare and fidelity coaching; SC/Non = participating in
SafeCare, but not fidelity monitoring; SAU/M = services as usual and receiving fidelity
monitoring; and SAU/Non = services as usual and not receiving fidelity monitoring. N=153.
Source: Aarons, Sommerfeld, et al (2009), Journal of Consulting and Clinical Psychology
Annualized Turnover by
Condition
Coaching
Yes No
Yes
SafeCare®
No
14.9% 33.4%
41.5% 37.6%
Implementation Outcomes
Effect of EBP Implementation on Staff Retention
37

Effects of Type of Leadership on Team Climate for
Innovation and Staff Attitudes Toward Adopting EBP
Leader Member
Exchange
.74**/-.11
-.09/.89***
.29**/.22
.84***/.91***
Aarons, G. A., & Sommerfeld, D. H. (2012). Leadership, innovation climate, and attitudes toward evidence-based practice during a statewide implementation. Journal of the American Academy of Child & Adolescent Psychiatry, 51(4), 423-431.
Team Climate for
Innovation
Provider
Attitudes to EBP
Transformational
Leadership
3 Regions Assigned to treatment
3 Regions Assigned to control
30 Teams; 140 service providers

Implementation Leadership Scale
The Implementation Leadership Scale– Identifies specific behaviors that leaders may enact to support and engage
followers in the larger goal of successful EBP implementation
– Focused on leader behaviors related to climate embedding mechanisms to promote strategic climates
– 1. Proactive Leadership“Has a plan to address implementation of EBP”
– 2. Knowledgeable Leadership“Is able to answer staff questions about EBP”
– 3. Supportive Leadership“Recognizes and appreciates employee efforts toward successful implementation of EBP
– 4. Perseverant Leadership“Carries on through the challenges of implementing EBP”
– Implementation Leadership Total Scale Total α = .97, 12 total items
Aarons, G.A., Ehrhart, M.G., & Farahnak, L.R. (2014). The Implementation Leadership Scale (ILS): Development of a Brief Measure of Unit Level Implementation Leadership. Implementation Science, 9(1) 45.

Implementation Climate ScaleImplementation Climate
– …employees’ shared perceptions of the importance of EBP or innovation implementation within the organization
(adapted from Klein, Conn, & Sorra, 2001, p. 813)
– 1. Focus on EBP“Using EBP is a top priority at this agency”
– 2. Recognition for EBP“Seen as clinical experts”
– 3. Support for EBP“This team provides EBP trainings”
– 4. Rewards for EBP“More likely to get a bonus/raise”
– 5. Selection for EBP“Previously used EBP”
– 6. Selection for Openness“Open to new interventions”
– Implementation Climate Total Scale– Alphas range .81-.91; Total alpha=.91– 18 total items
Ehrhart, M.G., Aarons, G.A., & Farahnak, L.R. (2014). Assessing the Organizational Context for EBP Implementation: The Development and Validity Testing of the Implementation Climate Scale (ICS), Implementation Science, 9:157.
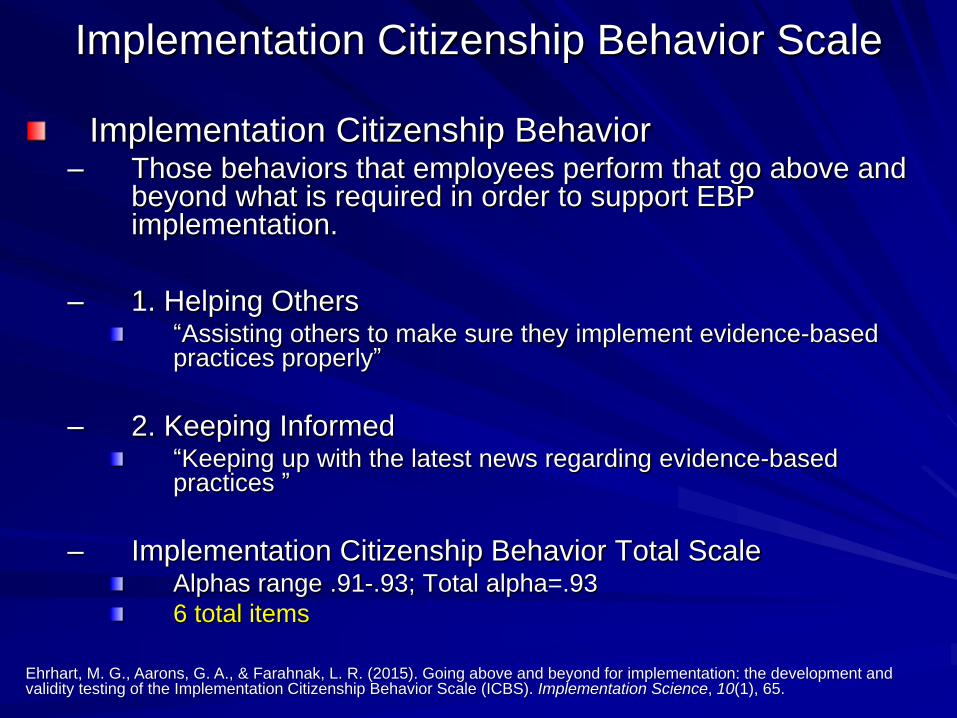
Implementation Citizenship Behavior Scale
Implementation Citizenship Behavior– Those behaviors that employees perform that go above and
beyond what is required in order to support EBP implementation.
– 1. Helping Others“Assisting others to make sure they implement evidence-based practices properly”
– 2. Keeping Informed“Keeping up with the latest news regarding evidence-based practices ”
– Implementation Citizenship Behavior Total ScaleAlphas range .91-.93; Total alpha=.93
6 total items
Ehrhart, M. G., Aarons, G. A., & Farahnak, L. R. (2015). Going above and beyond for implementation: the development and validity testing of the Implementation Citizenship Behavior Scale (ICBS). Implementation Science, 10(1), 65.
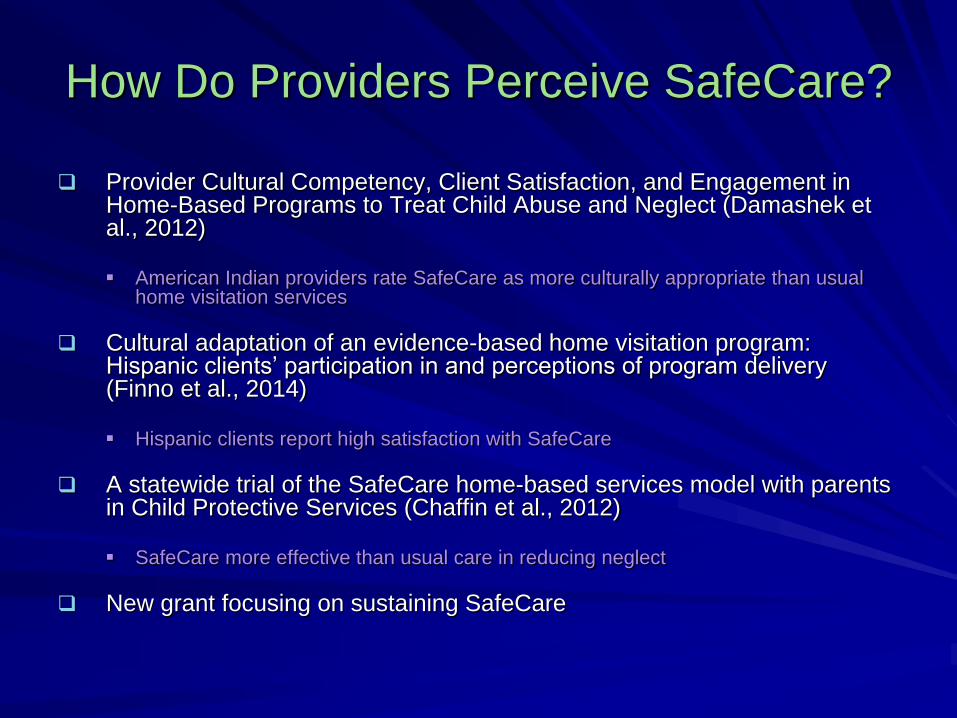
How Do Providers Perceive SafeCare?
Provider Cultural Competency, Client Satisfaction, and Engagement in Home-Based Programs to Treat Child Abuse and Neglect (Damashek et al., 2012)
American Indian providers rate SafeCare as more culturally appropriate than usual home visitation services
Cultural adaptation of an evidence-based home visitation program: Hispanic clients’ participation in and perceptions of program delivery (Finno et al., 2014)
Hispanic clients report high satisfaction with SafeCare
A statewide trial of the SafeCare home-based services model with parents in Child Protective Services (Chaffin et al., 2012)
SafeCare more effective than usual care in reducing neglect
New grant focusing on sustaining SafeCare

Child Welfare System
(EBP Policy + Service $)
Intervention Developers/
Academic Partners
SC Team x… SC Team 3 SC Team 2 SC Team 1
Seed TeamCommunity Based Orgs
TrainingFidelity Coaching
IMPLEMENTATION IN MULTIPLE TEAMS OVER TIME WITH ONGOING FIDELITY MONITORING (tablet based – real-time) + COACHING
United Way
(Training $)
Interagency Collaborative Teams to Scale-Up Evidence-Based Practice
(NIMH R01MH092950 PIs: Aarons & Hurlburt)

Practice Fit
Funding
Cross-level Leadership
Effective Developer Involvement
Coordinated Communication
Coordinated Inter-organizational Networks
Initial EBP
Education
Stakeholder
Development
Practice Fit
Assessment
Resource
Supports
Focus on
Fidelity
Skill
Development
Monitoring +
Feedback
Su
sta
inm
ent
< I
mple
me
nta
tio
n
< P
repa
ration
< E
xp
lora
tion
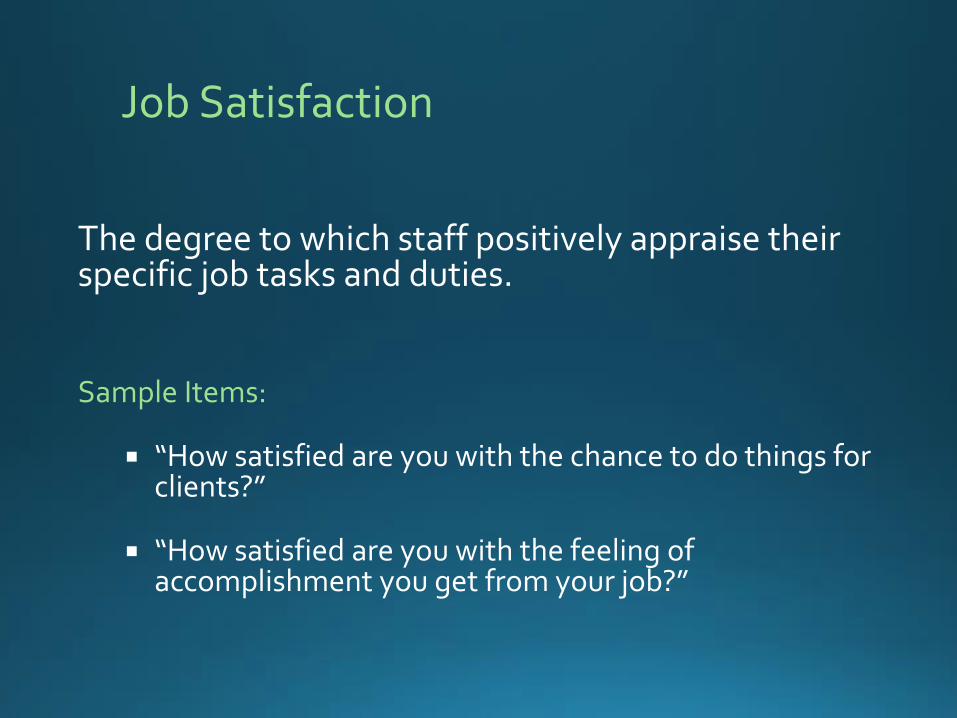
Job Satisfaction
The degree to which staff positively appraise their specific job tasks and duties.
Sample Items:
“How satisfied are you with the chance to do things for clients?”
“How satisfied are you with the feeling of accomplishment you get from your job?”

2.322.50
2.17 2.17
2.58 2.59
2.13
1.741.97
2.17
1.83
2.312.07
2.30
2.55 2.552.69 2.77 2.73 2.75 2.79
0
0.5
1
1.5
2
2.5
3
3.5
4
2008 2009 2010 2011 2012 2013 2014
Team E
Team C
All other teams
*Possible range is 0-4
Very great extent
Great extent
Moderate extent
Slight extent
Not at all
Job Satisfaction
Team E Team C

Organizational Commitment
The extent to which a staff member is a dedicated member of their team.
Sample Items:
“I am willing to put in a great deal of effort in order to help this CSF team be successful.”
“This team really inspires the very best in me in the way of job performance.”

2.58
2.98
2.44
2.92
3.23
2.87
2.25
1.71
2.352.58
2.77
2.252.36
2.17
2.83 2.893.11 3.07 3.13 3.16 3.23
0
0.5
1
1.5
2
2.5
3
3.5
4
2008 2009 2010 2011 2012 2013 2014
Team E
Team C
All other teams
*Possible range is 0-4
Very great extent
Great extent
Moderate extent
Slight extent
Not at all
Organizational Commitment
Team E Team C

Sample Items:
“I feel fatigued when I get up in the morning and have to face another day on the job.”
“I feel used up at the end of the workday.”
Emotional Exhaustion
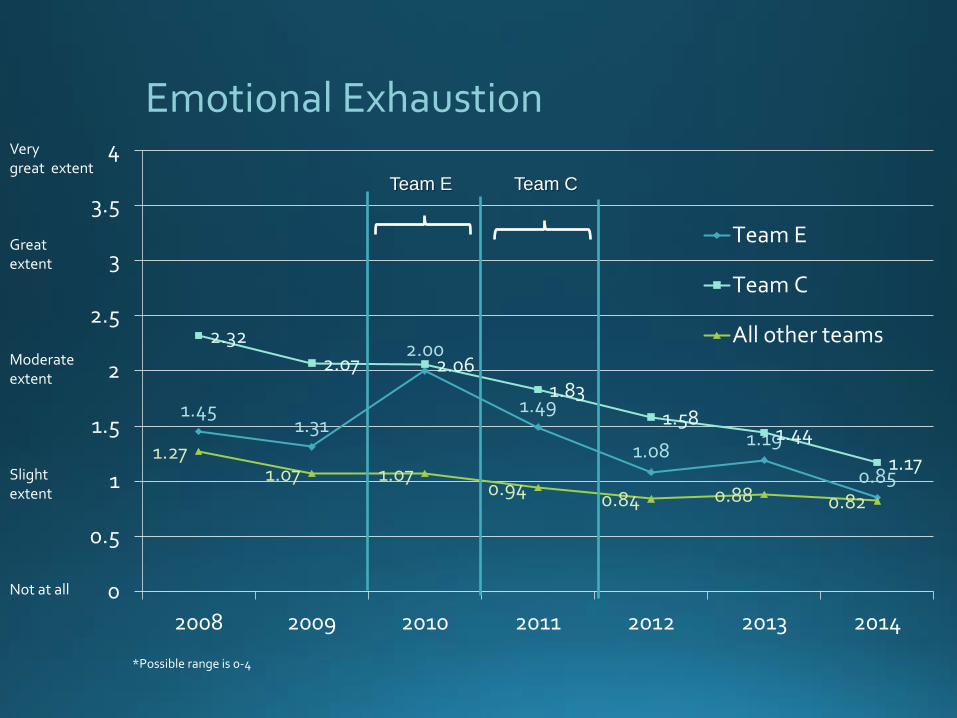
Emotional Exhaustion
1.451.31
2.00
1.49
1.081.19
0.85
2.32
2.07 2.061.83
1.581.44
1.171.27
1.07 1.070.94
0.84 0.88 0.82
0
0.5
1
1.5
2
2.5
3
3.5
4
2008 2009 2010 2011 2012 2013 2014
Team E
Team C
All other teams
*Possible range is 0-4
Very great extent
Great extent
Moderate extent
Slight extent
Not at all
Team E Team C

Sample Items:
“Interests of the clients are often replaced by bureaucratic concerns.”
“Rules and regulations often get in the way of getting things done.”
Role Conflict

Role Conflict
1.150.92
1.54
1.040.80 0.89
0.70
2.011.80
1.10
1.48
0.96 0.820.76
1.21 1.10
1.02
0.73 0.71 0.73 0.66
0
0.5
1
1.5
2
2.5
3
3.5
4
2008 2009 2010 2011 2012 2013 2014
Team E
Team C
All other teams
*Possible range is 0-4
Very great extent
Great extent
Moderate extent
Slight extent
Not at all
Team E Team C
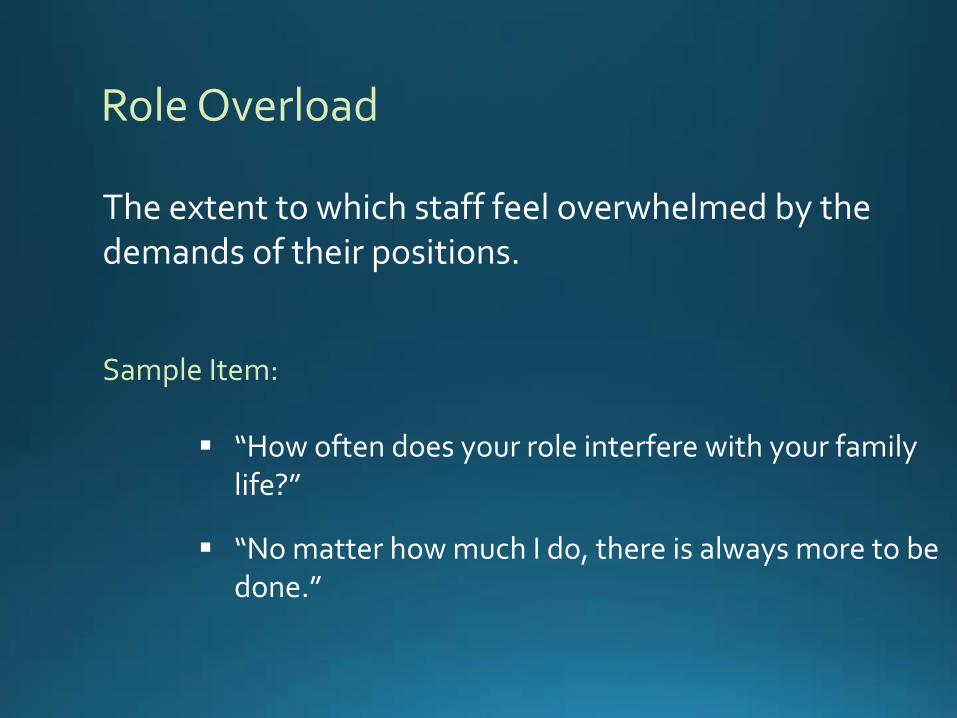
Role Overload
The extent to which staff feel overwhelmed by the demands of their positions.
Sample Item:
“How often does your role interfere with your family life?”
“No matter how much I do, there is always more to be done.”

*Possible range is 0-4
1.661.53
2.39
1.521.38
1.22 1.22
2.232.13
1.76
2.26
1.641.77
1.391.69
1.451.56
1.241.13
1.24 1.29
0
0.5
1
1.5
2
2.5
3
3.5
4
2008 2009 2010 2011 2012 2013 2014
Team E
Team C
All other teams
Role OverloadVery great extent
Great extent
Moderate extent
Slight extent
Not at all
Team E Team C
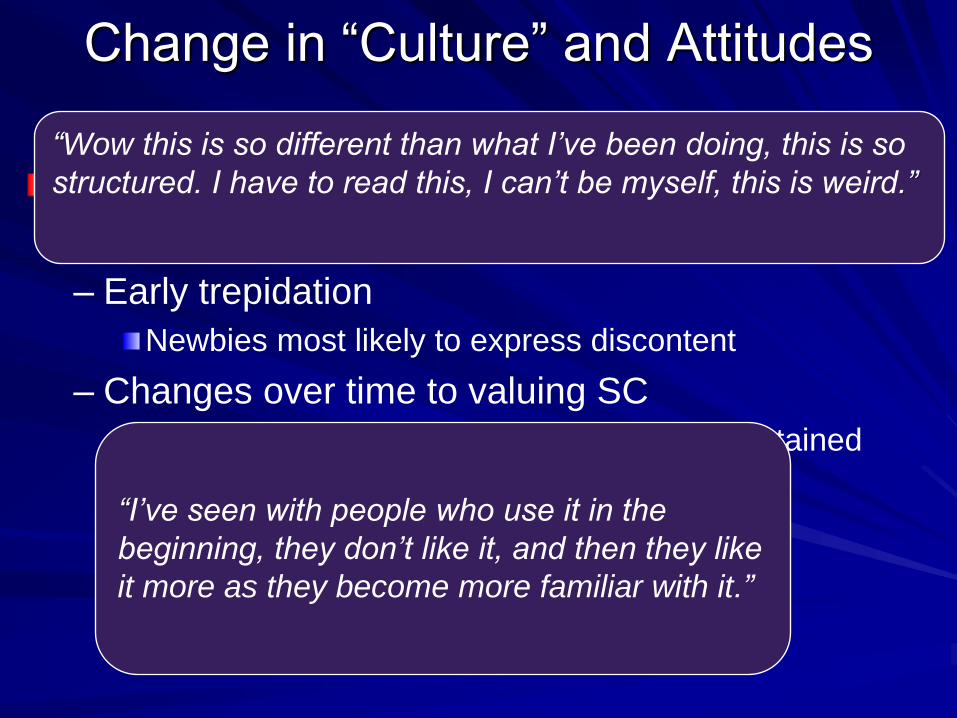
Change in “Culture” and Attitudes
Experience with SC is part of a culture
change process
– Early trepidation
Newbies most likely to express discontent
– Changes over time to valuing SC
Once experience is gained and mastery is attained
attitudes shift or attitudes shift concurrent with
development of mastery
“Wow this is so different than what I’ve been doing, this is so
structured. I have to read this, I can’t be myself, this is weird.”
“I’ve seen with people who use it in the
beginning, they don’t like it, and then they like
it more as they become more familiar with it.”

Job Satisfaction
Job satisfaction
– Very high among people who have used SC for a
while
“My folks love it and the folks not trained are clamoring to be
trained. And they like it for a couple of reasons. It’s clear, it
helps them not get sucked into some of the chaos of the
families we’re dealing with, it gives them a road map, they
can bring the family back to the point, and it works. It makes
a difference.”
“in terms of worker satisfaction... when I compare the folks
using SafeCare to those not, we are doing better with
SafeCare. And that’s really important, because the child
abuse prevention stuff is high burnout work. You go into
homes that are, you know, pretty icky.... And looking for
ways to support staff doing... that kind of home visiting is...
just something that you always have to be doing. And
SafeCare’s been valuable in those terms.”

Job Autonomy
Job Autonomy
– Newbies most likely to express concerns about
diminished autonomy/creativity because of
perceptions of strict adherence to the model
– Perception of the SC coach as overseer instead
of peer
– Some ambivalence re: autonomy
“I kind of like doing on-the-spot thinking, so
like previous experience and all that stuff I
bring it in with the previous curriculum, but
with this one it’s like I don’t have to. It’s
kind of all just laid out for me... Maybe it
made me less creative”
Burnout
Burnout
– Having a roadmap of how to work with families
buffers from burnout “Staff like it. And it makes them more
comfortable. It makes them feel more
effective. It reduces burnout.”

What About “Practice-Based Evidence”?
Interventions or service models that are in development
Interventions developed in the community
Most of these are in need of rigorous evaluation
Determine if it meets APA/IOM criteria
Source: American Psychological Association, 2005; Institute of Medicine, 2001

Summary
Implementation is needed to improve the use of effective interventions to serve the needs of children and families.
It is helpful to think of outer context, inner context, and the process or phases of implementation.
System and organization issues can affect provider functioning, job perceptions, and turnover
Important to consider how EBPs fit with system, organization, providers, and clients.
61
Contact info:
Gregory A. Aarons, Ph.D.Professor
University of California, San DiegoSchool of Medicine
Department of Psychiatry9500 Gilman Drive (0812)La Jolla, CA 92123-0812
E-mail: [email protected]
Twitter: @Greg_Aarons
Web: http://psychiatry.ucsd.edu/faculty/gaarons.htmlWeb: http://implementationleadership.com