imperial profits – the return on british investments in ... · imperial profits – the return on...
TRANSCRIPT

Imperial profits – the return on British investments in Africa, 1869-1969
WORK IN PROGRESS – PLEASE DO NOT QUOTE!
Klas Rönnbäck, ph.d., associate professor in economic history, University of Gothenburg
Oskar Broberg, ph.d., associate professor in economic history, University of Gothenburg
Abstract
In this paper, we study the return on British investments in Sub-Saharan Africa during the colonial period. The paper analyzes investments in a larger set of countries and over a longer time-period than what has been done in any previous studies, using modern-day methods of estimating the return on investments. Our results show that the return was substantially higher on investments in Africa than the return on investments in Britain or elsewhere in the world during this time. The return was highest during the Scramble for Africa and during the interwar period. The latter fact has been almost completely missed in previous research in the profitability of imperialism. The high return was clearly associated with investments in mines in Southern Africa in general (and South African in particular), and thus seem attributable to a combination of rich mineral deposits, and colonial institutions driving down many of the costs associated with the extraction of these resources.
Introduction
During the second half of the nineteenth century there was a drastic growth of the international capital markets. Recent research in global financial history has emphasized the pivotal role of the City of London in this process. Youssef Cassis has argued that London’s prominent position on the one hand was driven by the highly developed institutions in Britain – including the banks, insurance and finance companies – and on the other hand intimately tied up with the growth of Britain’s international trade (Cassis 2010, 83–89). Ranald Michie agrees that international investment opportunities clearly underlay the massive growth in market capitalization at the London Stock Exchange at the time (Michie 2001, 70; see also Michie 2006). The nominal value of securities on the London Stock Exchange thus increased from £2.3 billion in 1873 to £11.3 billion in 1913. This made London the leading financial center of the world at the time, ahead of both Paris and New York combined (Cassis 2010, 98). Britain thus came to export capital to most other parts of the world. The rate of return on these investments have however been hotly contested in previous research. While some scholars have argued that the return on foreign investments were substantially higher than the return on domestic investments (with some of the studies controlling for differences in risk), others have argued that there was only marginal differences in the rate of return on these investments.
1

The debate has important theoretical implications. On the one hand, it has been argued that high return on investments (in some of the literature called “super-profits”) acted as a vent for European capital, thus counteracting any tendency towards falling return on investments. On the other hand, the (belief in the) possibility to gain these “super-profits” has also been argued to have been an important incentive for financial interests to try to influence imperial policy. According to scholars such as P.J. Cain and A.G. Hopkins, in Britain, these financial interests also became highly successful in their attempts to influence the policy-making process (Hobson 1988; Cain 2002; Cain and Hopkins 1987; Cain and Hopkins 2001).
Previous empirical studies on the return on investments in colonial Africa have, however, suffered from various methodological problems. In this paper, we use the London Stock Exchange as the point of departure to analyze one aspect of these foreign investments – the rate of return on British investments in Africa 1869-1969. We study companies that were listed in London, but operated in different parts of Sub-Saharan Africa. By drawing on contemporary methods for measuring total return on investment we construct a more robust index than much earlier research, furthermore covering more nations, during a longer time period. The research questions we aim to explore in this paper: How high was the return on investments in the African colonies? Did it change over time? Did it differ in any significant respect by colony or sector?
The City, connecting the world
The second half of the 18th century was a watershed in the development of international finance. Before 1850 international finance had been dominated by government debt, bonds had been the primary financial instrument of speculation and the limitations of the systems of communication inhibited the growth of a global financial market. However, after 1850 many factors changed: international finance became more geared towards the finance of private ventures, stocks became the central vehicle for speculation during the heyday of industrialization, the introduction of new communication technology (telegraph 1840-1870, telephone 1870-1900) conquered the problem of distance, and relative political stability favored the expansion of international finance (Michie 2006). The introduction of comprehensive joint-stock legislation in Britain 1856-62 also opened up the field for a new type of actor – the company promoter. After a slow start with only a hand-full active promoters the market exploded during the mining boom of the 1880’s and promoters became integrated in the expanding network of specialized financial services of the City of London (Chapman 1988, 32). Taken together these trends propelled a rapid expansion of financial markets worldwide and the City was at the center of the development of international finance. To some extent this was paradoxical, since Germany and the United States were more and more challenging Britain’s role in terms of industrial strength (Cassis 2010). However, London’s position as the hub of international lending, trade and settlements was if anything strengthened after 1870 (Michie 2001). The London Stock Exchange could draw on several competitive advantages in relation to its continental and transatlantic counterparts during these expansive decades.
2

Firstly, the regulation of the London Stock Exchange was less strict than its primary competitors, such as New York, Paris, Frankfurt, Berlin, and Amsterdam. This favored the listing of companies and it also meant that the financial market in London was more open to financial and organizational innovations. This differed markedly from the competitors mentioned above where membership was restricted and the guarding of monopoly positions were key component of the financial actors (Turrell and Helten 1986; Michie 2006). Furthermore, during the period 1850 to 1900 the number of members at the London Stock exchange grew from 864 to 5 567 (Michie 2001). This created a productive undergrowth of financial actors in the City, specializing in different niches of the expanding financial markets – such as merchant banking, promoting, broker services, market intelligence and financing (Chapman 1985; Davenport-Hines and Van Helten 1986; Wilkins 1988). Chapman (1988) particularly highlights the importance of a number of Jewish merchant bankers for the setting of a new standard of risk-evaluation and competitiveness in the City during the course of the 19th century. These firms, such as Rothschild and Goldschmidt, were continental in origin but developed their businesses mainly via London.
Secondly, the growth of regional exchanges all around the world during the second half of the 19th century reinforced London’s hegemonic position. While New York, Paris and Amsterdam to varying degree championed London as the leading center for international finance, smaller exchanges acted more as peripheral nodes which complemented London (Michie 2006; Newbury 2009). For example the formation of a stock exchange in Johannesburg in 1888 stimulated the channeling of financial resources to the exploitation of diamonds and gold deposits in South Africa. Enabled by the advancement of new information and communication technology, the stocks of newly founded companies were often listed in both Johannesburg and London – combining the much needed local knowledge for mining development with the general know-how of finance, management and engineering which could be tapped from a London connection (Chapman 1985; Harvey and Press 1990; Katzenellenbogen 1990). An important organizational innovation in this respect was the exploration company – a joint-stock company in which various participants could pool resources to employ specialists to prospect potential mineral deposits. The Mosenthal, Sons & Co started its explorations in the South African diamond fields of Kimberley and it success made it model for others to copy. The number of exploration companies started in the 1880’s counted in hundreds and they became important vehicles for speculation during the booms and busts of the 1890’s (Turrell and Helten 1986). However, by the turn of the century investment trusts and investment groups replaced earlier ways of channeling capital to the mining industry. The reason, Chapman (1988) argues, was that they were able to combine the attractions of investment in lucrative new frontiers through foreign/colonial expertise with an aura of safety manifested by a familiar name and a London office.
Thirdly, London was able to draw on processes of path dependence in order to strengthen its leading role as international financial center. In part this had to do with the powerful networks of firms and individuals which were centered in London. These networks had developed over several hundred years extended in many directions, connecting domestic elites with financially resourceful interests both across the Atlantic and in continental Europe (Chapman
3

1985). The monetary arrangements of the international gold standard, which spread more widely from 1870 onwards, also benefitted the British pound as the undisputed currency in international trade. Furthermore, the political stability of Britain provided a fertile ground for investment. The political stability furthered the growth of a diversified financial market, providing investment opportunities for investors with very different risk appetite. On the one hand political stability rendered falling yields on government debt. This provided the market with safe but low-yielding bonds, which became a sort of investment of last resort. At the same time falling yields opened up the interest for more high-risk instruments in the periphery (be it Swedish government bonds, Russian railroads or Australian mining stocks). By 1900 these expanding opportunities for financial investments had made a substantial impact on the balance sheet of British national wealth – with 43 percent of the total assets were made up of securities. In developing countries this figured hovered around two or three per cent, whereas the global average at the same time was 16 per cent (Michie 2006).
Fourthly, the growth of the British Empire and its imperial policy stimulated the growth of international finance and consolidated London’s leading financial position. During the second half of the 19th century British overseas investment were markedly above the levels in France, Germany and the US. British FDI alone constituted 40 percent of global FDI (Michie 2006). These investments were primarily transferred abroad through the sale of bonds and stocks listed at the London Stock Exchange. In 1870 the largest recipients of these capital flows were the US and continental Europe. In 1896 this picture had changed into a more global investment pattern where India, South Africa, Latin America and Australia were on par with the US and continental Europe (Oneal and Oneal 1988, 354). This new FDI pattern developed in tandem with imperial policy, Cecil Rhodes’ combination of politics and entrepreneurship in Southern Africa is a telling example, but just as important was the appointment of Joseph Chamberlain as Secretary of State for Colonies in 1895. During his ten years in office he developed a combination of strong nationalism with an expansionary global imperialism (Dumett 2009a, 66) A parallel development that was important in this respect was the changing British self-conception of the Empire in the late 19th century. Contemporary writers were distinguishing the settlement empire (the so called “Greater Britain”) from areas of tropical colonial rule (i.e. India and tropical Africa). This issue became more pressing in the wake of the Second Boer War (1899-1902) when the loyalty of settlers became a tangible strategic asset (Dilley 2012, 2).
Hence, the City of London managed to retain its leading role during the decades of rapid financial expansion in the late 19th and early 20th century. This was accomplished not only because of its financial capabilities, but also due to its ability to channel organizational and technical expertise to ventures around the globe. Furthermore the City was helped by political forces which developed the empire by backing up private colonial ventures through investments in infrastructure and concessions to private corporations. The First World War marked a watershed in the development for the City of London in general, and the Stock Exchange in particular.At the outset of the war, the London Stock Exchange was still the heart of a world-wide network of individual and institutional investors and borrowers. It was also an institution which had been expanding for many decades. The war not only turned this
4

expansion around and partially destroyed these networks, it also marked a new era of regulation and government control visavi the financial markets. The aftermaths of the war in terms of the financial distress of the interwar period shook the foundations of the global financial system which had emerged in the 19th century (Michie 2001). Though London remained an important financial center throughout the 20th century, it lost its hegemonic position after 1914. Another important feature for the colonial FDI investigated in this paper is the development of the mining sector and its relation to the City of London around the turn of century 1900.
Mining and the scramble for Africa
In this paper we investigate the return on investment in Sub-Saharan Africa, via companies listed on the London Stock Exchange. One sector (mining) and one particular geographical area (South Africa) dominate our data material. This is neither a coincidence, nor a sampling effect of our deployed method. Rather it is an apt description of the context faced by contemporary investors looking for international investment opportunities (Dumett 2009b). Behind this development were powerful and intertwined economic forces – rising demand for base metals to satisfy the needs of industrialization and a concomitant rise in the demand for gold to meet the needs of increasing trade flows and the international gold standard (Harvey and Press 1990). Taken together mining competed with railways as the most popular object for speculation during the latter half of the 19th century. Throughout all continents and ranging from gold and diamonds to copper and oil, corporations were set up to explore and develop mineral resources (Michie 2006, 92). The domestic capital market targeting the mining sector had long been quite segmented geographically (Burt 1998). In the 1870s mining ventures of the US and Spain tapped the international financial markets on risk-seeking capital, but the discovery of gold in the Witwatersrand in 1886 turned things around. Together with other mineral deposits – diamonds, copper, coal and others – South Africa quickly became the focal point for international mining investments via the London Stock Exchange. In 1875 investments in South Africa constituted two or three per cent of total British FDI going to mining. By 1913 this figure was close to 50 per cent (Harvey and Press 1990, 106).
In contrast to many industrializing countries, where infrastructural investments determined the need of foreign capital, the discovery of gold of the Witwatersrand in the 1880s and the subsequent development of deep-level mining techniques created a massive demand for capital that could not be met within the borders of South Africa. Within a few years after the first discoveries a stock exchange opened in Johannesburg and over four hundred companies had been floated on the open market (both in Johannesburg and in London). The value of the South African gold production grew steadily from £10 000 in 1885 to £6 million in 1898 and to £70 million in 1911. This not only made South Africa the world’s major gold source and Johannesburg the largest city in South Africa, it also established Johannesburg as the leading financial center of the African continent (Jones 1988).
As earlier research has shown, this internationally financed expansion of the mining business fueled several boom-and-bust cycles on the London Stock Exchange between 1870 and 1913
5

(Turrell and Helten 1986; Michie 2001). The pursuit for new mineral deposits was a vital ingredient in the so called “scramble for Africa”. As earlier research has shown the rapid expansion of the mining business hinged upon the interdependent development of the large-scale organization of resource exploitation, the workings of international finance and imperial policy (Davenport-Hines and Van Helten 1986; Dumett 2009b). After 1914 the sturm-und-drang characteristics of the earlier period faded and the mining business in Africa consolidated into large scale organizations, both in terms of production, exploration and finance (Phillips 2009).
Financial markets and imperialism
A fundamental assumption in neoclassical economics is that there are diminishing marginal returns to capital on a given market. As returns to capital diminish domestically, it might become rational to invest the capital elsewhere – i.e. to export the capital. The “most obvious explanation” to the large capital exports from Britain, Kevin O’Rourke and Jeffrey Williamson have argued, was simply that investment demand was high due to “capital requirements associated with frontier expansion” (O’Rourke and Williamson 1999, 229). This capital export will also include different risk premia depending on the perceived risk level of the receiving country and the type of venture financed (Bodie and Merton 1999; Frankel 1967, 5) Following this line of thought, the export of capital from Europe to developing regions of the world during the first era of globalization could therefore be attributed to a combination of higher expected returns and to the larger risks involved. One would also expect that high returns would diminish over time as institutions develop and as high-risk ventures of the earlier colonial era were transformed into modern corporations.
Starting already in the late nineteenth centuries, many people would however come to argue for a connection between capital exports and imperial politics. A highly influential work was published in 1902: John Atkinson Hobson’s book Imperialism: A Study. By this time, many radical thinkers were arguing that there were various economic forces at play pushing Britain towards an imperialist policy, perhaps most importantly interests aiming to achieve protection for British trade (Hobson 1988; B. Porter 1968; Cain 2002). Hobson, however, proposed a theory of economic imperialism of his own. Imperialism, he argued, was to a large extent driven or directed not by trade interests, but by financial interests. Since capital saved at home in Britain had a hard time finding profitable areas to invest in, due to a combination of “oversaving” and “underconsumption”, Hobson argued that capital was invested in undeveloped parts of the world. The investors would however have strong incentives to try to protect their investments, and would therefore attempt to sway the British government to an imperialist policy (Hobson 1988; Cain 2002; B. Porter 1968, chap. 7).
Hobson’s theories came to have a great influence on Marxist theories on imperialism. Here the argument is that there is a general tendency in capitalist systems for the profit rate to fall over time and this would in the long run lead to economic crises for the capitalist system. Hobson’s argument, in combination with Hilferding’s argument that finance capital increasingly sought state intervention on behalf of the wealth-owning classes, influenced
6
Lenin in his writings on imperialism. For Lenin, a way to counteract this tendency of falling profit rates is to export capital from the centre to the periphery. Such an export, it was argued, could benefit from super-profits that supposedly were possible to attain within confines of an exploitative imperial system (Kemp 1967).
Hobson’s theory has later been heavily criticized by other scholars. One of the most influential was for a long time D.K. Fieldhouse, who argued that there were many other, non-economic aspects that were far more important in explaining imperialism than what Hobson’s theory allowed for (Fieldhouse 1961; see also Hillbom and Green 2010, 114–19). Later scholars have however suggested a return to an economic interpretation of imperialism, well in line with that suggested by J.A. Hobson. Most important have perhaps the contributions by P.J. Cain and A.G. Hopkins been, coining the term “gentlemanly capitalism” for the nexus between financial interests and the imperialist state (Hopkins 1973; Wolff 1974; Cain 1980; Cain and Hopkins 1980; Cain and Hopkins 1987; Cain and Hopkins 2001).
Issues of company failure and risk premium must also be taken into account when addressing the more general question of the profitability of foreign direct investments in high-risk environments (Casson and da Silva Lopes 2013; Chabot and Kurz 2010). This is especially important when it comes to Africa during the colonial era, since the flow of capital was dominated by investments in mining. Following the typology of Casson and Lopez (Casson and da Silva Lopes 2013, 376) these investments were risky both in terms of institutional risks (political, social, business and financial) and natural risks (climactic and geological) (Harvey and Press 1990; Michie 2006, chap. 4; Dumett 2009b).
Previous research on the return on investments
In this paper, we will focus upon British investments in Sub-Saharan Africa in particular. Previous research has shown that the share of investments that went to Africa was rather small. Some of the earliest estimates pointed to an average of 5-7 per cent of total British capital exports being directed to Africa (Segal and Simon 1961; Davis and Huttenback 1985, table 3; Davis and Huttenback 1986; see also Platt 1980; Feinstein 1990). More recent research has confirmed that this was the case during the late nineteenth century. From the 1930s, however, African colonies became an increasingly important market for British investments, reaching 10-12 per cent of total capital exports in the period after the Second World War (Twomey 2000, table 3.10).
What was the rate of return on these investments, compared to what similar investments yielded in Britain and elsewhere? This issue has been debated in previous research. In many of the monographs on particular companies, one can easily find information about how successful some of the more well-known companies such as Anglo-American, De Beers, the British South African Company or Ashanti Goldfields were (Taylor 2006; Newbury 2009; Chilvers 1939; Katzenellenbogen 1973; Cunningham 1981; Tignor 2007). While these studies might shed light on the history of the individual companies, they are hardly enlightening on the issue of the general profitability of investments, since there is a problematic selection bias
7

of business history monographs. Those companies that have been the focus of such research were rarely chosen at random among all companies, but have generally been chosen particularly because they happened to become successful. For every successful company, one could however also find many failures. J. Forbes Munro have for example argued that many companies that invested in for example plantations in Africa failed economically, for various reasons (Munro 1981; Munro 1983; Munro 1984, 28–29; see also Mollan 2009). There have however been many attempts to analyze the general profitability of foreign versus domestic investments. Older studies contributing to the field are for example those by Herbert Frankel (Frankel 1967), Simon Katzenellenbogen (Katzenellenbogen 1975), Robert Kubicek (Kubicek 1975; Kubicek 1979), Michael Edelstein (Edelstein 1976; Edelstein 1982; Edelstein 1994), Peter Svedberg (Svedberg 1982), and – perhaps most influentially - Lance Davis and Robert Huttenback (Davis and Huttenback 1986; see also Davis and Huttenback 1982; see also Hopkins 1988; A. Porter 1988 for a critique).
There is no consensus in this older literature on how high the return on investments in colonies (neither in general, nor in Africa in particular) was, relative to return on domestic investments. Some scholars claim to find that return on colonial investments were consistently higher than return on domestic investments (see for example Edelstein 1982; Svedberg 1982), whereas others claim no substantial difference in return on investments (see for example Frankel 1967; Davis and Huttenback 1986). Many of these older studies do however suffer from methodological problems and/or comparatively small and potentially very unrepresentative samples of data. In more recent years, there has been much more work on the return on investments in various countries, using much more developed methodologies and representative samples of data. Many of these studies have been studying developed countries in particular (Goetzmann, Ibbotson, and Peng 2001; Dimson, Marsh, and Staunton 2002; Grossman 2002; Eitrheim, Klovland, and Qvigstad 2004; Acheson et al. 2009; Esteves 2011; Waldenström 2014).
There are however some recent research also studying the return on overseas investments. In 2002, Elroy Dimson, Paul Marsh and Mike Staunton published Triumph of the Optimists: 101 Years of Global Investment Returns (Dimson, Marsh, and Staunton 2002). In the book, the authors attempted to create estimates of return on investments in a number of countries during a century, from 1900 to 2000. Despite the subtitle, the data they actually present is however far from global: the data is reported by nation, but only one country in Africa (South Africa), and no Latin American or Asian countries, is included in the analysis.1 The data collection procedure varied between the countries and the time-periods studied, so the data for the United Kingdom is for example based on a sample of 247 companies for the period prior to 1955, and 604 companies for the period thereafter. The dataset for South Africa was spliced together from two different sources. The exact number of companies included in the South African sample is not reported. However, according to the authors it should cover at least 60 per cent of the total market capitalization value (Dimson, Marsh, and Staunton 2002, 279; see also Firer and McLeod 1999). The results indicate that the return on investment in South
1 In a later publication, these authors also include data on the return on investments in China and Japan , see (Dimson, Marsh, and Staunton 2016)
8

Africa was high during the period 1900 to 1969, consistently one to two percentage points above both the world average return on investment and the rate of return in the United States or the United Kingdom.
Frans Buelens and Stefaan Marysse have published a study of the return on investment in Belgian Congo, comparing the figures to return on investments in Belgium (Buelens and Marysse 2009; see also Annaert, Buelens, and De Ceuster 2012). The number of companies operating in Belgian Congo is not reported. Their results indicate that return on investments in Belgian Congo was higher than return on investments in Belgium. This was true throughout the period except for the 1950s, the last decade of colonialism in Belgian Congo. When the 1950s are included in the estimate, however, the average return on investments in Belgian Congo is decreased to very low levels, due to many country risks being realized as losses at this time.
Benjamin Chabot and Christopher Kurz published a study of the “foreign bias” in English investment during the period 1886 to 1907. Their data show that high returns was not necessarily the only (or even the main) benefit of investing overseas. The real benefit, they argue, was instead that the diversification of portfolios from holding overseas assets increased the investors’ utility (Chabot and Kurz 2010).
The most recent study of the historical return on investments has been published by Richard Grossman, studying the return on British investments both domestically and overseas in the period 1869 to 1928 (Grossman 2015). In contrast to Dimson et al, Grossman’s data covers investments in countries all over the globe, but a drawback is that the data only is reported by continent (with the exception of data for the United Kingdom in particular). The results show that the return was substantially higher on investments in “less developed” economies in Africa, Asia or Latin America than they were in the developed economies in Europe or North America.
As for the recent literature in the field, there are two key limitations.
• Firstly, the chronological delimitations. Older studies of the profitability of imperialism were all limited to the period prior to the outbreak of the First World War. Chabot and Kurz’s more recent study (Chabot and Kurz 2010) is similarly delimited to a short period of time prior to the First World War. Richard Grossman’s recent study (Grossman 2015) covers a slightly longer time-period, including the years until 1928 in his study. Any development after this time is thus not included in the analysis. But, as shown by Dimson, Marsh, and Staunton (2002), in order to handle exogenous events and market volatility the length of the data series are crucial when analyzing the average return on investment. This issue becomes even more acute for the African context, where risk and volatility historically has been high. The case of Belgian Congo is illustrative, where the choice of limiting the data series to 1955 (rather than 1960, when the country risk is realized in the process of independence) doubles the long-term average return on investment (Buelens and Marysse 2009, 152–53). Dimson et al, on the other hand, only start their study in 1900. For the purpose of our study,
9

they thereby miss the important years of the “Scramble for Africa”, at the end of the nineteenth century.
• Secondly, the geographical delimitations. Buelens and Marysse’s study was limited to companies operating in one specific countries, Belgian Congo. Dimson et al claim to estimate return on global investments, but the only African country included in their dataset is South Africa. These cases do not have to be very representative of other African countries. Grossman, on the other hand, include data on investments in various countries all over the world, but does only report it on a continental level.
Aim of this paper
The aim of the current paper is to study the return on investments in Sub-Saharan Africa, from the perspective of an investor on the British stock market. The research question of the paper is: how high was the total return on investments in Sub-Saharan Africa, compared to return on domestic investments in Britain?
In contrast to recent previous studies in the field, we combine a long historical perspective (by studying a century of return on investments, from 1869 to 1969), with a broad geographical perspective (by studying investments in a large number of countries in Sub-Saharan Africa).
Our null hypothesis is that there was no significant difference in aggregate return on African versus domestic investments over the long run, as has been suggested previously by many older studies. A first alternative hypothesis is that the aggregate return on investments in Africa was lower than the return on investments in Britain. This could be the case if the investors generally had imperfect information about the investment opportunities opening up in Africa, and would overinvest in what became unprofitable ventures. A second alternative hypothesis is that the aggregate return on investments in Africa on the contrary was higher than return on investments in Britain. This could be the case either if the investments were profitable, but for some reason were considered by the investors to be more risky on a systemic level, or if underlying profitability of the companies indeed were higher, as theories of imperial exploitation would suggest. If the second alternative hypothesis would find support in the empirical evidence, further analysis of why this was so would be necessary.
Source and method
This paper makes use of data from the U.K. Stocks database, owned by the company Global Financial Data (henceforth GFD) and available by subscription. The database contains historical data on the price of the shares listed on the London Stock Exchange. Data include opening, low, high and closing prices. The database also contains information on dividends, number of shares outstanding, the country of incorporation, sector in which the company is operating, and other variables. GFD has collected the daily stock price data from The Times of London, while weekly/monthly data was assembled from the Investors’ Monthly Manual
10

published by The Economist. The periodicity of the data varies by company. Daily data is available for many companies in the sample from the early 20th century onwards. For some companies and/or time-periods data is only available on a weekly or monthly basis. Data on shares outstanding, as well as for dividends, were also assembled by GFD, based on the Investors’ Monthly Manual through 1930, and from the Stock Exchange Yearbook from 1930 onwards.
The current paper is delimited to the time-period 1869-1969, which will cover the period from well before the main “Scramble for Africa”, to some years into independence for the former colonies. Companies were selected to be included in our study if they met either of the following three criteria: (1) Companies traded on the London Stock Exchange anytime during this period with “Country of Incorporation” somewhere in Sub-Saharan Africa. This amounts to 471 companies in total. The vast majority of these (352 companies) were incorporated in South Africa alone. (2) Companies with the word “Africa” (or derivations of this, e.g. “African” in their company name, incorporated in a non-African country. Aside from those already selected according to the first criteria, this criteria yielded a further 14 companies in total, all of them formally incorporated in the United Kingdom. (3) Companies with the name of an African country or distinct region (e.g. “Rhodesia”, “Nigeria”, “Transvaal”) in the company name, incorporated in a non-African country. This yielded a further 4 companies in total, all of them formally incorporated in the United Kingdom. The total number of companies selected in this way thus amounted to 490 companies.
We have checked the reliability of the data from GFD’s database manually against the primary sources available in the Guildhall Library in London for a couple of selected companies from the sample. The data on the last (closing) price of the stocks every month did for these companies match extremely well, with correlations higher than 99 per cent. GFD’s data on dividends does however seem somewhat more problematic, since we have found examples of dividends paid out that were not recorded in GFD’s database. Any missing data on dividends paid out will lead to a downward bias on our estimated return on investments. If this actually would have any substantial impact upon the estimated levels is however hard to tell. We do however believe that the database is reliable enough for our purposes in general. We are however not able to use all data-series available in the database due to this missing data. For 105 companies, the database contained information that dividends were paid to the shareholders a number of times, but information was lacking on how high any of these dividends were. Since estimates based on these data-series so clearly would be systematically biased we have omitted these companies from the calculations. For 31 companies, furthermore, data on the number of shares were missing for the whole period for which there was share price-data. It therefore becomes impossible to include them in a market capitalization weighted index. Most of these companies for which data is missing are most probably of little importance. As for the companies where data is missing on the number of shares outstanding, all of them seem to be very short-lived and virtually all were only traded during a year or two on the stock market (the longest one of these companies was traded for a period of 12 years). They could thus at most have an impact on the estimates for some particular years, but very little impact on our aggregated estimates. The companies where data
11

is missing on the amount of dividends paid out vary more: while a large share of them also are very short-lived (and thus potentially yield rather low return on investments), there are also a couple of quite large and successful companies (based on the data on capital gains from change in stock price alone), such as SABMiller plc. That some of them potentially yielded comparatively high return, whereas other yielded comparatively low return, on investments do thus at least to some extent cancel each other out when calculating the market capitalization-weighted index for the sample. The sample that we actually are able to use is therefore made up of 354 unique companies. The number of observations per company varies substantially – whereas the stocks of some companies were traded for almost the entire period of the study, other companies only figure for a very brief period of time. In total, the database contains 77,682 company-month observations.
The monthly profit of an individual company was calculated based on the following formula (equation 1).
𝑚𝑚𝑚𝑚𝑡𝑡 = 𝑒𝑒𝑒𝑒𝑚𝑚 ��𝑙𝑙𝑙𝑙 �1 +(p𝑖𝑖 − p𝑖𝑖−1) + 𝑑𝑑𝑖𝑖
𝑚𝑚𝑖𝑖−1�
𝑛𝑛
𝑖𝑖=1
� − 1
Where mp is the monthly profit in year-month t, p is the closing price of the share (after controlling for any splits), and d is the dividend paid to the shareholder, for each share-price observation i that year. Market capitalization of the individual company was calculated as the product of the number of shares outstanding and the closing price of the stock for each month. The company’s market capitalization is thus calculated by (equation 2):
𝑚𝑚𝑚𝑚𝑡𝑡 = 𝑚𝑚𝑡𝑡 ∗ 𝑠𝑠𝑡𝑡
Where mc is the company’s market capitalization at time t, p the closing price of the share, and s the number of shares outstanding. The data for the individual companies was then assembled into a joint database, and a weighted profit-index was created. The index was weighted by the relative market capitalization of each company following the formula (equation 3):
𝑚𝑚𝑝𝑝𝑡𝑡 = ���𝑚𝑚𝑚𝑚𝑥𝑥𝑡𝑡
∑ 𝑚𝑚𝑚𝑚𝑥𝑥𝑡𝑡 𝑛𝑛𝑥𝑥=1
� ∗ 𝑚𝑚𝑚𝑚𝑡𝑡𝑥𝑥�𝑛𝑛
𝑥𝑥=1
where pi is the weighted monthly profitindex at time t, when including all companies x. The monthly profitindex was then annualized by adding up the logarithmic values of the monthly profitindex by year. Special indices have also been constructed by sector, by region and by country of incorporation, following the same basic model. Estimates of extreme values (with annual profits of more than 100 per cent or losses of more than 50%), in case the share of the market capitalization exceeded 2 per cent of total market capitalization, have been checked manually against the original data from GFD to ensure that there was no errors in the calculations.
12
The development of the total rate of return over time can be expressed as arithmethic or geometric mean. The arithmethic mean answers the question: If I chose a year at random, what return should I expect? Hence, it functions as a starting point for analysing the volatility of markets. However, since arithmethic means underestimate the importance of negative numbers (if you first lose 50% of an investment and then gain 50% you have still lost money, even though the arithmethic mean will be zero) it is not a good guide to estimate the rate of return over longer time periods. The geometric mean, on the other hand, represents the compounded annualized rate of return that equates the initial investment to the final value of a portfolio. Research on modern-day data has suggested that the choice of estimate biases the results upward (arithmetic mean) or downward (geometric mean) and that an unbiased result can be found in between the two (see for example Indro and Lee 1997; Jacquier, Kane, and Marcus 2003; Mindlin 2011). In this paper, we therefore choose to follow previous research in reporting both the arithmetic and geometric mean return on investments, but we will primarily use geometric mean when we compare the long-term performance of investments. Real return on investments have been calculated using data on the inflation rate in Britain (O’Donoghue, Goulding, and Allen 2004), as this would seem to be the most relevant inflation rate for British investors.
In table 1 our dataset is illustrated both in terms of country and by industrial sector.
13

Table 1. Description of the sample
Unique companies Company-month observations N % N % By country Botswana 2 0.6 680 0.9 Ethiopia 1 0.3 163 0.2 Ghana 21 5.9 4,208 5.4 Kenya 6 1.7 747 1.0 Malawi 1 0.3 74 0.1 Mauritius 5 1.4 1,289 1.7 Mozambique 2 0.6 171 0.2 Namibia 3 0.8 759 1.0 Nigeria 23 6.5 3,658 4.7 South Africa 252 71.2 59,470 76.6 Swaziland 1 0.3 48 0.1 Tanzania 3 0.8 149 0.2 Uganda 1 0.3 209 0.3 United Kingdom (companies operating in Africa)
8 2.3 1,785 2.3
Zambia 3 0.8 781 1.0 Zimbabwe 22 6.2 3,491 4.5
By industrial sector Consumer products 19 5.4 2,591 3.3 Finance 17 4.8 5,491 7.1 Industrials 13 3.7 1,790 2.3 Materials (non-mining)
17 4.8 1,998 2.6
Mining 264 74.6 59,916 77.1 Real estate 8 2.3 2,281 2.9 Transport 4 1.1 954 1.2 Utilities & Energy 12 3.4 2,661 3.4
Total 100.0 100.0 Source: own calculations based on Global Financial Data U.K. Stocks Database.
14

Results
Capital gains
Figure 1. Index of price of African stocks on the London Stock Exchange, 1869-1969 (1868=100)
Source: own calculations based on Global Financial Data U.K. Stocks Database.
Figure 1 shows the development of the price of the African stocks on the London Stock Exchange. Over the whole period, the value of the stocks exhibited a remarkable growth: on average 9.2 per cent per year for the whole period. The growth seems the most remarkable in the 1890s, after which a period of stagnation and decline set in during the first decades of the twentieth century. The 1930s initiated a new period of comparatively high growth of the value of the African stocks.
Total return on investments
Because of the strong growth in the capital value of the stocks, the return on investments was also high. Table 2 reports data on the aggregate nominal and real return on investments for the whole period of our study, 1869-1969.
Table 2.Total return on investments in Africa, per annum, 1869-1969
Nominal return Real return Arithmetic mean 17.1% 15.0% Geometric mean 14.9% 12.5%
10
100
1000
10000
100000
1000000
10000000
1869
1873
1877
1881
1885
1889
1893
1897
1901
1905
1909
1913
1917
1921
1925
1929
1933
1937
1941
1945
1949
1953
1957
1961
1965
1969
15

S.d. 22.4% Source: own calculations based on Global Financial Data U.K. Stocks Database.
As would be expected, the estimated arithmetic return on investments was somewhat higher than the geometric mean return. The annual return on investments remains high even after deflating the nominal figures. The high figures are explained by the very high overall return on investments exhibited by some of the largest companies in the sample: an average (geometric mean) nominal return on investments of for example 11 per cent per year for DeBeers Consolidated Mining Co, 14 per cent per year for Gold Fields of South Africa, 18 per cent per year for Consolidated African Selection Trust, and a remarkable 23 per cent per year for Anglo-American Investment Trust. The market capitalization-weighted average return on investments does to a large extent depend upon the performance of these large companies.
Table 3. Real and nominal annual return on investments by time-period, per annum, 1869-1969
Nominal returns Real returns S.d. Number of companies Arithmetic
mean Geometric
mean Arithmetic
mean Geometric
mean 1870-1890
17.2% 15.7% 17.7% 16.2% 19.4% 47
1891-1913
16.2% 13.9% 15.7% 13.4% 23.8% 184
1914-1918
10.1% 8.6% -5.4% -6.9% 19.6% 124
1919-1938
19.4% 17.3% 20.1% 18.0% 25.8% 163
1939-1945
15.6% 14.6% 9.0% 8.0% 16.1% 70
1946-1970
17.7% 15.4% 13.6% 11.3% 24.4% 172
Total 17.1% 14.9% 15.0% 12.5% 22.4% 354 Source: own calculations based on Global Financial Data U.K. Stocks Database. Note: many companies exist during several of the periods, which is why the sum of the number of companies in each period is larger than the total sample size of 354 companies.
Table 3 aggregates the data by sub-periods, delimited by the major shocks occurring during the time-period studied: the Scramble for Africa, and the two World Wars. The data reveals considerable differences in return on investments between the different time-periods. The period up to the First World War exhibited very high return on investments in Africa. The First World War was a period of substantial losses for investments in Africa, since nominal returns were too low to even keep up with the substantial inflation during the war. The interwar period saw a return to very high return on investments in Africa – indeed, the highest return on investments of all the sub-periods reported in the table. During and after the Second World War, the return on investments in Africa dropped substantially compared to what it had been in interwar period.
16

Table 4. Real annual return on investments by region of incorporation, per annum, 1869-1969
Region Arithmetic mean
Geometric mean
S.d. Number of companies
East Africa 11.2% 5.3% 38.4% 16 West Africa 15.6% 6.7% 47.1% 44 South Africa 14.5% 12.0% 24.0% 252 Other Southern Africa 18.6% 9.8% 46.3% 34 Unknown region of Africa* 13.2% 5.3% 40.1% 8 Total 15.0% 12.5% 22.4% 354 Source: own calculations based on Global Financial Data U.K. Stocks Database. *: these companies are incorporated in the United Kingdom, but contain the word “Africa” in their company name indicating that they operate in Africa, but it is unclear exactly where in Africa they operate.
Table 4 shows the real annual return on investments by region of incorporation. As can be seen in the table, the market-capitalization weighted return on investments was on average positive in all regions of Africa. There were however substantial differences between the regions particularly when it comes to the geometric mean return; the figures for South Africa were for example more than double those exhibited in East Africa. The standard deviation (as well as the difference between the arithmethic and the geometric mean) also show that return on investments was considerably less volatile in South Africa than elsewhere on the African continent. Paradoxically, from the perspective of analysing the risk premia, the return on investments was therefore the highest in the country in Sub-Saharan Africa exhibiting the lowest risk. The reason that the mean return on investments for the whole sample is larger than any of the particular region seems to be attributable to the fact that the return on investments varied differently in the different regions over time: investments in South Africa (the main country of investments) were comparatively profitable throughout the period, whereas investments in for example West Africa were considerably more profitable during the early decades of our study. At the same time, market capitalization (and thereby the weight accorded to each company, and indirectly also each region) grew at different rates in the different regions, with the value of the investments in South Africa growing particularly rapid over the period.
Table 5. Real annual return on investments by industrial sector, per annum, 1869-1969
Arithmetic mean Geometric mean S.d. Number of companies
Consumer products 4.3% 2.0% 23.1% 19 Finance 11.9% 8.9% 27.0% 17 Industrials 10.3% 2.1% 40.9% 13 Materials (non-mining) 6.0% 1.6% 28.0% 17 Mining 19.1% 15.5% 30.2% 264 Real estate 12.6% 10.1% 26.0% 8 Transports 10.9% 6.1% 31.6% 4
17
Utilities & Energy 8.2% 5.2% 26.5% 12 Total 15.0% 12.5% 22.4% 354 Source: own calculations based on Global Financial Data U.K. Stocks Database.
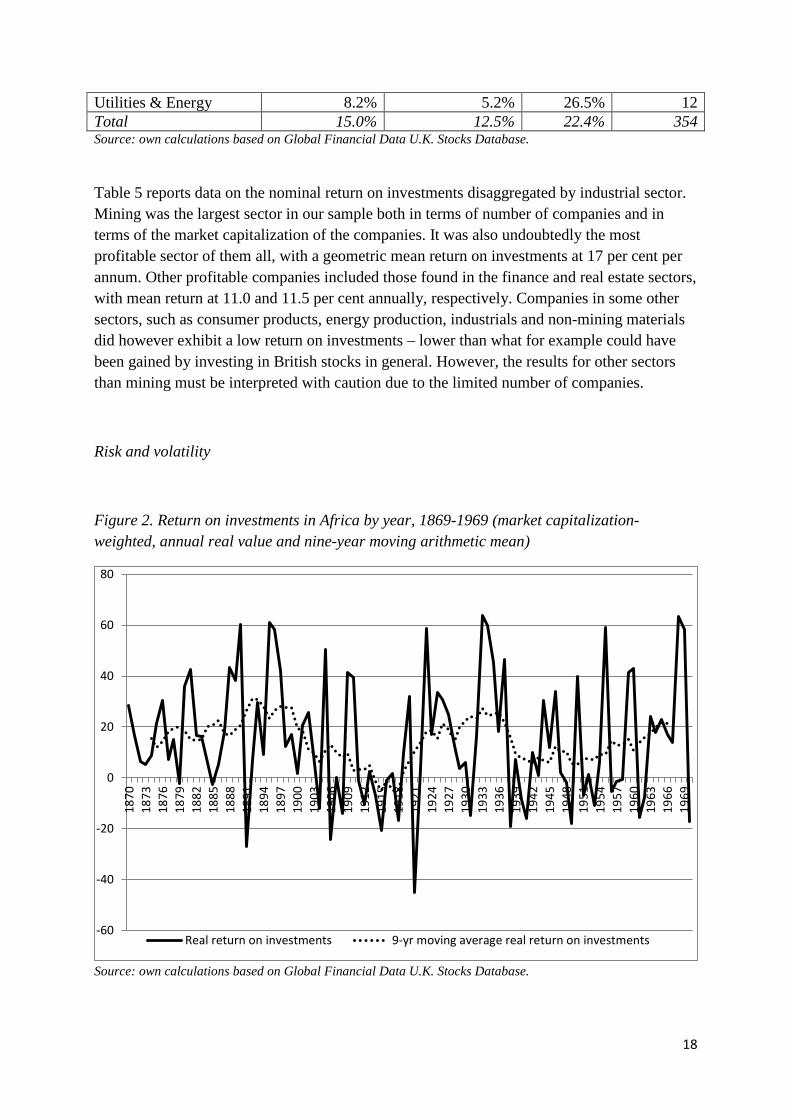
Table 5 reports data on the nominal return on investments disaggregated by industrial sector. Mining was the largest sector in our sample both in terms of number of companies and in terms of the market capitalization of the companies. It was also undoubtedly the most profitable sector of them all, with a geometric mean return on investments at 17 per cent per annum. Other profitable companies included those found in the finance and real estate sectors, with mean return at 11.0 and 11.5 per cent annually, respectively. Companies in some other sectors, such as consumer products, energy production, industrials and non-mining materials did however exhibit a low return on investments – lower than what for example could have been gained by investing in British stocks in general. However, the results for other sectors than mining must be interpreted with caution due to the limited number of companies.
Risk and volatility
Figure 2. Return on investments in Africa by year, 1869-1969 (market capitalization-weighted, annual real value and nine-year moving arithmetic mean)
Source: own calculations based on Global Financial Data U.K. Stocks Database.
-60
-40
-20
0
20
40
60
80
1870
1873
1876
1879
1882
1885
1888
1891
1894
1897
1900
1903
1906
1909
1912
1915
1918
1921
1924
1927
1930
1933
1936
1939
1942
1945
1948
1951
1954
1957
1960
1963
1966
1969
Real return on investments 9-yr moving average real return on investments
18

Figure 2 shows the annual market capitalization-weighted real return on investments in Africa. The figure also includes the nine-year moving average arithmetic mean real return (arithmetic mean since we in this case are interested in studying the volatility of the return on investments). As can be seen in the graph, the volatility of the weighted index is considerable. The market capitalization-weighted real return on investments could in some individual years exceed 60 per cent. In other years, there are substantial capital losses, of up to more than 40 per cent of the capital value, as a consequence of falling stock prices. This is particularly the case during the first decades of the twentieth century, which exhibited a number of years of negative return on investments. This largely seems to be attributable to the end of a temporary boom on the stock markets following the Scramble for Africa as well as the gold- and diamond rushes in South Africa. In the wake of these events, a number of investors also scrambled to Africa in the hope of making profits. Many of these investments would however turn out to be unprofitable, which became obvious primarily during the first decades of the twentieth century. One specific year, 1920, also exhibited particularly substantial negative return on investments. The year exhibited a comparatively high rate of inflation, at the same time as the stock-price of several of the most important companies all fell: the capital value decreased for all the six largest companies (together constituting around half of the market capitalization in this year), including a decrease of almost 60 per cent in the value of the stock for the single largest company, DeBeers Consolidated Mining Co.
Total return on investments in comparative perspective
Table 6 compares the estimates from our sample with the results from previous research. The table should be interpreted row by row: each row shows results from our sample of companies, compared to the result(s) from previous research. For comparative purposes, the periodization and use of deflated or undeflated data varies between the rows, as these practices have varied in the previous research.
Table 6. Total return on investments in Africa in comparative perspective, per annum, various periods 1879-1969 (geometric mean)
Time-period
Nom
inal
/ re
al re
turn
Brit
ish
inve
stm
ents
in
Afr
ica
(o
wn
estim
ates
)
Brit
ish
inve
stm
ents
in
Afr
ica
(G
ross
man
)
Uni
ted
KIn
gdom
(G
ross
man
)
All
equi
ties
(Gro
ssm
an
Sout
h A
fric
a
(Dim
son
et a
l)
Uni
ted
Kin
gdom
(D
imso
n et
al)
”Wor
ld”
(D
imso
n et
al)
/)
Bel
gian
Con
go
(Bue
lens
& M
arys
se)
1879-1928
Nominal return*
14.3% 12.4% 6.6% 6.8%
1889-1960
Real return
10.6% 2.2%**
1900-1969
Real return
10.0% 7.2% 5.0% 5.5%
19

Source: British African stocks, own calculations based on Global Financial Data U.K. Stocks Database, real rate of return on investments calculated using British inflation rate from (O’Donoghue, Goulding, and Allen 2004); data from other countries from (Dimson, Marsh, and Staunton 2002, tables 28-2, 32-2 & 34-2; Buelens and Marysse 2009, table 2; Grossman 2015, table A1, A7-A8). * Grossman only reports data on the arithmetic mean return on investments. Geometric mean return on the investments has here been calculated based on the annual figures reported by Grossman in tables A1, A7 and A8. ** Buelens and Marysse also reports the figures for the period 1889-1955. The total real return is then estimated to 4.69%. The difference being explained by country risks being realized during the political unrest leading up to the declaration of independence 1960.
As can be seen in table 6, our estimates suggest that the return that investors on the London Stock Exchange received on their investments in Africa was considerably higher than the return on investments received elsewhere in the world. The figures are also higher than previous estimates of return on investments in Africa. The real return on investments was for example considerably higher than the ones estimated by Buelens and Marysse for the case of Belgian Congo – regardless if we include the process of independence or not. They are also somewhat higher than Dimson et al’s previous estimates of the return on investments in South Africa. They are however only slightly higher than, but of the same magnitude as, the estimates from the most recent study by Richard Grossman.
On an annual basis, our estimates match the ones reported by Grossman quite well, with the exception of some particular years. The differences do however mainly seem to be attributable to the different methods of weighting the estimates: our estimates are weighted by the market capitalization of each company each month, whereas Grossman only uses annual weights (based on the companies’ market capitalization in January). If we re-calculate our data using annual weights only, our estimates are lowered to be more or less on par with Grossman’s (data not shown). Dimson et al do not report their estimates on an annual level, but only by decade, and we have been unable to access the data underlying their study. We are therefore unable to determine exactly wherein the difference lies. If we aggregate our data by decade in the same way as they have done, our estimates are quite consistently somewhat higher than theirs, but the development over time follows the same pattern. The main exception to this is the 1910s (when our estimates indicate a negative return on investments whereas Dimson et al’s data indicate a positive but very low figure). This difference might be attributable to differences in the samples: for the 1910s, Dimson et al base their sample only the largest mining and finance companies in South Africa traded on the London Stock Exchange. In this period, however, many of the smaller companies (many of them not included in Dimson et al’s sample), often started during the mining boom of the 1890s, experienced considerable losses.
Discussion
The City of London was the leading financial center in the late 19th and early 20th century and it played an important role in the expansion and maintenance of the British Empire. Not only did it channel financial resources to private colonial ventures, it also functioned as an
20

important node for transmitting organizational and technical expertise to firms like exploration companies and investment groups, which were active around the globe at this time. While railways had been the primary target of capital export and speculation up to the 1890s, mining companies experienced several booms and busts around the turn of the century which partially shifted the investors’ focus. It was especially the rich gold and diamond deposits found in South Africa which stirred the imagination of the investors at the London Stock Exchange.
Our paper sets out to explore this relationship between financial markets and imperialism. We do this by focusing on the return those companies active in Africa, but listed in London, delivered to its investors. More specifically we estimate the level of return, its changes over time and its distribution among different geographies and economic sectors.
Our estimates of British investments in Sub-Saharan Africa in contrast indicate a consistently high level of total return on investment in colonial ventures in Sub-Saharan Africa even when the relatively high level of risk is taking into account. We do on the other hand not find any strong evidence in favour of convergence of the return on investments between Africa and United Kingdom. All regions of Africa exhibited a substantial premium on the return on investments compared to investing domestically in Britain. For investors willing to take the chance of investing in Africa, the colonies thus provided considerably higher return on investments than domestic investments.
This high estimated return on investments can hardly be attributed only to a risk premium for investing in Africa. If measured by the geometric mean of the annual return on investments, the highest return on investments was to be found on investments in South Africa. South Africa also exhibited the lowest risk of all regions of Sub-Saharan Africa, if measured by the standard deviation of the annual return on investments. Investments in many other parts of Africa were from this perspective substantially more risky, since the return on investments exhibited considerably more volatility over time.
A natural point of comparison when it comes to the return on investment in Sub-Saharan Africa is Buelens & Marysse (Buelens and Marysse 2009). In their study of Belgian Congo they argue that return on investments in Belgian Congo also was high, when compared to domestic investments in Belgium – at least until country risk became a reality in Belgian Congo in the late 1950s. When put in an international comparative perspective, however, their estimated return on investments is actually quite on par with or slightly lower than what could be expected. Buelens and Marysse’s figures are furthermore highly sensitive to what time periods are chosen. The estimated mean return on investments is almost twice as high for the period 1889-1955 as for the period 1889-1960. The final years of colonialism thus exhibited severe losses for investments in Belgian Congo. In our case, investments in South Africa play a major role for the aggregate estimates, but it is harder to date any period of decolonization in the same way as can be done for many other African countries. For investments in other countries in Africa, our results change somewhat if we delimit the period of our study to a slightly earlier date, prior to decolonization: the estimated return on investments increase slightly for all regions studied (both arithmetic and geometric means, data not shown). The
21

difference is however at most a few percentage points, and not as substantial as the difference Buelens and Marysse find in their case. This difference sheds further light on the different socio-economic impact the process of decolonization could have in various countries.
Buelens and Marysse highlight the role of colonial institutions which they believe can have influenced the return on investments positively: the appropriation and re-distribution of land rights, subsidized infrastructural investments and subsistence-level wages which persisted over time. In line with Casson and Da Silva, Buelens and Marysse also highlight the wider role of the financial sector. Belgian universal banks not only channeled financial resources to Congo, but also technical know-how and organizational skills which proved important in companies’ transition to large-scale enterprises during the first decades of the 20th century. The similarities with our data are striking and these factors most likely played a part also to explain our high levels of return in investment. As we have demonstrated in this paper, however, not all sectors were doing particularly well. We find that the high levels of return on investments in Africa were driven first and foremost by the mining sector, primarily in South Africa. The world’s hunger for metals during the time period studied must be considered a strong driving force for the expansion of the mining sector. Far from all of the new mines in Sub-Saharan Africa were profitable, but sufficiently many were so that the average return on investment in mining was high compared to other sectors. In the case of South Africa in particular this was illustrated by the exceptional growth of the gold and diamond mining from the late 19th century and onwards. But because of this growth the aggregate average return on investment is also partially misleading: the return on investments in many other sectors were far from impressive, especially if the investors also would have required a risk premium for investing in Africa in the first place. To that extent, our results fit well the results from the recent research by Richard Grossman (Grossman 2015), who argues that high levels of return on investments were associated with natural resource extraction in various places around the world.
It is however not easy, or perhaps even possible, to separate the natural resource endowment from the type of institutions put in place during colonial times (see for example Acemoglu and Robinson 2012; Engerman and Sokoloff 2012). It is on the other hand also too simplified to argue that colonialism per se rendered the high return on investments. Colonial policies might have enabled European investments in rich mines, which otherwise would perhaps not have occurred, or at least would have been severely delayed. The appropriation and re-distribution of land rights might also have made sure that the return on investments profited the European investors, rather than local landholders in the colonies, and/or kept the cost of acquiring land down. Colonial policy-makers most certainly furthermore improved the profitability of many of the mining companies in particular, by imposing various forms of coercive labor practices, and by limiting the outside options of the workers, both driving down the wage costs for the companies (see for example Feinstein 2005, 109–12). As has been shown in this paper, however, colonial policies were unable to improve the return on investments across all sectors and countries to a similar degree. These results thus show the need for a nuanced analysis of how various colonial policies impacted upon the return on investments for the imperial investors. We therefore believe a fruitful path for future research
22

might be to combine quantitative methodologies of estimating the return on investments, with more detailed studies of business history of specific sectors or companies, including in-depth analyses of the colonial institutional setting that these businesses were operating in.
Conclusion
There has been a controversy in the previous literature on whether or not return on foreign investments (foreign investments in general and/or colonial investments in particular) was higher than the return on domestic investments in Britain. Some older research has then argued that the return on foreign and/or colonial investments was consistently higher than return on domestic investments (see for example Edelstein 1982; Svedberg 1982), whereas others claim no substantial difference in return on investments (see for example Frankel 1967; Davis and Huttenback 1986). This older literature did however often suffer from a number of methodological problems. More recent research in the field (Dimson, Marsh, and Staunton 2002; Buelens and Marysse 2009; Grossman 2015) have either only studied some particular country in Africa (South Africa or Belgian Congo), or have had a comparatively short time-frame.
In this paper, we have therefore studied the return on investments for British investors investing in Sub-Saharan Africa 1869-1969. Our results show that over the very long run, return on these investments were very high indeed, an average real return of 12.5 per cent per annum. In comparative perspective, the return was substantially higher than the return on investments either in Britain, or elsewhere in the world, at the same time. Return was the highest during two periods in particular: during the last decades of the nineteenth century (i.e. to a large extent during the “Scramble for Africa”) and also during the interwar period. The latter issue has been completely missed in most previous research on the profitability of imperialism, for the simple reason that many scholars have delimited their period of study to the period prior to the First World War.
As a rule, the investments in South Africa were the most profitable. The return on investments in South Africa did at the same time exhibit the lowest degree of volatility of all regions studied in Sub-Saharan Africa. Return on investments in some other parts of Africa, such as for example investments in East or West Africa were on average certainly profitable, but on an aggregate level not more profitable than investments elsewhere in the world around the same time. The high return on the South African investments (as well as the comparatively high return on investments elsewhere in Southern Africa, such as in modern-day Zambia and Zimbabwe) were certainly due to the rich mineral findings there. The mining industry was outstanding in the return to investments, with an average real return of 15.5 per cent per annum. This fits well with previous research by Richard Grossman, also showing high return on investments in natural resource extraction, and could thus be interpreted as support for O’Rourke and Williamson’s hypothesis of high capital requirements (and higher return) associated with frontier expansion.
23

The high return on investments in Africa must partly also be explained by higher (country and/or sectoral) risk – the standard deviation of the annual return on investments was for example higher in our estimate than what has been estimated on for example domestic investments in Britain at the same time. In the case of Belgian Congo, studied by Buelens and Marysse, the country risk of investing in Congo would come to be realized during the period of decolonization, when many Belgian investors experienced substantial capital losses. In their study, they therefore find quite low return on investments if estimated over the whole colonial period (including the last years of colonial rule).
In hindsight, taking the risk of investing in Africa would in contrast turn out to have been a very good affair in the case of the British investments on the continent. While there might have been some capital losses during the process of decolonization of British colonies in Africa, they were not able to outweigh the high return from South African investments. From that perspective, there were indeed “super-profits” to be made from investing in Africa, for the risk-taking investors.
References
Acemoglu, Daron, and James A. Robinson. 2012. Why Nations Fail : The Origins of Power, Prosperity and Poverty. New York: Crown Publishers.
Acheson, Graeme G., Charles R. Hickson, John D. Turner, and Qing Ye. 2009. ‘Rule Britannia! British Stock Market Returns, 1825-1870’. The Journal of Economic History 69 (4): 1107–1137.
Annaert, Jan, Frans Buelens, and Marc JK De Ceuster. 2012. ‘New Belgian Stock Market Returns: 1832–1914’. Explorations in Economic History 49 (2): 189–204.
Bodie, Zvi, and Robert C. Merton. 1999. Finance. Hemel Hempstead: Prentice Hall. Buelens, Frans, and Stefaan Marysse. 2009. ‘Returns on Investments during the Colonial Era: The
Case of the Belgian Congo’. The Economic History Review 62 (August): 135–66. doi:10.1111/j.1468-0289.2009.00482.x.
Burt, Roger. 1998. ‘Segmented Capital Markets and Patterns of Investment in Late Victorian Britain: Evidence from the Non-Ferrous Mining Industry’. The Economic History Review 51 (4): 709–733.
Cain, P. J. 1980. Economic Foundations of British Overseas Expansion 1815-1914. Studies in Economic and Social History (1974), 99-0108749-X. London: Macmillan.
———. 2002. ‘Hobson and Imperialism: Radicalism, New Liberalism, and Finance 1887-1938’. OUP Catalogue. https://ideas.repec.org/b/oxp/obooks/9780198203902.html.
Cain, P. J., and A. G. Hopkins. 1980. ‘The Political Economy of British Expansion Overseas, 1750–1914’. The Economic History Review 33 (4): 463–90. doi:10.1111/j.1468-0289.1980.tb01171.x.
———. 1987. ‘Gentlemanly Capitalism and British Expansion Overseas II: New Imperialism, 1850-1945’. The Economic History Review 40 (1): 1–26. doi:10.1111/j.1468-0289.1987.tb00417.x.
———. 2001. British Imperialism, 1688-2000. Harlow: Longman. Cassis, Youssef. 2010. Capitals of Capital : The Rise and Fall of International Financial Centres, 1780-
2009. Cambridge: Cambridge University Press. Casson, Mark, and Teresa da Silva Lopes. 2013. ‘Foreign Direct Investment in High-Risk Environments:
An Historical Perspective’. Business History 55 (3): 375–404. Chabot, Benjamin R., and Christopher J. Kurz. 2010. ‘That’s Where the Money Was: Foreign Bias and
English Investment Abroad, 1866–1907’. The Economic Journal 120 (547): 1056–1079.
24

Chapman, S. D. 1985. ‘British-Based Investment Groups Before 1914’. The Economic History Review 38 (2): 230–47. doi:10.1111/j.1468-0289.1985.tb00368.x.
Chapman, Stanley. 1988. ‘Venture Capital and Financial Organisation: London and South Africa in the Nineteenth Century.’ In Banking and Business in South Africa. Editor Stuart Jones. Springer.
Chilvers, Hedley A. 1939. The Story of De Beers: With Some Notes on the Company’s Financial, Farming, Railway and Industrial Activities in Africa and Some Introductory Chaoters on the River Diggings and Early Kimberley. Presented to Queen Mary by the Chairman & Directors of De Beers.
Cunningham, Simon. 1981. The Copper Industry in Zambia : Foreign Mining Companies in a Developing Country. New York: Praeger.
Davenport-Hines, R. P. T., and Jean-Jacques Van Helten. 1986. ‘Edgar Vincent, Viscount D’Abernon, and the Eastern Investment Company in London, Constantinople and Johannesburg’. Business History 28 (1): 35–61.
Davis, Lance, and Robert Huttenback. 1986. Mammon and the Pursuit of Empire : The Political Economy of British Imperialism, 1860-1912. Cambridge: Cambridge University Press.
Davis, Lance, and Robert A. Huttenback. 1982. ‘The Political Economy of British Imperialism: Measures of Benefits and Support’. The Journal of Economic History 42 (1): 119–130. doi:10.1017/S0022050700026966.
———. 1985. ‘The Export of British Finance, 1865–1914’. The Journal of Imperial and Commonwealth History 13 (3): 28–76.
Dilley, Andrew Richard. 2012. Finance, Politics, and Imperialism : Australia, Canada, and the City of London, c.1896-1914. Houndmills, Basingstoke, Hampshire ; Palgrave Macmillan.
Dimson, Elroy, Paul Marsh, and Mike Staunton. 2002. Triumph of the Optimists : 101 Years of Global Investment Returns. Princeton, N. J.: Princeton University Press.
———. 2016. Credit Suisse Global Investment Returns Sourcebook 2016. Credit Suisse Research Institute.
Dumett, Raymond E. 2009a. ‘Edwin Cade and Frederick Gordon: British Imperialism and the Foundations of the Ashanti Goldfields Corporation, West Africa’. In Mining Tycoons in the Age of Empire, 1870-1945: Entrepreneurship, High Finance, Politics and Territorial Expansion / Edited by Raymond Dumett, 63–84. Farnham: Ashgate.
Dumett, Raymond E. 2009b. Mining Tycoons in the Age of Empire, 1870-1945 : Entrepreneurship, High Finance, Politics and Territorial Expansion. Farnham: Ashgate.
Edelstein, Michael. 1976. ‘Realized Rates of Return on UK Home and Overseas Portfolio Investment in the Age of High Imperialism’. Explorations in Economic History 13 (3): 283–329.
———. 1982. Overseas Investment in the Age of High Imperialism : The United Kingdom, 1850-1914. London: Methuen.
———. 1994. ‘Foreign Investment and Accumulation, 1860–1914’. The Economic History of Britain since 1700: 173–96.
Eitrheim, Øyvind, Jan T. Klovland, and Jan F. Qvigstad. 2004. Historical Monetary Statistics for Norway 1819-2003. Vol. 35. Oslo: Norges bank.
Engerman, Stanley L., and Kenneth L. Sokoloff. 2012. Economic Development in the Americas since 1500 : Endowments and Institutions. Cambridge ; Cambridge University Press.
Esteves, Rui. 2011. ‘The Belle Epoque of International Finance: French Capital Exports, 1880-1914’. Available at SSRN 2024984. http://papers.ssrn.com/sol3/papers.cfm?abstract_id=2024984.
Feinstein, Charles. 1990. ‘Britain’s Overseas Investments in 1913’. Economic History Review, 288–295.
———. 2005. An Economic History of South Africa : Conquest, Discrimination and Development. Cambridge: Cambridge University Press.
Fieldhouse, David K. 1961. ‘“Imperialism”: An Historiographical Revision’. The Economic History Review 14 (2): 187–209.
Firer, C., and H. McLeod. 1999. ‘Equities, Bonds, Cash and Inflation: Historical Performance in South Africa 1925 to 1998’. Investment Analysts Journal 28 (50): 7–28.
25
Frankel, S. Herbert. 1967. Investment and the Return to Equity to Capital in the South African Gold Mining Industry 1887-1965 : An International Comparison. Oxford: Basil Blackwell.
Goetzmann, William N., Roger G. Ibbotson, and Liang Peng. 2001. ‘A New Historical Database for the NYSE 1815 to 1925: Performance and Predictability’. Journal of Financial Markets 4 (1): 1–32.
Grossman, Richard S. 2002. ‘New Indices of British Equity Prices, 1870–1913’. The Journal of Economic History 62 (1): 121–146.
———. 2015. ‘Bloody Foreigners! Overseas Equity on the London Stock Exchange, 1869–1929’. The Economic History Review 68 (2): 471–521.
Harvey, Charles, and Jon Press. 1990. ‘The City and International Mining, 1870–1914’. Business History 32 (3): 98–119.
Hillbom, Ellen, and Erik Green. 2010. Afrika : En Kontinents Ekonomiska Och Sociala Historia. Stockholm: SNS förlag.
Hobson, John Atkinson. 1988. Imperialism : A Study. London: Unwin Hyman. Hopkins, Antony G. 1973. An Economic History of West Africa. London: Longman. ———. 1988. ‘Accounting for the British Empire’. The Journal of Imperial and Commonwealth History
16 (2): 234–247. Indro, Daniel C., and Wayne Y. Lee. 1997. ‘Biases in Arithmetic and Geometric Averages as Estimates
of Long-Run Expected Returns and Risk Premia’. Financial Management, 81–90. Jacquier, Eric, Alex Kane, and Alan J. Marcus. 2003. ‘Geometric or Arithmetic Mean: A
Reconsideration’. Financial Analysts Journal 59 (6): 46–53. Jones, Stuart. 1988. Banking and Business in South Africa. Springer.
http://link.springer.com/content/pdf/10.1007/978-1-349-09632-9.pdf. Katzenellenbogen, Simon. 1973. Railways and the Copper Mines of Katanga. Oxford: Clarendon
press. ———. 1975. ‘The Miner’s Frontier, Transport and General Economic Development’. In Colonialism in
Africa, 1870-1960: The Economics of Colonialism, Edited by P. Duignan and LH Gann, 4:360–426.
———. 1990. ‘Southern African Mining Interests in Australia Before 1939’. Business History 32 (3): 120–132.
Kemp, Tom. 1967. Theories of Imperialism. London: Dobson. Kubicek, Robert. 1975. ‘Finance Capital and South African Goldmining 1886–1914’. The Journal of
Imperial and Commonwealth History 3 (3): 386–395. ———. 1979. Economic Imperialism in Theory and Practice. Duke University Center for International
Studies Publication, 99-0579313-5 ; 45. Durham, N.C. Michie, Ranald C. 2001. The London Stock Exchange : A History. Oxford: Oxford University Press. ———. 2006. The Global Securities Market a History. Oxford: Oxford University Press. Mindlin, Dimitry. 2011. ‘On the Relationship between Arithmetic and Geometric Returns’. Available
at SSRN 2083915. http://papers.ssrn.com/sol3/papers.cfm?abstract_id=2083915. Mollan, S. M. 2009. ‘Business Failure, Capital Investment and Information: Mining Companies in the
Anglo-Egyptian Sudan, 1900–13’. The Journal of Imperial and Commonwealth History 37 (2): 229–248.
Munro, J. Forbes. 1981. ‘Monopolists and Speculators: British Investment in West African Rubber, 1905–1914’. The Journal of African History 22 (2): 263–278.
———. 1983. ‘British Rubber Companies in East Africa before the First World War’. The Journal of African History 24 (3): 369–379.
———. 1984. Britain in Tropical Africa, 1880-1960 : Economic Relationships and Impact. Studies in Economic and Social History. London: Macmillan.
Newbury, Cecil. 2009. ‘Cecil Rhodes, De Beers and Mining Finance in South Africa: The Business of Entrepreneurship and Imperialism’. In Mining Tycoons in the Age of Empire, 1870-1945: Entrepreneurship, High Finance, Politics and Territorial Expansion / Edited by Raymond Dumett, 85–108. Farnham: Ashgate.
26

O’Donoghue, Jim, Louise Goulding, and Grahame Allen. 2004. ‘Consumer Price Inflation Since 1750’. Economic Trends No. 604.
Oneal, John R., and Frances H. Oneal. 1988. ‘Hegemony, Imperialism, and the Profitability of Foreign Investments’. International Organization 42 (2): 347–373.
O’Rourke, Kevin H., and Jeffrey G. Williamson. 1999. Globalization and History: The Evolution of a Nineteenth-Century Atlantic Economy. Mit Press.
Phillips, John. 2009. ‘Alfred Chester Beatty: Mining Engineer, Financier, and Entrepreneur, 1898-1950’. In Mining Tycoons in the Age of Empire, 1870-1945: Entrepreneurship, High Finance, Politics and Territorial Expansion / Edited by Raymond Dumett, 215–38. Ashgate.
Platt, Desmond Christopher Martin. 1980. ‘British Portfolio Investment Overseas before 1870: Some Doubts’. The Economic History Review 33 (1): 1–16.
Porter, Andrew. 1988. ‘The Balance Sheet of Empire, 1850–1914’. The Historical Journal 31 (3): 685–699.
Porter, Bernard. 1968. Critics of Empire: British Radical Attitudes to Colonialism in Africa 1895-1914. London; Melbourne [etc.]: Macmillan; New York: St. Martin’s P.
Segal, Harvey H., and Matthew Simon. 1961. ‘British Foreign Capital Issues, 1865–1894’. The Journal of Economic History 21 (4): 566–581.
Svedberg, Peter. 1982. ‘The Profitability of UK Foreign Direct Investment under Colonialism’. Journal of Development Economics 11 (3): 273–286.
Taylor, Ayowa Afrifa. 2006. ‘An Economic History of the Ashanti Goldfields Corporation, 1895-2004: Land, Labour, Capital and Enterprise’. London School of Economics and Political Science. http://core.ac.uk/download/pdf/4187526.pdf.
Tignor, Robert L. 2007. ‘The Business Firm in Africa’. Business History Review 81: 87–110. Turrell, Robert Vicat, and Jean-Jacques Van Helten. 1986. ‘The Rothschilds, the Exploration Company
and Mining Finance’. Business History 28 (2): 181–205. Twomey, Michael J. 2000. A Century of Foreign Investment in the Third World. Routledge Studies in
International Business and the World Economy, 1359-7930 ; 20. London: Routledge. Waldenström, Daniel. 2014. ‘Swedish Stock and Bond Returns, 1856–2012’. Department of
Economics Working Paper 2014:5. Uppsala. Wilkins, Mira. 1988. ‘The Free-Standing Company, 1870-1914: An Important Type of British Foreign
Direct Investment’. The Economic History Review 41 (2): 259–282. Wolff, Richard D. 1974. The Economics of Colonialism : Britain and Kenya, 1870-1930. Yale Series in
Economic History, 99-0163573-X. New Haven: Yale Univ. Press.
27