impedance spectroscopy of dielectrics and...
TRANSCRIPT

Characterization of Materials, edited by Elton N. Kaufmann.Copyright � 2012 John Wiley & Sons, Inc.
IMPEDANCE SPECTROSCOPYOF DIELECTRICS AND ELECTRONICCONDUCTORS
NIKOLAOS BONANOS,1 POLYCARPOS PISSIS,2
AND J. ROSS MACDONALD3
1Fuel Cells and Solid State Chemistry Division, Risø NationalLaboratory for Sustainable Energy, Technical Universityof Denmark, Roskilde, Denmark2Department of Physics, National Technical Universityof Athens, Zografou Campus, Athens, Greece3Department of Physics and Astronomy, University of NorthCarolina, Chapel Hill, NC, USA
INTRODUCTION
Impedance spectroscopy (IS) is the measurement ofelectrical impedance, admittance, or some otherclosely related quantity as a function of frequency. Itis used to resolve processes of electrical polarizationaccording to their relaxation frequencies or time con-stants. The technique can be used to characterize ionicor electronic conductors as well as dielectric materials.It is commonly applied to electroceramics, solid elec-trolytes, dielectrics, including polymers and glasses,and to integrated energy conversion devices suchas batteries and fuel cells. In electrochemistry, IS isone of the main techniques for the investigation ofelectrode processes and, in this context, it is oftenreferred to as ELECTROCHEMICAL IMPEDANCE SPECTROSCOPY
(EIS) (Barsoukov and Macdonald, 2012). In the phys-ics of solid-state devices, admittance spectroscopy issometimes used to describe the technique, while indielectrics, dielectric spectroscopy is often preferred.Immittance spectroscopy has been used to describeall the above. For the authors, impedance spectroscopyis used to describe all variants of the technique. Thetheory and practice of IS have been covered in twomonographs (Barsoukov and Macdonald, 2005;Orazem and Tribollet, 2008) and reviews, for example,Hodge et al. (1975), Irvine et al. (1990).
The processes that can be resolved by IS vary accord-ing to the type of material being investigated. In poly-crystalline solids, polarizations arise as a result of thelower electrical conductivity of the grain boundaries, ascompared to the grain interiors. The lower conductivitymaybedue to space charges, the segregation of dopants,or the presence of second phases at the grain bound-aries. IS has contributed greatly to the understandingof ceramics for electrochemical devices such as solidoxide fuel cells. In electroceramics, the nonlinearcurrent–voltage characteristics of varistors and positivetemperature coefficient of resistance (PTCR) materialsare determined by the grain boundaries. Furthermore,wherever there are interfaces between ionic and elec-tronic conductors, electrochemical effects arise, such asdouble layer capacitance and Faradic resistance, invari-ably with relaxation frequencies below those of the
grains and grain boundaries. IS analysis for materialsinvolving electronic conduction is important for helpingto characterize and optimize solid solar cells (Fabregat-Santiago et al., 2011) and for other solid materialssuch as CaCu3Ti4O12 (Krohns et al., 2007; Macdonaldet al., 2011).
The use of IS to characterize ceramics is a relativelyrecent development, effectively beginning with the sem-inal work of Bauerle (1969). In dielectrics, frequencyresolved techniques were applied much earlier: with thework of Debye (1929), relaxation processes were wellunderstood and the work of Von Hippel (1954) furtheradvanced this understanding.
The main competitors to IS are step response, ortransient techniques. A step of voltage or current isapplied and the response (e.g., voltage) is sampledfor a given time. Since the normal IS experiment cansample time constants varying by a factor of 106 ormorein frequency, the corresponding transient experimentmust use sampling frequencies in a similar range. Sinceit is impractical to collect data at a rate of one sampleevery <10�6 s for, say 100s, the data collection canbe made at progressively decreasing sampling rates.When the data collection is complete, a Fourier trans-form is applied to the voltage and current signals totransform them to the frequency domain, and then theyare divided to obtain the impedance. This approachoffers fast data collection, especially important for sys-tems of limited stability, but places rather highdemandson data sampling. Further, in the current transient, theenergy of the signal is spread over a wide range ofharmonics,while inaconventional impedancespectrumit is concentrated in one frequency at any time. This iswhat allows impedance analyzer systems to achieve ahigh signal-to-noise ratio at relatively low cost.
Another technique that may be considered a compe-titor to IS is that of thermally stimulated depolarizationcurrents (TSDC) (Bucci et al., 1966; Hong and Day,1979). In this approach, polarized samples are exposedto a linear heating rate, and the results can be used toresolve relaxations in the temperature domain withexcellent resolution. The technique works for materialssuch as polymers and glasses over quite wide tempera-ture ranges, but it lacks the generality of IS. Further-more, although the theory is well understood, thecomputational tools available for interpreting resultsobtained by this technique are not as advanced as thoseavailable for IS.
This article aims to provide an introduction to imped-ance techniques in the field of electroceramics anddielectrics.
PRINCIPLES OF THE METHOD
Theprinciple of the impedance spectroscopy experimentis to apply a sinusoidal electrical stimulus (either voltageor current) toasampleandobserve the response (respec-tively current or voltage). In the case of an appliedvoltage, the applied signal can be described by

V ¼ V0j j � ej ot ð1Þ
which may be rewritten using Euler’s formula:
V ¼ V0j j � cos ðotÞþ j sin ðotÞf g ð1aÞ
For the simple case of a parallel resistor, R, and capac-itor, C, the current is
I ¼ V
RþC
@V
@tð2Þ
And treating both current and voltage as complex num-bers, the admittance, Y, is given by the ratio:
Y ¼ I
V¼ 1
Rþ j oC ð3Þ
Realmaterialswill, in general, displaymore complicatedresponse than this, with contributions from transport ofelectrons through the electronic conductors, the polar-ization of dipoles and multipoles in the sample, and themigration of ions and point defects (interstitials andatomic vacancies) in response to the electric field. Themovement of the charge carriers depends on the resis-tance, and the charge storage on the capacitance of thesample.
It is normally expected that the system under studyresponds linearly to the applied stimulus, and thatall relevant properties of the system are invariantwithin the timeframe of the experiment. In general,the measured properties will depend on such control-lable variables as the temperature, atmosphere (e.g.,oxygen or hydrogen partial pressure), and on theapplied voltage bias.
Data Analysis, Elements, and Codes
The data resulting from such a measurement (usually alist of f, Zre, Zim) are analyzed using a complex nonlinearleast squares (CNLS) fitting code, to determine the para-meters of a circuit equivalent. Examples of such codesare LEVM written by one of the present authors (Macdo-nald and Potter, 1987; Macdonald, 2000a) and the firstand most comprehensive one (see LEVMW, web infor-mation), EQC written by B. A. Boukamp, ZView fromScribner Associates Inc., ZSimpWin from EChemSoftware, and MEISP from Kumho Chemical Laborato-ries. Each of these codes has its own strengths, andthe new user is advised to test the codes, if possible,before committing to one of them. The codes allow acircuit to be built from elements R, C, L, and Q, theconstant phase element (see below), as well as severalother elements of relevance mainly to electrochemistry.One of the earliest applications of CNLS fitting ofdielectric data for liquids appears in Macdonald (1995).The constant phase element (CPE) (Barsoukov andMacdonald, 2005; Macdonald, 1984) deserves specialmention. In most software, it is defined by Equation 4
YQ ¼ Y0 joð Þn ð4Þ
where o is the angular frequency (o�2p f ), and 0�n �1. According to this definition, YQ has the rather cum-bersome units of S � sn.
The element often occurs in parallel combinationwitha resistor, inwhich case it canbe referred to as aZARCorZC element (Macdonald, 2000b). The impedance of thiselement can be expressed by Equation 5
Z ¼ Z0
1þRY0 joð Þn ð5Þ
Since the ZARC is not equivalent to a parallel (RC)combination (except in the special case of n¼1), theparallel capacitance of the ZARC is not constant withfrequency. However, a quantity with units of capaci-tance, Cqe, can be derived via Equation 6 (Macdo-nald, 1984; Hsu and Mansfeld, 2001).
Cqe ¼ RY0ð Þ1
n
Rð6Þ
In an alternative definition of the CPE,
YQ ¼ j Y 00o
� �n ð7Þ
whereY 00 is analternativemeasureof theCPEandY 0
0 hasunits ofS1/n � s. This definition of theCPE is not availablein all impedance analysis codes. The two definitions ofthe CPE are examined by Jovic (2003) in relation toelectrochemical double layer capacitance. The CPE andits relation to other elements involving fractional fre-quency exponents are discussed by Barsoukov andMacdonald (2012). The usefulness of Equation 6 is thatit converts Y0 to a quasiequivalent capacitance andtherefore, has a physical significance. For example, itcan be related to the thickness of a polarized layer (bulk,grainboundary, or electrochemical double layer) and isabetter alternative than fitting the spectrum to a (RC)circuit.
PRACTICAL ASPECTS OF THE METHOD
Historical Background
Earlymeasurements of impedanceweremostly basedontheWheatstone bridge and its several variants, andweremade by switching among a set of resistance and capac-itance standards until an electrical balance wasobtained. The requirement to match the responses ofthe standards and the sample placed limitations in therange that could be achieved, especially when very largecapacitances were concerned. The transformer ratioarm bridge, introduced in the 1940s, eliminated thisproblem and provided great improvements in measure-ment stability and precision. As electronics advanced,crystal-controlled synthesizers provided stable mea-surement frequencies, while phase-sensitive detectorsmade the task of balancing the bridges much easier.By the 1970s instruments were available that could
2 IMPEDANCE SPECTROSCOPY OF DIELECTRICS AND ELECTRONIC CONDUCTORS

measure capacitance and resistancewith a resolution ofsix digits or more. These instruments, however, had alower limit of a few Hz, due to the difficulty of balancingwith such slowly varying signals. By the end of the1970s, digital gain-phase analyzers had lowered thislimit to the mHz range and, by the 1980s, digital imped-ance analyzers were able to extend this further to a fewmHz. As well as wider frequency ranges, these instru-ments provide increased measurement speed and dataacquisition via a computer interface.
When performing measurements on materials, theimpedance analyzer is only half of the equipmentneeded; the other half is the measurement rig, whichprovides connections to the sample and controls of thetemperature and atmosphere. The quality of the mea-surement will be limited by the part of the system thatperforms worst. For example, if the conductivity of asample is highly temperature dependent, inadequatetemperature control will invalidate the results, how-ever high the precision of the impedance analyzer.Equally, with a dielectric sample, failure to control thesample environment, for example, humidity, mayresult in significant errors in the dielectric constantor loss tangent.
Measurement Rigs
In contrast to measurement instruments, which arecommercially manufactured, measurement rigs for thedetermination of conductivity and dielectric constantare usually designed and built in-house; as a result,there are as many designs as there are designers andapplications. Two rigs are presented below, which coverdifferent needs depending on the required temperaturerange: a rig forusenearambient temperature, one for thetemperature range�100 to þ400�C in vacuum, and onefor high temperatures (200–1000�C) in controlledatmospheres.
Figure 1 shows an ambient temperature rig. It issimply constructed, based on an aluminum enclosure.The sample is contacted spring-loaded pins supportedon PTFE or nylon insulators and is connected to coaxialconnectors on the front. If the measurement instrumentallows a two-terminal connection, the rig can be fitteddirectly, otherwise coaxial cablesareused.The rig canbeused in the frequency range from dc to several MHz. Thelid is sealed by an o-ring, and gas connections can beattached to the two ends if required, to provide a con-trolled atmosphere, such as dry air. The stray capaci-tance of this cell is below 0.2pF.
Figure2showsa rig forhigh temperatureandvacuumoperation. It is based on a metal block with heating coil.The electrodes contacting the sample are made of steel.The assembly is housed in a vacuum vessel withelectrical feedthroughs. A copper rod, brought out viaa thin-walled steel tube, dips into a flask with liquidnitrogen to provide cooling. With a controller ofsuitable range, stable temperatures of �100 to 400�Ccan be achieved. If measurements below ambient tem-perature arenot required, the liquidnitrogen cooling canbe dispensedwith. A cell of this designwasused to study
two different ionic conductors (Lilley and Strutt, 1979;Bonanos and Lilley, 1981) andwas found to have a straycapacitance of under 0.5pF.
When temperatures of 1000�C and above, and con-trolled chemical environments, are required, rigs mustbe made of ceramics. Connections to the sample must
Figure1. Simple rigdesigned formeasurementsatambientandnear-ambient temperature. The sample is contacted by spring-loaded pins. Controlled temperatures of up to ca. 60�C can beachieved using an external resistor heater and thermocouple(not shown). Gas fittings can be added in order to purge the rigwith a dry atmosphere.
Figure 2. Rig for vacuum operation based on metal block withcoaxial heating coil. The electrodes contacting the sample aremadeofsteelspring.Withconductivecoolingviaacopperrod (notshown), stable temperatures of �100 to 400�C can be achieved.
IMPEDANCE SPECTROSCOPY OF DIELECTRICS AND ELECTRONIC CONDUCTORS 3

be made via precious metal wires, for example, plati-num, as common metals oxidize at suchhigh temperatures. The rig must be enclosed in a tubemade of ceramic or silica glass and placed in anelectrical tube furnace. A description of such a rig hasbeen given in an earlier publication (Barsoukov andMacdonald, 2005). p. 231.
Considerations of Frequency and Applied Voltage
The bulk response of electroceramics is normallylinear and, should bemeasuredusingwhatever appliedvoltage isnecessary for achievingagoodsignal-to-noiseratio. On the other hand, the grain boundaries of mate-rials may be nonlinear, as explained in the next sectionand, when investigating these, the applied voltage is asignificant experimental variable. In the authors’ expe-rience, the dielectrics literature often passes over thesubject of the applied voltage, implicitly assuming thatthe processes of interest are linear. This is generallycorrect, but there may be nonlinear processes of aparasitic type. This is illustrated in Figure 3a, whichshows the capacitance of a pure Al2O3 discmeasured at10kHz, at ambient temperature, in laboratory air. Ascan be seen, the capacitance exceeds the geometriccapacitance at low applied voltage. This is caused bya layer of adsorbed water providing protonic surfaceconduction and a double layer capacitance at the rimsof the electrodes. The situation can be described by acircuit equivalent (Ca(RbCb)), shown in the inert. Thevalidity of this circuit is demonstrated in Figure 3b, inwhich the excess capacitance vanishes at high frequen-cies. The above measurements were made in the cellshown in Figure 1.
Consequently, when investigating materials of lowconductivity, it is advisable to check for possible depen-dence of the measurements on applied voltageand frequency and to look out for evidence of surface
conduction. It is also essential to perform the measure-ments in/an environment of controlled humidity.
METHOD AUTOMATION
While, in the early days of impedance spectroscopy,component bridges were balanced manually and datawerewritten innotebooks, today any laboratory involvedin impedance spectroscopy will have a certain level ofautomation. In particular, the temperature and atmo-sphere of the measurement cell would be under com-puter control and measurements would invariably bestored digitally. Software for controlling impedanceanalysers is commercially available, but the need for thecomputer to communicate with different kinds of equip-ment means that many laboratories still prefer to usein-house written software.
DATA ANALYSIS AND INITIAL INTERPRETATION
Representations in the Complex Plane
Where several relaxation processes are present withdifferent characteristic frequencies, or time constants,they can be resolved in one of various representationsin the complex plane. Which one is most suitabledepends on whether the processes are envisaged assequential (e.g., serial connected) or parallel, and alsoon the relative magnitudes of the components respon-sible for the conduction and charge storage (normallyresistors and capacitors). The impedance spectrum isrecommended when processes are sequential and theircapacitances differ by orders of magnitude, while thecomplex capacitance spectrum is recommended whenthe processes occur in parallel, and the time constantsdiffer due to different resistive components.
Ca
Cb Rb
2
3 3
2
1
0103 104 105 106
1
00.01
(a) (b)
0.1 1 2
Vapp (V) f (Hz)
Cp
(pF
) at
10
kHz
Cp
(pF
) at
10
mV
Figure 3. Capacitance of Al2O3 disc at room temperature, in laboratory air, measured as afunction of (a) applied ac voltage at constant frequency and (b) measurement frequency atconstant voltage. Inset shows the proposed circuit equivalent.
4 IMPEDANCE SPECTROSCOPY OF DIELECTRICS AND ELECTRONIC CONDUCTORS

Applications in Electroceramics
In electroceramics, the electrical conductivity of thegrain boundary regions, sgb usually differs from thatof grain interiors sgi, and when this is the case, thepolarizations of the two regions appear as distinct fea-tures in the impedance spectrum. This can be explainedusing the so-called brick layer model (Beekmans andHeyne, 1976), which is in effect an extension of theBauerle (1969)model and treats the ceramic as an arrayof cubic grains, as illustrated in Figure 4a. The modelallows twopaths available to the current: through grainsand across grain boundaries or along grain boundaries(Fig. 4b). When sgb� sgi the current through the latterpath can be ignored and the impedance is the sum of theimpedances of the two regions weighted by their relativethickness. In this case, andneglectingpossible electrodeeffects, thematerial canbe treatedusing a circuit (RgiCgi)(RgbCgb) (Fig. 4c). In that case, several useful relationshold (Barsoukov and Macdonald, 2005). For the graininteriors, the conductivity, sgi, and dielectric constant,egi, can be obtained directly from the parameters of thecircuit equivalent:
sgi ¼ ‘
A
1
Rgið8Þ
e0gi ¼ ‘
A
Cgi
e0ð9Þ
where ‘ is the thickness,A the cross-sectional area of thesample, and e0 is the permittivity of free space(8.8542�10�16 F/m).
If the grain size of the ceramic, and the dielectricconstants of both regions, are known, the grain bound-ary thickness can be obtained from the ratio of thecapacitances.
d ¼ DCgi
Cgb
e0gbe0gi
ð10Þ
whereD is thegrainsize,d thegrainboundary thickness,and e0gi, e0gb are the dielectric constants of the tworegions. Further, making the assumptions e0gb¼ e0gi, thefollowing relation is obtained (Haile et al., 1998). Similarexpressions have been derived by others (Vollmannet al., 1997;Waser and Hagenbeck, 2000) in the contextof electroceramics.
sgb ¼ ‘
A
Cgi
Cgb
1
Rgbð11Þ
This permits an estimation of the specific conductivity ofthe grain boundary region, even without knowledge ofthe grain boundary thickness or grain size. The relationcanbe veryuseful asa startingpoint for an investigation,although it is not a substitute for a microstructuralstudy. Experience has shown that a complete under-standing of the properties of electroceramics requires acombination of IS and electron microscopic investiga-tions (Barsoukov and Macdonald, 2005).
In the above, the properties of grain boundaries havebeen treated phenomenologically, without clearly stat-ing the physical causes of their high impedance. Whilegrain boundary polarization can be caused by secondphases, for example, in ionic conductors containingimpurities, with electroceramics this seems to be theexception. A large body of work demonstrates thatthe atomic discontinuities and lower atomic density atthe cores of grain boundaries add up to a local electricalcharge, which is compensated by an accumulation ofcharge carriers of the opposite kind around the discon-tinuity. PTCR electroceramics such as BaTiO3 are nor-mally n-type (i.e., oxides doped with an element ofvalencehigher than that of thehost). The grainboundary
(a)
Dd
Rgi Cgi
CgbRgb
(b) (c)
Figure 4. (a) Brick layermodel treatinganelectroceramicas anarrayof cubic grainswithplanargrain boundaries (Beekmans and Heyne, 1976). (b) Available paths for the current throughgrains, across grain boundaries, and along grain boundaries. (c) For dD, the model isequivalent to a circuit of type (RC)(RC).
IMPEDANCE SPECTROSCOPY OF DIELECTRICS AND ELECTRONIC CONDUCTORS 5

core acquires a negative charge, which is then compen-sated by positive carriers in the space near the grainboundary. The result is a local region of diminishedconductivity, or depletion layer.With p-type electrocera-mics (doped with a lower valence element) the sign of thelayer is reversed, but the conductivity is depleted, as inthe case of the n-type material.
The total width of the depletion layer on both sides ofthe grain boundary is given by Waser and Hagen-beck (2000):
dgb ¼ffiffiffiffiffiffiffiffiffiffiffie0Fgb
c‘
sð12Þ
where e0 is the dielectric constant of the medium, Fgb isthe height of the potential barrier, and c‘ is the molarconcentration of compensating charges far from theinterface.
For a discussion of these concepts, the reader isreferred to the comprehensive work of Waser andHagenbeck (2000) and references therein.
Examples
An example of an impedance spectrum of an electroni-cally conducting ceramic is given in Figure 5. It wasobtained on a sample of polycrystalline yttrium irongarnet (YIG), of composition Y3Fe5O12 measured at324�C (Vladikova, 2006). The spectrum can be modeledby the circuit (RQ)(RQ). The resistances for the twoelements are shown by the arcs drawn in Figure 5.The capacitances, Cqe, when converted to dielectric con-stants, give valuesof38.7and909, respectively. Thefirstone is reasonable for an oxide, and allows us to ascribethe relaxation to the grain interior. However, the secondone is unrealistically large, indicating that it must be agrain boundary relaxation.
Using Equations 8 and 11, the specific conductivitiesof the grain interiors and grain boundaries are extracted
and plotted in Figure 6, for the temperature range stud-ied. Interpretation of the slopes of the two lines via theArrhenius Equation 13 indicates a higher activationenergy for the grain boundary region, 1.36 eV versus1.11 eV for the grain interior.
sT ¼ A0e�DH
kT ð13Þ
A sample of single crystal YIG of similar compositionpresents a much simpler picture, as shown in Figure 7for a temperature of 385�C (Vladikova et al., 2004).
0.25
0.000.00
0.25
0.00101 102 103 104 105 106
0.25Z' (MΩ)
f (Hz)
–Z''
(MΩ
)–Z
'' (M
Ω)
5
6
4
3
2
1
0.50 0.75
(a)
(b)
1.00
Figure 5. Impedance spectrum of electronically conductingYIG ceramic at 324C. (a) Complex plane and (b) imaginarypart versus frequency. Selected data points in (a) are labeled bythe logarithm of the frequency. Measurements courtesy
–2
–4
–6
–8
–10
–121.3 1.4
σgi
σgb
1.5 1.6 1.7 1.8
103/T (K–1)
In{σ
T (
SK
)}
Figure 6. Arrhenius plots for the conductivities for polycrys-talline YIG sample whose impedance spectrum is shown inFigure 5.
0.25
0.00
0.25
0.00102 103 104 105 106 107
0.0 0.1 0.2
6
5
4
3
0.3 0.4 0.5
(a)
(b)
0.6
–Z''
(MΩ
)–Z
'' (M
Ω)
Z' (MΩ)
f (Hz)
Figure 7. Impedance spectrumof electronically conductingYIGmonocrystal at 375C. (a) Complex plane and (b) imaginary partversus frequency. Selected data points in (a) are labeled by thelogarithm of the frequency. Courtesy of D. Vladikova and Z.Stoynov, IEES, BAS.
6 IMPEDANCE SPECTROSCOPY OF DIELECTRICS AND ELECTRONIC CONDUCTORS
Asingle arc is observedwhichcanbeascribed toasimpleconductivity relaxation of the bulk.
Conductivity relaxations occur also in materialswhose use is far removed from ionics or electronics. Forexample, ceramics of silicon carbide prepared by liquidphase sintering were found to have electrical character-istics resembling those of electroceramics. Figure 8shows data replotted from the literature (McLachlanet al., 2004), for a fine-grained ceramic (D<2mm) at250�C. The spectrum clearly resolves the grain interiorand grain boundary arcs. The grain boundaries consistof several phases, related to the doping of the material(McLachlan et al., 2004).
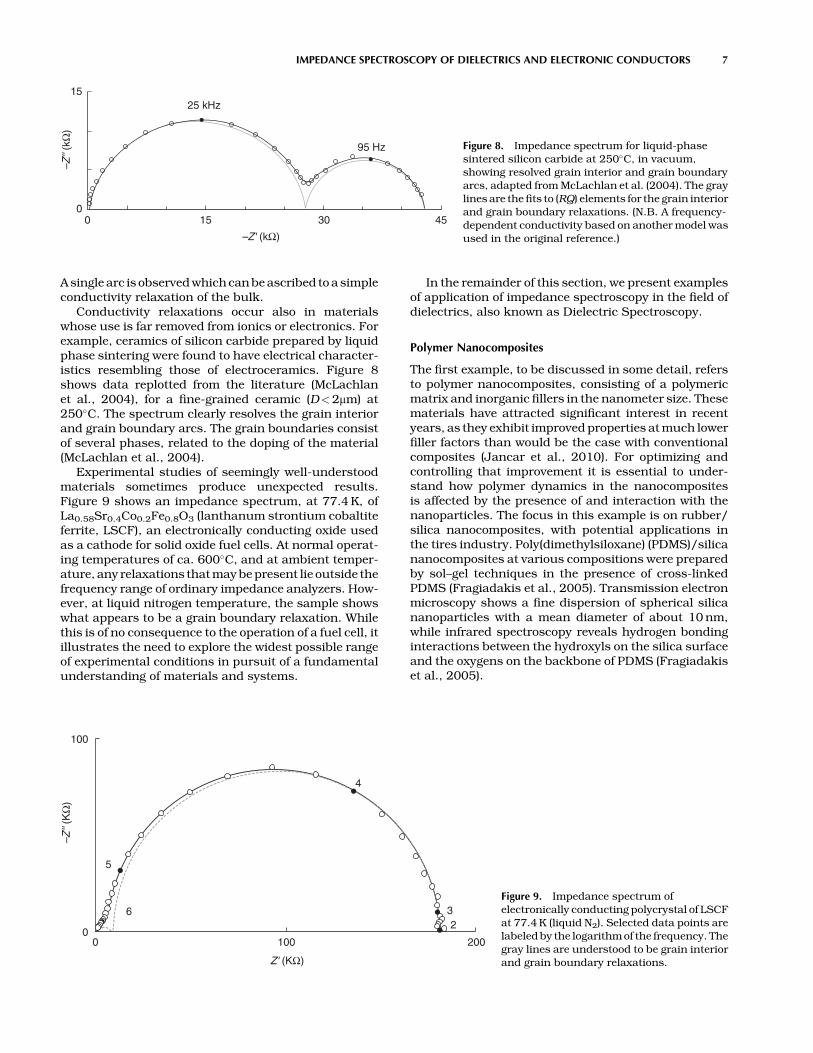
Experimental studies of seemingly well-understoodmaterials sometimes produce unexpected results.Figure 9 shows an impedance spectrum, at 77.4K, ofLa0.58Sr0.4Co0.2Fe0.8O3 (lanthanum strontium cobaltiteferrite, LSCF), an electronically conducting oxide usedas a cathode for solid oxide fuel cells. At normal operat-ing temperatures of ca. 600�C, and at ambient temper-ature, any relaxations thatmaybepresent lie outside thefrequency range of ordinary impedance analyzers. How-ever, at liquid nitrogen temperature, the sample showswhat appears to be a grain boundary relaxation. Whilethis is of no consequence to the operation of a fuel cell, itillustrates the need to explore the widest possible rangeof experimental conditions in pursuit of a fundamentalunderstanding of materials and systems.
In the remainder of this section, we present examplesof application of impedance spectroscopy in the field ofdielectrics, also known as Dielectric Spectroscopy.
Polymer Nanocomposites
The first example, to be discussed in some detail, refersto polymer nanocomposites, consisting of a polymericmatrix and inorganic fillers in the nanometer size. Thesematerials have attracted significant interest in recentyears, as they exhibit improvedproperties atmuch lowerfiller factors than would be the case with conventionalcomposites (Jancar et al., 2010). For optimizing andcontrolling that improvement it is essential to under-stand how polymer dynamics in the nanocompositesis affected by the presence of and interaction with thenanoparticles. The focus in this example is on rubber/silica nanocomposites, with potential applications inthe tires industry. Poly(dimethylsiloxane) (PDMS)/silicananocomposites at various compositions were preparedby sol–gel techniques in the presence of cross-linkedPDMS (Fragiadakis et al., 2005). Transmission electronmicroscopy shows a fine dispersion of spherical silicananoparticles with a mean diameter of about 10nm,while infrared spectroscopy reveals hydrogen bondinginteractions between the hydroxyls on the silica surfaceand the oxygens on the backbone of PDMS (Fragiadakiset al., 2005).
15
00 15 30 45
95 Hz
25 kHz
–Z''
(kΩ
)
–Z' (kΩ)
Figure 8. Impedance spectrum for liquid-phasesintered silicon carbide at 250�C, in vacuum,showing resolved grain interior and grain boundaryarcs, adapted fromMcLachlan et al. (2004). The graylines are the fits to (RQ) elements for the grain interiorand grain boundary relaxations. (N.B. A frequency-dependent conductivity based on anothermodel wasused in the original reference.)
100
00 100 200
5
4
6 32
–Z''
(KΩ
)
Z' (KΩ)
Figure 9. Impedance spectrum ofelectronically conducting polycrystal of LSCFat 77.4K (liquid N2). Selected data points arelabeledby the logarithmof the frequency. Thegray lines are understood to be grain interiorand grain boundary relaxations.
IMPEDANCE SPECTROSCOPY OF DIELECTRICS AND ELECTRONIC CONDUCTORS 7

Figure 10 shows dielectric loss spectra in neat PDMSand a nanocomposite at the same temperature, properlyselected to follow the segmental a relaxation associatedto the glass transition (Fragiadakis et al., 2005),obtained by measuring capacitance and conductanceof a plate capacitor filled with the sample (Kremer andSchoenhals, 2002). In neat PDMS, this relaxation givesrise to a single loss peak, shifting to higher frequencieswith increasing temperature. The glass transition tem-perature, Tg, of this material is about 160K. In thenanocomposite we observe the same loss peak and, inaddition, aweaker and slower one, by about five decadesin frequency. On the basis of results obtained withseveral compositions and with other similar systems,we attribute the slower loss peak to the segmental relax-ation of polymer chains interacting with the silica nano-particles, presumably in an interfacial layer around thenanoparticles, andwe use the term a0 for that. The fasterand stronger loss peak, in the same frequency region asin neat PDMS, is, consequently, assigned to the segmen-tal relaxation of PDMS chains sufficiently away fromthe silica nanoparticles (bulk PDMS) (Fragiadakiset al., 2005).
To quantitatively analyze these and similar experi-mental results, model functions are fitted to the data,here a sumofHavriliak–Negami (HN) terms, one for eachloss peak, of the type (Kremer and Schoenhals, 2002;Barsoukov and Macdonald, 2012).
eðoÞ ¼ e‘ þ De
½1þðjotÞ1�a�b ð14Þ
In this expression, e oð Þ ¼ e0 oð Þ � ie00oð Þ is the complex
dielectric function, De is the dielectric strength (disper-sion),De¼ es� e‘,where es and e‘are respectively the low-and high-frequency limits of e0, t is the relaxation time,t ¼ 1=2pfHN, where fHN is a characteristic frequencyclosely related to the loss peak frequency fpeak, and
a, b are the shape parameters describing the e00(o) curve.The analysis indicates the existence of a third, weakerrelaxation, s, as shown in the example of Figure 10,assigned to the rotation of hydroxyl groups attached tothe silica surface, confirmed by comparison with litera-ture (Fragiadakis et al., 2005).
Analysis provides information on the time scale, thestrength and the shape of each relaxation (Kremer andSchoenhals, 2002; Fragiadakis et al., 2006). Time scaleis best discussed in terms of the Arrhenius diagramshown inFigure 11 for neat PDMSandananocomposite.The lines are fits of the Arrhenius equation (Fragiadakiset al., 2006):
fmax ¼ fo exp �DHkT
� �ð15Þ
to the data for the local s relaxation, and of the Vogel–Tammann–Fulcher (VTF) equation (Fragiadakiset al., 2006)
fmax ¼ A exp � B
T�To
� �ð16Þ
to the data for the cooperative a and a0 relaxations. Inthese equations, DH is the activation energy (barrierheight), k Boltzmann’s constant, fo and A frequencyfactors,B a pseudoenergy, and To the Vogel temperature(Fragiadakis et al., 2006).
In Figure 12 the temperature dependence of thedielectric strength De of a and a0 relaxations is demon-strated for two nanocomposites. These are evaluated asmeasures of the fractions of bulk and interfacial poly-mer, respectively (Fragiadakis et al., 2006). The increaseof De of a0 at the expense of a, with increasing fillercontent, and the decrease of the former with increasingtemperature provide additional support for the assign-ment of the two relaxations given above.
Figure 10. Dielectric loss spectra, e00(f ), in neat PDMS and ananocomposite at 168K (points) and HN analysis of the data inthe nanocomposite into a sum of three relaxations (lines).
Figure 11. Arrhenius plot for neat PDMSand a nanocomposite.The lines are fits of the Arrhenius Equation 15 and of the VTFEquation 16 to the experimental data for s, and for a and a0,respectively.
8 IMPEDANCE SPECTROSCOPY OF DIELECTRICS AND ELECTRONIC CONDUCTORS

In Figure 13 we compare loss spectra in a PDMS andtwonatural rubber (NR) nanocomposites, onewith a finedispersion of silica nanoparticles, similar to the PDMSnanocomposite, and the second with larger aggregates,in the temperature/frequency regions of the segmentalrelaxation. Since NR has no oxygens on the backbone,there are no hydrogen bonds in the corresponding silicacomposites. As a result, the a0 relaxation of PDMS/silicabecomes a weaker shoulder more close to the a relaxa-tion in the NR nanocomposite with dispersedsilica particles, whereas it disappears in the NR nano-composite with aggregated silica particles, wherethe surface to volume ratio of the filler decreasessignificantly.
Application to Block Copolymers
The second example refers to block copolymers. Theseare polymer chains where two or more types of
monomers are combined in block form, poly(oxybuty-lene) and poly(oxyethylene) blocks in our example,denoted in the following with B and E, respectively. Theuseful properties of block copolymers originate largelyfrom the tendency of blocks to segregate, giving rise tomicrodomain structures (Hamley, 1998). At the lowtemperatures of measurements employed here, theE blocks crystallize into a lamellar structure (and, thus,do not exhibit long-range molecular mobility), whereasthe B blocks are atactic (amorphous). Thus, IS probesselect the mobility of the B chains, with constraintsimposed by the crystalline E blocks. The B chains pos-sess adipolemoment along the chain axis and exhibit, inaddition to the segmental a process, the slower normalmode (NM) process, related to the fluctuation and ori-entation of the end-to-end polarization vector of thechain (Kyritsis et al., 2000a).
Figure14showscomparativedielectric loss spectra inahomopolymerB, adiblockEB,anda triblockEBE,withsimilar B chain lengths. The indices give the number-average block lengths in chain units. The homopolymerand the triblock are dipole-inverted, growing both waysfrom themiddle of the B chain (Kyritsis et al., 2000a). Anexample of the analysis by fitting a sum of two HN termsof the type ofEquation14, the faster for the aprocess andthe slower for the NM process, plus a conductivity term,here simultaneously to the e0 and e00 data, is shown inFigure 15 (Kyritsis et al., 2000a). We already observe inFigure 15 that the a process shows comparable timescale in B and EB, whereas it becomes slower in EBE,reflecting the constraints imposed by tethering bothchain ends. Analysis provides quantitative support forthat and shows also that the NM process becomesslightly slower in the diblock and significantly slowerin the triblock, as compared to the homopolymer, dueto effects of fixed chain ends and of dipole inversion(Kyritsis et al., 2000a, 2000b).
Figure 12. Dielectric strength against temperature for the a anda0 relaxations in two PDMS/silica nanocomposites.
Figure 13. Comparative e00(f) spectra in a PDMS and two NRnanocomposites.
Figure 14. Comparative e00(f) spectra recorded with the samplesindicated on the plot at 243K. The e00 values of the copolymershave been normalized to the volume fraction of B blocks in thesample. The lines are guides to the eye.
IMPEDANCE SPECTROSCOPY OF DIELECTRICS AND ELECTRONIC CONDUCTORS 9
Dielectric to Conducting Transition
In the third example,we follow the transition fromdielec-tric to conducting behavior with a change in the compo-sition of the sample. Our system is isotactic poly(propylene) (iPP) filled with conducting multiwalled car-bon nanotubes (MWCNT). At low filler contents, carbon
nanotubes (CNT) are individually dispersed in the poly-mer matrix and the system shows dielectric behavior(Fig. 16). At higher filler contents, a continuous CNTnetwork is formed and the sample becomes conducting(Fig. 17). The transition can be studied by IS and thepercolation threshold pc, the critical filler content wherefirstmacroscopic conductivity appears, can be indepen-dently determined by measurements at compositionsboth lower and higher than pc. Below pc, e0 follows thepower law (Logakis et al., 2010)
e0 � ðpc � pÞ�s ð17Þ
where p is the volume fraction of the filler and s a criticalexponent (Fig. 16). The high values of e0, arising frominterfacial polarization (Logakis et al., 2010), may beutilized inflexible capacitor andelectrostatic dissipationapplications. Above pc, dc conductivity sdc follows thepower law (Logakis et al., 2010).
sdc � ðp� pcÞt ð18Þ
where t is a critical exponent relatedwith the dimension-ality of the investigated system (Logakis et al., 2010). sdcis directly measured or obtained from IS measurementsas the plateau (frequency independent) value of acconductivity s0ac (actually real part of the complex con-ductivity) at low frequencies (Fig. 17). In that case, pc
may be determined also from the filler contentdependence of the critical frequency of the changefrom frequency-independent to frequency-dependentconductivity (Logakis et al., 2009). s0ac is related to e00
by Logakis et al. (2010).
s0acðoÞ ¼ eooe00 ðoÞ ð19Þ
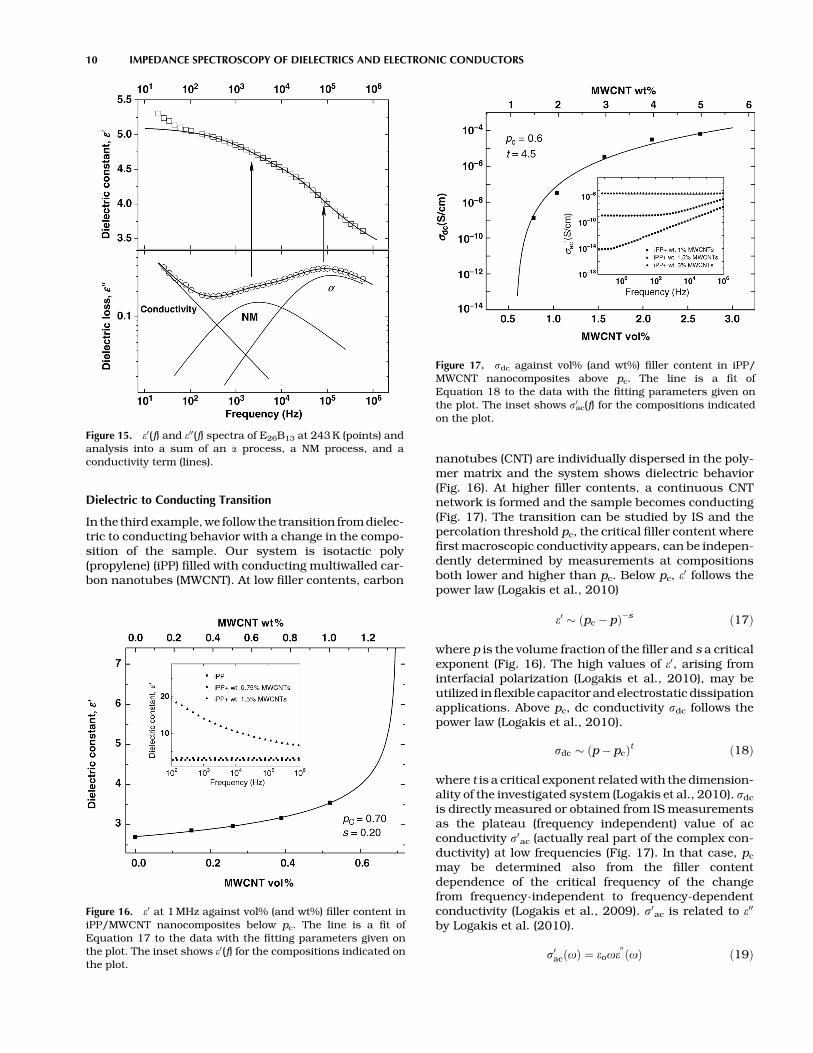
Figure 15. e0(f) and e00(f) spectra of E26B13 at 243K (points) andanalysis into a sum of an a process, a NM process, and aconductivity term (lines).
Figure 16. e0 at 1MHz against vol% (and wt%) filler content iniPP/MWCNT nanocomposites below pc. The line is a fit ofEquation 17 to the data with the fitting parameters given onthe plot. The inset shows e0(f) for the compositions indicated onthe plot.
Figure 17. sdc against vol% (and wt%) filler content in iPP/MWCNT nanocomposites above pc. The line is a fit ofEquation 18 to the data with the fitting parameters given onthe plot. The inset shows s0ac(f) for the compositions indicatedon the plot.
10 IMPEDANCE SPECTROSCOPY OF DIELECTRICS AND ELECTRONIC CONDUCTORS
where eo is the permittivity of free space. The high valuesof conductivity above pc may be utilized in electrostaticpainting, antistatic, and EMI shielding applications.
SAMPLE PREPARATION
Sample Form
The sample, in the formof a flat sheet, is pressedbetweentwo capacitor plates. If the sample is not flat enough or ishard (e.g.,anelectroceramic),metalelectrodesaredepos-ited on to the faces, to ensure good electrical contact.
Dimensions
While the dimensions of the sample are not critical, for agiven material, the aspect ratio, ‘/A, affects the magni-tude of the sample impedance. Frequently, an ‘/A of0.25 cm�1 or less is used, to reduce impedance and,hence, the sensitivity of the measurement to straycapacitance.
Cleaning
If the sample is to be studied at ambient or low tempera-tures, thorough cleaning and drying is advisable, inorder to eliminate the parasitic effects described inSection “Practical Aspects of the Method.” For high tem-perature studies, drying is not essential, as contamina-tion by moisture gases is normally removed during theinitial heating.
Electrodes
In contrast to the case of electrochemical impedancespectroscopy, where the electrodes take part in the elec-trochemical processes, for impedance spectroscopy ofdielectrics and electronic conductors, the electrodesserve mainly as current collectors. Electrodes of silver,gold, platinum, palladium, nickel, or carbon are chosen,depending on their chemical compatibility with the sam-ple and the preferredmethod of deposition: evaporation,sputtering, screen printing, or hand painting.
PROBLEMS
Stray Quantities and Correction for their Effects
Themeasurements obtained are the combined responseof the sample and of the rig. To obtain the response of thesample alone, stray (parasitic) quantities must be esti-mated and their effect subtracted out of the measuredimpedance. In practice, the most important stray quan-tities are the series inductance and the parallel capac-itance and these can be reduced by attention to rigdesign, but cannot be entirely eliminated. The strayinductance can be reduced by making lead lengths asshort as possible, while the stray capacitance can beminimized by using screened conductors wherever pos-sible and by grounding any metal parts of the rig.
The stray series inductance, Lss, is evaluated by shortcircuiting the rig at the position of the sample andperforming a measurement in the highest accessiblefrequency range. If the instrument can display the seriesinductance, this can be read directly; otherwise it mustbe obtained by fitting the impedance spectrum to acircuit RL, in which the component R accounts for thecontact resistance. Data obtained with the sample inplace are corrected for Lss by subtracting 2pf Lss from theimaginary part of the impedance, Zim. The stray parallelcapacitance, Csp, is evaluated by measurement of theempty rig with the contacts set to their maximum dis-tance, so as to minimize the air gap capacitance, asdistinct from stray capacitance. As before, Csp may beread directly from the instrument, or evaluated by fittingto a parallel circuit (RC). To correct for Csp, the quantity2pfCsp is subtracted from the imaginary part of theadmittance. In the above corrections, the real part of theimpedance/admittance is not corrected.
As illustrated in the “Data Analysis and Initial Inter-pretation” section, experimental studies of seeminglywell-understood materials sometimes produce unex-pected results. The range of experimental conditionsexplores should always be wider than that of the appli-cation, in order to reveal effects that are insignificant atoperating conditions. This also leads to a better under-standing of materials processes and systems.
CLOSING REMARKS
In the previous sections, we have discussed impedancespectroscopy and its application to selected electronicconducting and dielectric materials. With a few excep-tions, the examples have concerned samples and data,about which we have had some background knowledge.While this may have somewhat restricted the range ofmaterials we could cover, we hope that it has illustratedthe insight that impedance spectroscopy can bring intosolid-state research. We also hope that the exampleshave emphasized the importance of the control of theexperimental conditions, especially of temperature,pressure, humidity, and amplitude of the applied signal.
The examples given reveal two dichotomies regardingthe use of IS. The first one concerns the type of circuit(series or parallel) used to model the impedanceresponse:
i. For electroceramics, which according to thebrick layer model, for d<<D and sgb<< sgi, areapproximated by grain and grain boundaryregions connected in series, the preferred repre-sentation is the impedance spectrum.
ii. For dielectrics, where relaxation processes occurin parallel (e.g., different dipolar species reorientin response to an applied voltage) the preferredrepresentation is thecomplexdielectric constant.
The above differences are a reflection of the physicalprocesses and are, therefore, intuitive.
IMPEDANCE SPECTROSCOPY OF DIELECTRICS AND ELECTRONIC CONDUCTORS 11

The second dichotomy concerns themanner in whichnonideality is accommodated. In the case of electrocera-mics and ceramic ionic conductors, this is done byassigning a fractional frequency dependence to the stor-age element, typically a CPE with 0.5<n<1. Although,as stated by Barsoukov and Macdonald (2012), the CPEhas no physical basis, it is rather successful in coveringthe phenomenology of conductivity relaxation. We alsosaw that a quasiequivalent capacitance could be derivedusing Equation 6 and that this quantity has a practicaluse in determining the length scale of the feature givingrise to the capacitance.
While the literature on dielectrics is not as preoccu-pied with circuit equivalents as that on ceramics, whennonideality is introduced, it is done via the loss elementrather than the storage element (i.e., the resistor ratherthan the capacitor). The “ideal” Debye model is equiva-lent to the circuit in Figure 18a, while the Cole–Colemodel corresponds to Figure 18b. In other words, thefractional frequency dependence is assigned to the com-ponent that replaces the resistor.
The two interpretations functionwell in isolation fromeach other. It is, however, not clear how they should becombined when systems exhibit behavior intermediatebetween conductive and dielectric. Can one, for exam-ple, fully account for electroceramics at low tempera-tures, where the conductivity becomes very low butdielectric properties remain? The next few years willshow whether practitioners in dielectrics, electrocera-mics, and ionics are able to develop unified models forthe response of this group of materials.
ACKNOWLEDGMENTS
Coworkers past and present are thanked for many valu-able discussions on the theory and practice of imped-ance spectroscopy. D. Vladikova and Z. Stoynov of theInstitute of Electrochemistry and Energy Systems, Bul-garian Academy of Sciences, are specially thanked forproviding the original data on YIG. P. Plonczak of RisøDTU collaborated on the study of LCSF.
ABBREVIATIONS
CNLS complex nonlinear least squaresCNT carbon nanotubes
CPE constant phase elementEIS electrochemical impedance spectroscopyHN Havriliak–NegamiiPP isotactic poly(propylene)IS impedance spectroscopyLSCF lanthanum strontium cobaltite ferriteMWCNT multiwalled carbon nanotubesNR natural rubberPDMS poly(dimethylsiloxane)PTCR positive temperature coefficient of resistanceTSDC thermally stimulated depolarization currentsVTF Vogel–Tammann–FulcherYIG yttrium iron garnetZARC impedance element consisting of a resistor
and CPE in parallel
SYMBOLS
V voltageR electrical resistanceI electrical currentC capacitanceCqe quasiequivalent capacitance (or pseudocapa-
citance) for a ZARCY admittanceZ impedanceY0, Y0
0prefactors in the admittance of the constantphase angle element
n exponent in the admittance of the constantphase angle element
s electrical conductivitysgi grain interior conductivitysgb grain boundary conductivityRgi grain interior resistanceRgb grain boundary resistanceCgi grain interior capacitanceCgb grain boundary capacitanceegi grain interior dielectric constantegb grain boundary dielectric constantD grain sizedgb grain boundary thicknessFgb grain boundary potential barrierc‘ defect concentration far from grain boundary
coreDH activation energyA0 pre-exponential of the electrical conductivityTg glass transition temperaturee complex dielectric functione0 real part of the dielectric functione00 imaginary part of the dielectric function
(dielectric loss)o angular frequencyDe dielectric strengthes low-frequency limit of the real part of the
dielectric functione‘ high-frequency limit of the real part of the
dielectric functiont relaxation timefHN characteristic frequency in the HN
Equation 14fpeak loss peak frequency
(a) (b)
Q
Figure 18. Circuit equivalents for (a) the Debye and (b) Cole–Cole model of dielectric relaxation.
12 IMPEDANCE SPECTROSCOPY OF DIELECTRICS AND ELECTRONIC CONDUCTORS

a, b shape parametersT absolute temperaturek Boltzmann’s constantfo, A frequency factorsB pseudoenergyTo Vogel temperaturepc percolation thresholdp filler volume fractions critical exponentssdc dc conductivitys0ac ac conductivity (real part)e0 permittivity of free space
LITERATURE CITED
Barsoukov, E. and Macdonald, J. R. 2005. Impedance Spec-troscopy. 2nd ed. Wiley, Hoboken, NJ.
Barsoukov, E. and Macdonald, J. R. 2012. ElectrochemicalImpedance Spectroscopy This volume.
Bauerle, J. E. 1969. Study of solid electrolyte polarization by acomplex admittance method. J. Phys. Chem. Solids
30:2657–2670.
Beekmans, N. M. and Heyne, L. 1976. Correlation betweenimpedance, microstructure and composition of calcia-stabilized zirconia. Electrochim. Acta 21 303–310.
Bonanos, N. and Lilley, E. 1981. Conductivity relaxations insingle crystals of sodium chloride containing suzuki phaseprecipitates. J. Phys. Chem. Solids 42:943–952.
Bucci, C., Fieschi, R., andGuidi,G. 1966. Ionic thermocurrentsin dielectrics. Phys. Rev. 148:816–823.
Debye, P. J. W. 1929. Polar Molecules. Dover Publications,(original publication 1929).
Fabregat-Santiago, F., Garcia-Belmonte, G., Mora-Sero, I., andBisquert, J. 2011. Characterization of nanostructuredhybrid and organic solar cells by impedance spectroscopy.Phys. Chem. Chem. Phys. 13:9083–9118.
Fragiadakis, D., Pissis, P., and Bokobza, L. 2005. Glass tran-sition and molecular dynamics in poly (dimethylsiloxane)/silica nanocomposites. Polymer 46:6001–6008.
Fragiadakis, D., Pissis, P., and Bokobza, L. 2006. Modifiedchain dynamics in poly(dimethylsiloxane)/silica nanocom-posites. J. Non-Cryst. Solids 352:4969–4972.
Haile, S. M., West, D. L., and Campbell, J. 1998. The role ofmicrostructure and processing on the proton conductingpropertiesof gadolinium-dopedbariumcerate.J.Mater.Res.
13:1576–1595.
Hamley, I. W. 1998. The Physics of Block Copolymers. OxfordUniversity Press, Oxford.
Hodge, I. M., Ingram, M. D., and West, A. R. 1975. Newmethodfor analyzingac behavior of polycrystalline solid electrolytes.J. Electroanal. Chem. 58:429–432.
Hong, C-M. and Day, D. E. 1979. Thermally stimulatedpolarization and depolarization current (TSPC–TSDC) tech-niques for studying ion motion in glass. J. Mater. Sci.
14:2493–2499.
Hsu, C.H. andMansfeld, F. 2001.Concerning the conversion oftheconstantphaseelementparameterY0 intoacapacitance.Corrosion 57:747–748.
Irvine, J. T. S., Sinclair, D. C., and West, A. R. 1990. Electro-ceramics: characterizationby impedancespectroscopy.Adv.Mater. 2:132–138.
Jancar, J., Douglas, J. F., Starr, F. W., Kumar, S. K.,Cassagnau, P., Lesser, A. J., Sternstein, S. S., and Buehler,M. J. 2010. Current issues in research on structure–property relationships in polymer nanocomposites. Polymer
51:3321–3343.
Jovic, V. D. 2003. Research Solutions and Resources. Availableat http://www.consultrsr.com/files/jovic.pdf. AccessedNovember 29, 2011.
Kremer, F. and Schoenhals, A. 2002. Broadband DielectricSpectroscopy. Springer, Berlin.
Krohns, S., Lunkenheimer, P., Ebbinghaus, S. G., and Loidl, A.2007. Broadband dielectric spectroscopy on single-crystalline and ceramic CaCu3Ti4O12. Appl. Phys. Lett.
91:022910.
Kyritsis, A., Pissis, P., Konsta, A., Mai, S.-M., and Booth, C.2000a. Molecular dynamics in homo, diblock and triblockpolymers studiedbydielectric relaxation spectroscopy. IEEETrans. Diel. El. Insul. 7:509–516.
Kyritsis, A., Pissis, P., Mai, S.-M., and Booth, C. 2000b.Comparative dielectric studies of segmental and normalmodedynamicsofpoly(oxybutylene)andpoly(oxyethylene)–-poly(oxybutylene) diblock copolymers. Macromolecules
33:4581–4595.
LEVMW, web information. The newest WINDOWS version,LEVMW, of the comprehensive LEVM fitting and inversionprogrammay be downloaded at no cost by accessing http://jrossmacdonald.com. Accessed November 29, 2011.
Lilley,E. andStrutt, J. E. 1979.Bulkandgrain-boundary ionic-conductivity in polycrystalline beta”-alumina. Phys. Stat.
Sol. A 54:639–650.
Logakis, E., Pandis, Ch., Peoglos, V., Pissis, P., Piontek, J.,Poetschke, P., Micusik, M., and Omastova, M. 2009. Elec-trical/dielectric properties and conduction mechanism inmelt processed polyamide/multi-walled carbon nanotubescomposites. Polymer 50:5103–5111.
Logakis,E., Pollatos,E., Pandis,Ch., Peoglos,V., Zuburtikudis,I., Delides, C. G., Vatalis, A., Gjoka, M., Syskakis, E., Viras,K., and Pissis, P. 2010. Structure–property relationships inisotactic polypropylene/multi-walled carbon nanotubesnanocomposites. Compos. Sci. Technol. 70:328–335.
Macdonald, J. R. 1984. Note on the parameterization of theconstant-phase admittance element. Solid State Ionics
13:147–149.
Macdonald, J. R. 1995. Exact andapproximate nonlinear least-squares inversion of dielectric-relaxation spectra. J. Chem.
Phys. 102:6241–6250.
Macdonald, J. R. 2000a. Comparison of parametric and non-parametric methods for the analysis and inversion of immit-tance data: critique of earlier work. J. Comput. Phys.
157:280–301.
Macdonald, J. R. 2000b. Comparison of the universal dynamicresponse power–law fitting model for conducting systemswith superior alternative models. Solid State Ionics
133:79–97.
Macdonald, J. R. 2011. Effects of various boundary conditionson the response of Poisson–Nernst–Planck impedancespectroscopy analysis models and comparison with a con-tinuous-time random-walk model. J. Phys. Chem. A
115:13370–13380.
Macdonald, J. R., Evangelista, L. R., Lenzi, E. K., andBarbero, G. 2011. Comparison of impedance spectroscopyexpressions and responses of alternate anomalousPoisson–Nernst–Planck diffusion equations for finite-lengthsituations. J. Phys. Chem. C 115:7648–7655.
IMPEDANCE SPECTROSCOPY OF DIELECTRICS AND ELECTRONIC CONDUCTORS 13

Macdonald, J. R. andPotter, L. D. Jr. 1987. Aflexible procedurefor analyzing impedance spectroscopy results: descriptionand illustrations. Solid State Ionics 24:61–79.
McLachlan, D. S., Sauti, G., Vorster, A., andHermann,M. 2004.Impedance spectroscopy of liquid-phase sintered silicon car-bide. AIP Conference Proceedings. 700, pp. 1122–1128.
Orazem, M. E. and Tribollet, B. 2008. Electrochemical Imped-ance Spectroscopy. Wiley, Hoboken, NJ.
Vladikova, D. 2006. Development of differential impedanceanalysis for investigation of electroceramic systems. D. Sc.Thesis, Institute of Electrochemistry and Energy Systems.Bulgarian Academy of Sciences, Sofia.
Vladikova, D., Stoynov, Z., and Viviani, M. 2004. Application ofthe differential impedance analysis for investigation of elec-troceramics. J. Eur. Ceram. Soc. 24:1121–1127.
Vollmann, M., Hagenbeck, R., and Waser, R. 1997. Grain-boundary defect chemistry of acceptor-doped titanates:inversion layer and low-field conduction. J. Am. Ceram. Soc.
80:2301–2314.
Von Hippel, A. R. 1954. Dielectrics and Waves. Wiley.
Waser, R. and Hagenbeck, R. 2000. Grain boundaries in dielec-tricandmixedconductingceramics.ActaMater. 48:797–825.
KEY REFERENCES
Barsoukov, E. and Macdonald, J. R. 2012. ELECTROCHEMICAL
IMPEDANCE SPECTROSCOPY in this volume.
Appearing in the same series as the present one, this article
rigorously treats electrochemical impedance, including
measurements, analysis of data, and electrochemical mod-
els. The article contains an up-to date overview of measure-
ment systems.Barsoukov, E. and Macdonald, J. R. 2005. Impedance Spec-
troscopy. 2nd ed. Wiley, Hoboken, NJ.
Thefirstmonograph dedicated to impedance spectroscopy anda
valuable referencework for themiddle to advanced user. The
subjects covered are theory, measuring techniques, data
analysis, for awide range of electrochemical cells, dielectrics,
and solid-state devices, including electrochemical sensors,
fuel cells, and batteries.Orazem, M. E. and Tribollet, B. 2008. Electrochemical Imped-
ance Spectroscopy. Wiley, Hoboken, NJ.
Written for those intending to use impedance spectroscopy in an
electrochemical context, the book covers aqueous electro-
chemistry and corrosion, while also dealing extensively with
semiconductors, sensors, electrochromics, batteries, fuel
cells, electrochemical capacitors, and dielectrics. The empha-
sis is on generally applicable fundamentals and is suited for
use as a textbook for a university level course or for indepen-
dent self-study.Von Hippel, A. R. 1954. Dielectrics and Waves. Wiley.
Publishedhalf a centuryagoandstill in print, the bookdiscusses
the role played by electromagnetic and elastic waves in solid
and liquid dielectrics, piezoelectrics and ferroelectrics, and in
magnetic materials. The work is presented both at the mac-
roscopicand themicroscopic levels.Considereda classic in its
field.
14 IMPEDANCE SPECTROSCOPY OF DIELECTRICS AND ELECTRONIC CONDUCTORS