impacts on distribution property-casualty insurance...impacts on distribution property-casualty...
TRANSCRIPT

www.conning.com | © 2019 Conning, Inc.
Impacts on Distribution
Property-Casualty Insurance
January 29, 2018
2019 INA Summit

© 2019 Conning, Inc. This research publication is copyrighted with all rights reserved. No part of this research publication may be reproduced, transcribed, transmitted, stored in an electronic retrieval system, or translated
into any language in any form by any means without the prior written permission of Conning.
Table of Contents
1
Changes in Distribution
Demographic Changes
Pressures on Distribution

© 2019 Conning, Inc. This research publication is copyrighted with all rights reserved. No part of this research publication may be reproduced, transcribed, transmitted, stored in an electronic retrieval system, or translated
into any language in any form by any means without the prior written permission of Conning.
CHANGES IN DISTRIBUTION
2
© 2019 Conning, Inc. This research publication is copyrighted with all rights reserved. No part of this research publication may be reproduced, transcribed, transmitted, stored in an electronic retrieval system, or translated
into any language in any form by any means without the prior written permission of Conning.
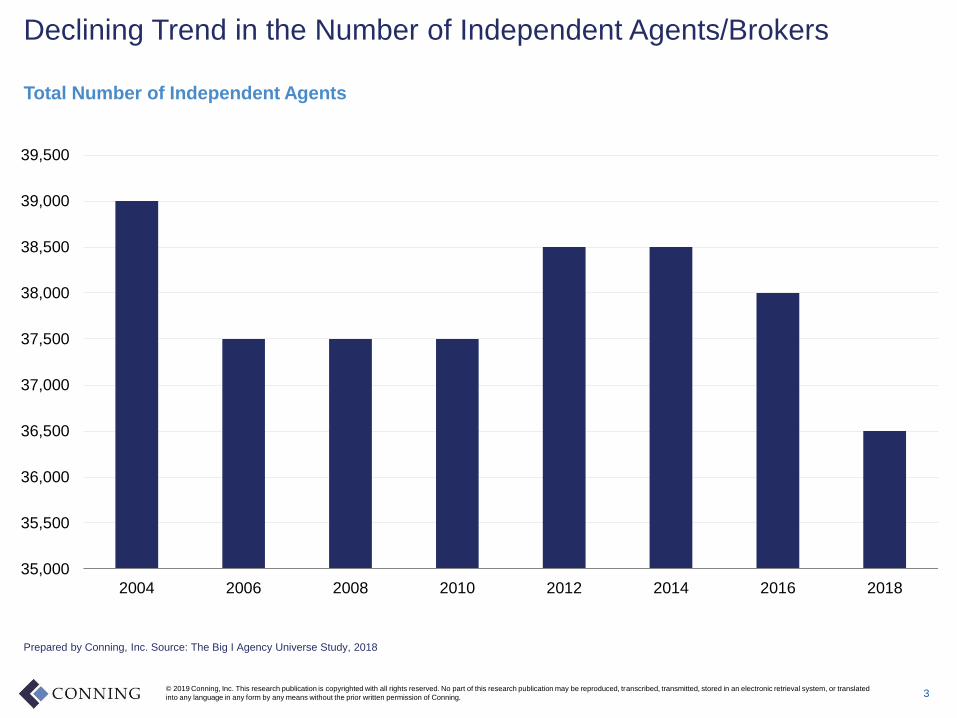
Declining Trend in the Number of Independent Agents/Brokers
3
35,000
35,500
36,000
36,500
37,000
37,500
38,000
38,500
39,000
39,500
2004 2006 2008 2010 2012 2014 2016 2018
Prepared by Conning, Inc. Source: The Big I Agency Universe Study, 2018
Total Number of Independent Agents
© 2019 Conning, Inc. This research publication is copyrighted with all rights reserved. No part of this research publication may be reproduced, transcribed, transmitted, stored in an electronic retrieval system, or translated
into any language in any form by any means without the prior written permission of Conning.
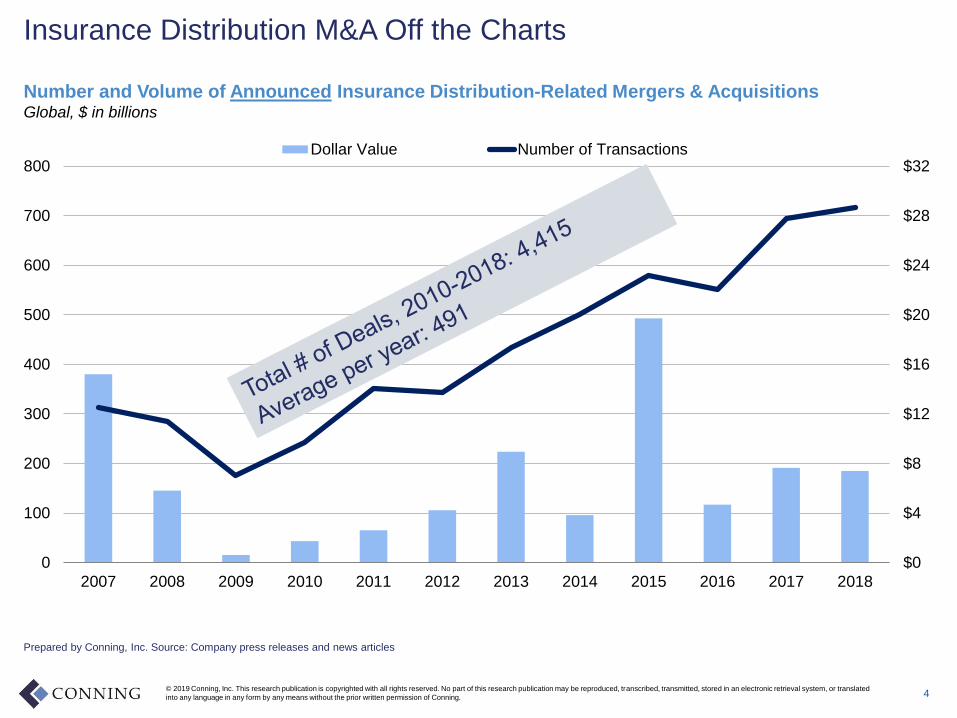
Insurance Distribution M&A Off the Charts
4
Prepared by Conning, Inc. Source: Company press releases and news articles
Number and Volume of Announced Insurance Distribution-Related Mergers & AcquisitionsGlobal, $ in billions
$0
$4
$8
$12
$16
$20
$24
$28
$32
0
100
200
300
400
500
600
700
800
2007 2008 2009 2010 2011 2012 2013 2014 2015 2016 2017 2018
Dollar Value Number of Transactions
© 2019 Conning, Inc. This research publication is copyrighted with all rights reserved. No part of this research publication may be reproduced, transcribed, transmitted, stored in an electronic retrieval system, or translated
into any language in any form by any means without the prior written permission of Conning.
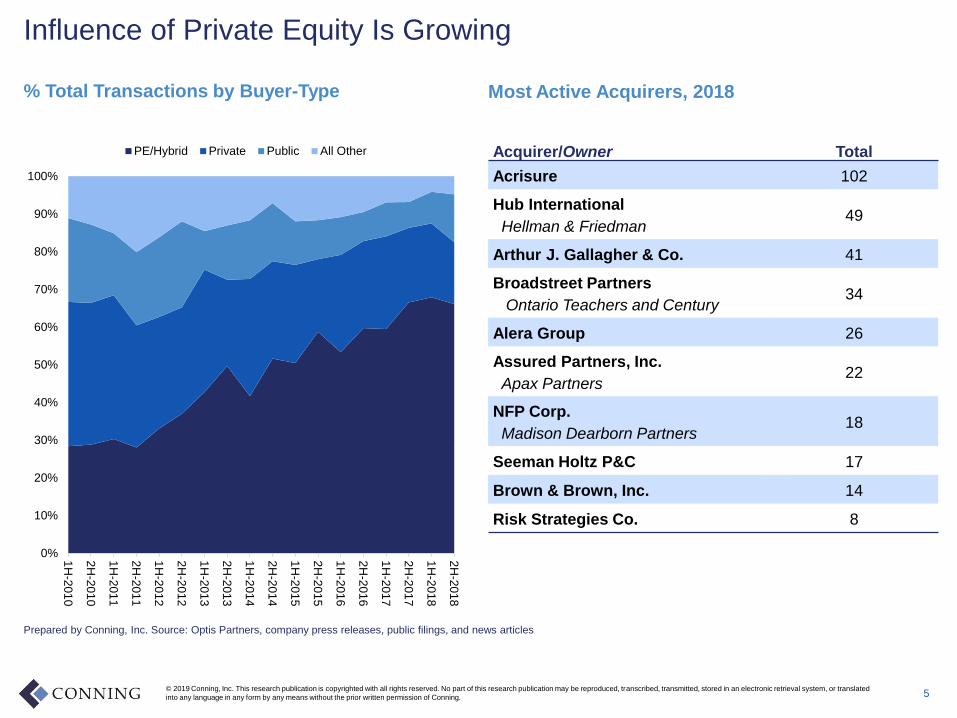
Influence of Private Equity Is Growing
5
Prepared by Conning, Inc. Source: Optis Partners, company press releases, public filings, and news articles
% Total Transactions by Buyer-Type
Acquirer/Owner Total
Acrisure 102
Hub International
Hellman & Friedman49
Arthur J. Gallagher & Co. 41
Broadstreet Partners
Ontario Teachers and Century34
Alera Group 26
Assured Partners, Inc.
Apax Partners22
NFP Corp.
Madison Dearborn Partners18
Seeman Holtz P&C 17
Brown & Brown, Inc. 14
Risk Strategies Co. 8
0%
10%
20%
30%
40%
50%
60%
70%
80%
90%
100%
1H
-201
0
2H
-201
0
1H
-201
1
2H
-201
1
1H
-201
2
2H
-201
2
1H
-201
3
2H
-201
3
1H
-201
4
2H
-201
4
1H
-201
5
2H
-201
5
1H
-201
6
2H
-201
6
1H
-201
7
2H
-201
7
1H
-201
8
2H
-201
8
PE/Hybrid Private Public All Other
Most Active Acquirers, 2018
© 2019 Conning, Inc. This research publication is copyrighted with all rights reserved. No part of this research publication may be reproduced, transcribed, transmitted, stored in an electronic retrieval system, or translated
into any language in any form by any means without the prior written permission of Conning.
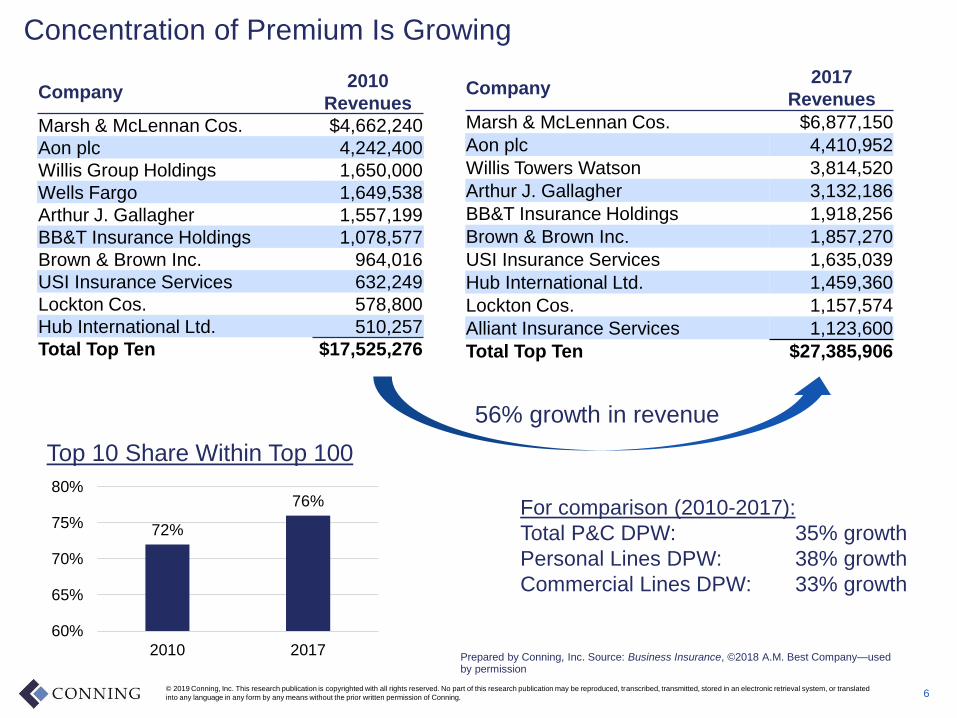
Concentration of Premium Is Growing
6
Company2017
Revenues
Marsh & McLennan Cos. $6,877,150
Aon plc 4,410,952
Willis Towers Watson 3,814,520
Arthur J. Gallagher 3,132,186
BB&T Insurance Holdings 1,918,256
Brown & Brown Inc. 1,857,270
USI Insurance Services 1,635,039
Hub International Ltd. 1,459,360
Lockton Cos. 1,157,574
Alliant Insurance Services 1,123,600
Total Top Ten $27,385,906
Company2010
Revenues
Marsh & McLennan Cos. $4,662,240
Aon plc 4,242,400
Willis Group Holdings 1,650,000
Wells Fargo 1,649,538
Arthur J. Gallagher 1,557,199
BB&T Insurance Holdings 1,078,577
Brown & Brown Inc. 964,016
USI Insurance Services 632,249
Lockton Cos. 578,800
Hub International Ltd. 510,257
Total Top Ten $17,525,276
56% growth in revenue
For comparison (2010-2017):
Total P&C DPW: 35% growth
Personal Lines DPW: 38% growth
Commercial Lines DPW: 33% growth
Top 10 Share Within Top 100
72%
76%
60%
65%
70%
75%
80%
2010 2017Prepared by Conning, Inc. Source: Business Insurance, ©2018 A.M. Best Company—used by permission

© 2019 Conning, Inc. This research publication is copyrighted with all rights reserved. No part of this research publication may be reproduced, transcribed, transmitted, stored in an electronic retrieval system, or translated
into any language in any form by any means without the prior written permission of Conning.
Agency Networks Are Increasing Membership and Revenue
7
Prepared by Conning, Inc. Source: Prepared by Conning, Inc. Source: Insurance Journal, company websites and press releases
Largest Agent Networks$ in millions
Network
Total 2017 P-C
Revenue
Total 2017 P-C
Premium
Number of
Member
Agencies
SIAA Inc.$1,087 $7,400 7,000
ISU Insurance Agency Network468 3,829 189
Keystone Insurers Group406 3,387 300
SecureRisk280 2,119 123
The Iroquois Group174 1,159 2,250
Combined Agents of America LLC116 807 60
Renaissance Alliance Insurance
Services LLC
103 614 90
United Valley Insurance Services Inc.98 785 105
Smart Choice91 745 6,300
Insurors Group LLC87 479 13
Top 10 Totals$2,910 $21,324 16,430
Agency Networks
engage with 45%
of all agencies!!!

© 2019 Conning, Inc. This research publication is copyrighted with all rights reserved. No part of this research publication may be reproduced, transcribed, transmitted, stored in an electronic retrieval system, or translated
into any language in any form by any means without the prior written permission of Conning.
Personal Lines Leading Shift To Direct Distribution
8
22%
30%
11%
7%
0%
10%
20%
30%
40%
50%
60%
70%
80%
90%
100%
Personal Auto: 2010 Personal Auto: 2017 Homeowners Commercial Lines
Ind. Agent Exc. Agent Direct Other
Prepared by Conning, Inc. Source: ©2018 A.M. Best Company—used by permission, company press releases, public filings, and news articles
© 2019 Conning, Inc. This research publication is copyrighted with all rights reserved. No part of this research publication may be reproduced, transcribed, transmitted, stored in an electronic retrieval system, or translated
into any language in any form by any means without the prior written permission of Conning.
DEMOGRAPHIC CHANGES
9

© 2019 Conning, Inc. This research publication is copyrighted with all rights reserved. No part of this research publication may be reproduced, transcribed, transmitted, stored in an electronic retrieval system, or translated
into any language in any form by any means without the prior written permission of Conning.
U.S. Population Growth Rates are Slowing
10
0%
5%
10%
15%
20%
25%
1900 1910 1920 1930 1940 1950 1960 1970 1980 1990 2000 2010 2020P 2030P
Prepared by Conning, Inc. Source: U.S. Census Bureau, Department of Commerce
U.S. Population Growth by Decade
© 2019 Conning, Inc. This research publication is copyrighted with all rights reserved. No part of this research publication may be reproduced, transcribed, transmitted, stored in an electronic retrieval system, or translated
into any language in any form by any means without the prior written permission of Conning.
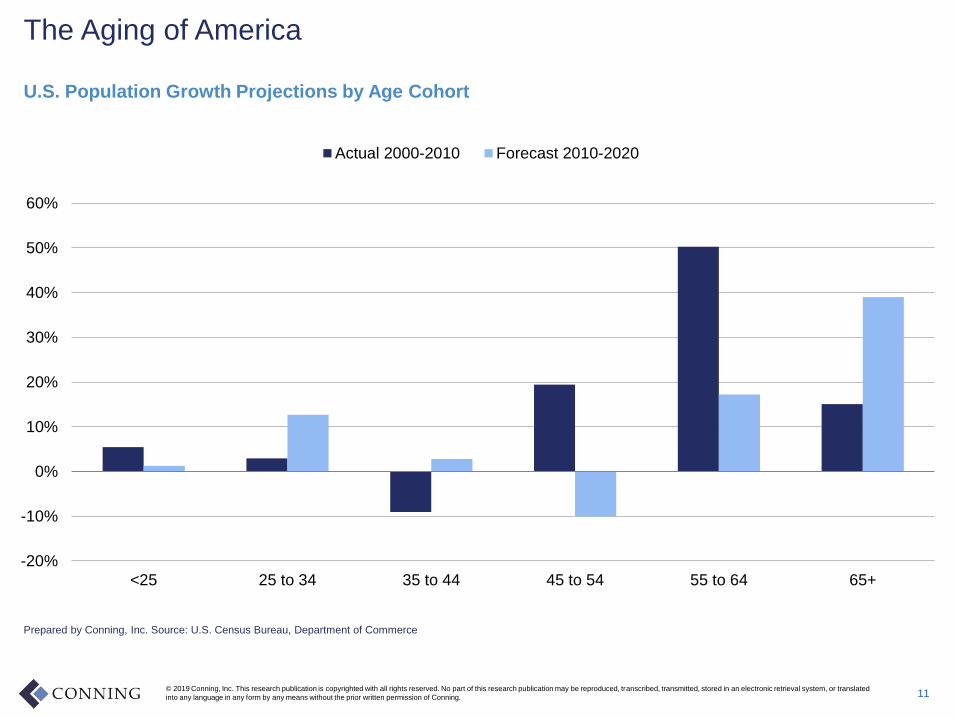
The Aging of America
11
-20%
-10%
0%
10%
20%
30%
40%
50%
60%
<25 25 to 34 35 to 44 45 to 54 55 to 64 65+
Actual 2000-2010 Forecast 2010-2020
Prepared by Conning, Inc. Source: U.S. Census Bureau, Department of Commerce
U.S. Population Growth Projections by Age Cohort

© 2019 Conning, Inc. This research publication is copyrighted with all rights reserved. No part of this research publication may be reproduced, transcribed, transmitted, stored in an electronic retrieval system, or translated
into any language in any form by any means without the prior written permission of Conning.
Changing Ethnicity Mix
12
0%
10%
20%
30%
40%
50%
60%
70%
White, Non-Hispanic
Hispanic African-American, Non-
Hispanic
Asian Native Hawaiianand Pacific
Islander
AmericanIndian/Alaska
Native
Two or MoreRaces
2000 2010 2020 2030 2040 2050 2060
Prepared by Conning, Inc. Source: U.S. Census Bureau, Department of Commerce
U.S. Population Projections by Race and Ethnicity, 2000-2060
In a review of 2017
Census Bureau data,
minority groups,
including Hispanic
white, accounted for
97% of the national
population growth from
July 2010 to July 2017
estimates.
© 2019 Conning, Inc. This research publication is copyrighted with all rights reserved. No part of this research publication may be reproduced, transcribed, transmitted, stored in an electronic retrieval system, or translated
into any language in any form by any means without the prior written permission of Conning.
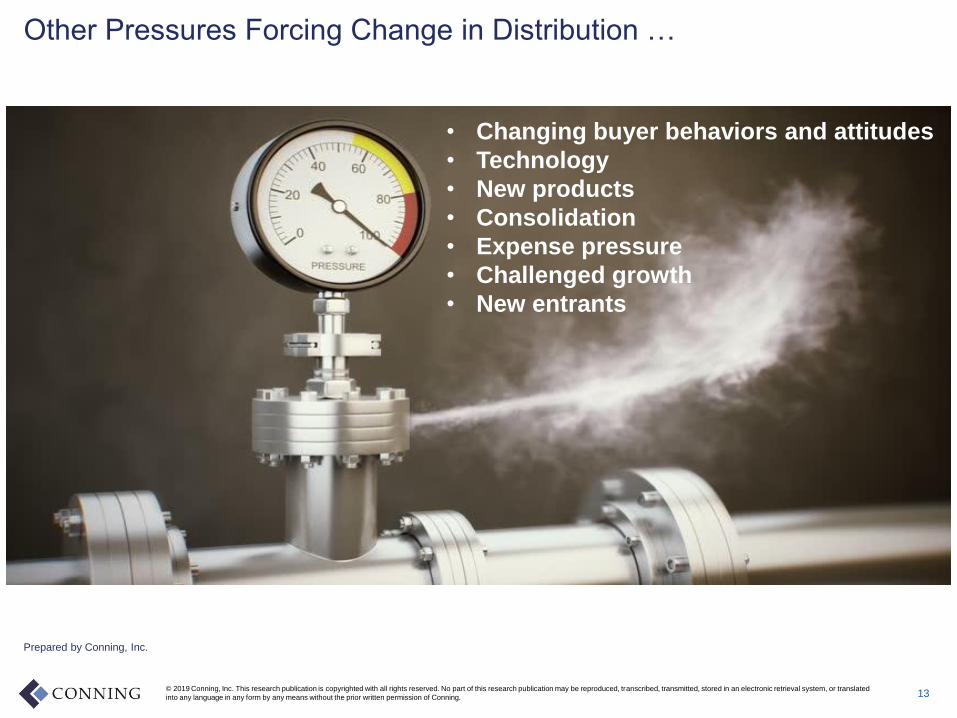
Other Pressures Forcing Change in Distribution …
13
Prepared by Conning, Inc.
• Changing buyer behaviors and attitudes
• Technology
• New products
• Consolidation
• Expense pressure
• Challenged growth
• New entrants
© 2019 Conning, Inc. This research publication is copyrighted with all rights reserved. No part of this research publication may be reproduced, transcribed, transmitted, stored in an electronic retrieval system, or translated
into any language in any form by any means without the prior written permission of Conning.
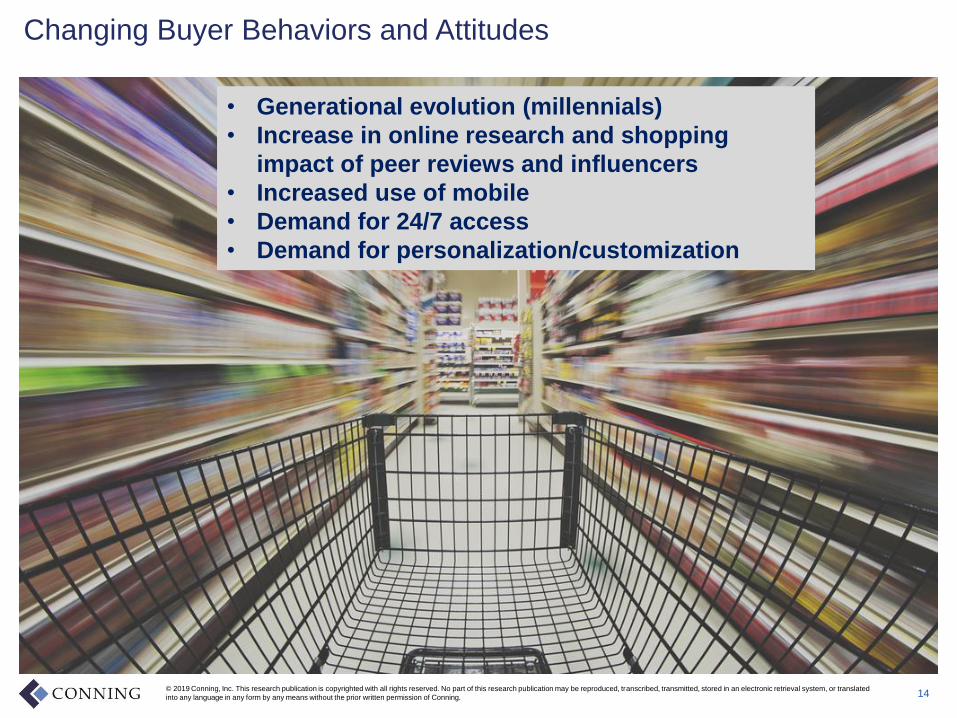
Changing Buyer Behaviors and Attitudes
• Generational evolution (millennials)
• Increase in online research and shopping
impact of peer reviews and influencers
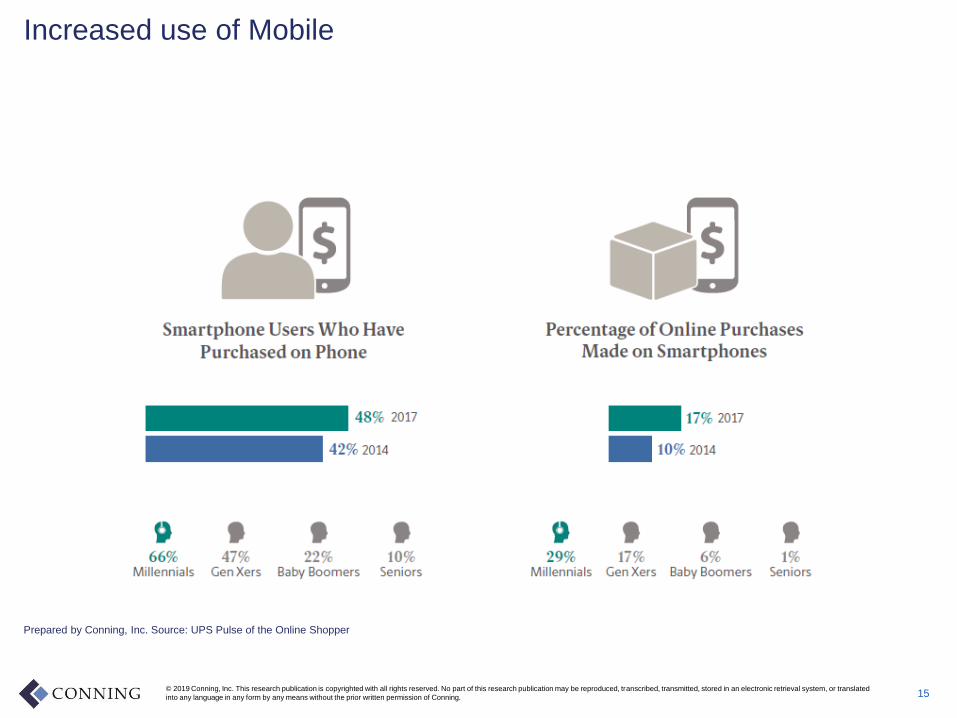
• Increased use of mobile
• Demand for 24/7 access
• Demand for personalization/customization
14
© 2019 Conning, Inc. This research publication is copyrighted with all rights reserved. No part of this research publication may be reproduced, transcribed, transmitted, stored in an electronic retrieval system, or translated
into any language in any form by any means without the prior written permission of Conning.
Increased use of Mobile
15
Prepared by Conning, Inc. Source: UPS Pulse of the Online Shopper
© 2019 Conning, Inc. This research publication is copyrighted with all rights reserved. No part of this research publication may be reproduced, transcribed, transmitted, stored in an electronic retrieval system, or translated
into any language in any form by any means without the prior written permission of Conning.
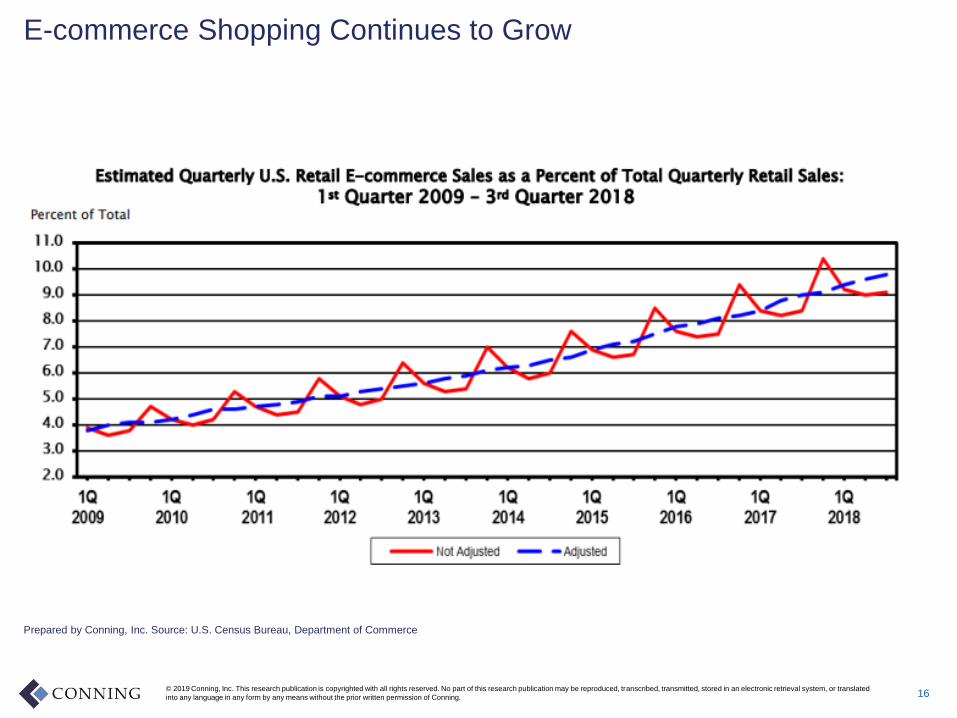
E-commerce Shopping Continues to Grow
16
Prepared by Conning, Inc. Source: U.S. Census Bureau, Department of Commerce

© 2019 Conning, Inc. This research publication is copyrighted with all rights reserved. No part of this research publication may be reproduced, transcribed, transmitted, stored in an electronic retrieval system, or translated
into any language in any form by any means without the prior written permission of Conning.
New Products Are Putting Pressure on Traditional Distribution
17
Prepared by Conning, Inc.
Sharing
EconomyGig
Economy
On-demand
Insurance
© 2019 Conning, Inc. This research publication is copyrighted with all rights reserved. No part of this research publication may be reproduced, transcribed, transmitted, stored in an electronic retrieval system, or translated
into any language in any form by any means without the prior written permission of Conning.
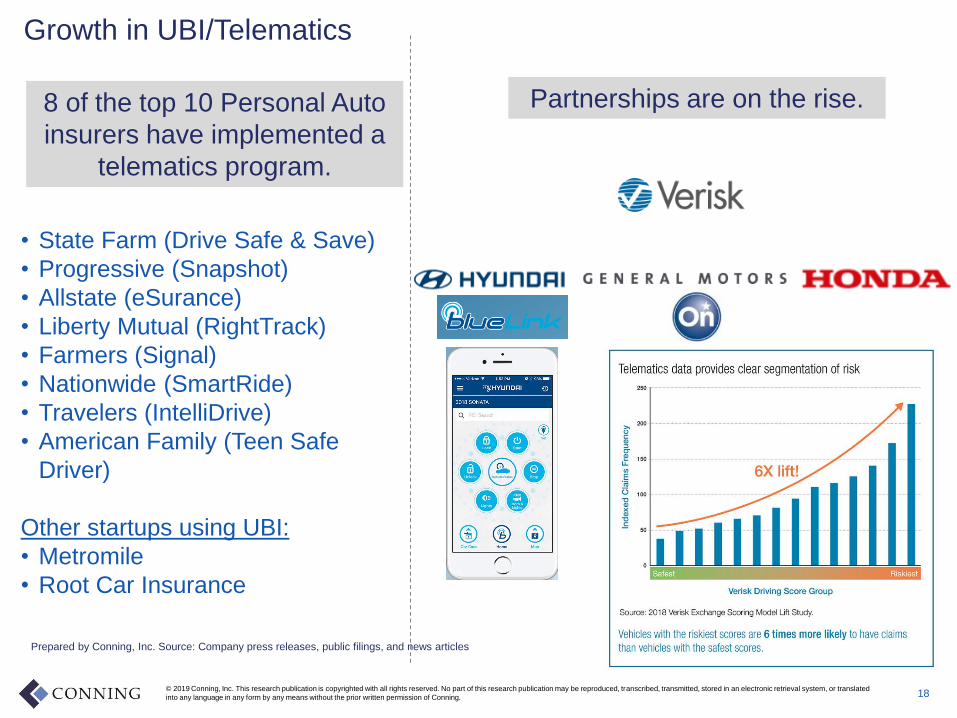
Growth in UBI/Telematics
18
8 of the top 10 Personal Auto
insurers have implemented a
telematics program.
• State Farm (Drive Safe & Save)
• Progressive (Snapshot)
• Allstate (eSurance)
• Liberty Mutual (RightTrack)
• Farmers (Signal)
• Nationwide (SmartRide)
• Travelers (IntelliDrive)
• American Family (Teen Safe
Driver)
Other startups using UBI:
• Metromile
• Root Car Insurance
Partnerships are on the rise.
Prepared by Conning, Inc. Source: Company press releases, public filings, and news articles

© 2019 Conning, Inc. This research publication is copyrighted with all rights reserved. No part of this research publication may be reproduced, transcribed, transmitted, stored in an electronic retrieval system, or translated
into any language in any form by any means without the prior written permission of Conning.
Pressure from Digital Sectors
19
New Business Models Direct Small Commercial Digital MGAs
Prepared by Conning, Inc. Source: Company press releases, public filings, and news articles
© 2019 Conning, Inc. This research publication is copyrighted with all rights reserved. No part of this research publication may be reproduced, transcribed, transmitted, stored in an electronic retrieval system, or translated
into any language in any form by any means without the prior written permission of Conning.
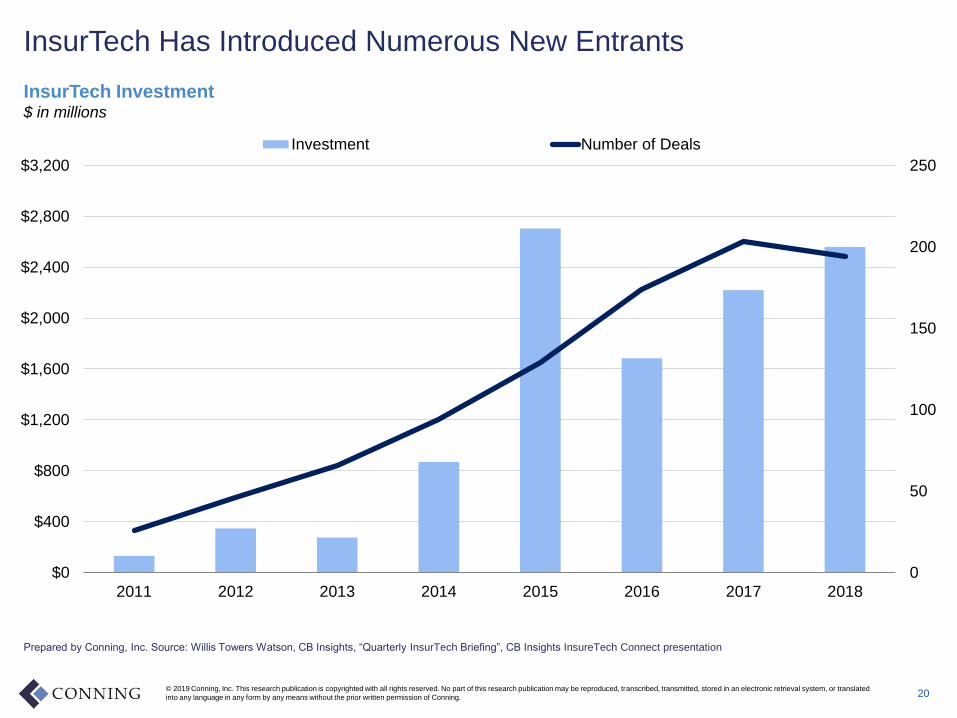
InsurTech Has Introduced Numerous New Entrants
20
0
50
100
150
200
250
$0
$400
$800
$1,200
$1,600
$2,000
$2,400
$2,800
$3,200
2011 2012 2013 2014 2015 2016 2017 2018
Investment Number of Deals
Prepared by Conning, Inc. Source: Willis Towers Watson, CB Insights, “Quarterly InsurTech Briefing”, CB Insights InsureTech Connect presentation
InsurTech Investment$ in millions
© 2019 Conning, Inc. This research publication is copyrighted with all rights reserved. No part of this research publication may be reproduced, transcribed, transmitted, stored in an electronic retrieval system, or translated
into any language in any form by any means without the prior written permission of Conning.
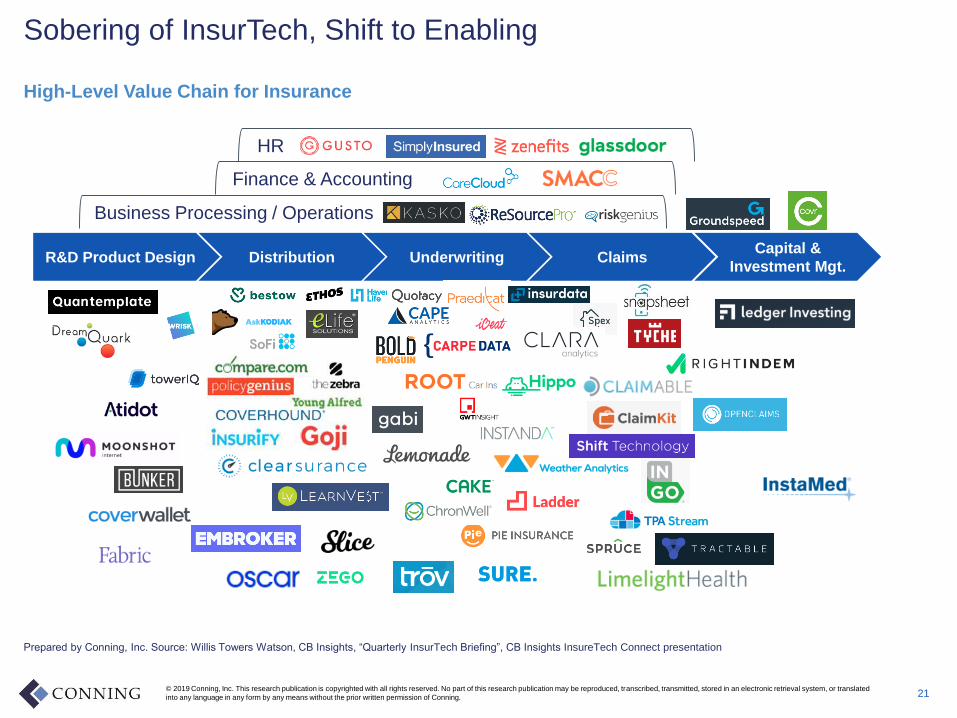
Sobering of InsurTech, Shift to Enabling
21
Prepared by Conning, Inc. Source: Willis Towers Watson, CB Insights, “Quarterly InsurTech Briefing”, CB Insights InsureTech Connect presentation
High-Level Value Chain for Insurance
Business Processing / Operations
Finance & Accounting
HR
R&D Product Design Distribution UnderwritingCapital &
Investment Mgt.Claims
© 2019 Conning, Inc. This research publication is copyrighted with all rights reserved. No part of this research publication may be reproduced, transcribed, transmitted, stored in an electronic retrieval system, or translated
into any language in any form by any means without the prior written permission of Conning.
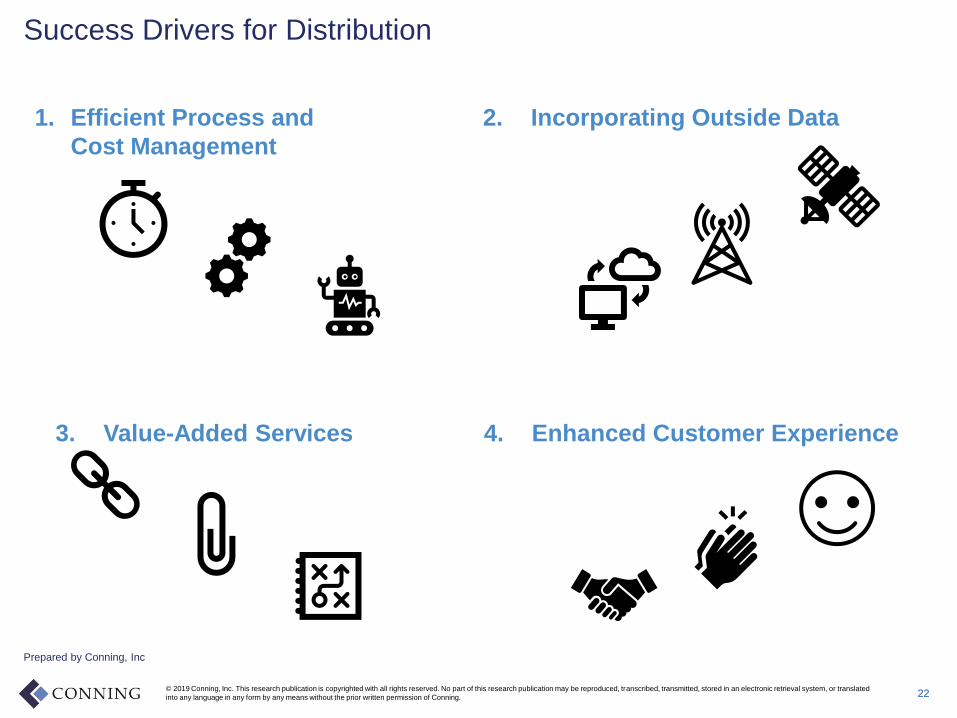
Success Drivers for Distribution
22
2. Incorporating Outside Data
Prepared by Conning, Inc
4. Enhanced Customer Experience
1. Efficient Process and
Cost Management
3. Value-Added Services

© 2019 Conning, Inc. This research publication is copyrighted with all rights reserved. No part of this research publication may be reproduced, transcribed, transmitted, stored in an electronic retrieval system, or translated
into any language in any form by any means without the prior written permission of Conning.
THANK YOU !!!
23
© 2019 Conning, Inc. This research publication is copyrighted with all rights reserved. No part of this research publication may be reproduced, transcribed, transmitted, stored in an electronic retrieval system, or translated
into any language in any form by any means without the prior written permission of Conning.
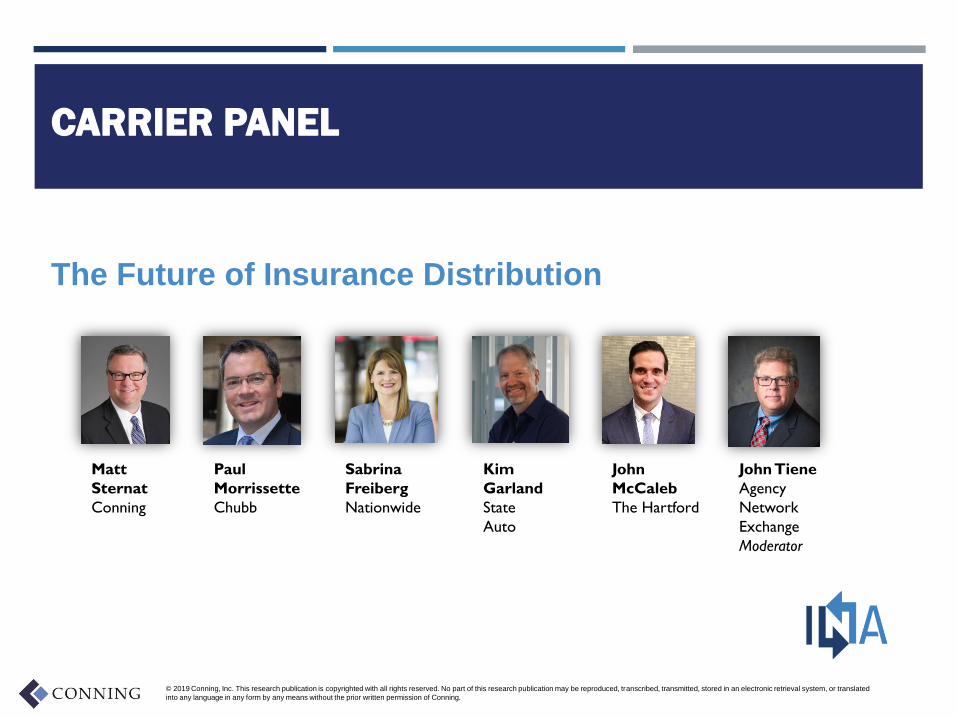
The Future of Insurance Distribution
Matt
Sternat
Conning
Paul
Morrissette
Chubb
Sabrina
Freiberg
Nationwide
Kim
Garland
State
Auto
John
McCaleb
The Hartford
John Tiene
Agency
Network
Exchange
Moderator
CARRIER PANEL
© 2019 Conning, Inc. This research publication is copyrighted with all rights reserved. No part of this research publication may be reproduced, transcribed, transmitted, stored in an electronic retrieval system, or translated
into any language in any form by any means without the prior written permission of Conning. 25
About Conning®
Conning (conning.com) is a leading investment management company for the global insurance industry. Conning is focused on the future,
supporting the insurance industry with innovative financial solutions, investment experience, and proprietary research. Conning’s unique
combination of investment solutions and asset management offerings, award winning risk modeling software, as well as insurance research,
helps clients achieve their financial goals through customized business and investment strategies. Founded in 1912, Conning has offices in
Boston, Cologne, Hartford, Hong Kong, London, New York, and Tokyo.
Insurance Research
Conning publishes a number of insurance industry research services, including its Insurance Segment Reports semiannual line-of-
business reviews; its Forecast & Analysis service, which offers a forward look at the industry; and its well-known Strategic Study series of
executive reports on key products and trends and issues of critical industry importance. All are available in print and online through our web-
based insurance research portal Conning Library (www.conninglibrary.com).
In addition to its published research, Conning offers proprietary research services to the insurance industry.
For more information on our insurance research services,
please call 888-707-1177 or visit www.conningresearch.com.
This presentation has been prepared for and distributed exclusively to specific clients and prospects of Conning. No part of the information
may be distributed, reproduced, transcribed, transmitted, stored in an electronic retrieval system or translated into any language in any form
by any means without the prior written permission of Conning. Statements and information in this report were compiled from sources that we
consider to be reliable or are expressions of our opinion. The presentation is not intended to be complete, and we do not guarantee its
accuracy. It does not constitute and must not be considered investment advice. Conning, Inc., Goodwin Capital Advisers, Inc., Conning
Investment Products, Inc., a FINRA-registered broker-dealer, Conning Asset Management Limited, Conning Asia Pacific Limited, and
Octagon Credit Investors, LLC, which are all direct or indirect subsidiaries of Conning Holdings Limited (collectively, “Conning”), which is one
of the family of companies owned by Cathay Financial Holding Co., Ltd., a Taiwan-based company.
The names of certain companies, products, and product brands, and the logos and images related thereto, are trademarks of their third-party
owners. They are used herein for illustrative and informational purposes only. Nothing herein implies sponsorship or endorsement of those
companies or products by Conning, or an endorsement by such trademark owners of Conning or its products and services.